Near-Infrared Imaging of White Dwarfs with Candidate Debris Disks
Abstract
We have carried out imaging of 12 white dwarf debris disk candidates from the WIRED SDSS DR7 catalog, aiming to confirm or rule out disks among these sources. On the basis of positional identification and the flux density spectra, we find that seven white dwarfs have excess infrared emission, but mostly at WISE W1 and W2 bands, four are due to nearby red objects consistent with background galaxies or very low mass dwarfs, and one exhibits excess emission at consistent with an unresolved L0 companion at the correct distance. While our photometry is not inconsistent with all seven excesses arising from disks, the stellar properties are distinct from the known population of debris disk white dwarfs, making the possibility questionable. In order to further investigate the nature of these infrared sources, warm Spitzer imaging is needed, which may help resolve galaxies from the white dwarfs and provide more accurate flux measurements.
Subject headings:
circumstellar matter — infrared: stars — white dwarfs1. INTRODUCTION
The discovery of the first circumstellar debris disk around a white dwarf (WD; G29-28) was made by Zuckerman & Becklin (1987) (see also Jura (2003); Reach et al. (2005)). Since then, thanks to Spitzer Space Telescope as well as large survey programs, over 20 WDs have been identified to have debris disks (see, e.g., von Hippel et al. 2007; Farihi et al. 2009; Xu & Jura 2012; Girven et al. 2012, and references therein). It is believed that such a debris disk is formed from material produced by tidal disruption of asteroids within the Roche radius of a WD (Graham et al., 1990; Jura, 2003), since planetary material is known to commonly exist around the progenitor stars of WDs and it has been suggested that part of the material can survive through late phases of stellar evolution (e.g., Debes & Sigurdsson 2002).
This picture has been supported by derived properties of several gaseous metal disks around isolated WDs (Gänsicke et al., 2006, 2007, 2008; Melis et al., 2012), detailed infrared studies of the debris-disk WD systems (e.g., Reach et al. 2005; von Hippel et al. 2007; Jura et al. 2007; Reach et al. 2009), and more common detections of absorption features of high-Z metals in WD spectra (Zuckerman et al. 2003; Klein et al. 2011 and references therein). The high-Z spectral features are considered as a result of the processes of asteroids disruption and subsequent WD accretion of high-Z material probably through a disk. The accreted material pollutes the expectedly “pure” hydrogen or helium atmosphere (Jura 2008), since the primordial metals within the atmospheres of WDs sink rapidly (Paquette et al., 1986). Therefore, one important application of the observational studies of the polluted WDs is that it can provide information about bulk elemental compositions of extrasolar planets (see, e.g., Zuckerman et al. 2007; Klein et al. 2011; Gänsicke et al. 2012).
The large survey of WD debris-disk systems is warranted as the resulting increased samples allow detailed studies of disk formation and accretion processes around WDs (Jura, 2008; Rafikov, 2011), and that of the disk properties and disk-existence frequency indicating the corresponding properties of planetary bodies (Girven et al., 2012; Barber et al., 2012). Recently, the Data Release 7 (DR7) WD catalogue from the Sloan Digital Sky Survey (SDSS), which contains nearly 20,000 sources, was released (Kleinman et al., 2013). Using the infrared all-sky data from the Wide field Infrared Survey Explorer (WISE), Debes et al. (2011) conducted a thorough search for infrared counterparts to WDs in the DR7 catalogue, and found 52 candidate debris disks (we name these sources ‘dxxxx’ in this paper) and 69 candidate counterparts with indeterminate infrared excess emission (which were defined such because both a debris disk and a brown-dwarf companion can explain their excess emission; these sources are named as ‘ixxxx’ in this paper). For the first and latter types of the counterparts, there are 32 and 54, respectively, that did not have detections at bands (basically in either 2MASS or UKIDSS survey). Since WISE imaging had a FWHM of 6″ (Wright et al., 2010), source confusion could cause mis-identification of excess emission. In order to identify the counterparts among these candidates and if identified, to provide more measurements for determining the debris-disk sources, we have carried out ground-based imaging of the candidates that did not have flux measurements. In this paper we report the results from our observations.


2. OBSERVATIONS AND DATA REDUCTION
2.1. Ground-based Imaging
We carried out observations with the 5.1-m Hale telescope at Palomar Observatory in the United States. Through the Chinese Telescope Access Program, we were awarded two nights in 2012 November and two half nights in 2013 February. Unfortunately, only the night of 2012 Nov. 27–28 was clear and useful data were taken. The instrument used was the Wide field IR Camera (WIRC; Wilson et al. 2003), which has a 20482048 pixel2 Hawaii-II HgCdTe detector. The pixel scale was 0249 pixel-1 and the field of view was 87.
For the 86 WDs we chose to observe, we used published results of their effective temperature and optical magnitudes to estimate their lower flux limits at bands (Debes et al. 2011; Kleinman et al. 2013; see also Table 1), assuming pure blackbody emission. Based on the estimated flux limits, exposure times at the bands for each target were estimated accordingly. Due to weather limitations, we observed only 12 WDs; the exposure times are given in Table 2. During each exposure, the telescope was dithered in a five-point grid with offsets of 40″ to obtain a measurement of the sky background. The observing conditions were mediocre, with the seeing having a median value of 09 but occasionally dropping to 15.
We used IRAF for our data reduction. The images were dark-subtracted and flat-field corrected. In addition a sky image was made by filtering out stars from each set of the dithered images in one exposure. The sky image was subtracted from the set of images, and then the sky-subtracted images were shifted and combined into one final image of a target field.
To calibrate our target images astrometrically, we used the in-field, relatively bright 2MASS stars (Skrutskie et al., 2006), the numbers of which were between eight and fifty, depending on the fields. The resulting nominal uncertainties of the calibrated images are in a range of 003–011. For most of our images, the uncertainties are dominated by the 2MASS systematic uncertainty of 015 (with respect to the International Celestial Reference System).
We used the IRAF aperture photometry package apphot to measure the brightnesses of our sources for most of the images. For a few cases that a target was resolved to have a nearby source, the PSF fitting package daophot was used. Flux calibration was conducted by comparing to bright 2MASS stars detected in our images.
2.2. WISE Imaging
Launched in 2009 December 14, WISE mapped the entire sky at 3.4, 4.6, 12, and 22 m (called W1, W2, W3, and W4 bands, respectively) in 2010 with FWHMs of 6.1″, 6.4″, 6.5″, and 12.0″ in the four bands, respectively (see Wright et al. 2010 for details). The WISE all-sky images and source catalogue were released in 2012 March. We downloaded the flux measurements of each target in the source catalogue and the WISE image data of each target field from the Infrared Processing and Analysis Center. Debes et al. (2011) provided all magnitudes or magnitude upper limits of the WISE candidate counterparts to the WD targets, but because they used the WISE preliminary catalogues, the values were slightly different from those in the all-sky source catalogue. We therefore re-provided the magnitudes or magnitude upper limits of our 12 WD targets from the all-sky source catalogue in Table 2.
3. RESULTS
3.1. Positional Identification
In our ground-based images, we detected all 12 targets, but we found that four of them were resolved as two sources at/near the WISE source position. The fields of the four WDs are shown in Figure 1. From our astrometry, we determined the counterparts based on the measured positions and they are marked as object in Figure 1. The nearby non-counterpart sources, which are 1″–2″ away from the counterparts, are marked as object . We also determined the positions and magnitudes of these nearby sources, and the values are given next to the counterparts in Table 2. For the other eight targets, one single source was clearly detected at or near the SDSS position. Among them i0004 was detected by the 2MASS survey, but because it had significant proper motion, and (our Palomar measurement with respect to that of 2MASS, which was made on 1998 Sept. 17), it was not reported to have the 2MASS detections (the positional criterion for candidate counterpart identification was 20 in Debes et al. 2011).
3.2. Flux Density Spectra
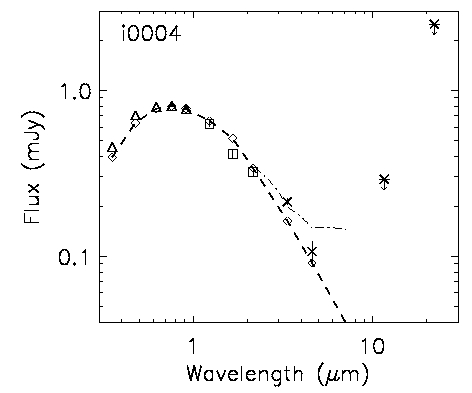
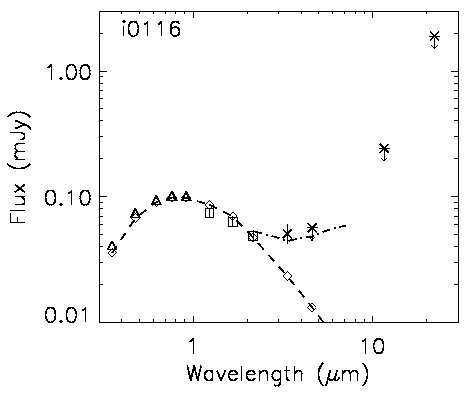
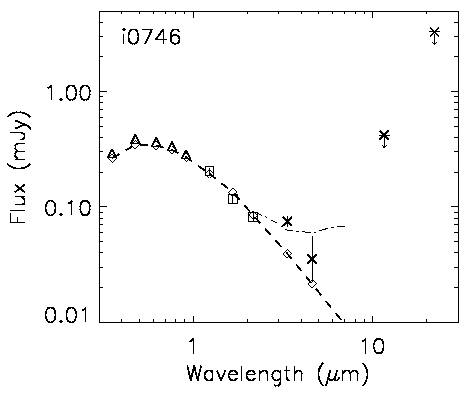
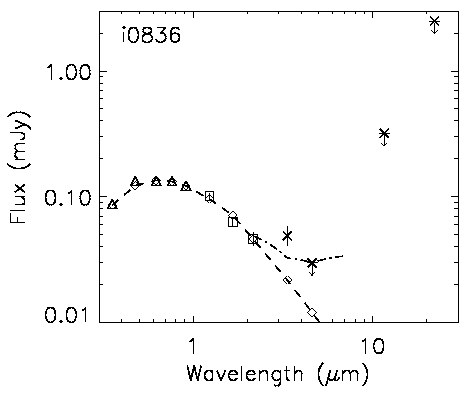
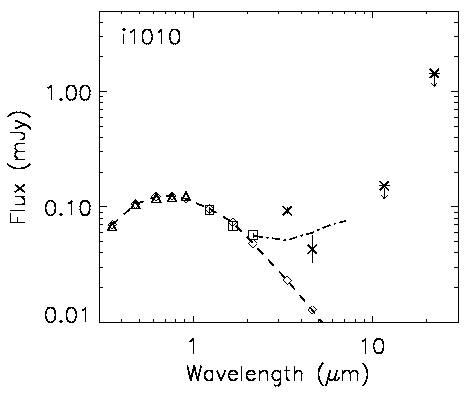
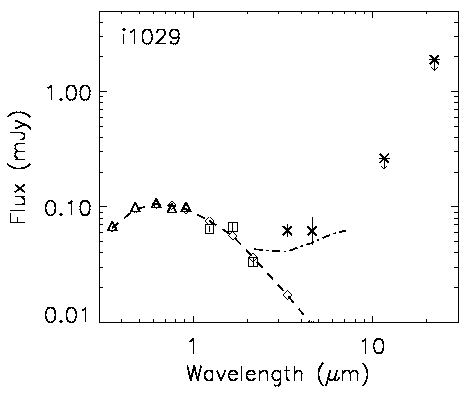
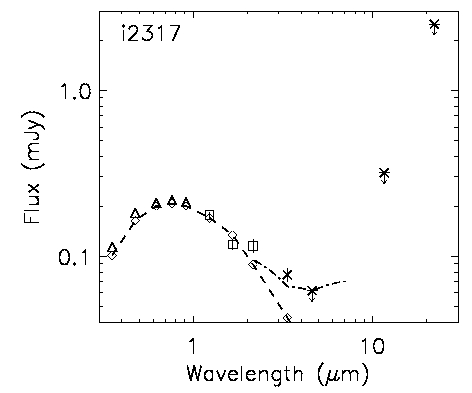
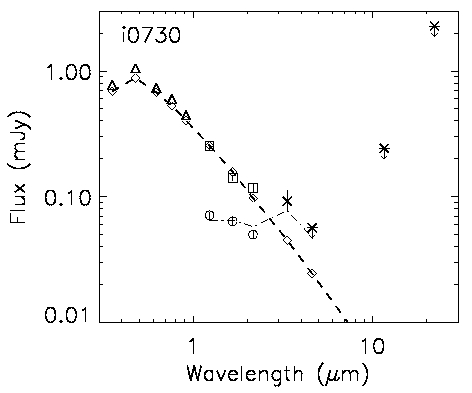
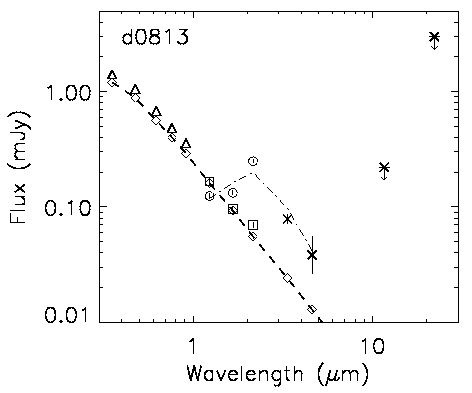
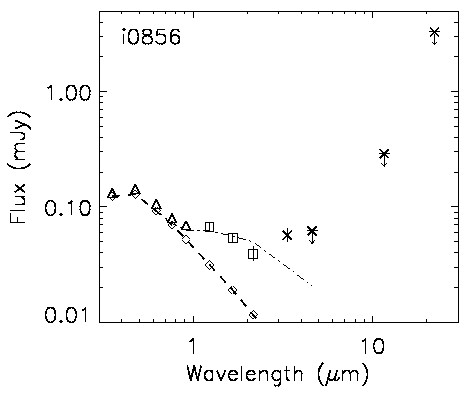
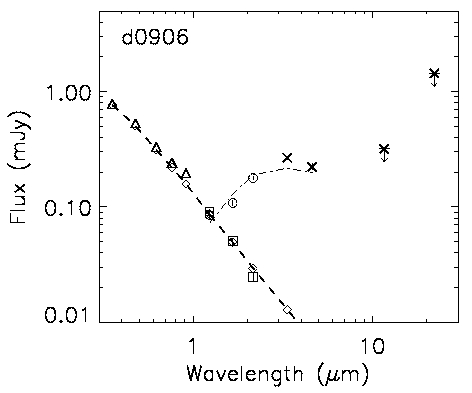
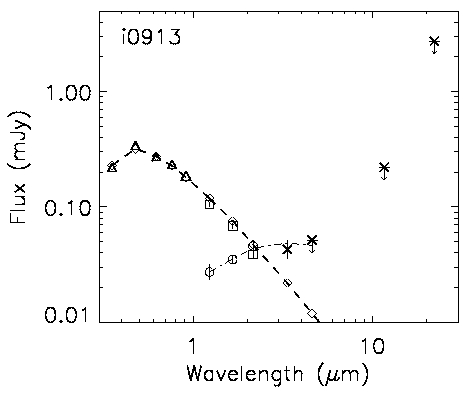
Combining SDSS flux measurements (Kleinman et al., 2013) and that from the WISE all-sky source catalogue with our measurements, we constructed the flux density spectra for the 12 WD targets. The spectra are shown in Figures 2 and 3. For the four WDs with a nearby source, the nearby sources are included correspondingly in the figure (displayed as circular data points). We compared our observational spectra with WD model spectra in the infrared bands (kindly provided by P. Bergeron), whose properties were determined by Kleinman et al. (2013) (see also Debes et al. 2011), and found that no significant excess emission at bands was detected for most of the WDs except i0856. For i0730, d0813, d0906 and i0913, the emission detected by WISE more likely came from their nearby source (see Section 4.2 below), and our observations excluded them as the WDs with excess infrared emission.
4. Discussion and Summary
We observed 12 WDs that were identified to have excess emission from the WISE survey by Debes et al. (2011) but did not have previous measurements. Given the excess emission, they have been suggested to either have a debris disk or a brown dwarf companion (Debes et al., 2011). From our observations, we found that seven of them did not have significant excess emission at bands, while i0856 had strong excess emission, consistent with fluxes measured at the SDSS bands. In addition four WDs were resolved to have a nearby source. Below including our results, we first discuss the possible origins for the excess emission from the WDs and for the resolved nearby sources, and then provide a summary for the discussion.
 |
 |
 |
 |
 |
 |
 |
 |
 |
 |
 |
 |
4.1. Candidate debris disk sources?
For the seven WDs without significant excess emission, they are not likely to have a very low-mass (VLM) star or a brown dwarf companion. For example, the magnitudes and their uncertainties are 15–18 and 0.1, respectively. The uncertainties only allow the possible existence of 10% excess emission or 2.5 mag fainter sources. Adding 2.5 mag to and comparing it to magnitudes, which are slightly lower than values (see Table 2), such infrared sources would have a color of 2.5 mag. The color is too red for VLM dwarfs (see Kirkpatrick et al. 2011 for the colors of the known VLM dwarfs).
With constraints from our measurements, we fit these sources with the debris disk model given by Jura (2003) to study if the excess emission could arise from a debris disk. In the model, the disk temperature follows , where is the effective temperature of a WD and the disk radius (Jura, 2003). We adopted the model parameters used in Debes et al. (2011), assuming a temperature of K at the inner edge of the debris disk and an outer disk radius of 80, where is the radius of a WD. The distance, effective temperature, and extinction of each WD target were fixed at the values given in Table 1 (Debes et al., 2011; Kleinman et al., 2013). The free parameter was the inclination angle of the disk. We fit , , and (or only and when there was no detection) fluxes, where was included to serve as the additional constraint (for i2317, which had excess emission, band flux was included too). We also required that the model flux at band must be lower than the WISE flux upper limit for the sources not detected at . We found that the excess emission from most of the sources is generally consistent with arising from a debris disk, and the resulting best-fit and values are summarized in Table 3. The best-fit model fluxes for each source are shown in Figure 2.
For i0836 and i2317, the requirement of the model for the flux lower than the WISE upper limit provided a constraint in the fitting. If this requirement is not considered, values would be much smaller. For i1010 and i1029, the values are quite large for . This is because their fluxes are significantly higher than their fluxes, and in order for the model to match the fluxes, the model fluxes were increased, thus inducing large values at band. We note that since the WISE magnitudes of the WDs are in a range of 15–17 and WISE photometry of such faint sources is known to have as large as 0.4 mag systematic uncertainty111see http://wise2.ipac.caltech.edu/docs/release/allsky/expsup/sec6_3c.html, the poor fitting can be caused by the large uncertainties on WISE photometry that are not included in the catalogue data. For the same reason, we did not further search for better fitting by varying the model parameters.
However for the WDs that show clear excess emission and are believed to have a debris disk, we know that: 1) they nearly all have effective temperatures in a range of 9,500–24,000 K (except G 16658 for its K; Farihi et al. 2008), 2) they nearly all are known to be metal-rich from optical spectroscopy (Xu & Jura, 2012), and 3) nearly half of them show significant emission excesses at infrared -band relative to their WD model spectra. These properties make the identification of the seven WDs as candidates with debris disks highly questionable. The seven WDs generally do not fit in any of them (Tables 1 & 3; Debes et al. 2011).
4.2. Candidate brown dwarf sources?
Since WISE imaging had relatively low spatial resolution, it can not be determined solely based on the positions whether or not the WISE sources are the counterparts to the nearby sources of i0730, d0813, d0906, and i0913 (object in Figure 1). Combining our measurements with the WISE fluxes, as shown in Figure 3, the overall broad-band spectra suggest that the WISE sources are the counterparts to the four nearby sources, or at least emission from the nearby sources dominated over that from the four WDs (otherwise these nearby sources would have to have an unlikely, large flux decrease from to ). Since the sources are red and three of them (nearby to ixxxx sources) were classified by Debes et al. (2011) to be possible candidate brown dwarfs, we fit their broad-band spectra with that of VLM stars and brown dwarfs. Following Debes et al. (2011), we used the empirical spectra for M, L, and T dwarfs (Hawley et al., 2002; Kirkpatrick et al., 2011). We first fixed the distances at the values of the WDs, and found that the resulting were large (the values and the best-fit spectral types are given in column four and three, respectively, of Table 4). Setting the distance as a free parameter, the best-fit can be significantly reduced (see the values at column seven of Table 4). Therefore, if the sources are M or L dwarfs, as identified from our fitting, they are most likely not associated with the WDs. The best-fit spectra of the four sources are shown in Figure 3.
In addition for i0856, since it had significant excess emission starting from the optical to bands comparing to the WD model spectrum, the debris-disk model we used, which assumed a low-temperature disk, could not provide a reasonably well fit. We thus tested with the VLM dwarf models, and found that an L0 dwarf at the WD’s distance of 428 pc can generally describe the excess emission except at the band (Figure 3). Here again given the large uncertainties on the WISE measurements of faint sources, we considered the fitting was acceptable although the reduced is (Table 4).
4.3. Background galaxies?
The WD targets are located away from the Galactic plane having clean source fields according to the SDSS optical and our images. However, it has been shown from Spitzer imaging that at mag in the wavelength range of 3–10 m, galaxies dominate in such regions (Fazio et al., 2004). For example as our WD targets have magnitudes in a range of 15–17 mag, at its middle value of 16 mag, the Spitzer galaxy count at 3.6 m was 2300 mag-1 deg-2 (Fazio et al., 2004) or 1.8 mag-1 arcsec-2. Considering the 2″ radius circular region, which was used by Debes et al. (2011) for searching for WD counterparts, there will be a chance of 0.23% to randomly find at least one 16 mag galaxy in such a region. The percentage is low but there were nearly 18,000 times searches (for 17,955 unique and valid targets; Debes et al. 2011), which would result in 40 randomly-detected galaxies. Approximately 300 WDs per mag were detected at mag, but excluding 23% naked WDs (detection of WD photosphere only) and 67% candidate WD plus M dwarf binaries (Debes et al., 2011), the latter we consider rather certain due to their brightnesses and colors, only 30 per mag would be either debris-disk or brown-dwarf companion systems among the candidates. The numbers thus suggest that the detected excess emission is likely caused by unresolved background galaxies due to WISE’s relatively low spatial resolution and those nearby sources are also likely galaxies.
4.4. Summary
Among the 12 WD targets identified with excess emission from the WISE data, our observations and analysis show that seven are consistent with having a debris disk, but their properties are not in the likely range for the detectable disks on the basis of the currently known debris-disk WDs. Among the other five WD targets, four are found that their excess emission is caused by the existence of a nearby red source and the remaining one, i0856, shows significant excess emission at bands. Our analysis suggests that the nearby sources are possibly unassociated VLM stars or brown dwarfs while excess emission from i0856 is suggestive of an L0 dwarf. However, we also realize that the excess emission (and the nearby sources) might well be caused by background galaxies, which are known to be the dominant, relatively faint sources at wavelengths between 3–10 m. Therefore, in order to investigate the true nature of the observed excess emission or nearby sources, imaging with Spitzer is needed. The Spitzer observations will possibly resolve background galaxies from the WD targets and provide accurate flux measurements at the infrared wavelengths of and bands, both helping identify the debris disks and VLM dwarfs.
References
- Barber et al. (2012) Barber, S. D., Patterson, A. J., Kilic, M., Leggett, S. K., Dufour, P., Bloom, J. S., & Starr, D. L. 2012, ApJ, 760, 26
- Debes et al. (2011) Debes, J. H., Hoard, D. W., Wachter, S., Leisawitz, D. T., & Cohen, M. 2011, ApJS, 197, 38
- Debes & Sigurdsson (2002) Debes, J. H., & Sigurdsson, S. 2002, ApJ, 572, 556
- Farihi et al. (2009) Farihi, J., Jura, M., & Zuckerman, B. 2009, ApJ, 694, 805
- Farihi et al. (2008) Farihi, J., Zuckerman, B., & Becklin, E. E. 2008, ApJ, 674, 431
- Fazio et al. (2004) Fazio, G. G., Ashby, M. L. N., Barmby, P., et al. 2004, ApJS, 154, 39
- Gänsicke et al. (2012) Gänsicke, B. T., Koester, D., Farihi, J., Girven, J., Parsons, S. G., & Breedt, E. 2012, MNRAS, 424, 333
- Gänsicke et al. (2008) Gänsicke, B. T., Koester, D., Marsh, T. R., Rebassa-Mansergas, A., & Southworth, J. 2008, MNRAS, 391, L103
- Gänsicke et al. (2007) Gänsicke, B. T., Marsh, T. R., & Southworth, J. 2007, MNRAS, 380, L35
- Gänsicke et al. (2006) Gänsicke, B. T., Marsh, T. R., Southworth, J., & Rebassa-Mansergas, A. 2006, Science, 314, 1908
- Girven et al. (2012) Girven, J., Brinkworth, C. S., Farihi, J., Gänsicke, B. T., Hoard, D. W., Marsh, T. R., & Koester, D. 2012, ApJ, 749, 154
- Graham et al. (1990) Graham, J. R., Matthews, K., Neugebauer, G., & Soifer, B. T. 1990, ApJ, 357, 216
- Hawley et al. (2002) Hawley, S. L., et al. 2002, AJ, 123, 3409
- Jura (2003) Jura, M. 2003, ApJ, 584, L91
- Jura (2008) —. 2008, AJ, 135, 1785
- Jura et al. (2007) Jura, M., Farihi, J., Zuckerman, B., & Becklin, E. E. 2007, AJ, 133, 1927
- Kirkpatrick et al. (2011) Kirkpatrick, J. D., et al. 2011, ApJS, 197, 19
- Klein et al. (2011) Klein, B., Jura, M., Koester, D., & Zuckerman, B. 2011, ApJ, 741, 64
- Kleinman et al. (2013) Kleinman, S. J., et al. 2013, ApJS, 204, 5
- Melis et al. (2012) Melis, C., et al. 2012, ApJ, 751, L4
- Paquette et al. (1986) Paquette, C., Pelletier, C., Fontaine, G., & Michaud, G. 1986, ApJS, 61, 197
- Rafikov (2011) Rafikov, R. R. 2011, ApJ, 732, L3
- Reach et al. (2005) Reach, W. T., Kuchner, M. J., von Hippel, T., Burrows, A., Mullally, F., Kilic, M., & Winget, D. E. 2005, ApJ, 635, L161
- Reach et al. (2009) Reach, W. T., Lisse, C., von Hippel, T., & Mullally, F. 2009, ApJ, 693, 697
- Skrutskie et al. (2006) Skrutskie, M. F., et al. 2006, AJ, 131, 1163
- von Hippel et al. (2007) von Hippel, T., Kuchner, M. J., Kilic, M., Mullally, F., & Reach, W. T. 2007, ApJ, 662, 544
- Wilson et al. (2003) Wilson, J. C., et al. 2003, in Society of Photo-Optical Instrumentation Engineers (SPIE) Conference Series, Vol. 4841, Society of Photo-Optical Instrumentation Engineers (SPIE) Conference Series, ed. M. Iye & A. F. M. Moorwood, 451–458
- Wright et al. (2010) Wright, E. L., et al. 2010, AJ, 140, 1868
- Xu & Jura (2012) Xu, S., & Jura, M. 2012, ApJ, 745, 88
- Zuckerman & Becklin (1987) Zuckerman, B., & Becklin, E. E. 1987, Nature, 330, 138
- Zuckerman et al. (2007) Zuckerman, B., Koester, D., Melis, C., Hansen, B. M., & Jura, M. 2007, ApJ, 671, 872
- Zuckerman et al. (2003) Zuckerman, B., Koester, D., Reid, I. N., & Hünsch, M. 2003, ApJ, 596, 477
| Name | (K) | aa is in units of cm s-2. | (pc) | ||||||
|---|---|---|---|---|---|---|---|---|---|
| i000410.42034008.6 | 17.46 | 16.93 | 16.76 | 16.72 | 16.74 | 6887 | 7.71 | 0.15 | 51 |
| i011616.95094347.9 | 20.09 | 19.39 | 19.08 | 18.97 | 18.95 | 6309 | 8.06 | 0.16 | 104 |
| i073018.36411320.4 | 17.03 | 16.61 | 16.92 | 17.10 | 17.38 | 15126 | 7.83 | 0.26 | 133 |
| i074631.42173448.2 | 17.93 | 17.57 | 17.59 | 17.66 | 17.82 | 9282 | 8.59 | 0.14 | 66 |
| d081308.52480642.3 | 16.30 | 16.54 | 16.97 | 17.30 | 17.60 | 32727 | 7.86 | 0.20 | 279 |
| i083633.00374259.4 | 19.21 | 18.71 | 18.67 | 18.66 | 18.73 | 7798 | 8.11 | 0.12 | 116 |
| i085650.58275118.0 | 18.76 | 18.63 | 18.92 | 19.21 | 19.35 | 19333 | 7.86 | 0.12 | 428 |
| d090611.00414114.3 | 16.73 | 17.14 | 17.64 | 17.97 | 18.19 | 47637 | 7.91 | 0.05 | 469 |
| i091312.74403628.8 | 18.14 | 17.64 | 17.86 | 18.02 | 18.25 | 11726 | 8.02 | 0.07 | 153 |
| i101007.89615515.7 | 19.38 | 18.89 | 18.73 | 18.71 | 18.68 | 7252 | 8.31 | 0.04 | 94 |
| i102915.97300251.6 | 19.42 | 18.98 | 18.88 | 18.97 | 18.93 | 7755 | 7.86 | 0.08 | 153 |
| i231725.29084032.9 | 18.94 | 18.38 | 18.19 | 18.13 | 18.14 | 6862 | 7.34 | 0.13 | 124 |
| Name | Filter | Filter | Filter | W1 | W2 | W3 | W4 | |||
|---|---|---|---|---|---|---|---|---|---|---|
| i000410.42034008.6 | 0.27 | 16.05 | 0.27 | 16.010.07 | 0.27 | 15.800.07 | 15.400.05 | 15.510.2 | 12.5 | 8.8 |
| i011616.95094347.9 | 5.0 | 18.380.09 | 5.0 | 18.050.10 | 5.0 | 17.860.11 | 17.00.2 | 16.2 | 12.7 | 9.1 |
| i073018.36411320.4 | 0.83 | 17.070.04 | 1.7 | 17.200.06 | 2.5 | 16.910.08 | 16.30.2 | 16.2 | 12.7 | 8.9 |
| 073018.20411320.4ccNearby stars that are marked as object in Figure 1, with their names giving the positions measured by our near-infrared imaging. | 18.440.06 | 18.060.08 | 17.840.07 | |||||||
| i074631.42173448.2 | 1.3 | 17.260.05 | 1.7 | 17.370.08 | 2.5 | 17.290.09 | 16.50.1 | 16.70.5 | 12.1 | 8.5 |
| d081308.52480642.3 | 1.3 | 17.500.04 | 2.5 | 17.600.06 | 5.0 | 17.470.06 | 16.50.1 | 16.60.4 | 12.8 | 8.6 |
| 081308.61480643.4ccNearby stars that are marked as object in Figure 1, with their names giving the positions measured by our near-infrared imaging. | 17.820.06 | 17.250.05 | 16.090.04 | |||||||
| i083633.00374259.4 | 2.5 | 18.030.06 | 5.0 | 18.050.08 | 10 | 17.920.13 | 17.00.2 | 17.0 | 12.4 | 8.8 |
| i085650.58275118.0 | 7.2 | 18.270.09 | 16.2 | 18.300.09 | 27 | 18.410.16 | 16.80.2 | 16.2 | 12.5 | 8.5 |
| d090611.00414114.3 | 2.5 | 18.120.05 | 5.0 | 18.280.07 | 7.5 | 18.590.09 | 15.150.04 | 14.710.07 | 12.4 | 9.4 |
| 090611.09414115.1ccNearby stars that are marked as object in Figure 1, with their names giving the positions measured by our near-infrared imaging. | 18.200.05 | 17.450.05 | 16.440.04 | |||||||
| i091312.74403628.8 | 2.5 | 17.970.05 | 2.5 | 17.950.06 | 5.0 | 18.100.09 | 17.10.2 | 16.3 | 12.8 | 8.7 |
| 091312.73403631.3ccNearby stars that are marked as object in Figure 1, with their names giving the positions measured by our near-infrared imaging. | 19.440.16 | 18.680.07 | 17.920.08 | |||||||
| i101007.89615515.7 | 2.5 | 18.090.07 | 5.0 | 17.950.08 | 5.0 | 17.680.05 | 16.340.07 | 16.50.3 | 13.2 | 9.4 |
| i102915.97300251.6 | 5.0 | 18.510.06 | 5.0 | 17.970.10 | 7.5 | 18.270.10 | 16.70.1 | 16.10.3 | 12.6 | 9.1 |
| i231725.29084032.9 | 3.3 | 17.420.05 | 3.3 | 17.370.08 | 2.5 | 16.920.10 | 16.50.1 | 16.1 | 12.4 | 8.8 |
| Name | /DoF | |
|---|---|---|
| i0004 | 0.18 | 7.5/2 |
| i0116 | 0.93 | 1.1/1 |
| i0746 | 0.32 | 1.5/2 |
| i0836 | 0.30 | 7.4/1 |
| i1010 | 1.0 | 46/2 |
| i1029 | 1.0 | 20/2 |
| i2317 | 0.46 | 11/2 |
| Name | aaExposure time at each band is in units of minute. (pc) | Spectral Type | DoF | bbFor WISE measurements, magnitudes without uncertainties are upper limits. (pc) | Spectral Type | DoF |
|---|---|---|---|---|---|---|
| i0730B | 133 | L4 | 170/4 | 457 | M6 | 9.1/3 |
| d0813B | 279 | M6 | 176/4 | 166 | L0 | 59/3 |
| i0856 | 428 | L0 | 97/6 | |||
| d0906B | 469 | M5 | 706/4 | 110 | L5 | 52/3 |
| i0913B | 153 | L6 | 28/3 | 87 | L9 | 0.85/2 |