Current address:]University of Iowa, Iowa City, IA 52242 Current address:]Indiana University, Bloomington, Indiana 47405
CLAS Collaboration
First Observation of the Line Shape in Electroproduction
Abstract
We report the first observation of the line shape of the from electroproduction, and show that it is not a simple Breit-Wigner resonance. Electroproduction of off the proton was studied by using data from CLAS at Jefferson Lab in the range (GeV/c)2. The analysis utilized the decay channels of the and of the . Neither the standard (PDG) resonance parameters, nor free parameters fitting to a single Breit-Wigner resonance represent the line shape. In our fits, the line shape corresponds approximately to predictions of a two-pole meson-baryon picture of the , with a lower mass pole near 1368 MeV/c2 and a higher mass pole near 1423 MeV/c2. Furthermore, with increasing photon virtuality the mass distribution shifts toward the higher mass pole.
pacs:
13.40.-f, 13.30.Eg, 14.20.Jn, 14.20.GkI introduction
The continued study of excited baryons is needed to refine our knowledge of QCD. Probing states with peculiar properties is of particular interest toward this goal. One such object is the , which has the quantum numbers , mass MeV/c2, and full width MeV/c2 according to the Particle Data Group (PDG) (Beringer et al., 2012). It was first predicted by Dalitz and Tuan (1959, 1960) as a quasi-bound state that decays to , and was first observed by Alston et al. (1961) in 1961.
A quark model for the spectrum of baryons with a non-relativistic harmonic oscillator potential and spin-spin hyperfine interaction between the quarks was proposed by Isgur and Karl (1977, 1978, 1979). This model reproduced all the observed -wave negative parity resonances well, except for the . The mass of the was predicted around 1490 MeV/c2, leaving a discrepancy of about 80 MeV/c2. The model was extended to include relativistic dynamics by Capstick and Isgur (1986) but this mass discrepancy remained. Following an earlier paper by Oller and Meißner (2001), Jido et al. (2003) used a chiral unitary formalism to describe the as a composite of two dynamically generated poles, at GeV/c2 and GeV/c2. Hence the key conclusion of this approach is that the mass distribution, or “line shape” of the is formed by two poles in the complex energy plane instead of one resonance. The higher mass pole couples more strongly to , while the lower mass pole couples more strongly to . Furthermore, the line shape is expected to depend upon which reaction channel excites it. For a recent review of the extensive literature on baryonic systems within the chiral unitary framework, see Ref. Hyodo and Jido (2012). There are several other detailed predictions for the parameters that characterize the poles making up the mass region, for example Refs. Ikeda et al. (2011, 2012); Guo and Oller (2013); Mai and Meissner (2013); Khemchandani et al. (2011). One finds that theory is not in agreement about where these poles sit.
The most extensive experimental study of the mass region used real photoproduction with data from CLAS/JLab Moriya et al. (2013); Schumacher and Moriya (2013) and also LEPS/SPring-8 Ahn et al. (2003); Niiyama et al. (2008). Support for a strongly distorted line shape was found, possibly consistent with two poles, as well as evidence for interference with components of the reaction mechanism. Further recent results came from collisions at HADES/GSI Agakishiev et al. (2012) and COSY/Jülich Zychor et al. (2008). Low-statistics bubble-chamber hadronic beam data exist for Hemingway (1985), Braun et al. (1977), and Thomas et al. (1973) reactions. Each case seems to show variations in the mass distribution of the . To date there is no theoretical work giving any prediction for electroproduction of the . The line shape seen in electroproduction could reveal features not seen in other production channels. The virtual photon exchanged in electroproduction () may couple differently to the than the real photon (). Therefore the present study represents an exploration of an unknown corner of phenomenology.
electro \fmfframe(1,7)(1,7) {fmfgraph*}(210,162) \fmflefti2,i1 \fmfrighto5,o4,o3,o2,o1 \fmflabeli1 \fmflabeli2 \fmflabelo1 \fmflabelo2 \fmflabelo3 \fmflabelo4 \fmflabelo5 \fmffermioni1,v1,o1 \fmffermionv2,o2 \fmffermioni2,v3 \fmffermionv4,o3 \fmffermionv5,o4 \fmffermionv5,o5 \fmfphoton,label=v1,v2 \fmfplain,label=v2,v3 \fmfdouble,label=,l.side=leftv3,v4 \fmfdouble,label=,l.side=rightv4,v5 \fmfdotv3,v4,v5 \fmfforce0.3w,0.9hv1 \fmfforce0.4w,0.6hv2 \fmfforce0.4w,0.3hv3 \fmfforce0.65w,0.3hv4 \fmfforce0.8w,0.2hv5
Figure 1 shows the presumed main contribution to the electroproduction. Normally, -nucleon scattering cannot produce this state since it lies below threshold. However, the off-shell nature of the exchanged strange meson allows the reaction to proceed. The electron scattering process is characterized by the four-momentum transfer , but this is one step removed from the four-momentum of the exchanged kaon, . At our kinematics covers the range from 0.5 to 4.5 (GeV/c)2.
This work analyzed data from the “e1f” run in Hall B at Jefferson Lab collected using the CLAS spectrometer Mecking et al. (2003). It utilized a 5.5 GeV electron beam and a liquid hydrogen target. The decays solely to according to the PDG (Beringer et al., 2012). The decay channel used in this analysis was for the (1405) and for the . Therefore, the final detected particles were the scattered electron and the , , and , while a was missing for the exclusive electroproduction of the . Thus, events with exactly these four charged particles were selected.
II data analysis
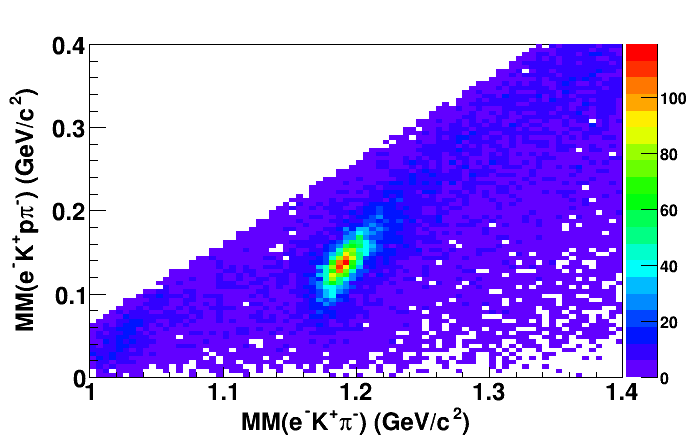
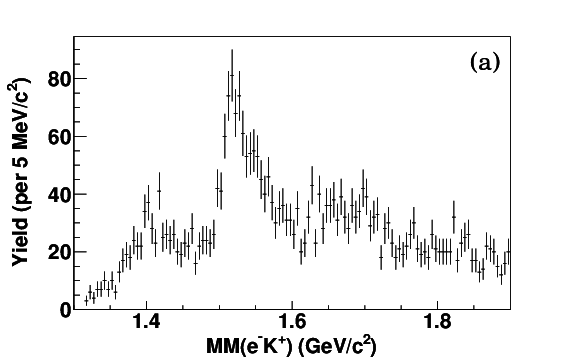
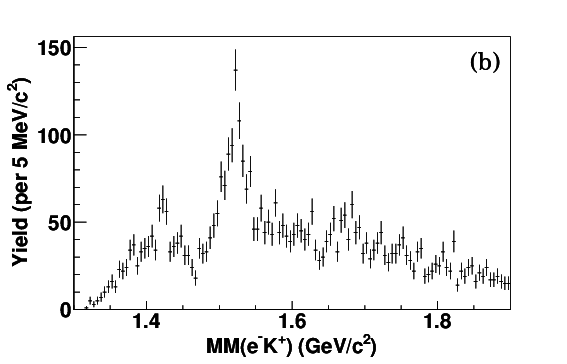
The missing mass of versus the missing mass of is shown in Fig. 2. The missing ’s and ’s are clearly seen near the center of Fig. 2. A selection was made by requiring the missing mass of between 0.05 and 0.25 GeV/c2 and the missing mass of to lie between 1.140 and 1.240 GeV/c2. The range of significance, after the selection, was from 1.0 to 3.0 (GeV/c)2. The hyperon mass spectrum that results from computing the missing mass from the pair is shown in Fig. 3. Two ranges of are shown, from 1.0 to 1.5 (GeV/c)2 in Fig. 3LABEL:sub@fig:Yield_lowQ2, and from 1.5 to 3.0 (GeV/c)2 in Fig. 3LABEL:sub@fig:Yield_highQ2. No acceptance correction or background subtraction have been made at this stage. A bump in the region and the peak are clearly visible.
The background is mostly from non-resonant electroproduction of and resonant , where the decays into and . These background reaction channels were simulated using the CLAS standard simulation package GSIM based on GEANT CERN_CN Division (1993). Events were generated according to a phase space distribution. The invariant mass of and was fitted with simulations of the two background channels. The total fit to the data set, with contributions from and , is shown in Fig. 4. The background contribution to the combined simulated background channels was determined from this fit. This fixed ratio was used in subsequent fits to the line shapes in the hyperon mass region of interest.

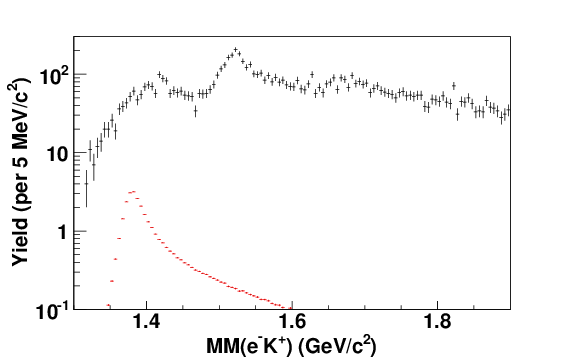
A third production channel leading to the same final state particles is electroproduction of decaying to . This contamination was measured by extracting the yield of the decaying through its dominant channel (branching fraction 88%). This yield was rescaled to decay (6%) and modified by the computed respective acceptances. The contamination from (1385) was thereby measured to be smaller than the statistical fluctuation in each bin and therefore negligible. The estimated yield of and the measured yield of are shown in Fig. 5. The histogram has a logarithmic scale to make the estimated yield visible.
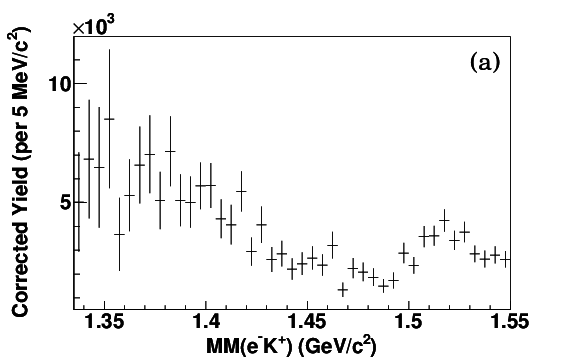
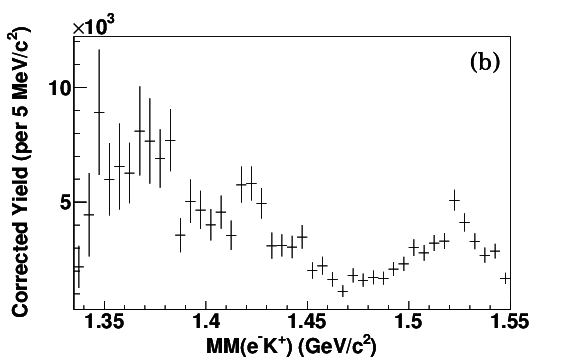
The acceptance correction was performed using the simulation of non-resonant three-body phase space . The generated and accepted events were binned in a four dimensional space of the independent kinematic variables, namely (1.0 to 3.0 (GeV/c)2), (1.5 to 3.5 GeV), the missing mass of , and cosine of the kaon angle in the center-of-mass frame of . Another kinematic variable , which is the angle between the production plane characterized by and the scattering plane characterized by the scattered , was not binned. This amounts to the assumption that and , the longitudinal-transverse and transverse-transverse interference structure functions, are small in this reaction. The dependence on this distribution was studied and the systematic uncertainties were obtained as follows. The phase-space generated Monte-Carlo events already match the measured data distributions in , , and particle momenta well. Furthermore, an improved matching to data was achieved by selecting events in missing mass and to tailor the Monte-Carlo distributions used in computing the acceptance. An acceptance factor was calculated bin by bin in order to reduce bin-averaging effects. The corrected hyperon yield is shown in Fig. 6, where Fig. 6LABEL:sub@fig:accYield_lowQ2 is for from 1.0 to 1.5 (GeV/c)2 and Fig. 6LABEL:sub@fig:accYield_highQ2 for from 1.5 to 3.0 (GeV/c)2. The statistics in these two regions are comparable. The rightmost peak in both figures is the . A peak around 1.42 GeV/c2 and another broader peak at the lower invariant mass in Fig. 6LABEL:sub@fig:accYield_highQ2 are not consistent with the PDG values for the Beringer et al. (2012). However, neither peak is seen clearly in the lower range (Fig. 6LABEL:sub@fig:accYield_lowQ2).
III results
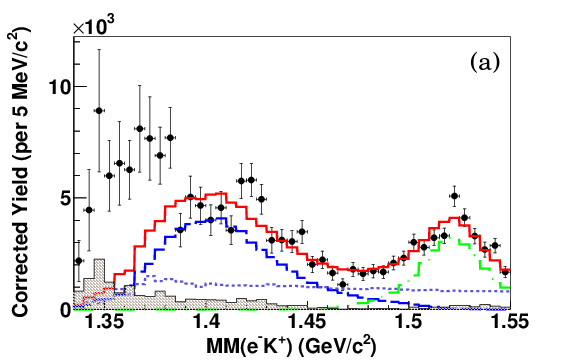
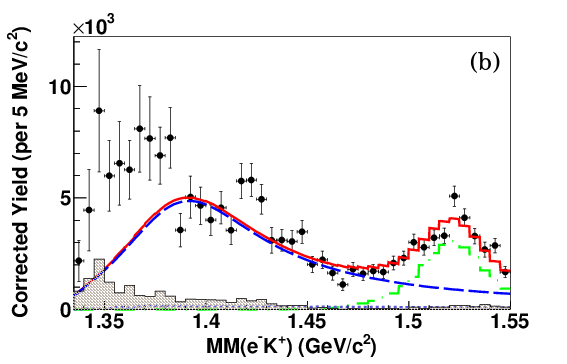
The higher range distribution from Fig. 6LABEL:sub@fig:accYield_highQ2 was fitted with the simulated background, the and various assumptions about the . The results are shown in Fig. 7. The black points with error bars are the acceptance-corrected results. The shadowed histograms along the bottom show the estimated systematic uncertainty in each mass bin. The systematic band was obtained by varying the selection of events (see Fig. 2), the acceptance distribution in , and the acceptance in the hyperon invariant mass line shape (missing mass of ). Correlation between systematic uncertainties and statistical fluctuations happens very often in low-statistics experiments. This appears clearly in the lower invariant mass region. An empirical smoothing process to separate the fluctuations from the estimated systematic uncertainties was implemented. Quantitatively, the systematic uncertainties were obtained from the following three analysis variations.
-
1.
The range of the event selection was narrowed to between 1.155 and 1.225 GeV/c2 around the and to between 0.06 and 0.24 GeV/c2 around the . The resulting variations in yields were smoothed by fitting the relative uncertainties to an empirical smoothing function in the lower invariant mass region. The resulting uncertainties were less correlated to the statistical fluctuation and closer to the pure systematic uncertainties. This contributed about 45% to the total bin-to-bin systematic uncertainty.
-
2.
The phase-space Monte-Carlo distribution of events in matched the data fairly well. But an exact matching was enforced by accepting Monte-Carlo events selectively. A similar smoothing process was applied to the differences of acceptance-corrected yields between a uniform phase-space distribution and the matching distribution. The resulting differences contributed about 35% to the total systematic uncertainty.
-
3.
The phase-space Monte-Carlo line shape of the hyperon invariant mass was modified to match exactly the observed line shape. The differences between the phase space distribution and the distribution that was closely matched to measured data were smoothed by averaging the neighboring bins. This systematic difference contributed about 20% to the total bin-to-bin systematic uncertainty.
The overall systematic bin-to-bin uncertainty shown in Fig. 7 was achieved by adding all pieces together in quadrature. The relative changes in strength between the observed peaks and the distortions of the peak shape due to radiative effects are small in comparison to the precision of these results. Hence radiative corrections were not performed.
In Fig. 7 the resonances are computed as incoherent relativistic Breit-Wigner functions of the form
| (1) |
In Eq. 1, , , and are fit parameters, is the momentum of in the hyperon rest frame, and is value of the when .
As seen in Fig. 7LABEL:sub@fig:pdg_highQ2, a fit using a single Breit-Wigner line shape with PDG parameters gives a very poor representation of the data. The fit includes the summed background contribution, simulation of electroproduction, and simulation of a Breit-Wigner “resonance” parametrized with the PDG values of the . In Fig. 7LABEL:sub@fig:onepole_highQ2, an alternative fit released these parameters from their PDG values. Also in this case, the freely-fitted Breit-Wigner is a poor fit to the data. In Fig. 7LABEL:sub@fig:twopole_highQ2, we allowed the to be represented as two incoherent Breit-Wigner peaks. The best fit result gives the two peak positions at GeV/c2 and GeV/c2, where the uncertainties include only the fit errors. This fit is clearly superior to the other two. The best-fit per degree of freedom was 1.31 (Fig. 7LABEL:sub@fig:twopole_highQ2) compared to 3.12 (Fig. 7LABEL:sub@fig:pdg_highQ2) and 2.97 (Fig. 7LABEL:sub@fig:onepole_highQ2), respectively. A fit with two coherent Breit-Wigner line shapes was also tested, resulting in a per degree of freedom 1.43, similar to the best fit and qualitatively the same.
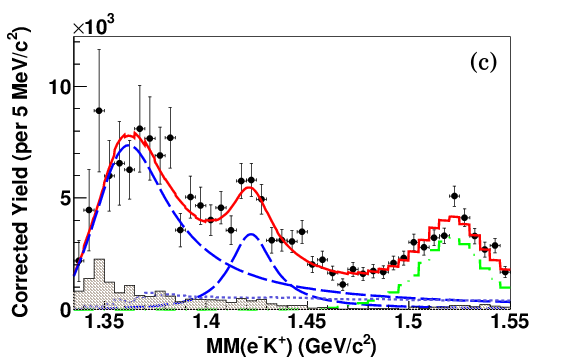
Next, the acceptance-corrected yield was produced for seven ranges, where the upper limit was fixed at 3.0 (GeV/c)2 and the lower limits were changed in steps from 1.0 to 2.2 (GeV/c)2, as shown in Fig. 8. Figure 8LABEL:sub@fig:TwoResonance_10-30 shows the data for (GeV/c)2 and Fig. 8LABEL:sub@fig:TwoResonance_22-30 for (GeV/c)2. The histograms were fitted with two relativistic incoherent Breit-Wigner functions, allowing only the amplitudes to vary from range to range, while the centroids and widths were common to all. This combined fit extracted the two peak positions GeV/c2, and GeV/c2, with a per degree of freedom of 1.44. These values are consistent with the fit in Fig. 7LABEL:sub@fig:twopole_highQ2, though we note that the error bars in this overall fit are correlated. It can be seen that the relative strength of the Breit-Wigner centered at is increasing with increasing compared to the one centered at , while staying comparable in strength to the . This variation in relative strength with increasing is reminiscent of the expectation in chiral unitary models that coupling to the two poles should depend on the coupling to the initial state. However, no model has attacked the question of whether such a variation can be related to the of a virtual photon.
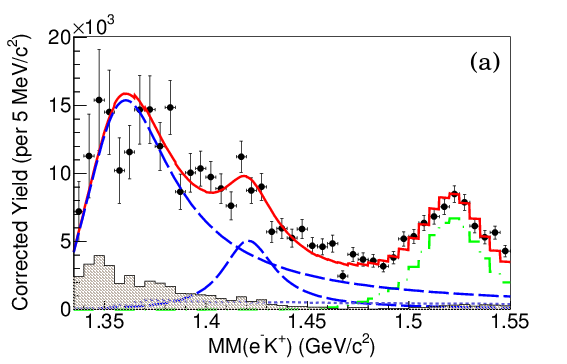
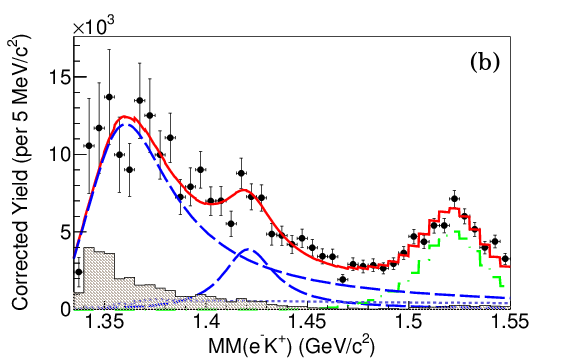
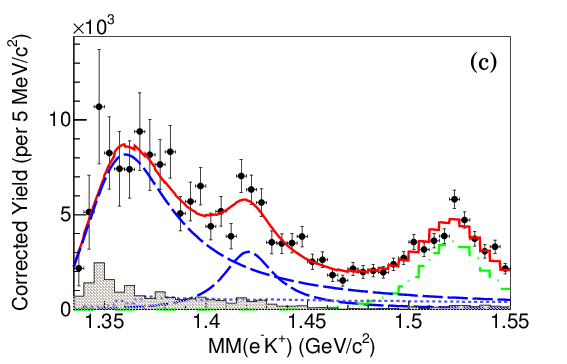
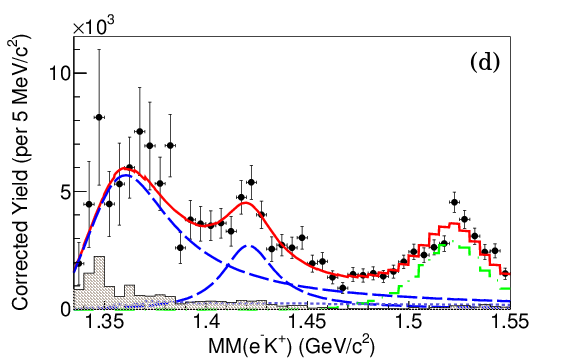
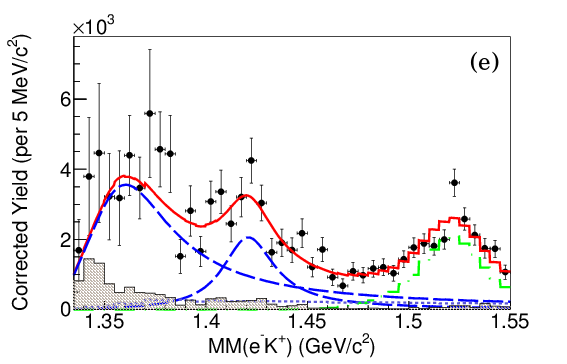
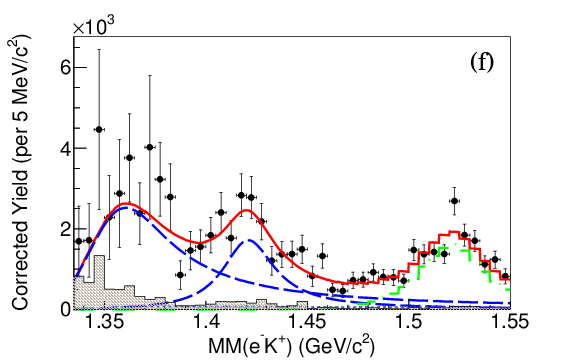
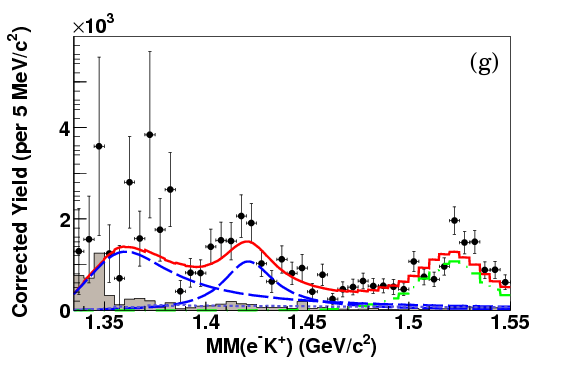
The stability of these fits was tested by first adding and then subtracting the systematic uncertainty (shadowed histograms) from the corrected yields. The fits were repeated on the modified yield distributions. The fit with two incoherent Breit-Wigner functions still showed the best result in terms of reduced . This shows that the two-pole interpretation of our data remains the best, given the estimated systematic uncertainties.
IV discussion and conclusions
The acceptance-corrected spectrum is qualitatively similar to an early result from a bubble chamber experiment by Braun et al. (1977) for the reaction . Jido et al. (2009) proposed the line shape as coming from interference of the and an pole at 1424 MeV/c2. However, our electroproduction work measured the amount of and found negligible contribution, as shown previously in Fig. 5. The expected yield of is much smaller than the statistical fluctuation of the observed statistics. In addition, any interference between the and the should vanish in this line shape. The reason is because the final line shape stems from integration over all decay angles. The decays into in -wave, and the decays in -wave. The distributions are orthogonal to each other and vanish after integrating over angles. Thus, we conclude that the whole of the measured background-subtracted distribution below the is due to the so-called .
It has been shown in photoproduction (at ) that the structure of the region is complex. Not only does the channel-coupling strongly distort the Breit-Wigner line shape used to represent the , but there is also a significant component to the reaction mechanism that is not coming from the Moriya et al. (2013); Schumacher and Moriya (2013). With the limited statistical power of the present electroproduction data, it was not feasible to analyze these data in a similar framework. Higher statistics data would clearly be useful here.
We note that the best-fit masses found in this analysis, and , are close to a number of model predictions based on unitarized coupled channels models. Examples are the previously-quoted work of Jido et al. (2003), and also Oller and Meißner (2001), Ikeda et al. (2011), Ikeda et al. (2012), Guo and Oller (2013), and Khemchandani et al. (2011). Agreement is less good with the work of Mai and Meissner (2013) and the phenomenological photoproduction analysis of Schumacher and Moriya (2013). Again, higher statistics electroproduction data would clearly be useful.
To summarize, the mass region in electroproduction studied in this work is poorly described by a single Breit-Wigner distribution. Different fits have been tried and the best is with two relativistic Breit-Wigner functions, which supports the two-pole model as discussed in chiral unitary models Hyodo and Jido (2012). In addition, the relative strength of two line shapes changes with . The progression suggests that at higher , which corresponds to more off-shell exchange kaons (see Fig. 1), it is more likely to excite the higher mass pole of the structure relative to the lower pole. The mass distribution seen in this measurement also differs markedly from what is seen in photoproduction at Moriya et al. (2013); Schumacher and Moriya (2013). The present limited statistics makes more quantitative statements difficult, but the existence of this phenomenon has been established and encourages further exploration.
Acknowledgements.
We acknowledge the outstanding efforts of the staff of the Accelerator and Physics Divisions at Jefferson Lab that made this experiment possible. The work of the Medium Energy Physics group at Carnegie Mellon University was supported by DOE grant DE-FG02-87ER40315. The Southeastern Universities Research Association (SURA) operated the Thomas Jefferson National Accelerator Facility for the United States Department of Energy under contract DE-AC05-84ER40150. Support was also provided by the National Science Foundation, the United Kingdom’s Science and Technology Facilities Council (STFC), and the National Research Foundation of Korea.References
- Beringer et al. (2012) J. Beringer et al. (Particle Data Group), Phys. Rev. D86, 010001 (2012).
- Dalitz and Tuan (1959) R. H. Dalitz and S. F. Tuan, Phys. Rev. Lett. 2, 425 (1959).
- Dalitz and Tuan (1960) R. Dalitz and S. Tuan, Annals of Physics 10, 307 (1960).
- Alston et al. (1961) M. Alston et al., Phys. Rev. Lett. 6, 698 (1961).
- Isgur and Karl (1977) N. Isgur and G. Karl, Physics Letters B 72, 109 (1977).
- Isgur and Karl (1978) N. Isgur and G. Karl, Phys. Rev. D 18, 4187 (1978).
- Isgur and Karl (1979) N. Isgur and G. Karl, Phys. Rev. D 19, 2653 (1979).
- Capstick and Isgur (1986) S. Capstick and N. Isgur, Phys. Rev. D 34, 2809 (1986).
- Oller and Meißner (2001) J. Oller and U.-G. Meißner, Physics Letters B 500, 263 (2001).
- Jido et al. (2003) D. Jido, J. Oller, E. Oset, A. Ramos, and U.-G. Meißner, Nuclear Physics A 725, 181 (2003).
- Hyodo and Jido (2012) T. Hyodo and D. Jido, Progress in Particle and Nuclear Physics 67, 55 (2012).
- Ikeda et al. (2011) Y. Ikeda, T. Hyodo, and W. Weise, Phys.Lett. B706, 63 (2011).
- Ikeda et al. (2012) Y. Ikeda, T. Hyodo, and W. Weise, Nucl.Phys. A881, 98 (2012).
- Guo and Oller (2013) Z.-H. Guo and J. Oller, Phys.Rev. C87, 035202 (2013), arXiv:1210.3485 [hep-ph] .
- Mai and Meissner (2013) M. Mai and U.-G. Meissner, Nucl.Phys. A900, 51 (2013).
- Khemchandani et al. (2011) K. Khemchandani, A. Martinez Torres, H. Kaneko, H. Nagahiro, and A. Hosaka, Phys.Rev. D84, 094018 (2011).
- Moriya et al. (2013) K. Moriya, R. A. Schumacher, et al. (CLAS Collaboration), Phys. Rev. C 87, 035206 (2013).
- Schumacher and Moriya (2013) R. A. Schumacher and K. Moriya, Nucl. Phys. A (2013), 10.1016/j.nuclphysa.2013.03.003, (in press).
- Ahn et al. (2003) J. K. Ahn et al. (LEPS Collaboration), Nucl. Phys. A721, 715 (2003).
- Niiyama et al. (2008) M. Niiyama et al. (LEPS Collaboration), Phys. Rev. C78, 035202 (2008).
- Agakishiev et al. (2012) G. Agakishiev et al. (HADES Collaboration), Phys.Rev. C85, 035203 (2012).
- Zychor et al. (2008) I. Zychor et al., Phys. Lett. B660, 167 (2008).
- Hemingway (1985) R. J. Hemingway, Nucl. Phys. B253, 742 (1985).
- Braun et al. (1977) O. Braun et al., Nuclear Physics B 129, 1 (1977).
- Thomas et al. (1973) D. W. Thomas, A. Engler, H. E. Fisk, and R. W. Kraemer, Nucl. Phys. B56, 15 (1973).
- Mecking et al. (2003) B. A. Mecking et al. (CLAS Collaboration), Nucl. Inst. and Meth. 503, 513 (2003).
- Lu et al. (2012) H. Y. Lu, R. A. Schumacher, B. Raue, and M. Gabrielyan (CLAS Collaboration), AIP Conf. Proc. 1432, 199 (2012).
- CERN_CN Division (1993) CERN_CN Division, “GEANT 3.2.1,” CERN Program Library W5013 (1993).
- Jido et al. (2009) D. Jido, E. Oset, and T. Sekihara, Eu. Phys. J. A 42, 257 (2009).