Risk Without Return
In Journal of Investment Strategies)
Abstract
Risk-only investment strategies have been growing in popularity as traditional investment strategies have fallen short of return targets over the last decade. However, risk-based investors should be aware of four things. First, theoretical considerations and empirical studies show that apparently distinct risk-based investment strategies are manifestations of a single effect. Second, turnover and associated transaction costs can be a substantial drag on return. Third, capital diversification benefits may be reduced. Fourth, there is an apparent connection between performance and risk diversification. To analyze risk diversification benefits in a consistent way, we introduce the Risk Diversification index () which measures risk concentrations and complements the Herfindahl-Hirschman index () for capital concentrations.
In an inverted caricature of pre-Markowitz investing, some funds are allocating assets strictly on the basis of risk and without regard for expected return. Strategies based on minimum variance, beta and risk parity have been growing, both in popularity and assets under management, as traditional investment approaches have fallen short of return targets over the last decade. Risk-only strategies are not a new idea. Markowitz, [1952] identifies the minimum variance portfolio as optimal for a mean-variance investor whose estimates of asset expected returns are all equal.
Risk With Return
The Capital Asset Pricing Model (CAPM) predicts a linear relationship between the expected excess return of a portfolio and its market beta. However, empirical studies show that this simple relationship is not correct. In a seminal article, Black et al., [1972] document the first CAPM anomaly: risk-adjusted returns of high-beta equities are too low and risk-adjusted returns of low-beta equities are too high by the standards of the CAPM. Two decades later, Fama and French, [1992] find that size and value factors add to the explanation of stock return provided by market beta. The Fama–French three-factor model is, by far, the most well-established CAPM alternative. As in the case of the low-beta anomaly, there is disagreement about the underlying drivers of size and value effects, and there are contributions to the literature from both behavioral and neoclassical finance. In a survey of the vast empirical literature on the CAPM, Fama and French, [2004] comment:
The conflict between the behavioral irrational pricing story and the rational risk story for the empirical failures of the CAPM leave us at a timeworn impasse.
However, there may be a connection between risk-based investing and the expected-return-based Fama–French model. Scherer, [2011] regresses returns to a minimum variance portfolio onto the size and value factors. He finds that “83% of the variation of the minimum variance portfolio excess returns (relative to a CAPM alternative) can be attributed to the Fama–French factors”:
…investors can achieve a higher Sharpe ratio than the minimum variance portfolio by directly identifying the risk based pricing anomalies that the minimum variance portfolio draws upon
and he makes provocative comment:
In this author’s view, the minimization of risk is —on its own—a meaningless objective.
To what extent do recent data support this remark? Through a study of three popular risk-only strategies, we will show that risk-only can be a meaningful investment approach outperforming equally-weighted and balanced portfolios in terms of return and risk diversification.
Risk-Only Strategies
Over the horizon from January 1988 to December 2010, we evaluate three popular risk-only strategies: minimum variance, risk parity and low beta, based on four asset classes: US Equity, US Treasury Bonds, US Investment Grade Corporate Bonds, and Commodities 444All four asset class time series are obtained from the Global Financial Data database (www.globalfinancialdata.com). We took the Russell 3000 Total Return Index, the USA 10-Year Government Bond Total Return Index, the USA Total Return AAA Corporate Bond Index, and the Goldman Sachs Commodity Price Index to represent US Equities, US Treasuries, US Investment Grade Corporate Bonds, and Commodities, respectively. . In the minimum variance strategy, an asset’s weight is proportional to the sum of its conditional dependencies with other assets:
| (1) |
where denote the elements of the inverse of the covariance matrix.
In the risk parity strategy, assets are weighted so their ex post risk contributions are equal. An asset’s weight in the low beta strategy is inversely proportional to its benchmark beta. All strategies are fully invested and long only. Asset weights in the strategies depend on variance and covariance estimates, which are calculated using a 36-month rolling window of trailing returns. Varying the estimation methodology by changing the length of the rolling window or the weighting scheme applied to the returns within this window did not alter our results substantially. All strategies are rebalanced monthly.
We also consider an equally weighted portfolio and our benchmark: a balanced portfolio of our four asset classes. With the traditional 60/40 balanced allocation in mind, we chose 60/20/10/10 weights for equities, commodities, corporate bonds and treasuries.
Figure 1 displays performance statistics on all strategies. Our benchmark has the highest annualized returns but also the highest volatility. From the perspective of risk and risk-adjusted returns, all three risk-only strategies beat the benchmark and the equal-weighted portfolio. Among the risk-based strategies, risk parity outperforms its rival minimum variance and low beta portfolios in terms of both return and Sharpe ratio.

Variations on a Theme


Some of the common elements to risk-based investment strategies are elucidated in Clarke et al., [2011], who provide a re-expression of Formula (1) in a market with a single risk factor:
| (2) |
Formula 2 shows that the weight of asset decreases as either its CAPM market model beta, , or its idiosyncratic variance, . increases. Further, if exceeds a threshold , the weight of asset in the minimum variance portfolio is negative. Formula (2) suggests that portfolios emphasizing minimum variance, low-beta assets or assets with low volatility may be correlated.
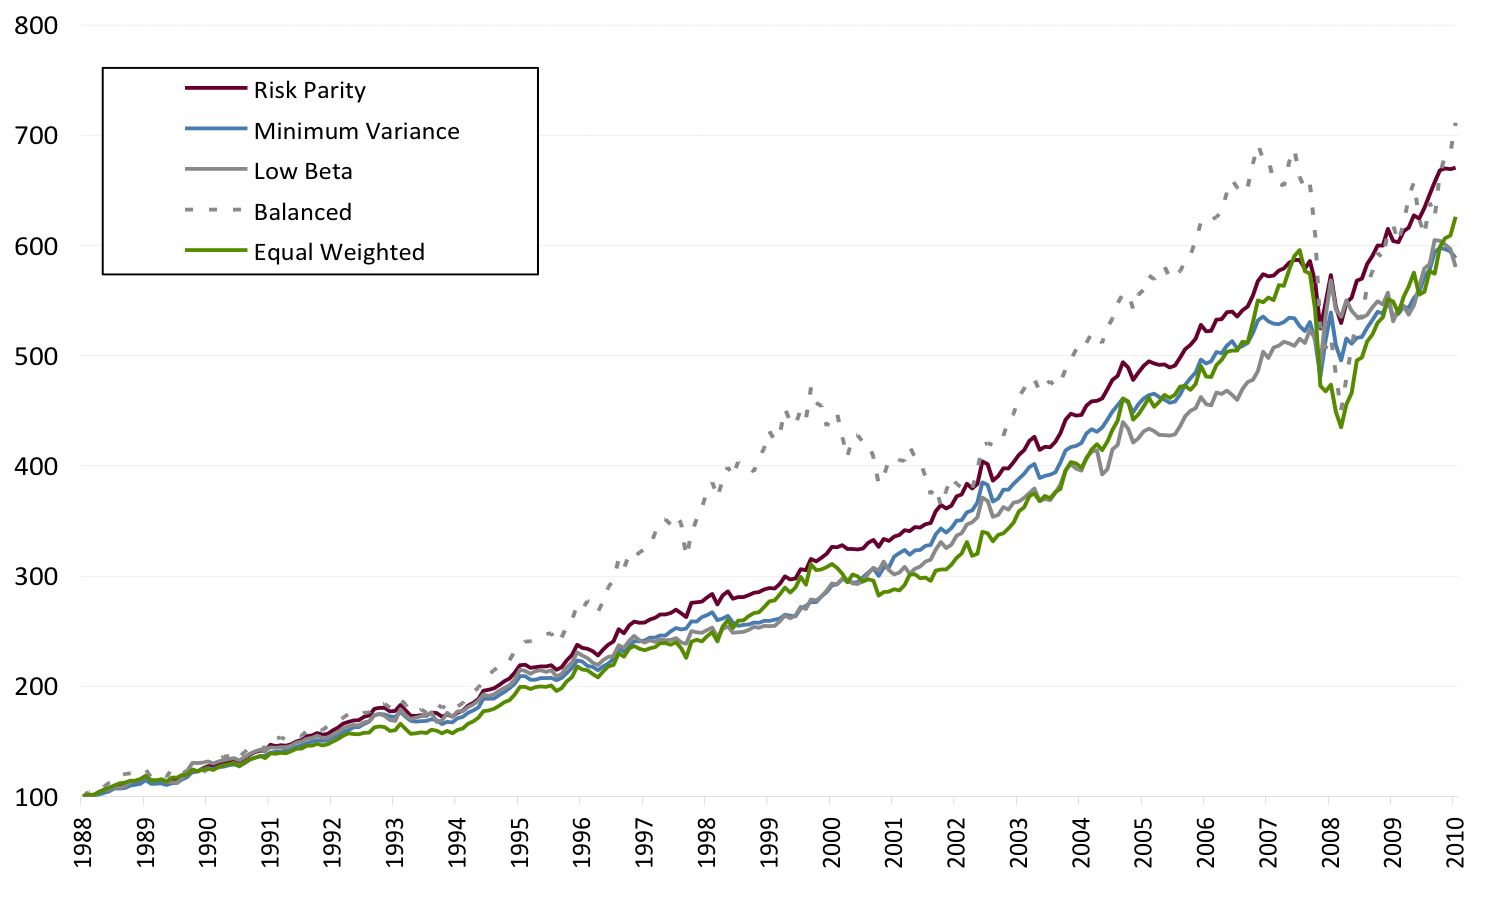
The performance of our three risk-only strategies over the horizon January 1988 to December 2010 provide empirical support for this hypothesis. Figure 2 shows cumulative returns to the three low-risk strategies and the balanced portfolio. We observe co-movement across the low-risk strategies, with risk parity outperforming the others. Note that the benchmark has the highest return over the 22-year window; however it is also the most volatile strategy and it has lowest Sharpe ratio. The correlations between strategies range from 0.87 to 0.95, as shown in Figure 3.
The Impact of Turnover


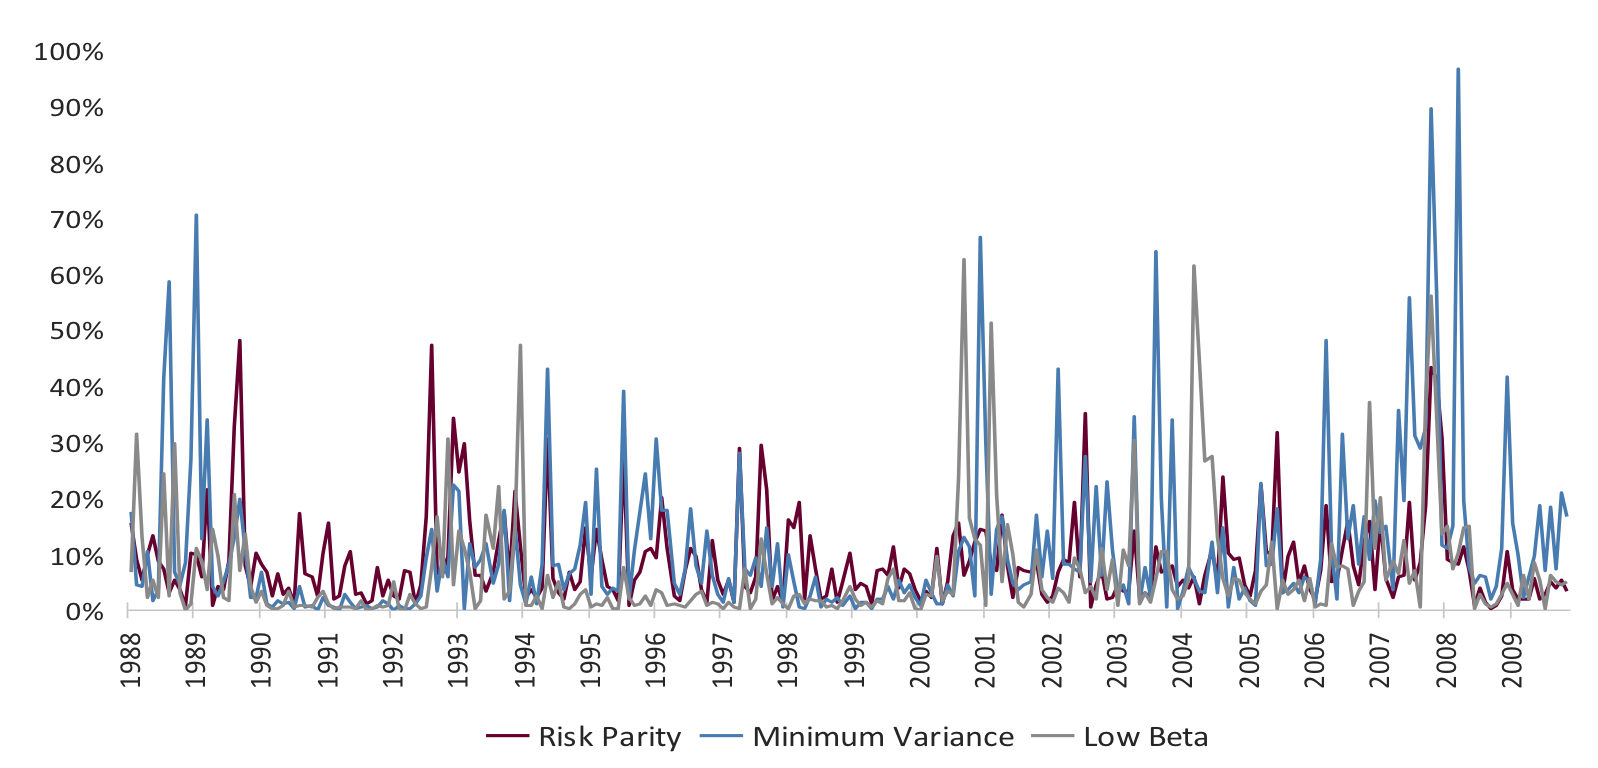
We evaluate the drag on return caused by turnover-induced transaction costs. Portfolio turnover from month to month is the lower of the total amount of assets sold and bought. Figure 4 shows this value over the 22-year period for each of the three risk-based portfolios. The average turnover is highest for minimum variance, followed closely by low beta, and then by risk parity. We observe that turnover is typically less than 10% during bull markets, but often exceeds 50% during turbulent market periods. This implies potential large rebalancing-induced trading costs in turbulent periods. Determining the precise relationship between turnover and its induced cost is beyond the scope of this paper, so we simulate. We assume that turnover incurs a penalty in the form of a cost of 10 basis points on the lower end and 50 basis points on the higher end multiplied by the turnover. Summary statistics for the risk-based strategies and the benchmarks incorporating turnover-induced trading costs are shown in Figure 5. While the risk profile does not change substantially, cost diminishes returns and Sharpe ratios, and the effect is more severe for the risk-only strategies.555The risk-only strategies that we consider are fully invested. In practice, however, some risk-only strategies are levered. Anderson et al., [2012] show that financing costs can negate the outperformance of a levered risk parity strategy.
Concentration Risk

Low-risk strategies naturally concentrate on defensive assets. The summary statistics in Figure 6 confirm that fixed income instruments have lower volatilities than do equities and commodities. Figure 7 shows that in all three strategies, the largest allocation is to US Corporate Bonds, followed by US Treasuries; each strategy allocates at least 70% of its capital to fixed income.
A standard measure of concentration risk is the normalized Herfindahl-Hirschman index:
| (3) |
where is the number of assets in the portfolio and is the weight of asset . The values of HHI range from 0 for an equally weighted portfolio to 1 for a portfolio composed of a single asset.
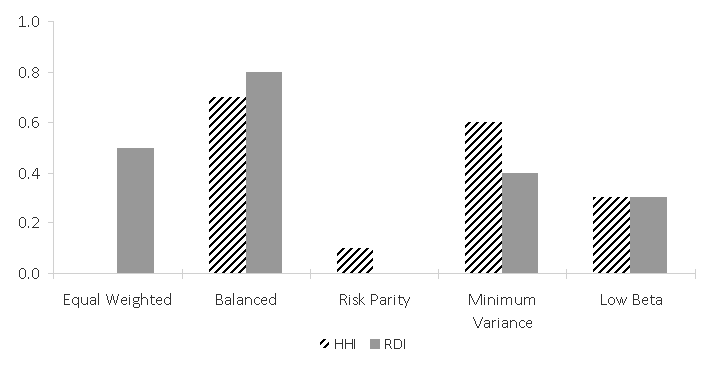
For the balanced portfolio, , due to the 60% allocation to equities. Among our risk-only strategies, minimum variance has the highest concentration risk, , followed by low beta, .This relatively high concentration risk can be explained by the fixed income allocations. Given the weights of risk parity of Figure 7, it may seem puzzling that this portfolio turns out to be almost perfectly diversified with an HHI of 0.08. Rather than lowering overall risk, risk parity equalizes the contributions of assets to overall portfolio risk. In the example we considered, the act of equalizing risk contributions served to approximately equalize capital contributions.
Inspired by Herfindahl-Hirschman index, the parallel between capital and risk allocations suggests a simple measure of risk diversification. It is natural to measure risk diversification in terms of fractional risk contributions, which are discussed in Goldberg et al., [2010]. The fractional risk contribution of asset class to portfolio volatility is given by:
where is the risk of the portfolio. Then and:
| (4) |
is the analog to . In this article, we base strategies on the volatility of asset classes rather than their risk contributions. This amounts to the tacit assumption that correlations between pairs of asset classes are zero. Formula 5 is a simplified that takes account of that assumption:
| (5) |
Figure 8 shows the Herfindahl-Hirschman and Risk Diversification indices for the strategies in our study. Only the risk parity strategy is diversified in both capital and risk.

Closing Remarks
Consistent with the large empirical literature on low-risk investing, we found that three risk-only strategies outperformed an equally weighted strategy and a balanced strategy over the horizon from January 1988 to December 2010. There is no consensus about what drives the abnormal returns of risk-based strategies exhibit in idealized settings, or whether these abnormal returns can reliably transcend the limitations to arbitrage. However, apparently distinct risk-based investment strategies are manifestations of a single effect, turnover and associated transaction costs can be a substantial drag on their return, and concentration is an understated source of their risk.
In our study, risk parity outperformed the other strategies, and that may stem from the fact that the risk parity strategy was diversified both in capital and in risk weights. Further research into the relationship between these two types of diversification is warranted.
References
- Anderson et al., [2012] Anderson, R. M., Bianchi, S. W., and Goldberg, L. R. (2012). Will my risk parity strategy outperform? Financial Analysts Journal, 68(6):75–93.
- Black et al., [1972] Black, F., Jensen, M. C., and Scholes, M. (1972). The capital asset pricing model: Some empirical tests. In Jensen, M. C., editor, Studies in the Theory of Capital Markets, pages 79–121. Praeger Publishers Inc.
- Clarke et al., [2011] Clarke, R., Silva, H. D., and Thorley, S. (2011). Minimum variance portfolio composition. Journal of Portfolio Management, 37(2):31–45.
- Fama and French, [1992] Fama, E. F. and French, K. R. (1992). The cross-section of expected stock returns. Journal of Finance, 47(2):427–465.
- Fama and French, [2004] Fama, E. F. and French, K. R. (2004). The capital asset pricing model: Theory and evidence. Journal of Economic Perspectives, 18(1):25–46.
- Goldberg et al., [2010] Goldberg, L. R., Hayes, M. Y., Menchero, J., and Mitra, I. (2010). Extreme risk analysis. The Journal of Performance Measurement, 14(3):17–30.
- Markowitz, [1952] Markowitz, H. (1952). Portfolio selection. Journal of Finance, VII(1):77–91.
- Scherer, [2011] Scherer, B. (2011). A note on the returns from minimum variance investing. Journal of Empirical Finance, 18:652–660.