Attack Planning in the Real World
Abstract
Assessing network security is a complex and difficult task. Attack graphs have been proposed as a tool to help network administrators understand the potential weaknesses of their networks. However, a problem has not yet been addressed by previous work on this subject; namely, how to actually execute and validate the attack paths resulting from the analysis of the attack graph. In this paper we present a complete PDDL representation of an attack model, and an implementation that integrates a planner into a penetration testing tool. This allows to automatically generate attack paths for penetration testing scenarios, and to validate these attacks by executing the corresponding actions -including exploits- against the real target network. We present an algorithm for transforming the information present in the penetration testing tool to the planning domain, and we show how the scalability issues of attack graphs can be solved using current planners. We include an analysis of the performance of our solution, showing how our model scales to medium-sized networks and the number of actions available in current penetration testing tools.
1 Introduction
The last 10 years have witnessed the development of a new kind of information security tool: the penetration testing framework. These tools facilitate the work of network penetration testers, and make the assessment of network security more accessible to non-experts. The main tools available are the open source project Metasploit, and the commercial products Immunity Canvas and Core Impact (?).
The main difference between these tools and network security scanners such as Nessus or Retina is that pentesting frameworks have the ability to launch real exploits for vulnerabilities, helping to expose risk by conducting an attack in the same way a real external attacker would (?).
Penetration tests involve successive phases of information gathering, where the pentesting tool helps the user gather information about the network under attack (available hosts, their operating systems and open ports, and the services running in them); and exploiting, where the user actively tries to compromise specific hosts in the network. When an exploit launched against a vulnerable machine is successful, the machine becomes compromised and can be used to perform further information gathering, or to launch subsequent attacks. This shift in the source of the attacker’s actions is called pivoting. Newly compromised machines can serve as the source for posterior information gathering, and this new information might reveal previously unknown vulnerabilities, so the phases of information gathering and exploiting usually succeed one another.
As pentesting tools have evolved and have become more complex, covering new attack vectors; and shipping increasing numbers of exploits and information gathering modules, the problem of controlling the pentesting framework successfully became an important question. A computer-generated plan for an attack would isolate the user from the complexity of selecting suitable exploits for the hosts in the target network. In addition, a suitable model to represent these attacks would help to systematize the knowledge gained during manual penetration tests performed by expert users, making pentesting frameworks more accessible to non-experts. Finally, the possibility of incorporating the attack planning phase to the pentesting framework would allow for optimizations based on exploit running time, reliability, or impact on Intrusion Detection Systems.
Our work on the attack planning problem applied to pentesting began in 2003 with the construction of a conceptual model of an attack, distinguishing assets, actions and goals (?; ?; ?). In this attack model, the assets represent both information and the modifications in the network that an attacker may need to obtain during an intrusion, whereas the actions are the basic steps of an attack, such as running a particular exploit against a target host. This model was designed to be realistic from an attacker’s point of view, and contemplates the fact that the attacker has an initial incomplete knowledge of the network, and therefore information gathering should be considered as part of the attack.
Since the actions have requirements (preconditions) and results, given a goal, a graph of the actions/assets that lead to this goal can be constructed. This graph is related to the attack graphs111Nodes in an attack graph identify a stage of the attack, while edges represent individual steps in the attack. studied in (?; ?; ?) and many others. In (?) the authors reviewed past papers on attack graphs, and observed that the “first major limitation of these studies is that most attack graph algorithms have only been able to generate attack graphs on small networks with fewer than 20 hosts”.
In medium-sized networks, building complete attack graphs quickly becomes unfeasible (their size increases exponentially with the number of machines and available actions). To deal with the attack planning problem, a proposed approach (?; ?) is to translate the model into a PDDL representation and use classical planning algorithms to find attack paths. Planning algorithms manage to find paths in the attack graph without constructing it completely, thus helping to avoid the combinatorial explosion (?). A similar approach was presented at SecArt’09 (?), but the authors’ model is less expressive than the one used in this work, as their objective was to use the attack paths to build a minimal attack graph, and not to carry out these attacks against real networks.
In this paper we present an implementation of these ideas. We have developed modules that integrate a pentesting framework with an external planner, and execute the resulting plans back in the pentesting framework, against a real network. We believe our implementation proves the feasability of automating the attack phases of a penetration test, and allows to think about moving up to automate the whole process. We show how our model, and its PDDL representation, scale to hundreds of target nodes and available exploits, numbers that can be found when assessing medium-sized networks with current pentesting frameworks.
The paper is structured as follows: in Section 2 we present a high-level description of our solution, describing the steps needed to integrate a planner with a penetration testing framework. Section 3 describes our PDDL representation in detail, explaining how the “real world” view that we take forces a particular implementation of the attack planning problem in PDDL. Section 4 presents the results of our scalability testing, showing how our model manages medium-sized networks using current planners. Section 5 reviews related work, and Section 6 closes the paper and outlines future work.
2 Architecture of our Solution
In this section we describe the components of our solution, and how they fit together to automate an attack. Figure 1 shows the relationship between these different components. The penetration testing framework is a tool that allows the user/attacker to execute exploits and other pre/post exploitation modules against the target network. Our implementation is based on Core Impact222As mentioned in the previous section, Metasploit is an open-source alternative.. The planner is a tool that takes as input the description of a domain and a scenario, in PDDL333Refer to (?) for a description of the PDDL planning language.. The domain contains the definition of the available actions in the model, and the scenario contains the definition of the objects (networks, hosts, and their characteristics), and the goal which has to be solved.

The attack workspace contains the information about the current attack or penetration test. In particular, the discovered networks and hosts, information about their operating systems, open/closed ports, running services and compromised machines. In the current version of our solution we assume that the workspace has this network information available, and that no network information gathering is needed to generate a solvable plan. We will address this limitation in Section 6 when we discuss future work.
Transform algorithm
The transform algorithm generates the PDDL representation of the attack planning problem, including the initial conditions, the operators (PDDL actions), and the goal. From the pentesting framework we extract the description of the operators, in particular the requirements and results of the exploits, which will make up most of the available actions in the PDDL representation. This is encoded in the domain.pddl file, along with the predicates and types (which only depend on the details of our model).
From the attack workspace we extract the information that constitutes the initial conditions for the planner: networks, machines, operating systems, ports and running services. This is encoded in the problem.pddl file, together with the goal of the attack, which will usually be the compromise of a particular machine.
A common characteristic of pentesting frameworks is that they provide an incomplete view of the network under attack. The pentester has to infer the structure of the network using the information that he sees from each compromised machine. The transform algorithm takes this into account, receiving extra information regarding host connectivity.
Planner
The PDDL description is given as input to the planner. The advantage of using the PDDL language is that we can experiment with different planners and determine which best fits our particular problem. We have evaluated our model using both SGPlan (?) and Metric-FF (?).
The planner is run from inside the pentesting framework, as a pluggable module of the framework that we call PlannerRunner. The output of the planner is a plan, a sequence of actions that lead to the completion of the goal, if all the actions are successful. We make this distinction because even with well-tested exploit code, not all exploits launched are successful. The plan is given as feedback to the pentesting framework, and executed against the real target network.
3 The PDDL Representation in Detail
The PDDL description language serves as the bridge between the pentesting tool and the planner. Since exploits have strict platform and connectivity requirements, failing to accurately express those requirements in the PDDL model would result in plans that cannot be executed against real networks. This forces our PDDL representation of the attack planning problem to be quite verbose.
On top of that, we take advantage of the optimization abilities of planners that understand numerical effects444Numerical effects allow the actions in the PDDL representation to increase the value of different metrics defined in the PDDL scenario. The planner can then be told to find a plan that minimizes a linear function of these metrics., and have the PDDL actions affect different metrics commonly associated with penetration testing such as running time, probability of success or possibility of detection (stealth).
We will focus on the description of the domain.pddl file, which contains the PDDL representation of the attack model. We will not delve into the details of the problem.pddl file, since it consists of a list of networks and machines, described using the predicates to be presented in this section.
The PDDL requirements of the representation are :typing, so that predicates can have types, and :fluents, to use numerical effects. We will first describe the types available in the model, and then list the predicates that use these types. We will continue by describing the model-related actions that make this predicates true, and then we will show an example of an action representing an exploit. We close this section with an example PDDL plan for a simple scenario.
Types
Table 1 shows a list of the types that we used. Half of the object types are dedicated to describing in detail the operating systems of the hosts, since the successful execution of an exploit depends on being able to detect the specifics of the OS.
| network | operating_system |
| host | OS_version |
| port | OS_edition |
| port_set | OS_build |
| application | OS_servicepack |
| agent | OS_distro |
| privileges | kernel_version |
Predicates
The following are the predicates used in our model of attacks. Since exploits also have non-trivial connectivity requirements, we chose to have a detailed representation of network connectivity in PDDL. We need to be able to express how hosts are connected to networks, and the fact that exploits may need both IP and TCP or UDP connectivity between the source and target hosts, usually on a particular TCP or UDP port. These predicates express the different forms of connectivity:
(connected_to_network ?s - host ?n - network) (IP_connectivity ?s - host ?t - host) (TCP_connectivity ?s - host ?t - host ?p - port) (TCP_listen_port ?h - host ?p - port) (UDP_listen_port ?h - host ?p - port)
These predicates describe the operating system and services of a host:
(has_OS ?h - host ?os - operating_system) (has_OS_version ?h - host ?osv - OS_version) (has_OS_edition ?h - host ?ose - OS_edition) (has_OS_build ?h - host ?osb - OS_build) (has_OS_servicepack ?h - host ?ossp - OS_servicepack) (has_OS_distro ?h - host ?osd - OS_distro) (has_kernel_version ?h - host ?kv - kernel_version) (has_architecture ?h - host ?a - OS_architecture) (has_application ?h - host ?p - application)
Actions
We require some “model-related” actions that make true the aforementioned predicates in the right cases.
(:action IP_connect
:parameters (?s - host ?t - host)
:precondition (and (compromised ?s)
(exists (?n - network)
(and (connected_to_network ?s ?n)
(connected_to_network ?t ?n))))
:effect (IP_connectivity ?s ?t)
)
(:action TCP_connect
:parameters (?s - host ?t - host ?p - port)
:precondition (and (compromised ?s)
(IP_connectivity ?s ?t)
(TCP_listen_port ?t ?p))
:effect (TCP_connectivity ?s ?t ?p)
)
(:action Mark_as_compromised
:parameters (?a - agent ?h - host)
:precondition (installed ?a ?h)
:effect (compromised ?h)
)
Two hosts on the same network possess IP connectivity, and two hosts have TCP (or UDP) connectivity if they have IP connectivity and the target host has the correct TCP (or UDP) port open. Moreover, when an exploit is successful an agent is installed on the target machine, which allows control over that machine. An installed agent is hard evidence that the machine is vulnerable, so it marks the machine as compromised555Depending on the exploit used, the agent might have regular user privileges, or superuser (root) privileges. Certain local exploits allow a low-level (user) agent to be upgraded to a high-level agent, so we model this by having two different privileges PDDL objects..
The penetration testing framework we used has an extensive test suite that collects information regarding running time for many exploit modules. We obtained average running times from this data and used that information as the numeric effect of exploit actions in PDDL. The metric to minimize in our PDDL scenarios is therefore the total running time of the complete attack.
Finally, this is an example of an action, an exploit that will attempt to install an agent on target host t from an agent previously installed on the source host s. To be successful, this exploit requires that the target runs a specific OS, has the service ovtrcd running and listening on port 5053.
(:action HP_OpenView_Remote_Buffer_Overflow_Exploit
:parameters (?s - host ?t - host)
:precondition (and (compromised ?s)
(and (has_OS ?t Windows)
(has_OS_edition ?t Professional)
(has_OS_servicepack ?t Sp2)
(has_OS_version ?t WinXp)
(has_architecture ?t I386))
(has_service ?t ovtrcd)
(TCP_connectivity ?s ?t port5053)
)
:effect(and (installed_agent ?t high_privileges)
Ψ(increase (time) 10)
))
In our PDDL representation there are several versions of this exploit, one for each specific operating system supported by the exploit. For example, another supported system for this exploit looks like this:
(and (has_OS ?t Solaris) (has_OS_version ?t V_10) (has_architecture ?t Sun4U))
The main part of the domain.pddl file is devoted to the description of the actions. In our sample scenarios, this file has up to 28,000 lines and includes up to 1,800 actions. The last part of the domain.pddl file is the list of constants that appear in the scenario, including the names of the applications, the list of port numbers and operating system version details.
An attack plan
We end this section with an example plan obtained by running Metric-FF on a scenario generated with this model. The goal of the scenario is to compromise host 10.0.5.12 in the target network. This network is similar to the test network that we will describe in detail in Section 4. The plan requires four pivoting steps and executes five different exploits in total, though we only show the first666The localagent object represents the pentesting framework running in the machine of the user/attacker. and last ones for space reasons. The exploits shown are real-world exploits currently present in the pentesting framework.
0: Mark_as_compromised localagent localhost
1: IP_connect localhost 10.0.1.1
2: TCP_connect localhost 10.0.1.1 port80
3: Phpmyadmin Server_databases Remote Code Execution
localhost 10.0.1.1
4: Mark_as_compromised 10.0.1.1 high_privileges
...
14: Mark_as_compromised 10.0.4.2 high_privileges
15: IP_connect 10.0.4.2 10.0.5.12
16: TCP_connect 10.0.4.2 10.0.5.12 port445
17: Novell Client NetIdentity Agent Buffer Overflow
10.0.4.2 10.0.5.12
18: Mark_as_compromised 10.0.5.12 high_privileges
4 Performance and Scalability Evaluation
This model, and its representation in PDDL, are intended to be used to plan attacks against real networks, and execute them using a pentesting framework. To verify that our proposed solution scales up to the domains and scenarios we need to address in real-world cases, we carried out extensive performance and scalability testing – to see how far we could take the attack model and PDDL representation with current planners. We focused our performance evaluation on four metrics:
-
•
Number of machines in the attacked network
-
•
Number of pivoting steps in the attack
-
•
Number of available exploits in the pentesting suite
-
•
Number of individual predicates that must be fulfilled to accomplish the goal
The rationale behind using these metrics is that we needed our solution to scale up reasonably with regard to all of them. For example, a promising use of planning algorithms for attack planning lies in scenarios where there are a considerable number of machines to take into account, which could be time-consuming for a human attacker.
Moreover, many times a successful penetration test needs to reach the innermost levels of a network, sequentially exploiting many machines in order to reach one which might hold sensitive information. We need our planning solution to be able to handle these cases where many pivoting steps are needed.
Pentesting suites are constantly updated with exploits for new vulnerabilities, so that users can test their systems against the latest risks. The pentesting tool that we used currently777As of March, 2010. has about 700 exploits, of which almost 300 are the remote exploits that get included in the PDDL domain. Each remote exploit is represented as a different operator for each target operating system, so our PDDL domains usually have about 1800 operators, and our solution needs to cope with that input.
Finally, another promising use of planning algorithms for attack planning is the continuous monitoring of a network by means of a constant pentest. In this case we need to be able to scale to goals that involve compromising many machines.
We decided to use the planners Metric-FF 888Latest version available (with additional improvements). (?) and SGPlan 999SGPlan version 5.22. (?) since we consider them to be representative of the state of the art in classical planners. The original FF planner was the baseline planner for IPC’08101010The International Planning Competition, 2008.. Metric-FF adds numerical effects to the FF planner. We modified the reachability analysis in Metric-FF to use type information, as in FF, to obtain better memory usage.
SGPlan combines Metric-FF as a base planner with a constraint partitioning scheme which allows it to divide the main planning problem in subproblems; these subproblems are solved with a modified version of Metric-FF, and the individual solutions combined to obtain a plan for the original problem. This method, according to the authors, has the potential to significantly reduce the complexity of the original problem (?). It was successfully used in (?).
Generating the test scenarios
We tested both real and simulated networks, generating the test scenarios using the same pentesting framework we would later use to attack them. For the large-scale testing, we made use of a network simulator (?). This simulator allows to build sizable networks111111We tested up to 1000 nodes in the simulator., but still view each machine independently and, for example, execute distinct system calls in each of them. The simulator integrates tightly with the pentesting framework, to the point where the framework is oblivious to the fact that the network under attack is simulated and not real.
This allowed us to use the pentesting tool to carry out all the steps of the test, including the information gathering stage of the attack. Once the information gathering was complete, we converted the attack workspace to PDDL using our transform tool.

We generated two types of networks for the performance evaluation. To evaluate the scalability in terms of number of machines, number of operators, and number of goals; the network consists of five subnets with varying numbers of machines, all joined to one main network to which the user/attacker initially has access. Figure 2 shows the high-level structure of this simulated network.
To evaluate the scalability in terms of the number of pivoting steps needed to reach the goal, we constructed a test network where the attacker and the target machine are separated by an increasing number of routers, and each subnetwork in between has a small number of machines.
| Machine type | OS version | Share | Open ports |
| Windows desktop | Windows XP SP3 | 50% | 139, 445 |
| Windows server | Windows 2003 Server SP2 | 14% | 25, 80, 110, 139, |
| 443, 445, 3389 | |||
| Linux desktop | Ubuntu 8.04 or 8.10 | 27% | 22 |
| Linux server | Debian 4.0 | 9% | 21, 22, 23, 25, |
| 80, 110, 443 |
The network simulator allows us to specify many details about the simulated machines, so in both networks, the subnetworks attached to the innermost routers contain four types of machines: Linux desktops and servers, and Windows desktops and servers. Table 2 shows the configuration for each of the four machine types, and the share of each type in the network. For server cases, each machine randomly removes one open port from the canonical list shown in the table, so that all machines are not equal and thus not equally exploitable.
Results
As we expected, both planners generated the same plans in all cases, not taking into account plans in which goals were composite and the same actions could be executed in different orders. This is reasonable given that SGPlan uses Metric-FF as its base planner. We believe that the performance and scalability results are more interesting, since a valid plan for an attack path is a satisfactory result in itself.
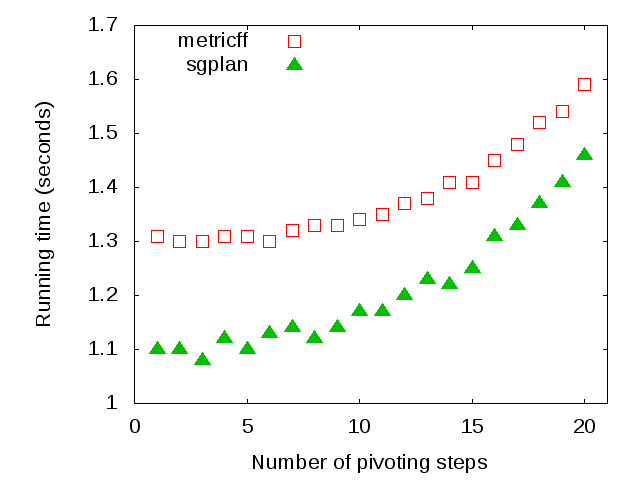
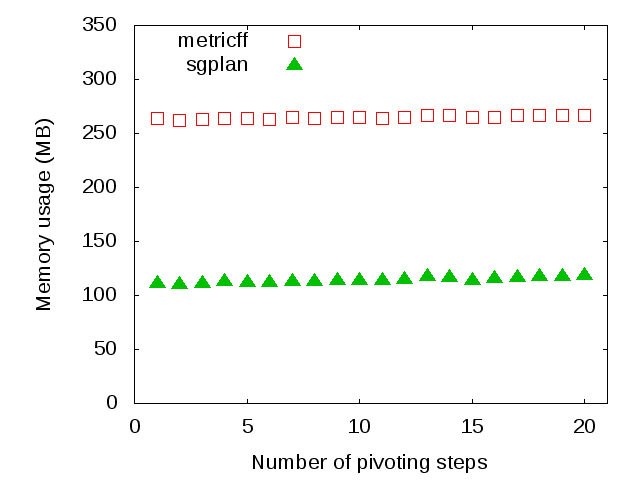
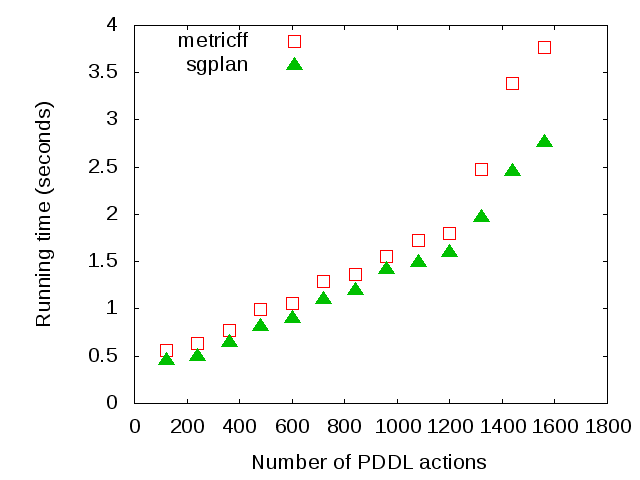
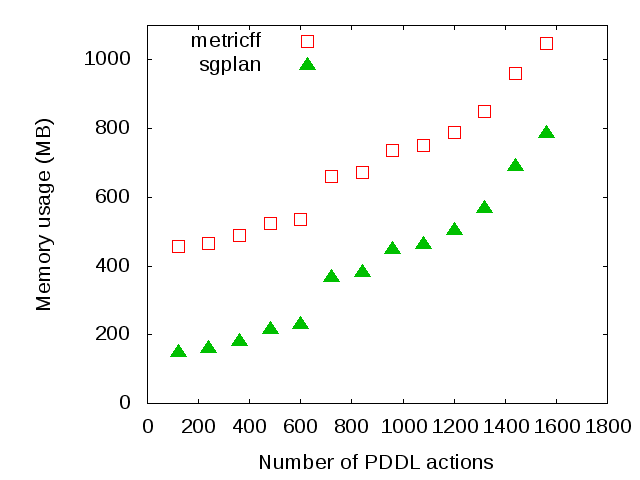
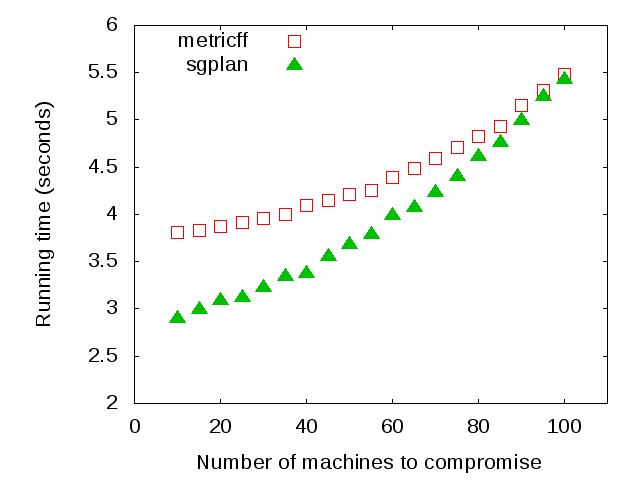
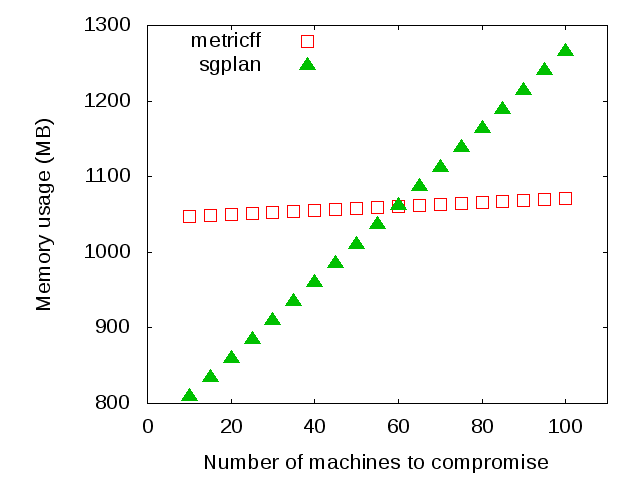
Figures 3 to 10 show how running time and memory consumption scale for both planners, with respect to the four metrics considered121212Testing was performed on a Core i5 750 2.67 GHz machine with 8 GB of RAM, running 64-bit Ubuntu Linux; the planners were 32-bit programs.. Recall that, as explained in Section 3, each exploit maps to many PDDL actions.
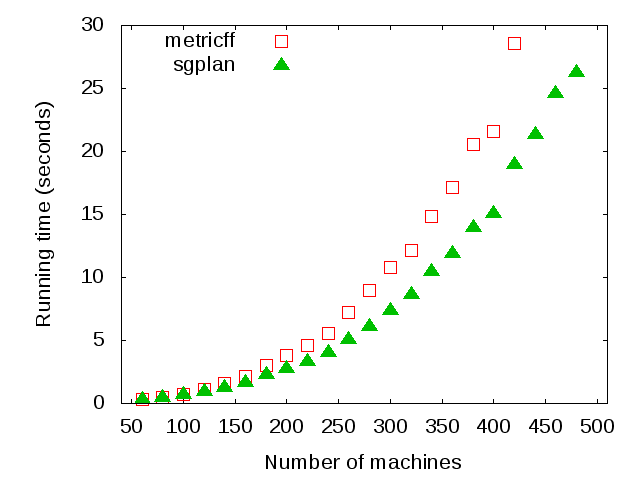
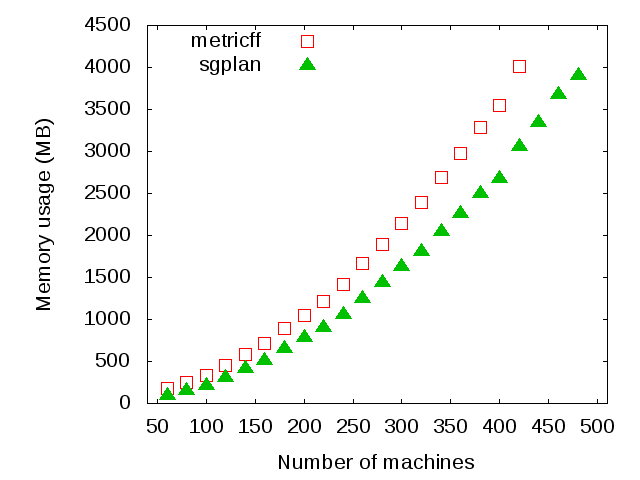
As illustrated by Figures 3 and 4, both running time and memory consumption increase superlinearly with the number of machines in the network. We were not able to find exact specifications for the time and memory complexities of Metric-FF or SGPlan, though we believe this is because heuristics make it difficult to calculate a complexity that holds in normal cases. Nonetheless, our model, coupled with the SGPlan planner, allows to plan an attack in a network with 480 nodes in 25 seconds and using less than 4 GB of RAM. This makes attack planning practical for pentests in medium-sized networks.
Moving on to the scalability with regard to the depth of the attack (Figures 5 and 6), it was surprising to verify that memory consumption is constant even as we increase the depth of the attack to twenty pivoting steps, which generates a plan of more than sixty steps. Running time increases slowly, although with a small number of steps the behaviour is less predictable. The model is therefore not constrained in terms of the number of pivoting steps.
With regard to the number of operators (i.e. exploits) (Figures 7 and 8), both running time and memory consumption increase almost linearly; however, running time spikes in the largest cases. Doubling the number of operators, from 720 to 1440 (from 120 to 240 available exploits), increases running time in 163% for Metric-FF and 124% for SGPlan. Memory consumption, however, increases only 46% for Metric-FF, and 87% for SGPlan. In this context, the number of available exploits is not a limiting factor for the model.
Interestingly, these three tests also verify many of the claims made by the authors of SGPlan. We see that the constraint partition used by their planner manages to reduce both running time and memory consumption, in some cases by significant amounts (like in Figure 6).
The results for the individual number of predicates in the overall goal (Figures 9 and 10) are much more surprising. While SGPlan runs faster than Metric-FF in most of the cases, Metric-FF consumes significantly less memory in almost half of them. We believe that as the goal gets more complex (the largest case we tested requests the individual compromise of 100 machines), SGPlan’s constraint partition strategy turns into a liability, not allowing a clean separation of the problem into subproblems. By falling back to Metric-FF our model can solve, in under 6 seconds and using slightly more than 1 GB of RAM, attack plans where half of the machines of a 200-machine network are to be compromised.
5 Related work
Work on attack modeling applied to penetration testing had its origin in the possibility of programmatically controlling pentesting tools such as Metasploit or Core Impact. This model led to the use of attack graphs. Earlier work on attack graphs such as (?; ?; ?) were based on the complete enumeration of attack states, which grows exponentially with the number of actions and machines. As we mentioned in Section 1 the survey of (?) shows that the major limitations of past studies of attack graphs is their lack of scalability to medium-sized networks.
One notable exception is the Topological Vulnerability Analysis (TVA) project conducted in George Mason University described in (?; ?; ?) and other papers, which has been designed to work in real-size networks. The main differences between our approach and TVA are the following:
-
•
Input. In TVA the model is populated with information from third party vulnerability scanners such as Nessus, Retina and FoundScan, from databases of vulnerabilities such as CVE and OSVDB and other software. All this information has to be integrated, and will suffer from the drawbacks of each information source, in particular from the false positives generated by the vulnerability scanners about potential vulnerabilities.
In our approach the conceptual model and the information about the target network are extracted from a consistent source: the pentesting framework exploits and workspace. The vulnerability information of an exploit is very precise: the attacker can execute it in the real network to actually compromise systems.
-
•
Monotonicity. TVA assumes that the attacker’s control over the network is monotonic (?). In particular, this implies that TVA cannot model Denial-of-Service (DoS) attacks, or the fact that an unsuccessful exploit may crash the target service or machine. It is interesting to remark that the monotonicity assumption is the same used by FF (?) to create a relaxed version of the planning problem, and use it as a heuristic to guide the search through the attack graph. By relying on the planner to do the search, we do not need to make this restrictive assumption.
6 Summary and Future Work
(?) proposed a model of computer network attacks which was designed to be realistic from an attacker’s point of view. We have shown in this paper that this model scales up to medium-sized networks: it can be used to automate attacks (and penetration tests) against networks with hundreds of machines.
The solution presented shows that it is not necessary to build the complete attack graph (one of the major limitations of earlier attack graph studies). Instead we rely on planners such as Metric-FF and SGPlan to selectively explore the state space in order to find attack paths.
We have successfully integrated these planners with a pentesting framework, which allowed us to execute and validate the resulting plans against a test bench of scenarios. We presented the details of how to transform the information contained in the pentesting tool to the planning domain131313Our implementation uses Core Impact, but the same ideas can be extended to other tools such as the open-source project Metasploit..
One important question that remains as future work on this subject is how to deal with incomplete knowledge of the target network. The architecture that we presented supports running non-classical planners, so one possible approach is to use probabilistic planning techniques, where actions have different outcomes with associated probabilities. For example, a step of the attack plan could be to discover the operating system details of a particular host, so the outcome of this action would be modeled as a discrete probability distribution.
Another approach would be to build a “metaplanner” that generates hypotheses with respect to the missing bits of information about the network, and uses the planner to test those hypotheses. Continuing the previous example, the metaplanner would assume that the operating system of the host was Windows and request the planner to compromise it as such. The metaplanner would then test the resulting plan in the real network, and verify or discard the hypothesis.
References
- [Ammann, Wijesekera, and Kaushik 2002] Ammann, P.; Wijesekera, D.; and Kaushik, S. 2002. Scalable, graph-based network vulnerability analysis. In Proceedings of the 9th ACM Conference on Computer and Communications Security, 217–224. ACM New York, NY, USA.
- [Arce and McGraw 2004] Arce, I., and McGraw, G. 2004. Why attacking systems is a good idea. IEEE Computer Society - Security & Privacy Magazine 2(4).
- [Arce and Richarte 2003] Arce, I., and Richarte, G. 2003. State of the art security from an attacker’s viewpoint. In PacSec Conference, Tokyo, Japan.
- [Blum and Furst 1997] Blum, A. L., and Furst, M. L. 1997. Fast planning through planning graph analysis. Artificial Intelligence 90(1-2):281 – 300.
- [Burns et al. 2007] Burns, B.; Killion, D.; Beauchesne, N.; Moret, E.; Sobrier, J.; Lynn, M.; Markham, E.; Iezzoni, C.; Biondi, P.; Granick, J. S.; Manzuik, S.; and Guersch, P. 2007. Security Power Tools. O’Reilly Media.
- [Chen, Wah, and Hsu 2006] Chen, Y.; Wah, B. W.; and Hsu, C. 2006. Temporal planning using subgoal partitioning and resolution in SGPlan. J. of Artificial Intelligence Research 26:369.
- [Fox and Long 2003] Fox, M., and Long, D. 2003. PDDL2. 1: An extension to PDDL for expressing temporal planning domains. Journal of Artificial Intelligence Research 20(2003):61–124.
- [Futoransky et al. 2003] Futoransky, A.; Notarfrancesco, L.; Richarte, G.; and Sarraute, C. 2003. Building computer network attacks. Technical report, CoreLabs.
- [Futoransky et al. 2009] Futoransky, A.; Miranda, F.; Orlicki, J.; and Sarraute, C. 2009. Simulating cyber-attacks for fun and profit. In 2nd Internation Conference on Simulation Tools and Techniques (SIMUTools ’09).
- [Ghosh and Ghosh 2009] Ghosh, N., and Ghosh, S. K. 2009. An intelligent technique for generating minimal attack graph. In First Workshop on Intelligent Security (Security and Artificial Intelligence) (SecArt ’09).
- [Hoffmann 2001] Hoffmann, J. 2001. FF: The fast-forward planning system. AI magazine 22(3):57.
- [Hoffmann 2002] Hoffmann, J. 2002. Extending FF to numerical state variables. In Proceedings of the 15th European Conference on Artificial Intelligence (ECAI-02), 571–575.
- [Jajodia, Noel, and OBerry 2005] Jajodia, S.; Noel, S.; and OBerry, B. 2005. Topological analysis of network attack vulnerability. Managing Cyber Threats: Issues, Approaches and Challenges 248–266.
- [Lippmann and Ingols 2005] Lippmann, R., and Ingols, K. 2005. An annotated review of past papers on attack graphs. Technical report, MIT Lincoln Laboratory.
- [Noel and Jajodia 2005] Noel, S., and Jajodia, S. 2005. Understanding complex network attack graphs through clustered adjacency matrices. In Proceedings of the 21st Annual Computer Security Applications Conference, 160–169.
- [Noel et al. 2009] Noel, S.; Elder, M.; Jajodia, S.; Kalapa, P.; OHare, S.; and Prole, K. 2009. Advances in Topological Vulnerability Analysis. In Proceedings of the 2009 Cybersecurity Applications & Technology Conference for Homeland Security, 124–129. IEEE Computer Society.
- [Phillips and Swiler 1998] Phillips, C. A., and Swiler, L. P. 1998. A graph-based system for network-vulnerability analysis. In Workshop on New Security Paradigms, 71–79.
- [Richarte 2003] Richarte, G. 2003. Modern intrusion practices. In Black Hat Briefings.
- [Ritchey and Ammann 2000] Ritchey, R., and Ammann, P. 2000. Using model checking to analyze network vulnerabilities. In IEEE Symposium on Security and Privacy, 156–165. IEEE Computer Society.
- [Sarraute and Weil 2008] Sarraute, C., and Weil, A. 2008. Advances in automated attack planning. In PacSec Conference, Tokyo, Japan.
- [Sarraute 2009] Sarraute, C. 2009. New algorithms for attack planning. In FRHACK Conference, Besançon, France.
- [Sheyner et al. 2002] Sheyner, O.; Haines, J.; Jha, S.; Lippmann, R.; and Wing, J. 2002. Automated generation and analysis of attack graphs. In IEEE Symposium on Security and Privacy, 273–284. IEEE Computer Society.