Drivers of H i Turbulence in Dwarf Galaxies

Adrienne M. Stilp11affiliation: Department of Astronomy, University of Washington, Box 351580, Seattle, WA 98195, USA , Julianne J. Dalcanton11affiliation: Department of Astronomy, University of Washington, Box 351580, Seattle, WA 98195, USA , Evan Skillman22affiliation: Minnesota Institute for Astrophysics, University of Minnesota, 116 Church St. SE, Minneapolis, MN 55455, USA , Steven R. Warren33affiliation: Department of Astronomy, University of Maryland, CSS Bldg., Rm. 1024, Stadium Dr., College Park, MD 20742-2421 , Jürgen Ott44affiliation: National Radio Astronomy Observatory, P.O. Box O, 1003 Lopezville Road, Socorro, NM 87801, USA , Bärbel Koribalski55affiliation: Australia Telescope National Facility, CSIRO Astronomy and Space Science, PO Box 76, Epping NSW 1710, Australia
Abstract

Neutral hydrogen (H i) velocity dispersions are believed to be set by turbulence in the interstellar medium (ISM). Although turbulence is widely believed to be driven by star formation, recent studies have shown that this driving mechanism may not be dominant in regions of low star formation surface density (ΣSFRsubscriptΣSFR\Sigma_{\mathrm{SFR}}), such as found in dwarf galaxies or the outer regions of spirals. We have generated average H i line profiles in a number of nearby dwarfs and low-mass spirals by co-adding H i spectra in subregions with either a common radius or ΣSFRsubscriptΣSFR\Sigma_{\mathrm{SFR}}. We find that the individual spatially-resolved “superprofiles” are composed of a central narrow peak (515similar-toabsent515\sim 5-15 km s-1) with higher velocity wings to either side, similar to their global counterparts as calculated for the galaxy as a whole. Under the assumption that the central peak reflects the H i turbulent velocity dispersion, we compare measures of H i kinematics determined from the superprofiles to local ISM properties, including surface mass densities and measures of star formation. The shape of the wings of the superprofiles do not show any correlation with local ISM properties, which indicates that they may be an intrinsic feature of H i line-of-sight spectra. On the other hand, the H i velocity dispersion is correlated most strongly with baryonic and H i surface mass density, which points at a gravitational origin for turbulence, but it is unclear which, if any, gravitational instabilities are able to operate efficiently in these systems. Star formation energy is typically produced at a level sufficient to drive H i turbulent motions at realistic coupling efficiencies in regimes where ΣSFR104greater-than-or-equivalent-tosubscriptΣSFRsuperscript104\Sigma_{\mathrm{SFR}}{}\gtrsim 10^{-4} MsubscriptMdirect-product\mathrm{M}_{\odot} yr-1 kpc-2, as is typically found in inner spiral disks. At low star formation intensities, on the other hand, star formation cannot supply enough energy to drive the observed turbulence, nor does it uniquely determine the turbulent velocity dispersion. Nevertheless, even at low intensity, star formation does appear to provide a lower threshold for H i velocity dispersions. We find a pronounced decrease in coupling efficiency with increasing ΣSFRsubscriptΣSFR\Sigma_{\mathrm{SFR}}, which would be consistent with a picture where star formation couples to the ISM with constant efficiency, but that less of that energy is found in the neutral phase at higher ΣSFRsubscriptΣSFR\Sigma_{\mathrm{SFR}}. We have examined a number of potential drivers of H i turbulence, including star formation, gravitational instabilities, the magneto-rotational instability, and accretion-driven turbulence, and found that, individually, none of these drivers is capable of driving the observed levels of turbulence in the low ΣSFRsubscriptΣSFR\Sigma_{\mathrm{SFR}} regime. We discuss possible solutions to this conundrum.

ISM: kinematics and dynamics — galaxies: dwarf — galaxies: ISM — galaxies: irregular — galaxies: kinematics and dynamics

1 Introduction

The local velocity dispersion of neutral hydrogen (H i) provides a good tracer of the small-scale kinematics of the interstellar medium (ISM) in disk galaxies. The velocity dispersions of H i clouds tend to range between 5155155-15 km s-1 across a wide range of galaxy and ISM properties (e.g., Dickey et al., 1990; van Zee & Bryant, 1999; Tamburro et al., 2009). These velocity dispersions are thought to be turbulent in nature (e.g., Mac Low & Klessen, 2004) because they are much greater than the velocity dispersions expected for the stable thermal temperatures in the ISM (1 km s-1 and 7 km s-1 for the cold and warm neutral phases; e.g., Wolfire et al., 1995). H i velocity dispersions also tend to either remain constant or decrease with increasing galaxy radius in spirals and large dwarfs (Dickey et al., 1990; Boulanger & Viallefond, 1992; Petric & Rupen, 2007; Tamburro et al., 2009).

The origin of turbulent H i velocity dispersions remains uncertain, but many studies attribute H iturbulence to star formation and resulting supernova explosions (SNe; e.g., Mac Low & Klessen, 2004; Tamburro et al., 2009; Joung et al., 2009). This relationship seems to hold in the central regions of spiral galaxies, but breaks down at large radii where star formation intensity drops dramatically while H i velocity dispersions remain relatively constant (e.g., Boulanger & Viallefond, 1992; van Zee & Bryant, 1999; Tamburro et al., 2009). For some massive spiral disks, H i velocity dispersions at large radii have been tentatively attributed to turbulence induced by non-stellar sources, such as the magneto-rotational instability (MRI; e.g., Sellwood & Balbus, 1999; Zhang et al., 2012). This outer disk regime exhibits star formation rate intensities and H i velocity dispersions similar to those found in dwarf galaxies, which tend to have solid-body rotation curves (e.g., Oh et al., 2011) and therefore lack the shear required for the MRI to function efficiently. Additionally, H i velocity dispersions in the outskirts of some dwarfs are not necessarily correlated with optical features or star forming regions (e.g., Hunter et al., 1999, 2001). Studies of the relationship between star formation and H i velocity dispersions in dwarf galaxies may therefore help address the question of what provides the energy to drive H i turbulence, particularly in regions where other proposed turbulence drivers are inefficient.

Stilp et al. (2013a, hereafter Paper I) presented a method to characterize the average H i kinematics in dwarf galaxies by co-adding individual line-of-sight profiles after removal of the rotational velocity for a single galaxy, as also used by Ianjamasimanana et al. (2012). These “superprofiles” were composed of a central peak with higher-velocity wings to either side. We interpreted the central peak of the superprofile as representative of the average H i turbulent kinematics, with the higher velocity wings representing anomalous motions such as expanding H i holes or other bulk flows. Our conclusions in Paper I were limited by the fact that the superprofiles were generated on global scales, whereas H i velocity dispersions are known to vary across the disk.

In this paper, we extend the technique presented in Paper I to analyze subregions of these same galaxies. By extending our analysis to carefully-chosen subregions, we can essentially increase the dynamic range of various quantities, such as ΣSFRsubscriptΣSFR\Sigma_{\mathrm{SFR}}, ΣHIsubscriptΣHI\Sigma_{\mathrm{HI}}, and ΣSFRsubscriptΣSFR\Sigma_{\mathrm{SFR}} / ΣHIsubscriptΣHI\Sigma_{\mathrm{HI}}, which were forced to galaxy-wide averages in our earlier analysis. In contrast, many of the proposed drivers of turbulence are local phenomena. This approach therefore provides a more direct assessment of which parameters influence H i kinematics.

We first compute superprofiles in radial annuli to facilitate comparison with Tamburro et al. (2009), who found that star formation does not provide enough energy to drive H i velocity dispersions outside the optical radius r25subscript𝑟25r_{25} of spiral galaxies. However, radius is not necessarily a good proxy for local ISM properties like ΣSFRsubscriptΣSFR\Sigma_{\mathrm{SFR}} and ΣHIsubscriptΣHI\Sigma_{\mathrm{HI}} in the low-mass dwarfs in our sample. We therefore also generate superprofiles in regions of constant ΣSFRsubscriptΣSFR\Sigma_{\mathrm{SFR}} to maximize the sensitivity of the effects that star formation may have on H i kinematics. Our study is complementary to that of Tamburro et al. (2009), as we focus on lower-mass galaxies and isolate regions with similar star formation surface density.

The layout of this chapter is as follows. In § 2, we discuss the data used to generate spatially-resolved superprofiles and other galaxy properties. In § 3, we give a brief overview of the method used to generate the superprofiles, present the spatially-resolved superprofiles, and address their robustness. In § 4, we compare the superprofile parameters to galaxy physical properties. In § 5, we then discuss the relevant correlations and compare star formation energy to H i energy. Finally, we summarize the conclusions in § 6. Figures of the spatially-resolved superprofiles for the entire sample are presented in Appendix B as a general reference.

2 Data

We use H i data from the Very Large Array ACS Nearby Galaxy Survey Treasury Program (“VLA-ANGST”; Ott et al., 2012) and The H i Nearby Galaxy Survey (“THINGS”; Walter et al., 2008). Following Paper I, we convolve these data to a common physical resolution of 200 pc to ensure that we are sampling ISM properties on the same physical scale for our entire sample. All spatially-resolved ancillary data have also been convolved to this resolution to ensure a robust comparison between H i kinematics and other ISM properties. We assume distances as listed in Table 1 of Paper I, as compiled from Ott et al. (2012), Walter et al. (2008), and Dalcanton et al. (2009).

2.1 Initial Sample Selection

We select our analysis sample for this paper from a subset of galaxies in Paper I. Briefly, the selection criteria used in Paper I are:

  1. 1.

    Instrumental angular resolution smaller than 200 pc, to avoid artificially broadening H i line-of-sight spectra at coarser resolution.

  2. 2.

    Velocity resolution Δv2.6Δ𝑣2.6\Delta v\leq 2.6 km s-1, to resolve the width of the H i line-of-sight spectra.

  3. 3.

    Inclination i<70𝑖70i<70, to avoid broadening H i line-of-sight spectra with rotation.

  4. 4.

    No noticeable contamination from the Milky Way or a companion, to ensure that detected H i belongs to each galaxy.

  5. 5.

    More than 10 independent beams across the galaxy above a signal to noise threshold of S/N>5𝑆𝑁5S/N>5, to allow for accurate determination of the peak of H i line-of-sight spectra.

  6. 6.

    Available ancillary far ultraviolet (FUV, GALEX) data, to uniformly measure SFRs.

In this paper, we apply additional selection criteria to the spatially-resolved superprofiles to ensure that they are robust. We have empirically found that superprofiles with fewer than 5 contributing independent beams are too noisy to accurately determine superprofile parameters, which eliminates four low-mass galaxies (DDO 125, M81 DwB, NGC 4163, and GR 8) from the Paper I sample. Second, the superprofiles in the other disks of some of the larger galaxies exhibit “clean bowls” that hinder accurate parameterization. These clean bowls are due to missing short-spacings at the VLA, and can present as negative flux on either side of the central peak in the superprofiles generated at large radii for some galaxies. We eliminate these superprofiles from our analysis, and note that they usually occur past 2r252subscript𝑟252r_{25}.

General properties of the final sample are given in Table LABEL:tab:resolved--sample-full. Galaxies are listed in order of decreasing total baryonic mass (Mbaryon,totsubscript𝑀baryontotM_{\mathrm{baryon,tot}}). We list: (1) the galaxy name; (2) the H i survey from which data were taken; (3-4) the position in J2000 coordinates; (5) distance in Mpc; (6) inclination in degrees; (7) total baryonic mass, Mbaryon,totsubscript𝑀baryontotM_{\mathrm{baryon,tot}}; (8) total H i mass, MHI,totsubscript𝑀HItotM_{\mathrm{HI,tot}}; (9) SFR as determined from FUV+24μ𝜇\mum emission; (10) the peak ΣSFRsubscriptΣSFR\Sigma_{\mathrm{SFR}} included in this analysis for each galaxy; (11) the optical radius at a B𝐵B-band surface brightness of 25 mag arcsec-1 (r25subscript𝑟25r_{25}); and (12) de Vaucouleurs T-type. All references are given in Paper I, with the exception of the inclination for Sextans B. The i=52𝑖52i=52 value given in Paper I is a poor match to the H i morphology; we adopt i=30𝑖30i=30, which is a much better match to the properties of the H i disk.

2.2 Converting Ancillary Data to Physical Properties

Detailed information about the data used and methodology for deriving galaxy physical properties are given in Paper I. For this study in particular, we focus on the SFR surface density (ΣSFRsubscriptΣSFR\Sigma_{\mathrm{SFR}}); the star formation rate per available H i mass (ΣSFRsubscriptΣSFR\Sigma_{\mathrm{SFR}} / ΣHIsubscriptΣHI\Sigma_{\mathrm{HI}}); and the H i and baryonic surface densities (ΣHIsubscriptΣHI\Sigma_{\mathrm{HI}}, ΣbaryonsubscriptΣbaryon\Sigma_{\mathrm{baryon}}). Briefly, we calculate ΣSFRsubscriptΣSFR\Sigma_{\mathrm{SFR}} using FUV and 24μ𝜇\mum data from the Local Volume Legacy Survey (“LVL”; Dale et al., 2009) and the methodology outlined in Leroy et al. (2008) and Paper I. We derive stellar surface mass density from LVL 3.6μ𝜇\mum data and apply the conversion factor given in Leroy et al. (2008) and Paper I. Finally, we derive baryonic surface mass density by combining the H i gas mass, including a factor of 1.36 correction for helium, with the stellar mass. All surface densities are inclination-corrected.

For each superprofile subregion, we calculate ΣHIsubscriptΣHI\Sigma_{\mathrm{HI}}, ΣbaryonsubscriptΣbaryon\Sigma_{\mathrm{baryon}}, and ΣSFRsubscriptΣSFR\Sigma_{\mathrm{SFR}}{} by taking the total MHIsubscript𝑀HIM_{\mathrm{HI}}, Mbaryonsubscript𝑀baryonM_{\mathrm{baryon}}, and SFR in that subregion divided by its inclination-corrected area. We also calculate ΣSFR/ΣHIsubscriptΣSFRsubscriptΣHI\Sigma_{\mathrm{SFR}}{}/\Sigma_{\mathrm{HI}}{} by measuring the total SFR in that subregion divided by the total H i mass in that subregion. In the outer regions of Sextans B, the low levels of star formation plus noise conspire to produce negative total SFRs in three resolved superprofiles. In these cases, we artificially set ΣSFR=106subscriptΣSFRsuperscript106\Sigma_{\mathrm{SFR}}{}=10^{-6} MsubscriptMdirect-product\mathrm{M}_{\odot} yr-1 kpc-2 and recalculate other SF-related quantities using that value.

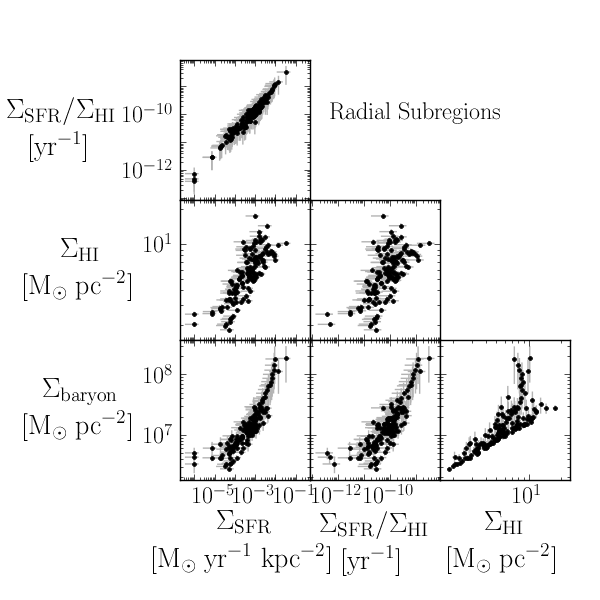
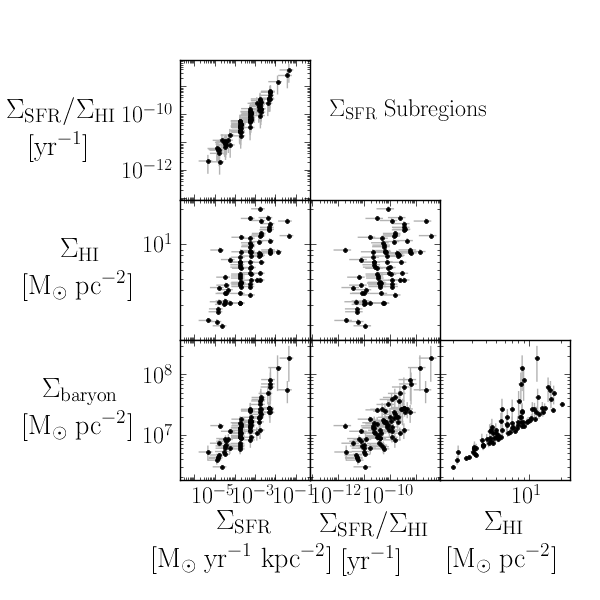
We note that local ISM properties tend to be correlated; for example, regions with higher ΣSFRsubscriptΣSFR\Sigma_{\mathrm{SFR}} tend to have higher ΣHIsubscriptΣHI\Sigma_{\mathrm{HI}}. In Figure 1, we show the correlations between ΣSFRsubscriptΣSFR\Sigma_{\mathrm{SFR}}, ΣSFR/ΣHIsubscriptΣSFRsubscriptΣHI\Sigma_{\mathrm{SFR}}{}/\Sigma_{\mathrm{HI}}{}, ΣHIsubscriptΣHI\Sigma_{\mathrm{HI}}, and ΣbaryonsubscriptΣbaryon\Sigma_{\mathrm{baryon}} as measured in subregions of constant radius (left) or constant star formation intensity (right). All of the physical properties under consideration are correlated with each other, so a correlation with one may be causally due to another.
Refer to caption
Refer to caption
Figure 1: Correlations between measured ISM properties (ΣSFRsubscriptΣSFR\Sigma_{\mathrm{SFR}}, ΣSFR/ΣHIsubscriptΣSFRsubscriptΣHI\Sigma_{\mathrm{SFR}}{}/\Sigma_{\mathrm{HI}}{}, ΣHIsubscriptΣHI\Sigma_{\mathrm{HI}}, ΣbaryonsubscriptΣbaryon\Sigma_{\mathrm{baryon}}) in subregions with constant radius (left) or constant star formation intensity (right). All axes are shown with log scaling, and the scaling of each individual panel is the same in the top and bottom panels. The resolved superprofiles are described further in § 3.3. The quantized lines in the left panel are an artifact of the ΣSFRsubscriptΣSFR\Sigma_{\mathrm{SFR}} binning.

3 Analysis

To estimate H i kinematics on spatially-resolved scales, we generate superprofiles in multiple subregions for each sample galaxy. We first give a brief overview of the methodology for generating and parameterizing the superprofiles in § 3.1 and § 3.2. We then discuss in detail how we generate superprofiles in spatially-resolved subregions for the sample in § 3.3.

3.1 Overview of the Superprofile Generation Procedure

A full discussion of the method used to derive superprofiles is given in Paper I, but we review the process here for clarity. We first measure the line-of-sight velocity of the peak (vpeaksubscript𝑣peakv_{\mathrm{peak}}) of each line-of-sight spectrum, by fitting a Gauss-Hermite polynomials using the standard data cube. We include only the line-of-sight spectra that have S/N>5𝑆𝑁5S/N>5, where S/N𝑆𝑁S/N is defined as the ratio between the maximum of the Gauss-Hermite polynomial and the noise in a single channel; simulations show that this S/N𝑆𝑁S/N threshold results in an uncertainty of <2absent2<2 km s-1 in the measured vpeaksubscript𝑣peakv_{\mathrm{peak}}. Finally, we shift each selected line-of-sight spectrum in the flux-rescaled data cube by its vpeaksubscript𝑣peakv_{\mathrm{peak}}. During this process, we interpolate the spectra by a factor of 10, because vpeaksubscript𝑣peakv_{\mathrm{peak}} can often be measured to a better accuracy than the width of a channel. These shifted spectra are then co-added to produce a flux-weighted average H i spectrum, or “superprofile.”

As discussed in Paper I, we estimate the noise on each pixel of the superprofiles using:

σSP=σchan×NpixNpix/beam×FrescaledFstandard,subscript𝜎SPsubscript𝜎chansubscript𝑁pixsubscript𝑁pixbeamsubscript𝐹rescaledsubscript𝐹standard\sigma_{\mathrm{SP}}=\sigma_{\mathrm{chan}}\times\sqrt{\frac{N_{\mathrm{pix}}}{N_{\mathrm{pix/beam}}}}\times\frac{F_{\mathrm{rescaled}}}{F_{\mathrm{standard}}}, (1)

where σchansubscript𝜎chan\sigma_{\mathrm{chan}} is the rms noise in a single channel, Npix/Npix/beamsubscript𝑁pixsubscript𝑁pixbeamN_{\mathrm{pix}}/N_{\mathrm{pix/beam}} is the number of independent resolution elements contributing to each superprofile point, and Frescaled/Fstandardsubscript𝐹rescaledsubscript𝐹standardF_{\mathrm{rescaled}}/F_{\mathrm{standard}} is a factor that approximates the flux-rescaling process in the flux-rescaled data cube.

3.2 Overview of Superprofile Parameterization

We show an example of a global superprofile in Figure 2 from Paper I. The superprofile itself is shown as a thick black line; the uncertainties are smaller than the width of the superprofile line. The central peak is largely Gaussian, with only 5similar-toabsent5\sim 5% deviations, with excess flux in the wings of the superprofile. In Paper I, we proposed that the superprofiles could be parameterized as a turbulent peak, with wings to either side representing higher-velocity H i. We adopt the same physical interpretation in this study.

Refer to caption
Figure 2: The global superprofile for Sextans A, from Paper I. The superprofile itself is shown as the thick black line. The uncertainties are smaller than the width of the line. The dashed red line shows the HWHM-scaled Gaussian model. The shaded red regions between the dashed red line and the superprofile represent H i in the wings of the profile, fwingssubscript𝑓wingsf_{\mathrm{wings}}. The solid red lines at σwings±23similar-tosubscript𝜎wingsplus-or-minus23\sigma_{\mathrm{wings}}\sim\pm 23 km s-1 represent the excess-flux-weighted root mean square velocity of the wings. Because the superprofiles are the analog of integrated line profiles but with each contributing spectra shifted by its vpeaksubscript𝑣peakv_{\mathrm{peak}}, we have shown the y-axis in Jy.

We first parameterize the central peak of the superprofile with a Gaussian profile whose amplitude and half-width half-maximum (HWHM) are matched to those of the superprofile. We adopt the standard deviation of this Gaussian profile as the width of the central peak (σcentralsubscript𝜎central\sigma_{\mathrm{central}}). The HWHM-scaled Gaussian profile for the global superprofile of Sextans A is shown as a dashed red line in Figure 2.

In addition to a Gaussian core, the superprofiles tend to have high velocity gas in excess of a single Gaussian extrapolation of the central peak. This excess high-velocity gas is shown in Figure 2 as the transparent red region between the HWHM-scaled Gaussian fit and the superprofile itself. We estimate the fraction of higher-velocity gas in the wings of the superprofile using:

fwings=|v|>HWHM[S(v)G(v)]|v|>0S(v),subscript𝑓wingssubscript𝑣HWHMdelimited-[]𝑆𝑣𝐺𝑣subscript𝑣0𝑆𝑣f_{\mathrm{wings}}{}=\frac{\displaystyle\sum\limits_{|v|>\mathrm{HWHM}}\left[S(v)-G(v)\right]}{\displaystyle\sum\limits_{|v|>0}S(v)}, (2)

where v𝑣v is the velocity, S(v)𝑆𝑣S(v) is the superprofile intensity at v𝑣v, and G(v)𝐺𝑣G(v) is the value of the HWHM-scaled Gaussian at v𝑣v.

We characterize the typical velocity of the wings using the rms velocity of excess flux in the wings:

σwings2=|v|>HWHM[S(v)G(v)]v2|v|>HWHM[S(v)G(v)].subscriptsuperscript𝜎2wingssubscript𝑣HWHMdelimited-[]𝑆𝑣𝐺𝑣superscript𝑣2subscript𝑣HWHMdelimited-[]𝑆𝑣𝐺𝑣\sigma^{2}_{\mathrm{wings}}{}=\frac{\displaystyle\sum\limits_{|v|>\mathrm{HWHM}}\left[S(v)-G(v)\right]v^{2}}{\displaystyle\sum\limits_{|v|>\mathrm{HWHM}}\left[S(v)-G(v)\right]}. (3)

The σwings2subscriptsuperscript𝜎2wings\sigma^{2}_{\mathrm{wings}} parameter provides an estimate of the energy per unit mass in the wings of the superprofile. In Figure 2, σwingssubscript𝜎wings\sigma_{\mathrm{wings}} is shown to either side of the profile as a solid vertical red line between the HWHM-scaled Gaussian profile and the superprofile.

Finally, we quantify the asymmetry of the entire superprofile around the peak using:

afull=v(S(v)S(v))2vS(v).subscript𝑎fullsubscript𝑣superscript𝑆𝑣𝑆𝑣2subscript𝑣𝑆𝑣a_{\mathrm{full}}=\frac{\displaystyle\sum\limits_{v}{\sqrt{\left(S(v)-S(-v)\right)^{2}}}}{\displaystyle\sum\limits_{v}{S(v)}}. (4)

This quantity differs from the asymmetry parameter a𝑎a used in Paper I, which was calculated only for the wings (|v|>HWHM𝑣HWHM|v|>\mathrm{HWHM}). In this study, we instead use the full asymmetry (afullsubscript𝑎fulla_{\mathrm{full}}) because the asymmetry of the wings alone is much more sensitive to noise, which has a larger effect on superprofiles calculated for galaxy subregions as they include less flux. Although the asymmetry parameter in this study may be tracing different effects than that used in Paper I, the change to afullsubscript𝑎fulla_{\mathrm{full}} is not extreme because the majority of the global superprofile asymmetry was due to the wings. We have verified that the global superprofiles presented in Paper I follow the same trends with afullsubscript𝑎fulla_{\mathrm{full}} as they do with a𝑎a.

The uncertainties on the superprofile parameters are discussed in detail in Appendix A.

3.3 Spatially-Resolved Superprofiles

In Paper I, we included all selected line-of-sight spectra in the superprofile to derive an average H i spectrum for the entire galaxy. In this study, we generate superprofiles in subregions for each galaxy, determined either by radius or by local ΣSFRsubscriptΣSFR\Sigma_{\mathrm{SFR}}.

First, we derive superprofiles in subregions of constant radius for the sample galaxies. We note that it is unlikely that radius itself is the actual driver of any trends, because H i kinematic properties are local and have no special knowledge about their location in the galaxy. Instead, any radial correlations are more likely to reflect the fact that other galaxy properties that do affect the local ISM also correlate with radius, such as ΣSFRsubscriptΣSFR\Sigma_{\mathrm{SFR}} and ΣHIsubscriptΣHI\Sigma_{\mathrm{HI}}, in large disks. We include this analysis because it facilitates comparison with Tamburro et al. (2009), who worked in radial annuli for more massive galaxies from the THINGS survey, although with a different methodology than we present here. We describe the superprofile generation on radial scales in more detail in § 3.3.1.

Second, we generate superprofiles in regions determined by the local ΣSFRsubscriptΣSFR\Sigma_{\mathrm{SFR}}. Because star formation is a commonly-cited candidate in the literature for the driver of H i turbulence, this choice allows us to directly explore how the superprofiles change as a function of local star formation properties. We discuss the ΣSFRsubscriptΣSFR\Sigma_{\mathrm{SFR}} superprofiles in more detail in § 3.3.2.

3.3.1 Superprofiles in Radial Subregions

First, we explore how the superprofiles behave as a function of radius. For the nine larger galaxies in our sample, we generate superprofiles in radially-resolved bins whose widths are chosen to be approximately two times the beam area, rounded to the nearest 0.05 r25subscript𝑟25r_{\mathrm{25}} after correcting for inclination. These bin widths correspond to physical sizes of 200500200500200-500 pc. For the 10 smaller dwarf galaxies with either small sizes or poorly-defined inclinations and position angles, it is impossible to generate reliable annuli with high signal-to-noise. In these cases, we instead generate superprofiles inside and outside r25subscript𝑟25r_{25} (typically 0.41.50.41.50.4-1.5 kpc; Table LABEL:tab:resolved--sample-full).

In Table LABEL:tab:resolved--sample-res, we list the properties of resolved superprofiles for the sample. We list (1) the galaxy name; (2) the number of beams across the entire galaxy at S/N>5𝑆𝑁5S/N>5; (3) the number of superprofiles in radial subregions that meet the selection criteria for the galaxy; (4) the maximum radius at which we were able to generate a superprofile; (5) the step size for radial annuli; and (6) the number of superprofiles in ΣSFRsubscriptΣSFR\Sigma_{\mathrm{SFR}} subregions that meet the selection criteria for the galaxy. For those galaxies where we have generated radial superprofiles only inside and outside r25subscript𝑟25r_{25}, we do not have values for rmaxsubscript𝑟maxr_{\mathrm{max}} or ΔrΔ𝑟\Delta r.

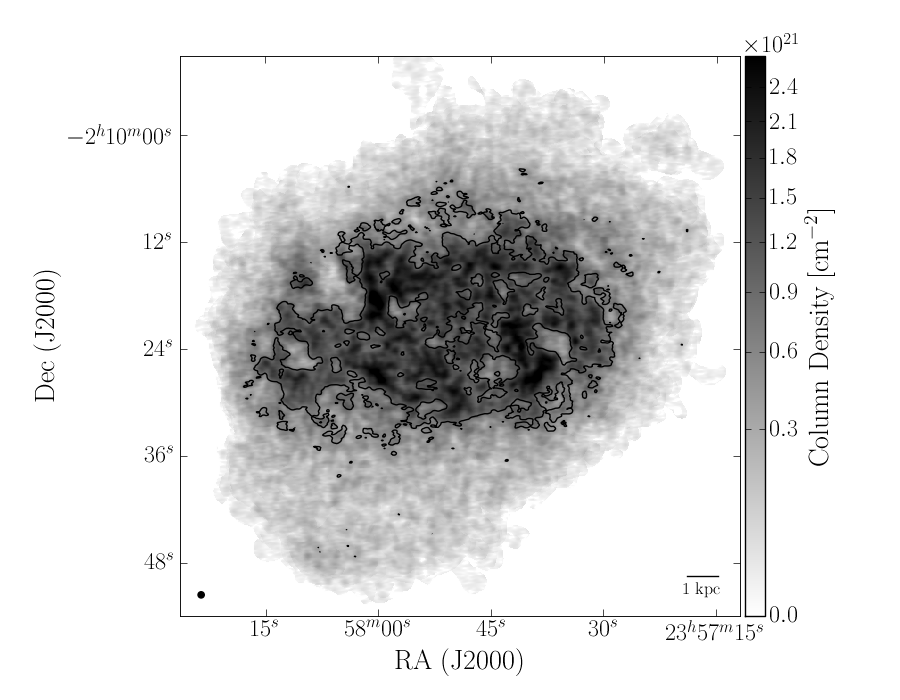
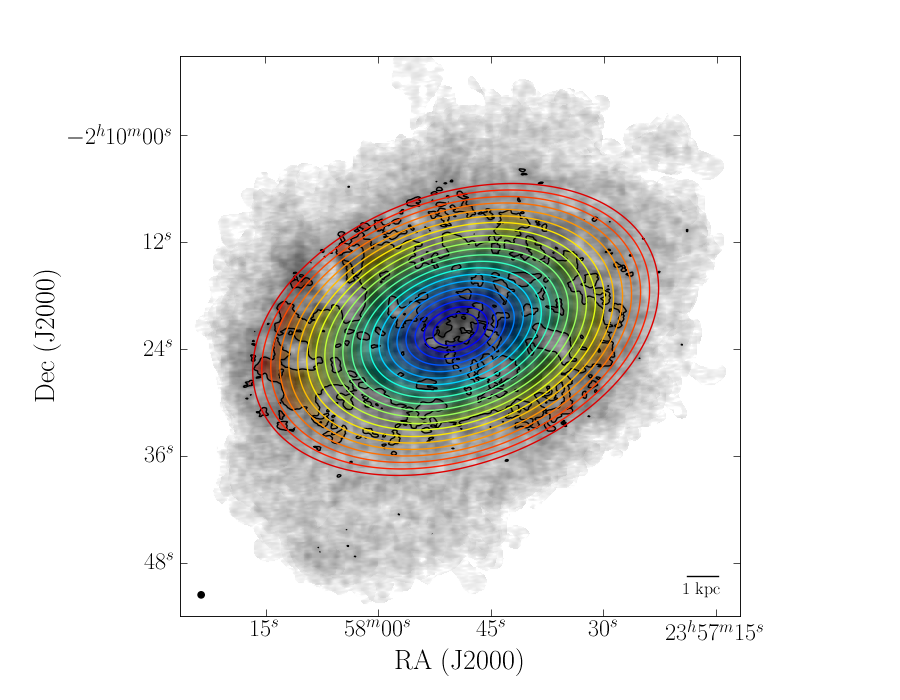
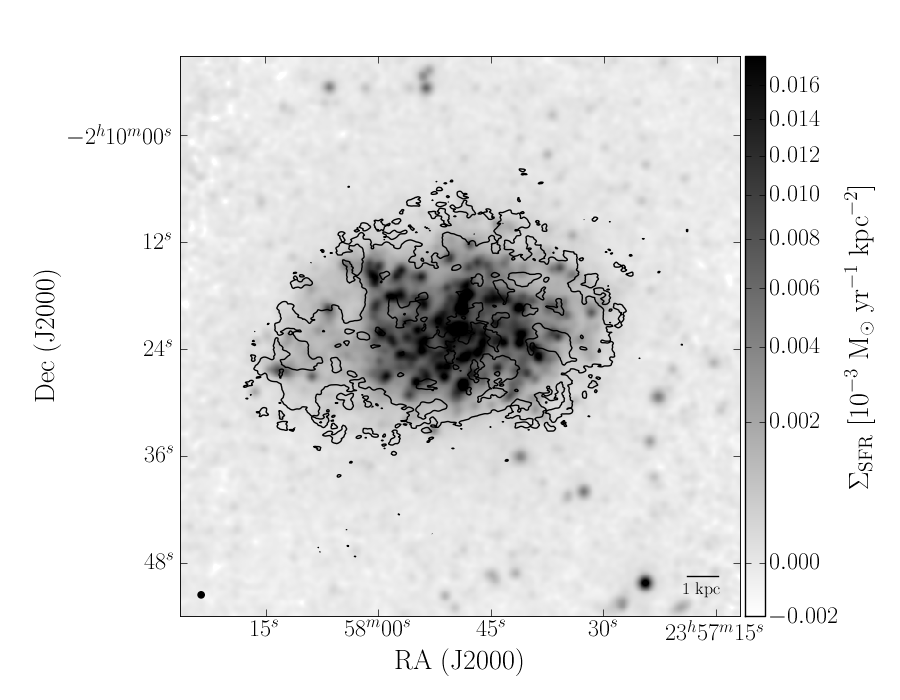
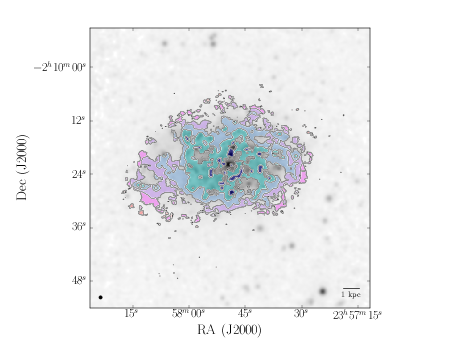
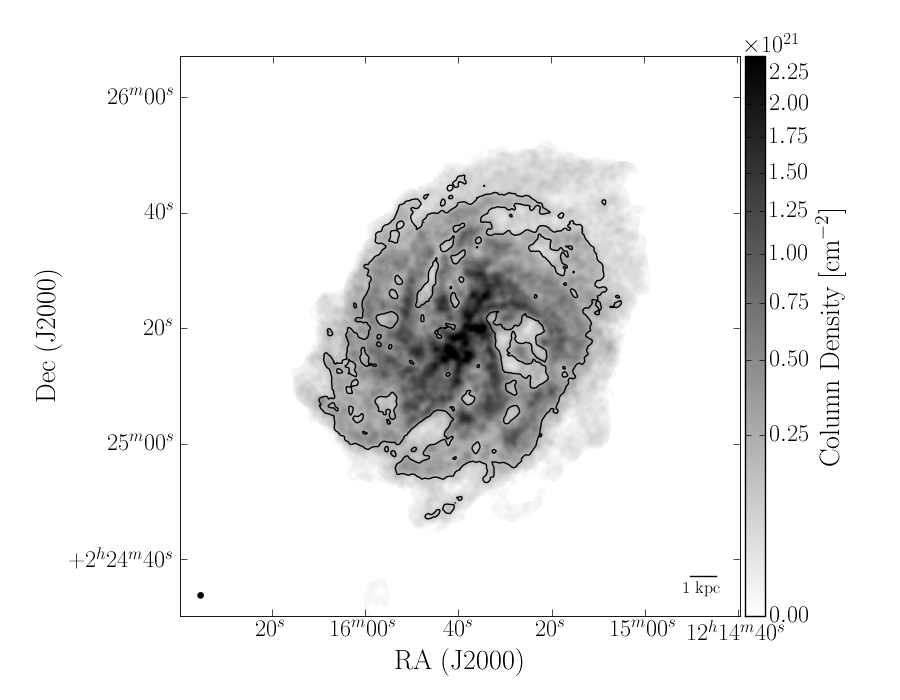
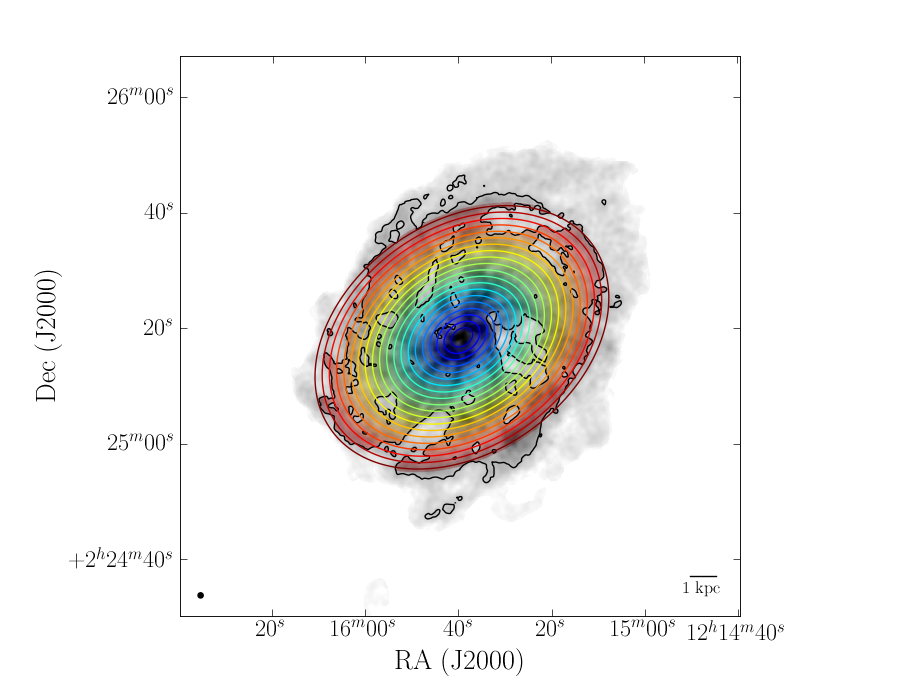
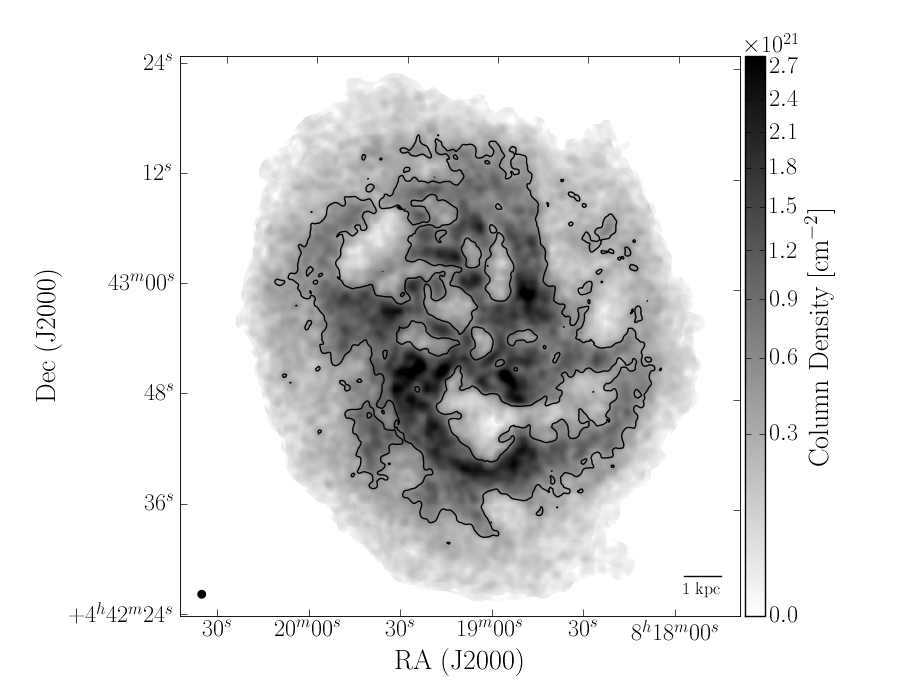
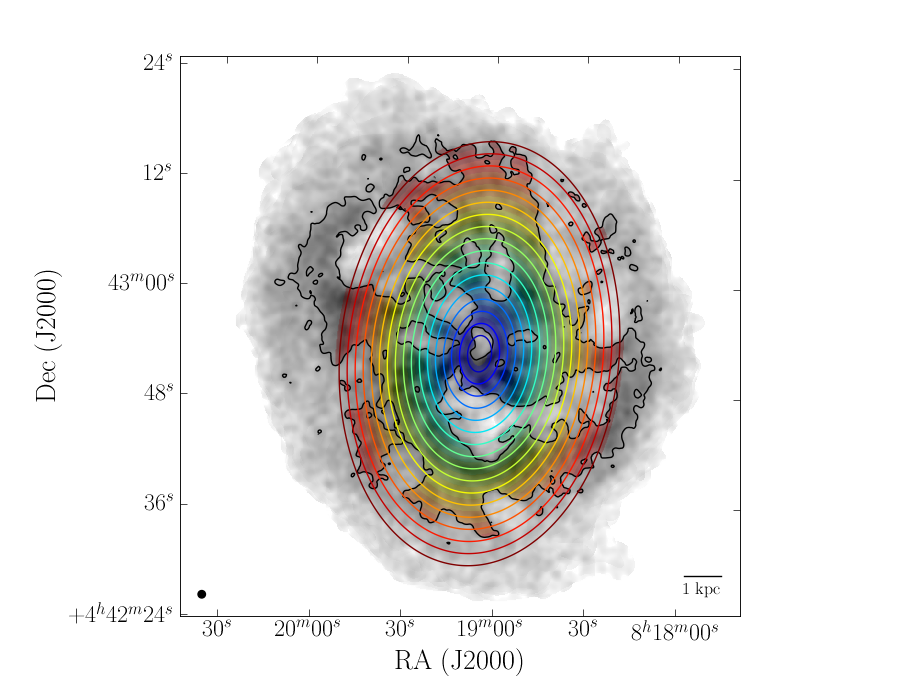
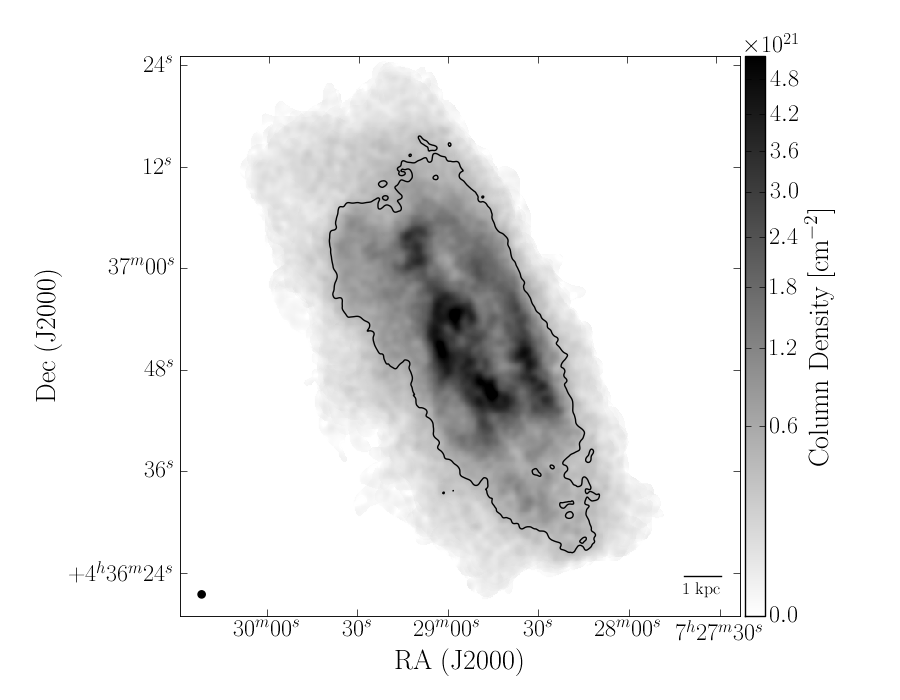
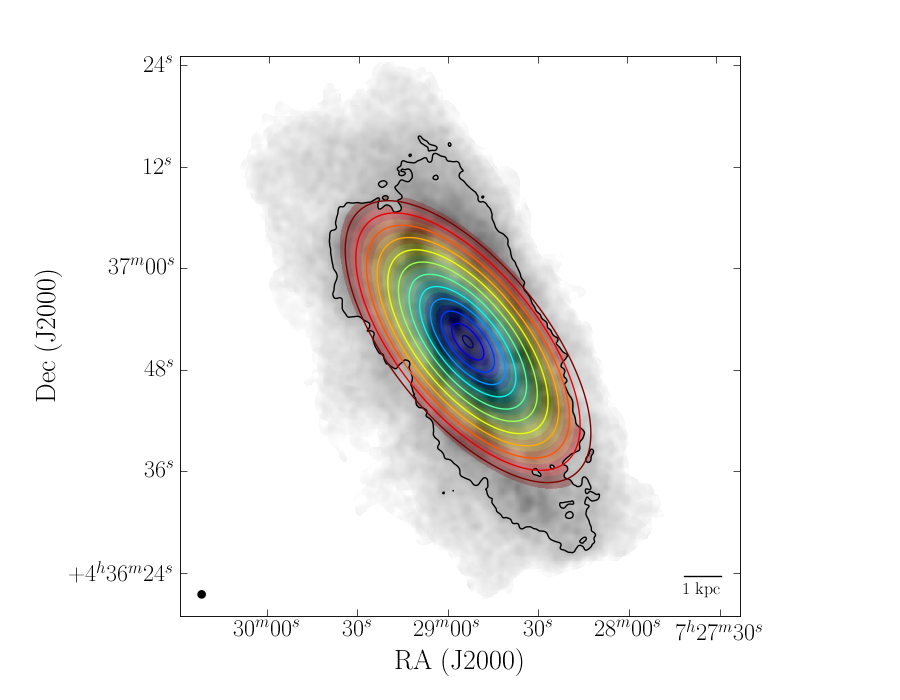
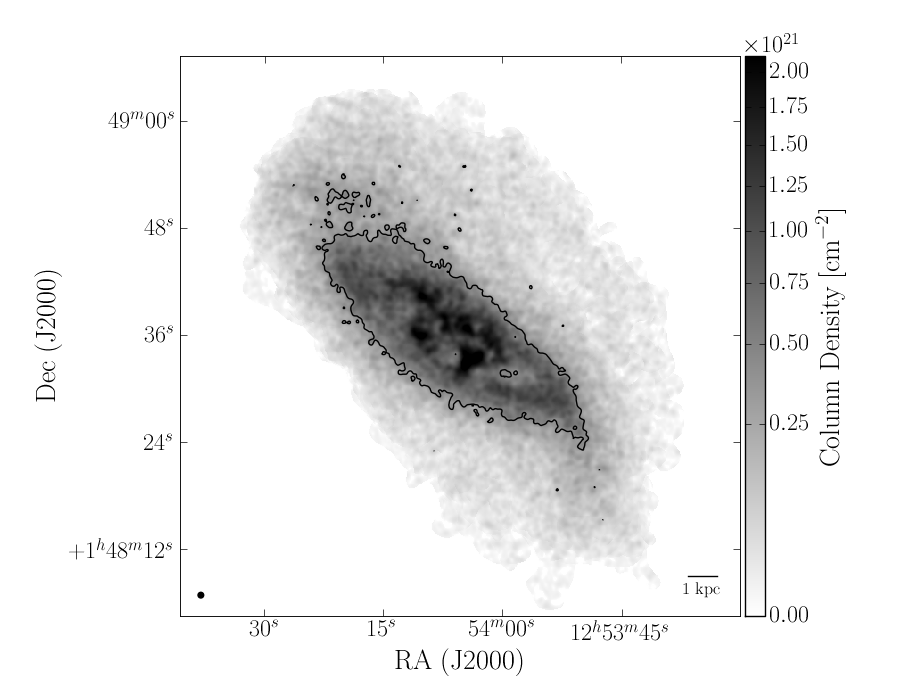
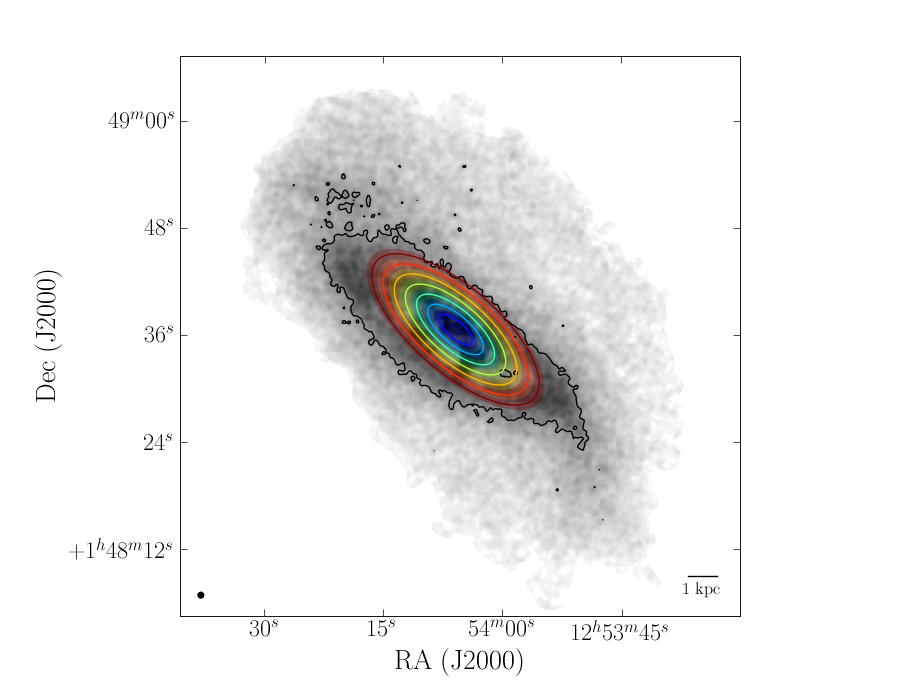
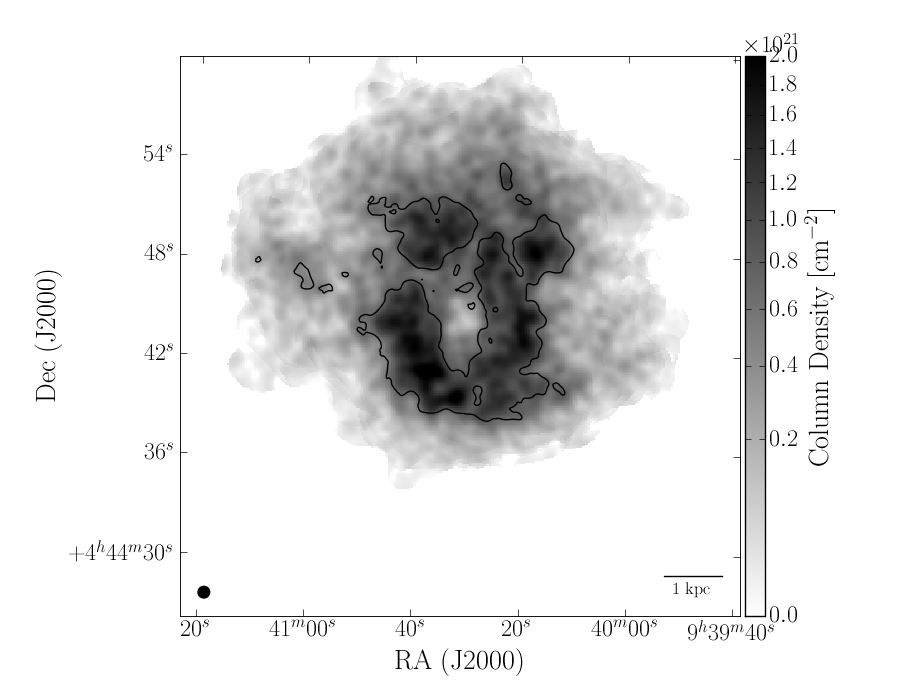
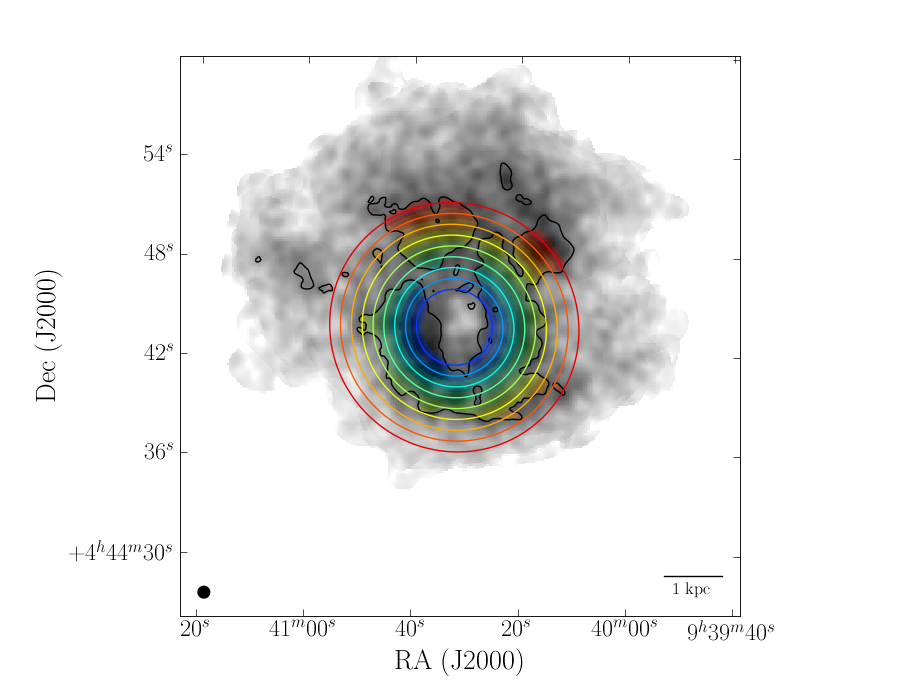
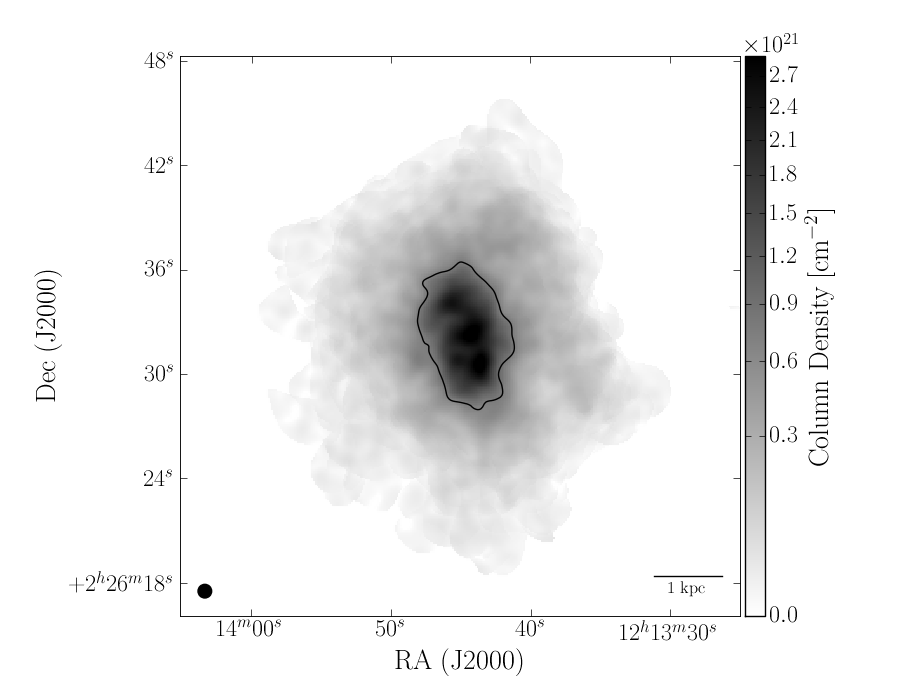
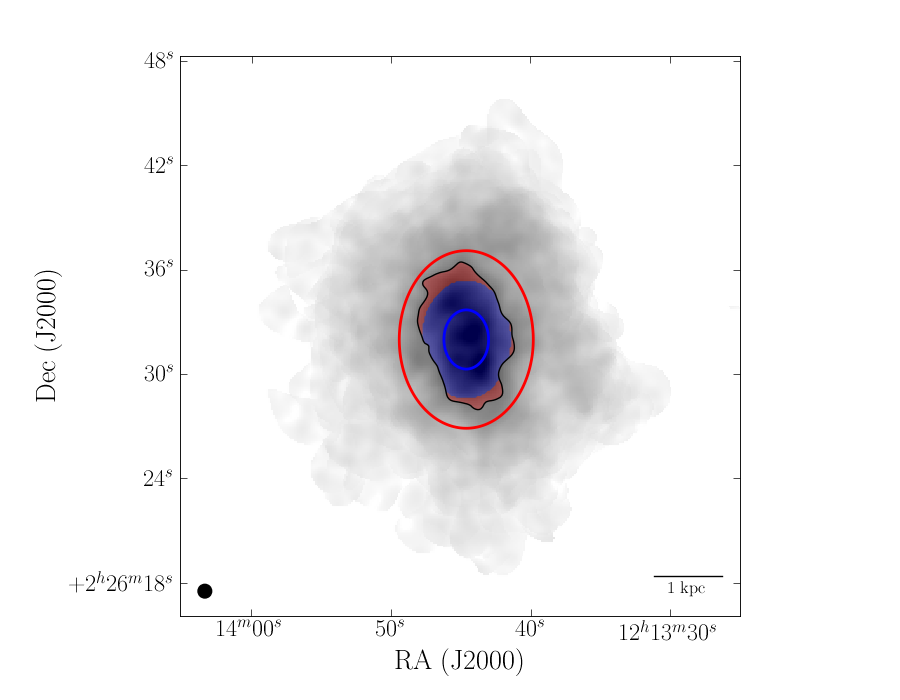
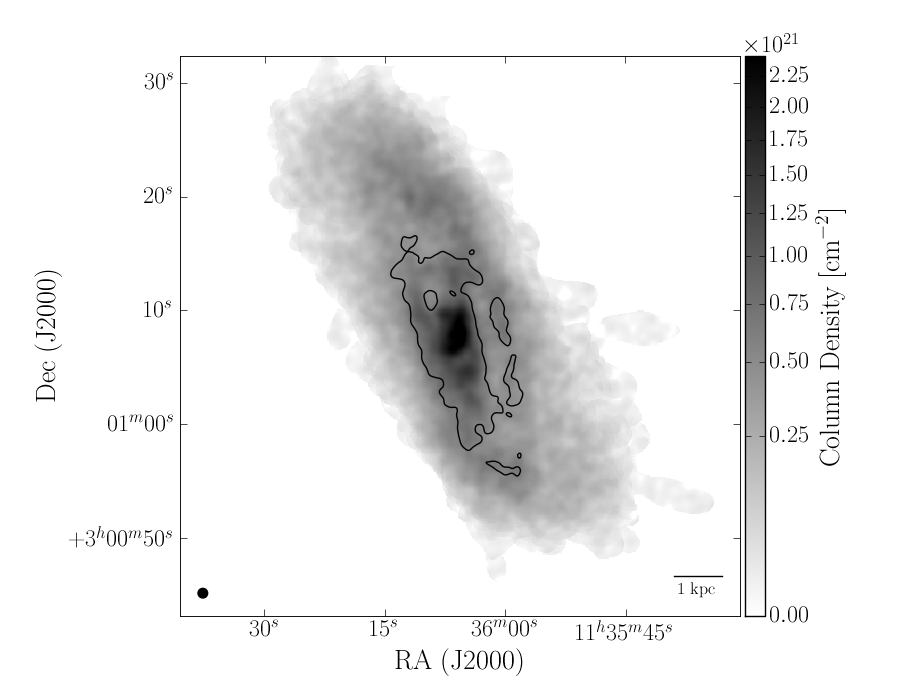
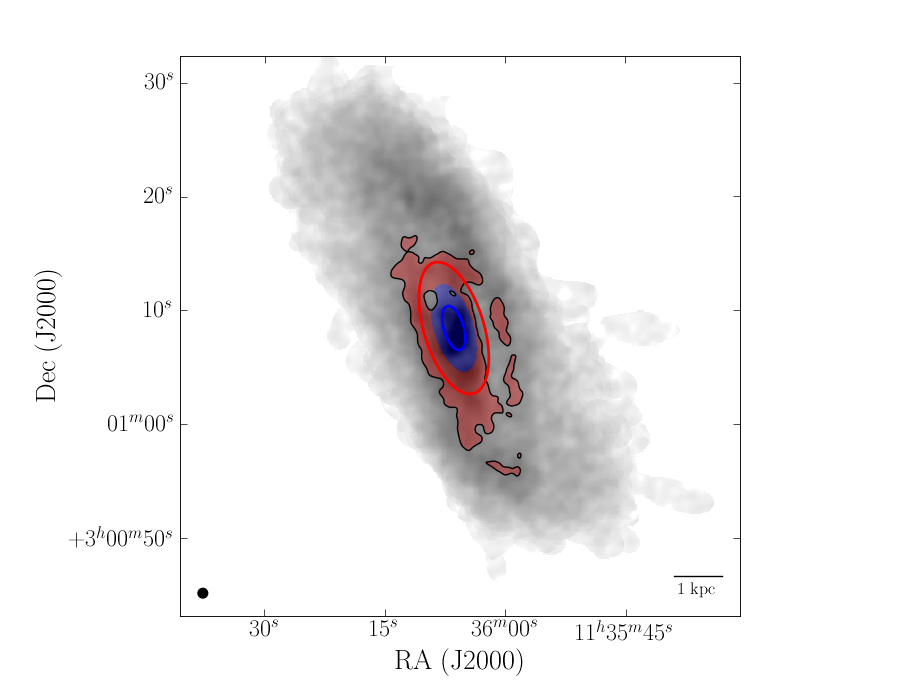
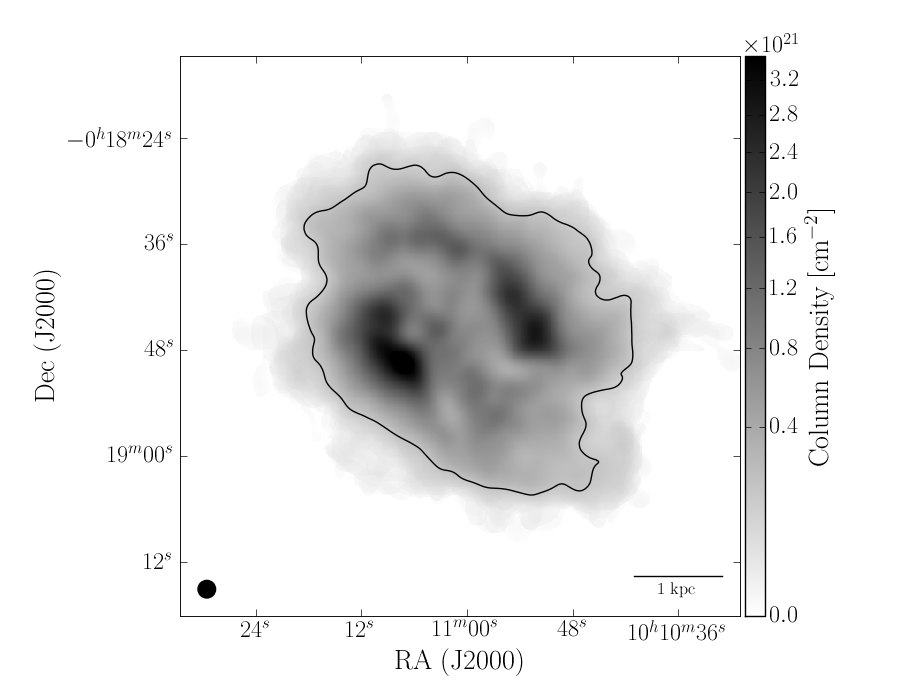
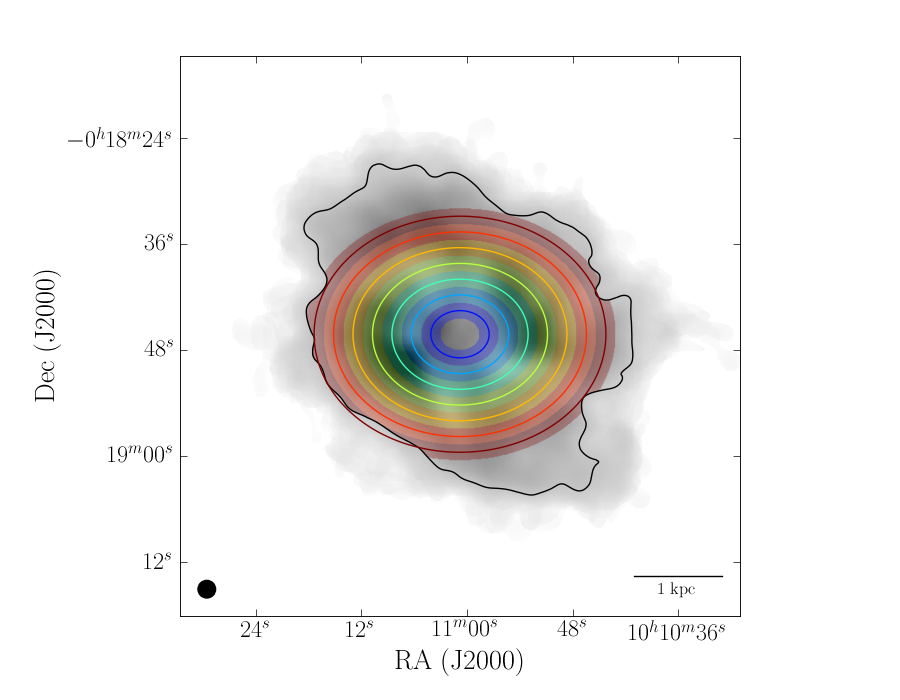
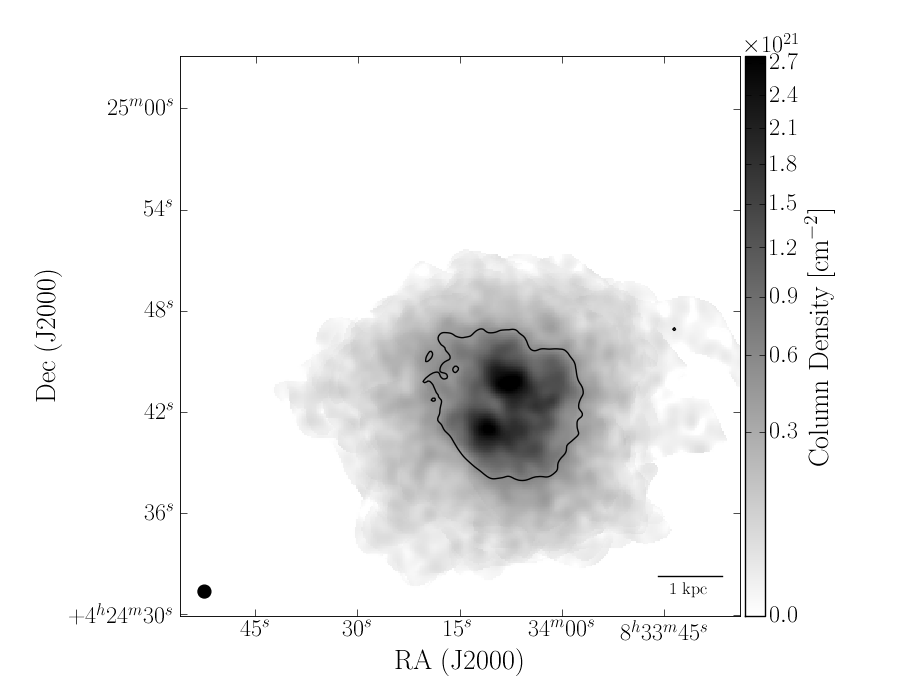
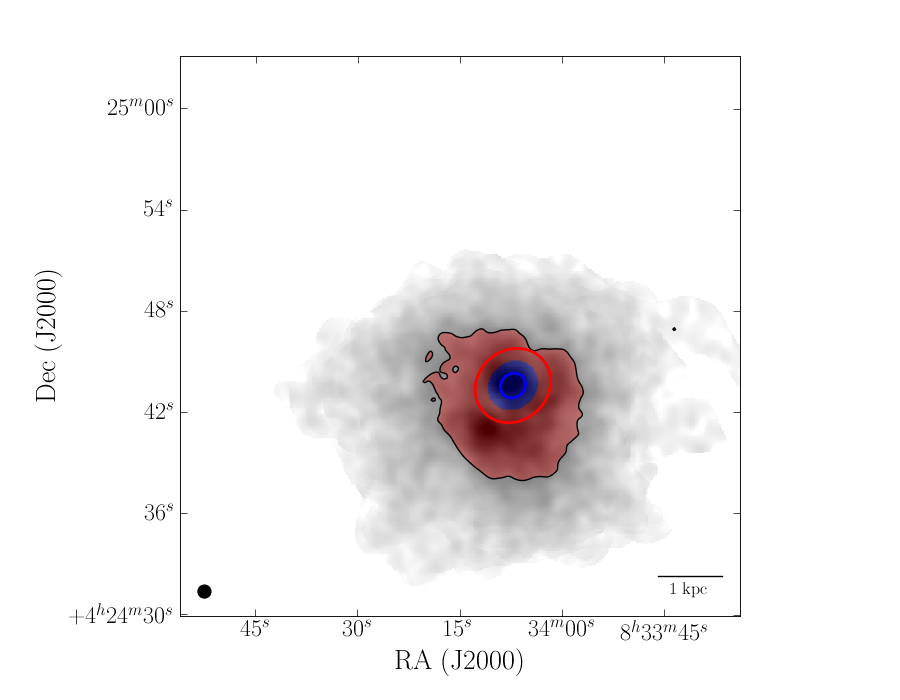
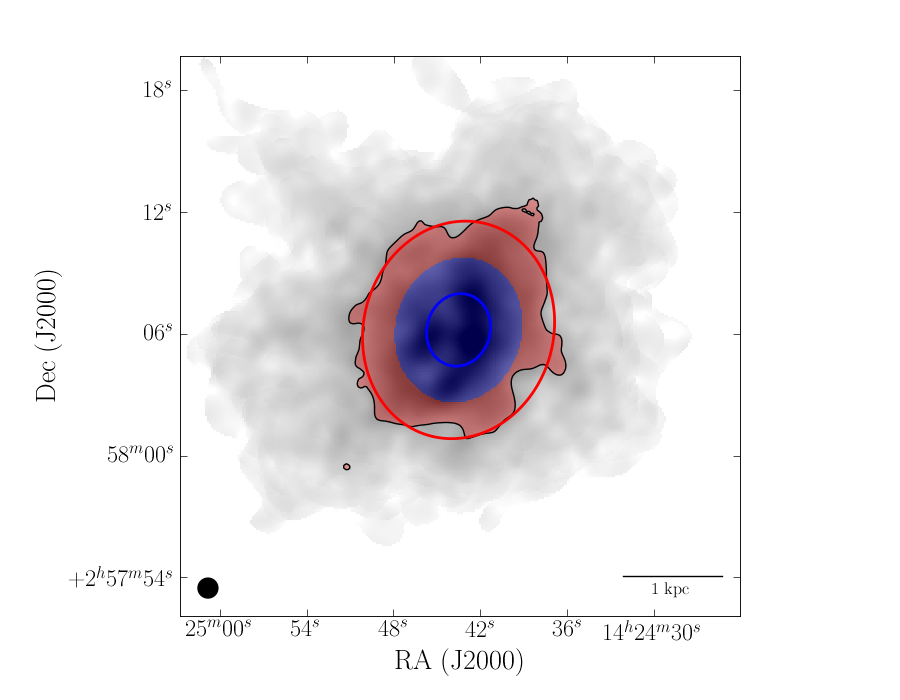
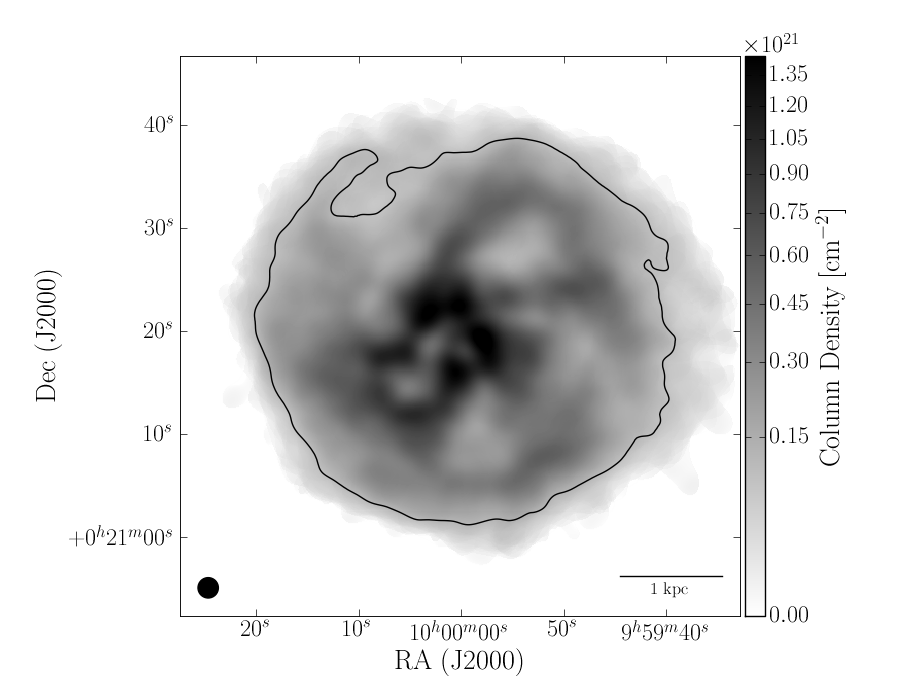
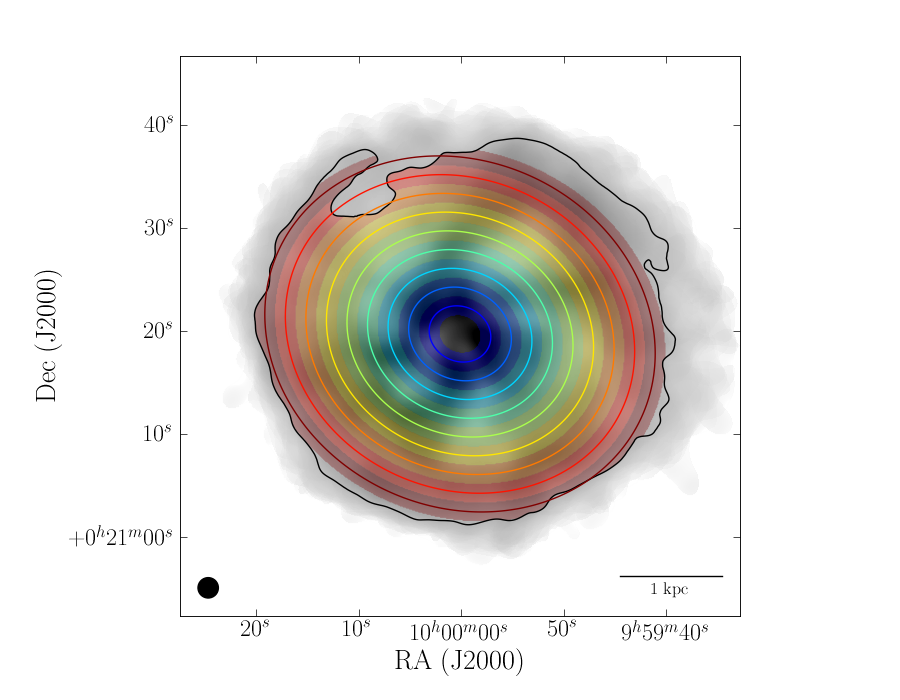
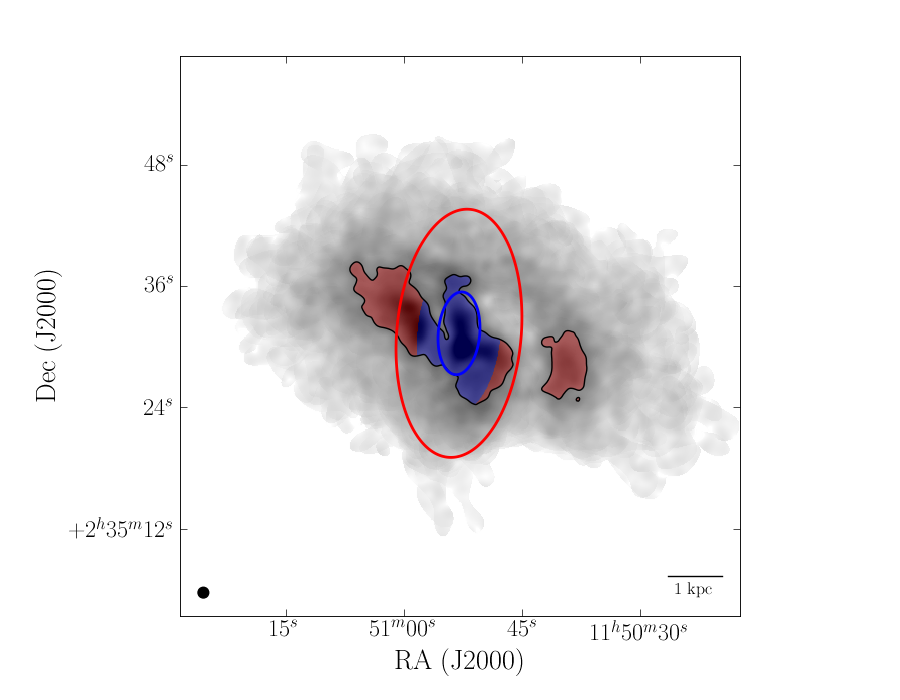
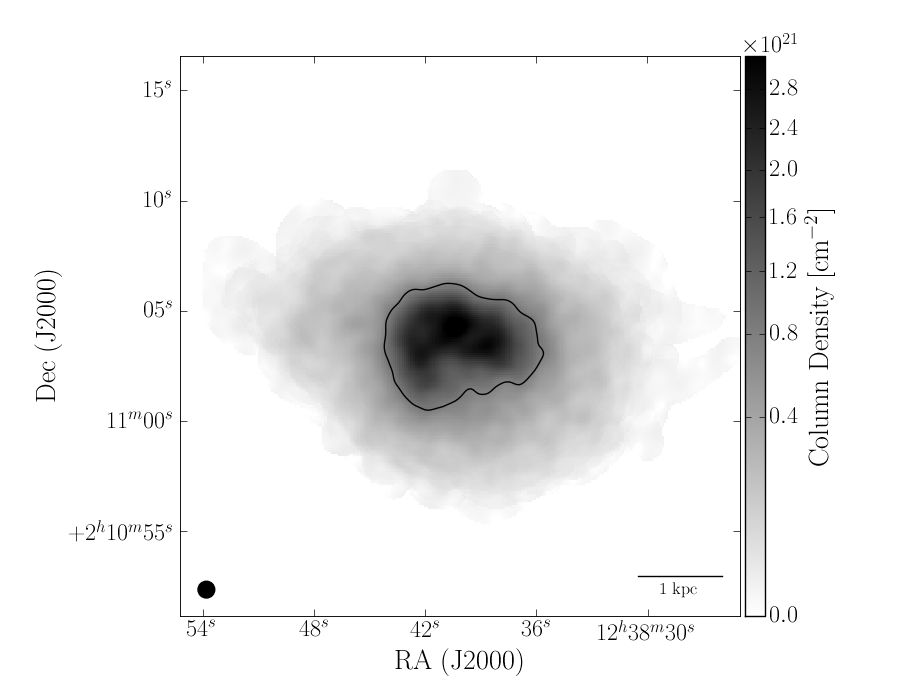
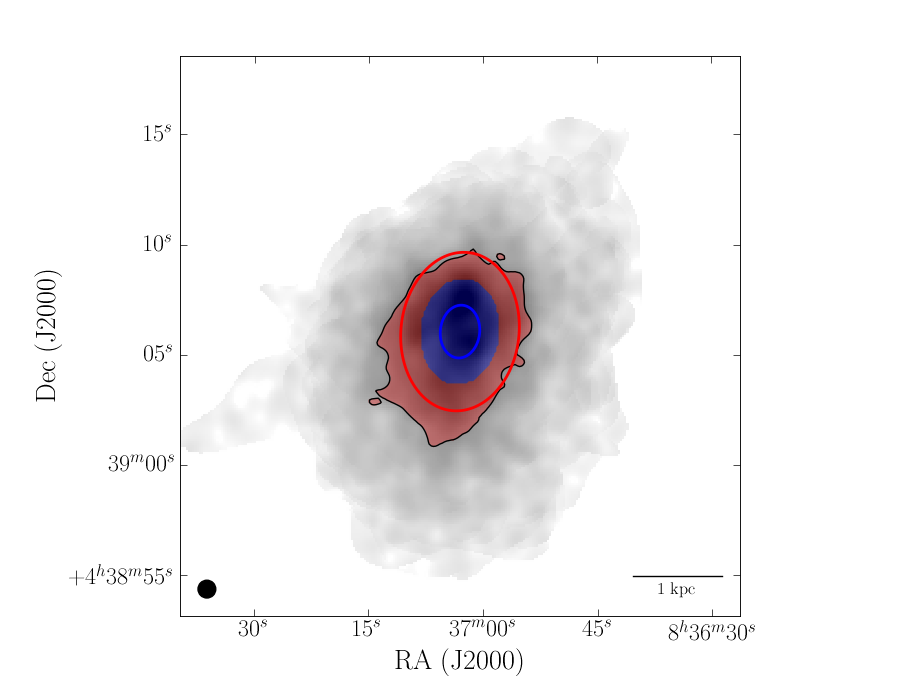
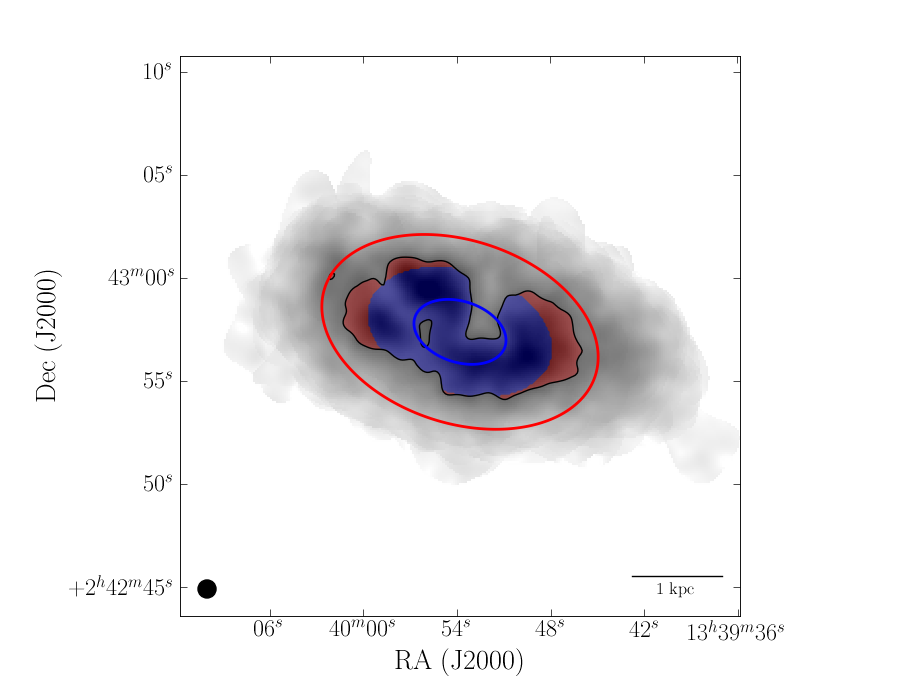
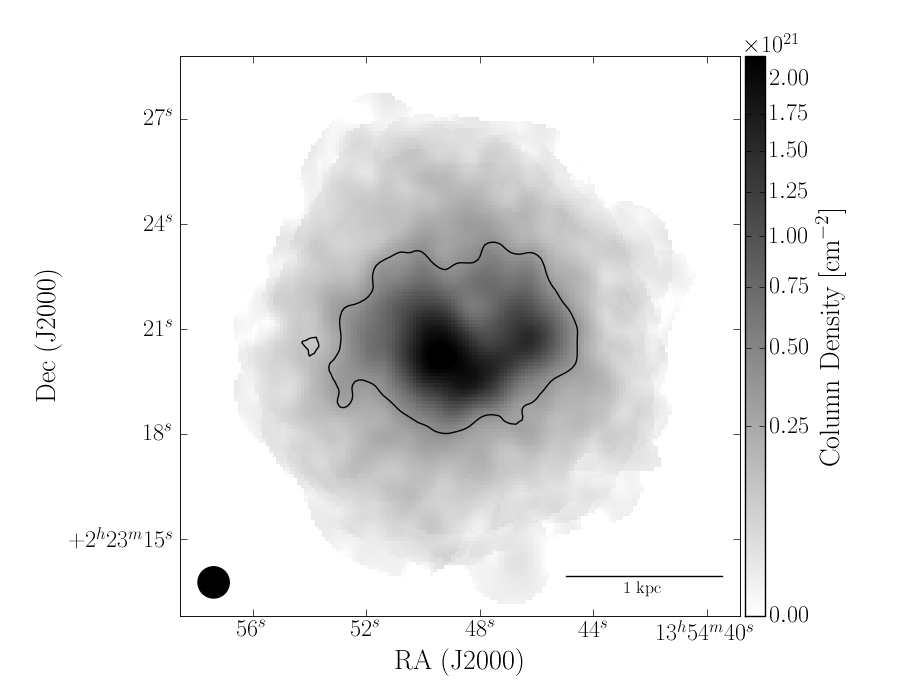
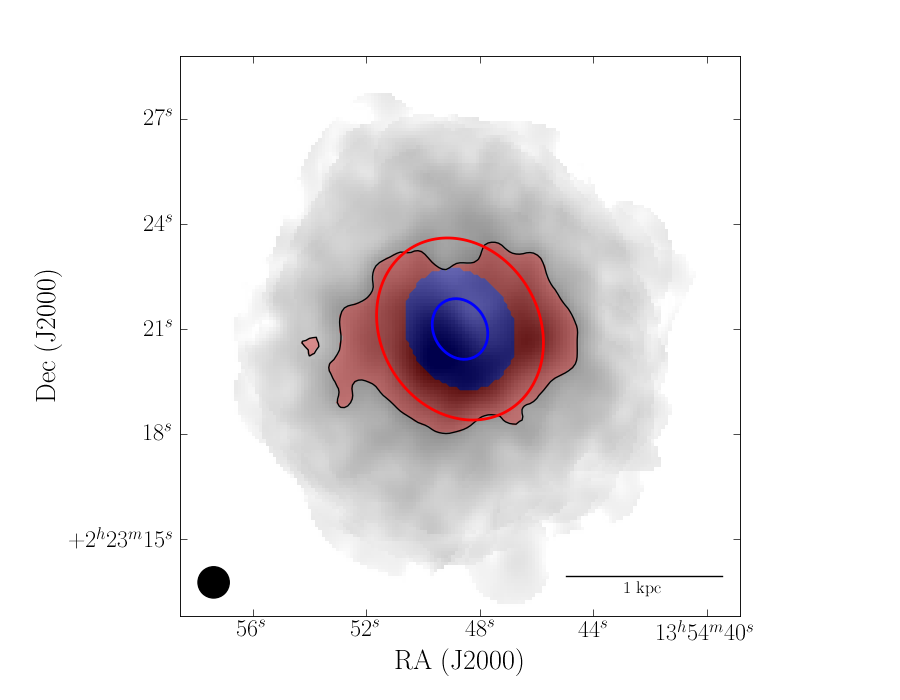
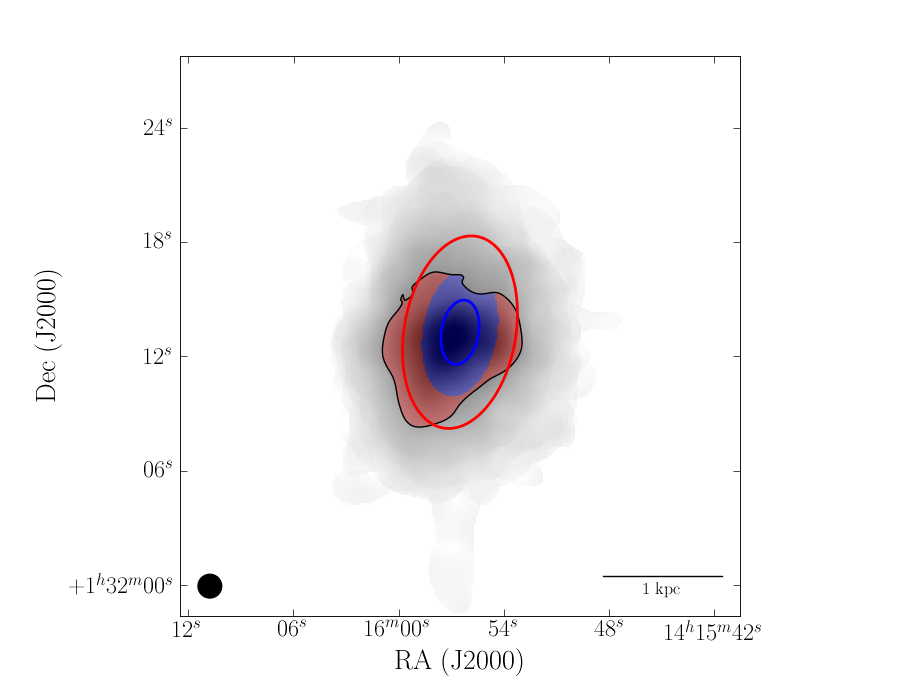
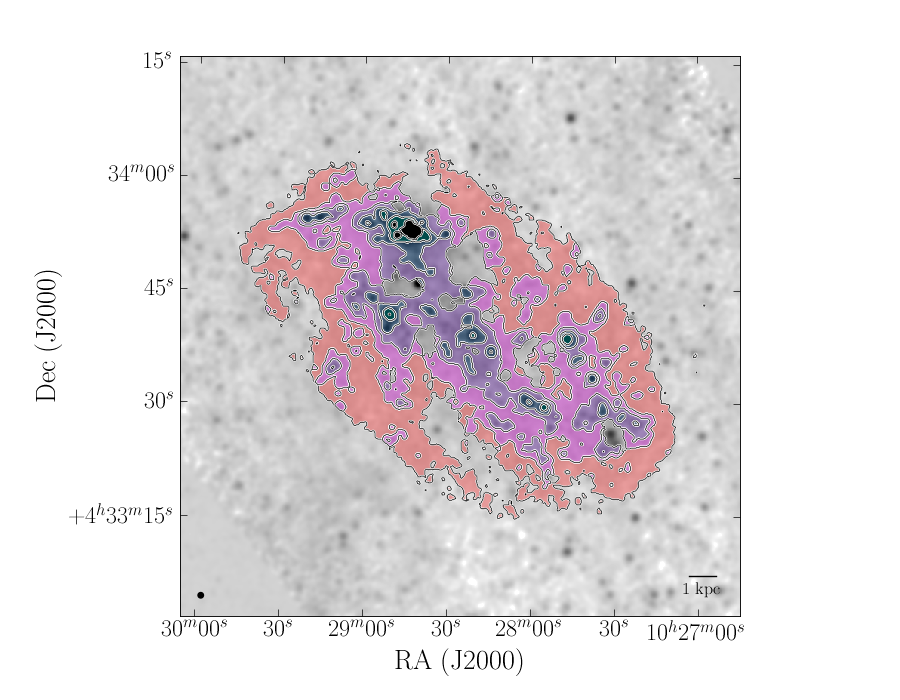
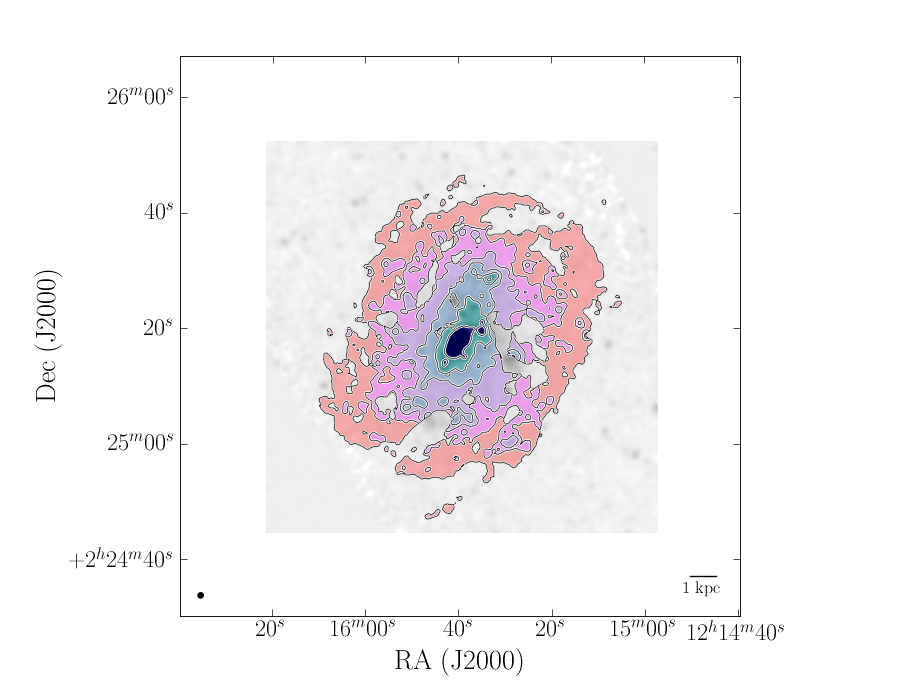
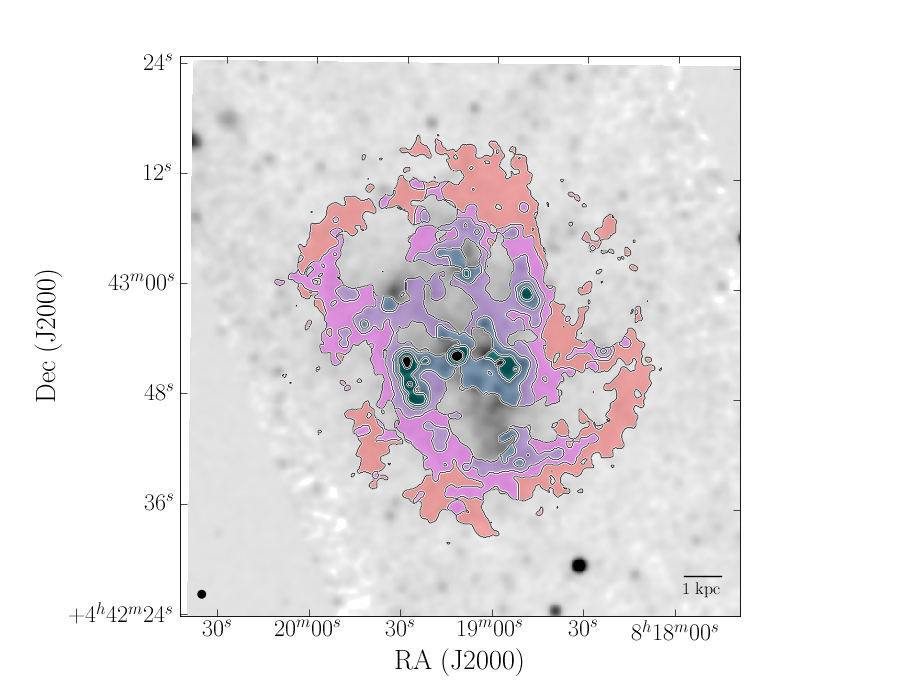
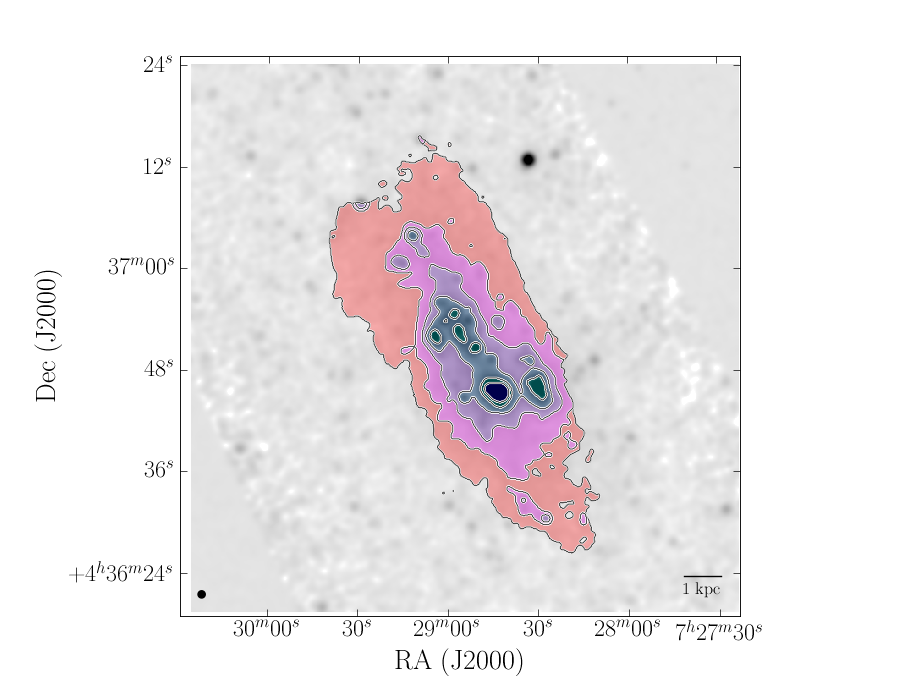
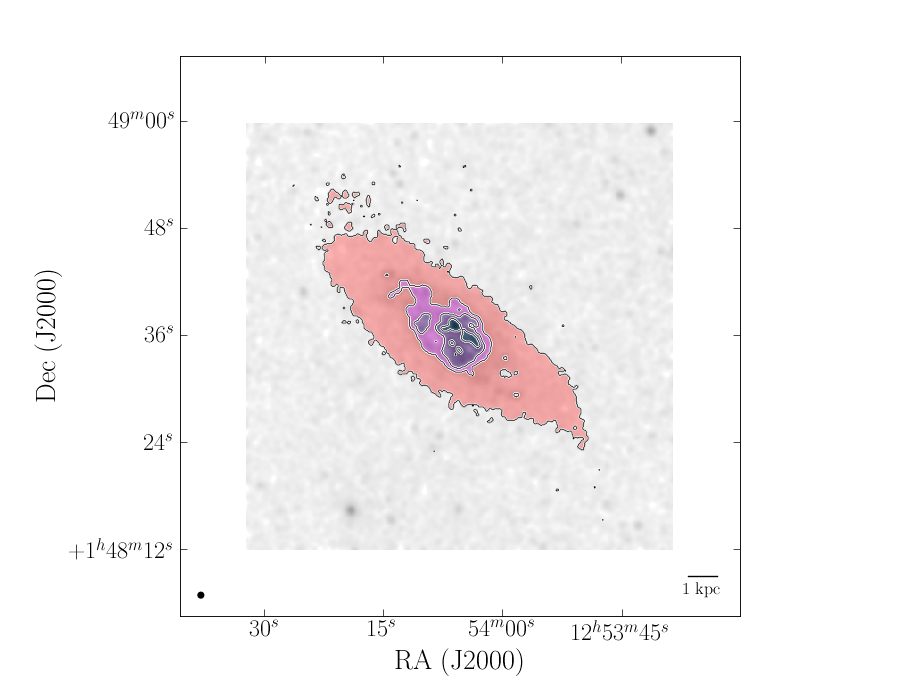
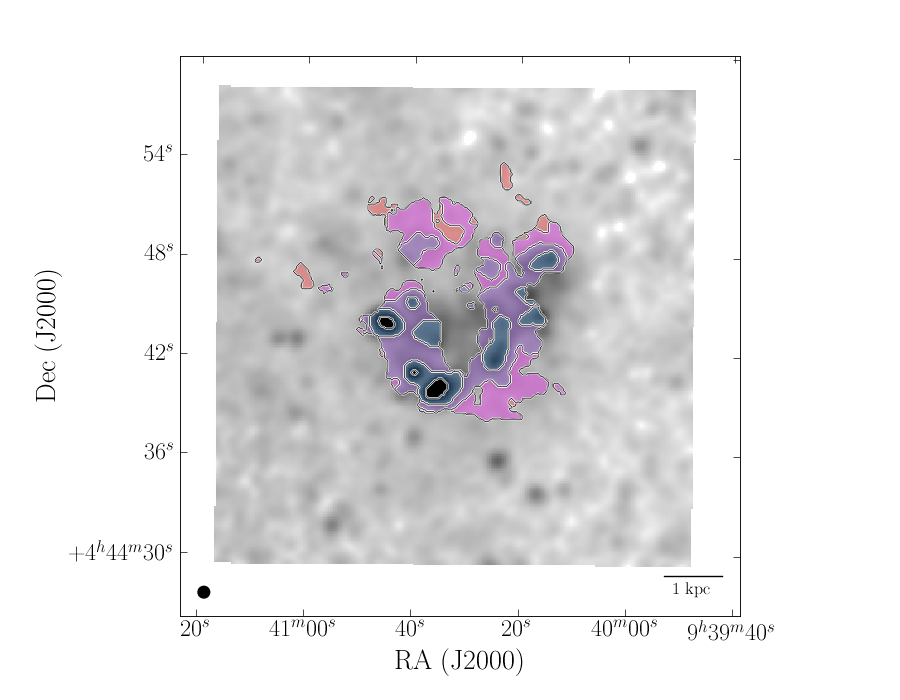
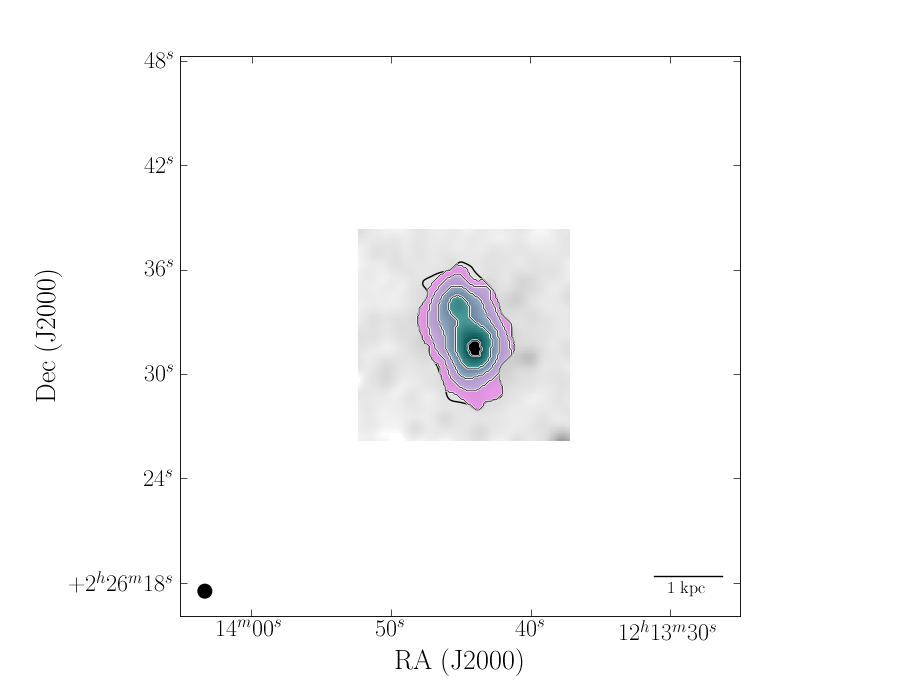
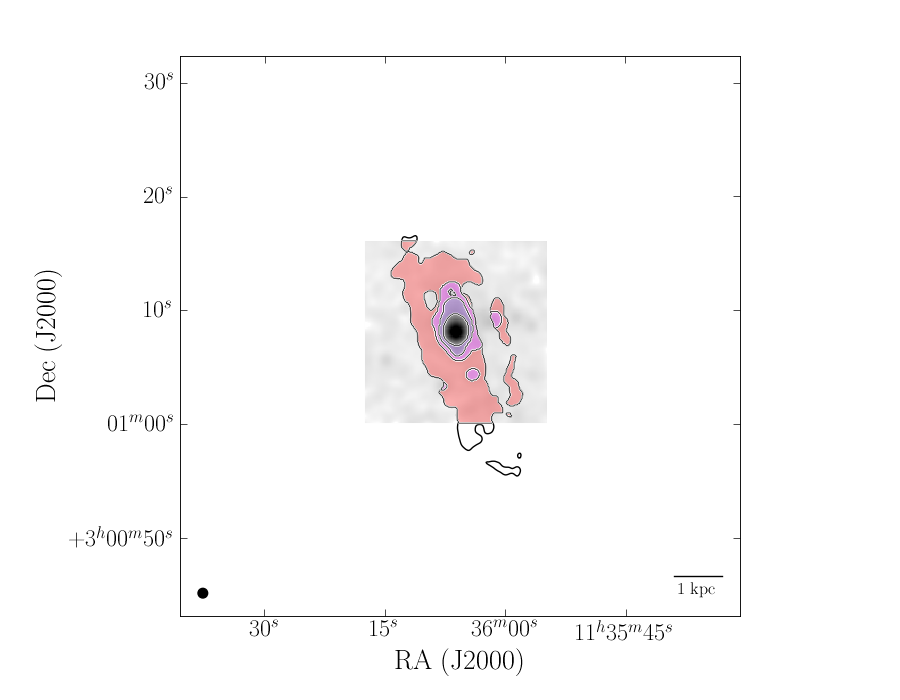
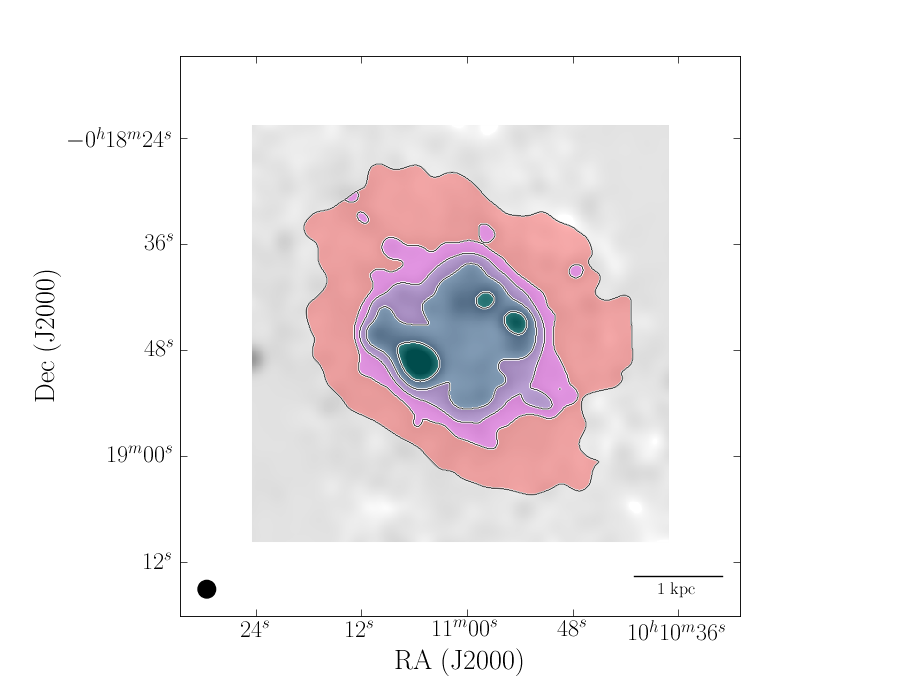
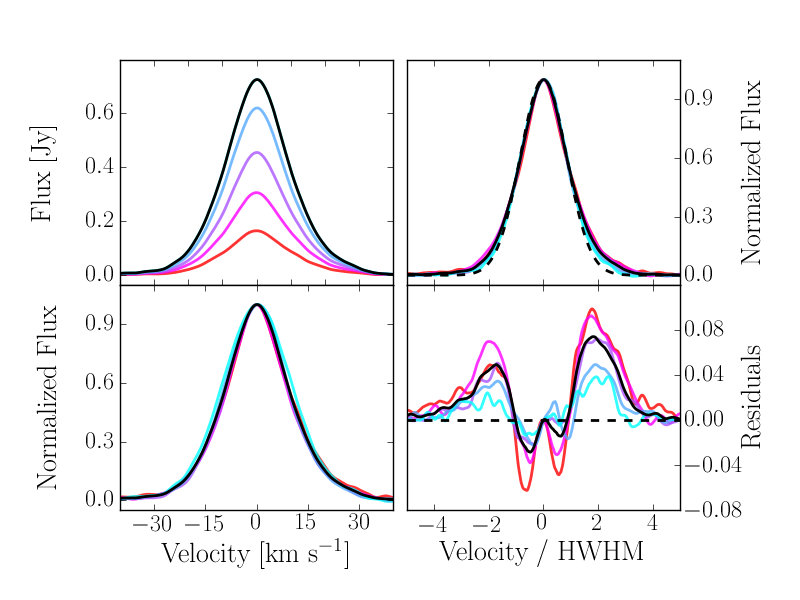
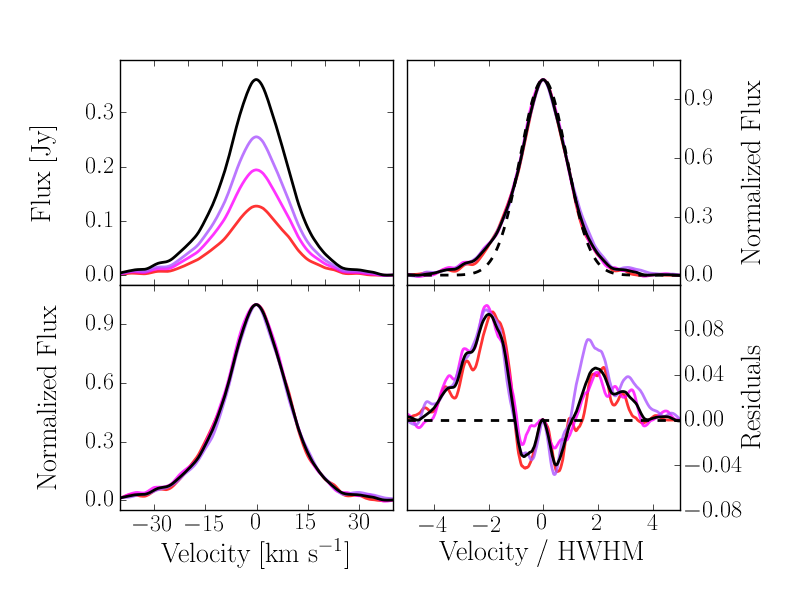
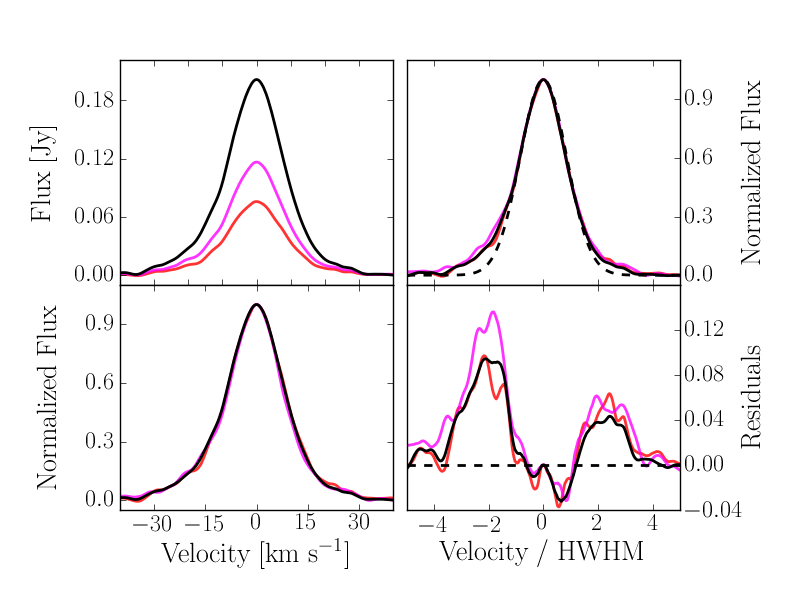
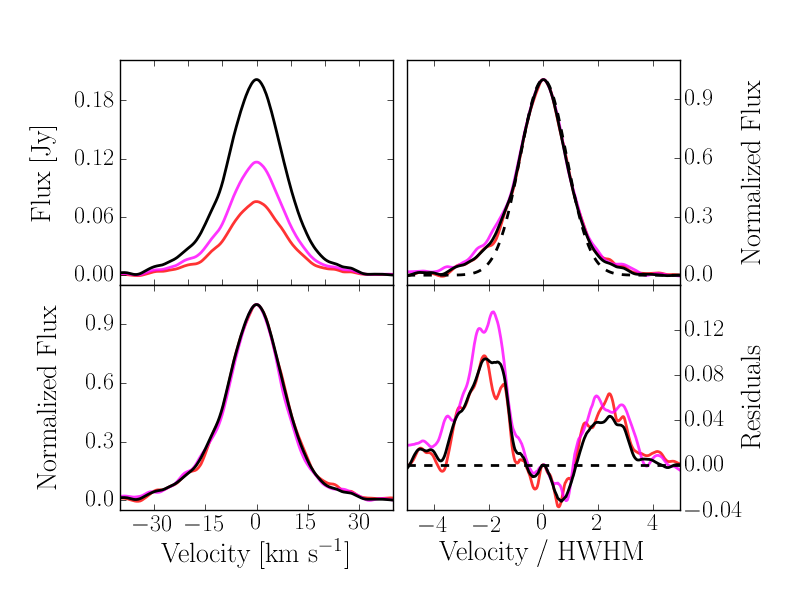
As an example, we show the behavior of the H i superprofiles as a function of radius for NGC 7793 in Figures 3a - 3c. In Figure 3a, we show the annuli in which we have generated superprofiles superimposed on the H i column density (NHIsubscript𝑁𝐻𝐼N_{HI}) map. The solid black outline indicates the region within which all 200 pc-smoothed pixels in the H i data cube have S/N>5𝑆𝑁5S/N>5. The solid colored lines mark the midpoint of each annulus, and the corresponding shaded color regions show the pixels that contribute to that annulus. The beam is shown in the lower left corner, and the physical resolution is indicated by a scale bar in the lower right corner.

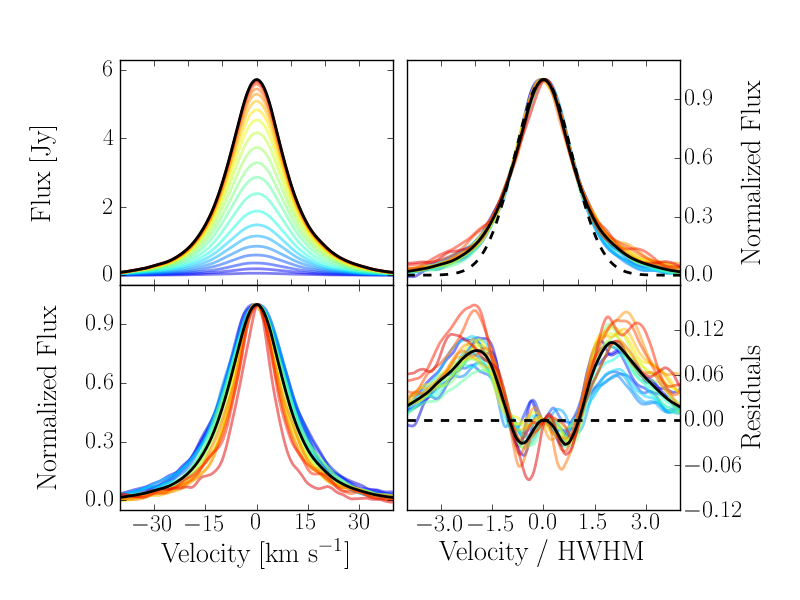
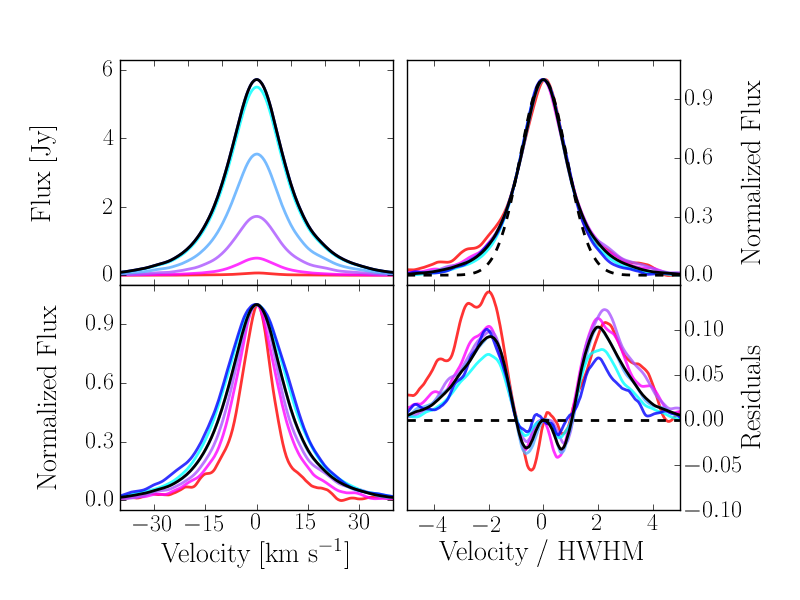
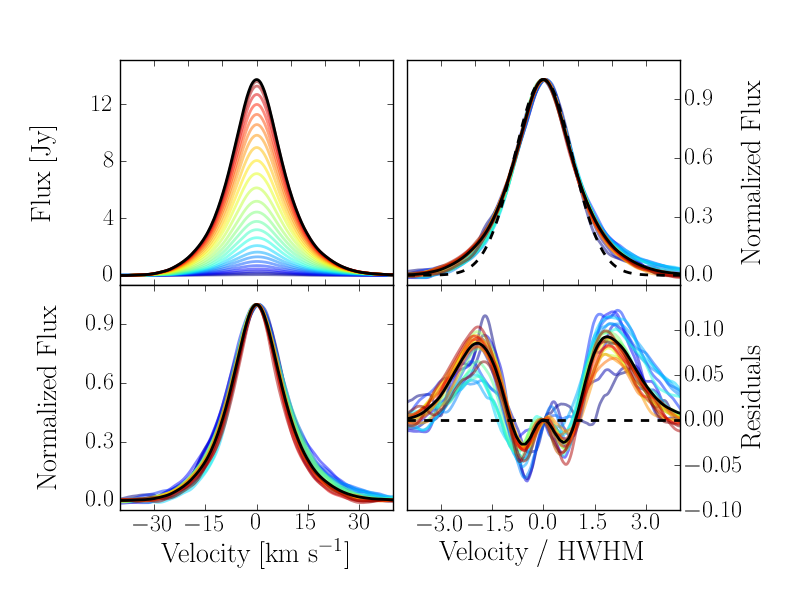
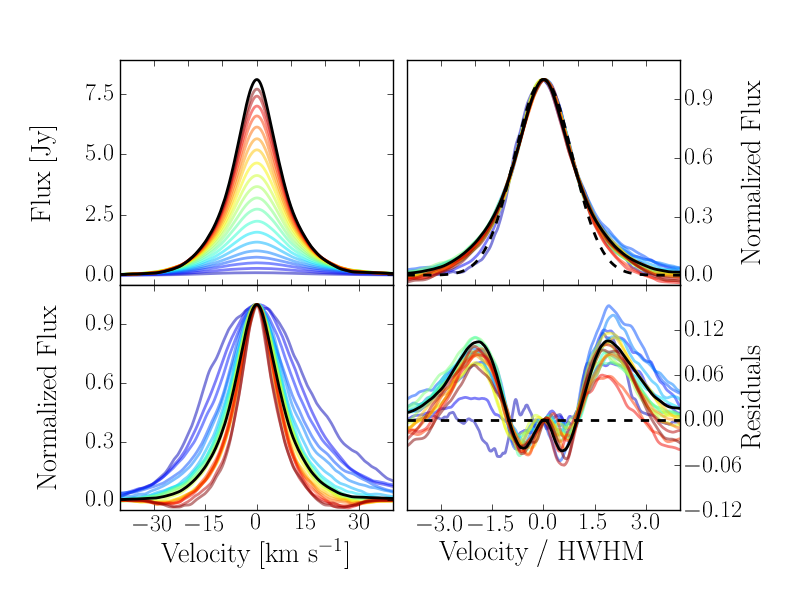
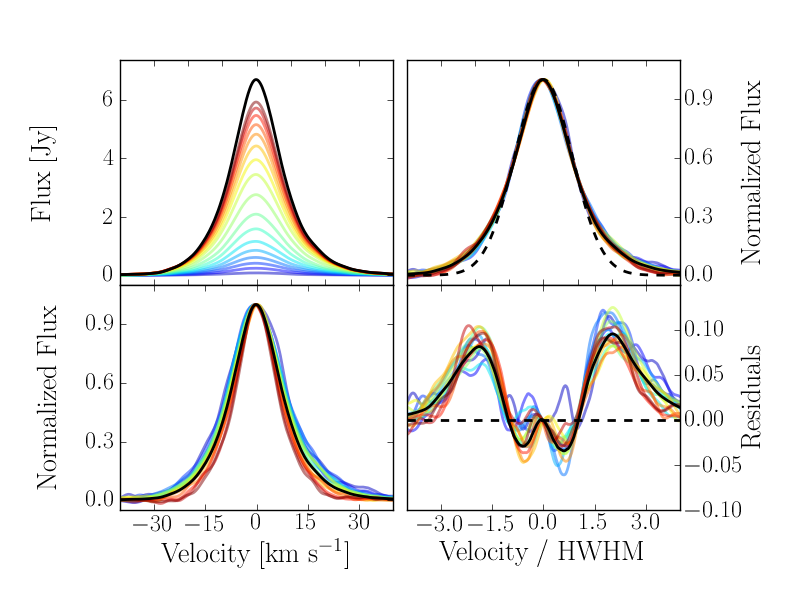
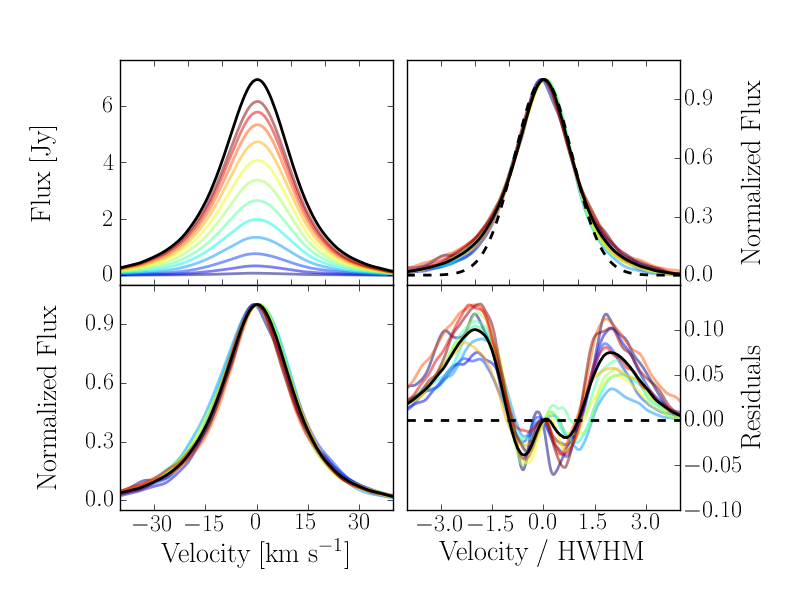
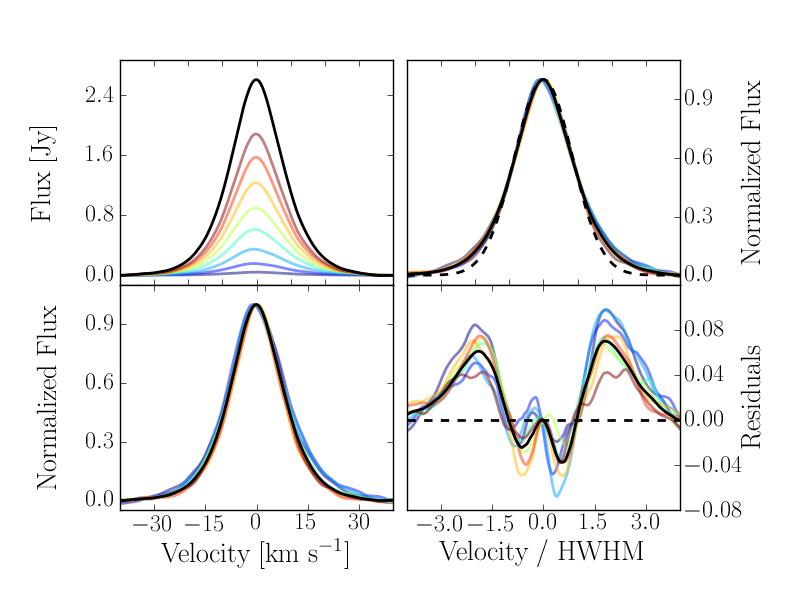
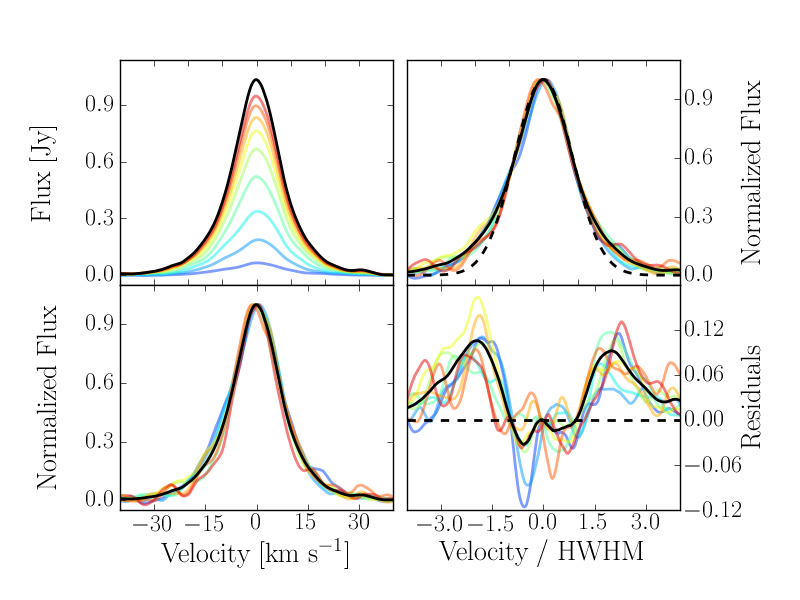
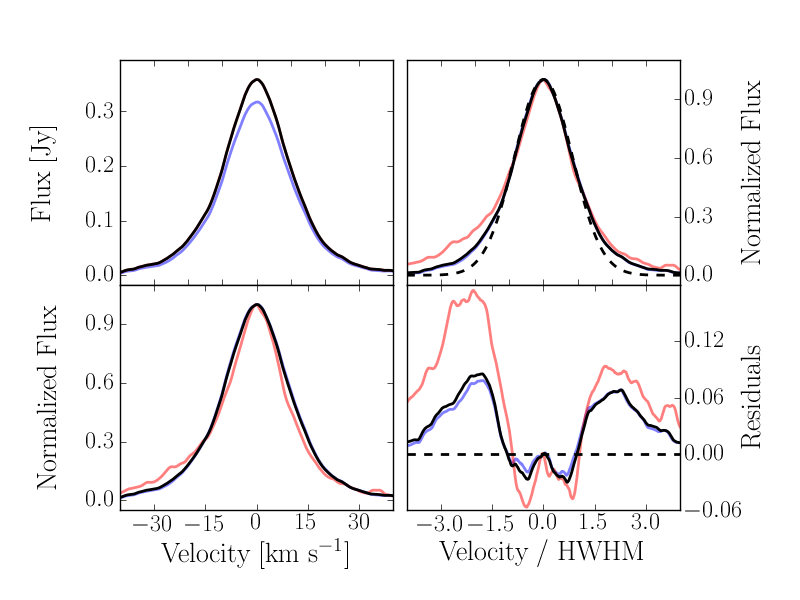
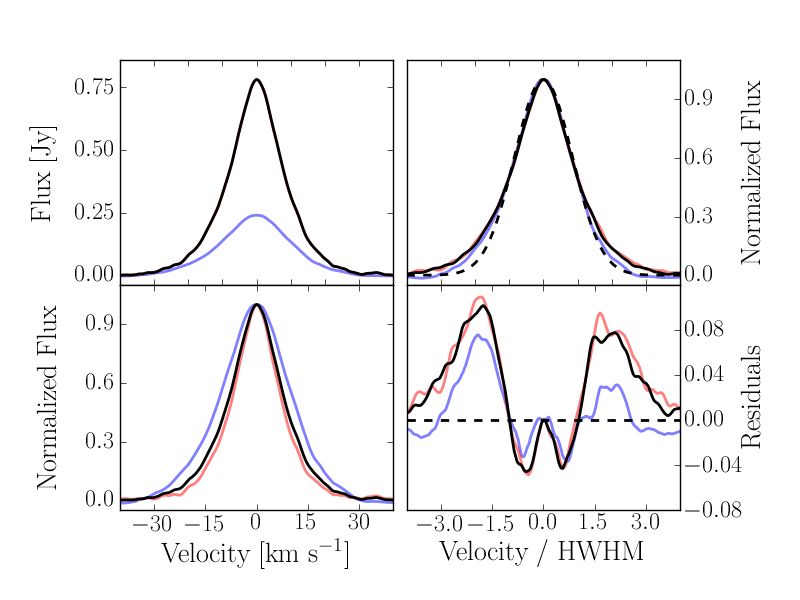
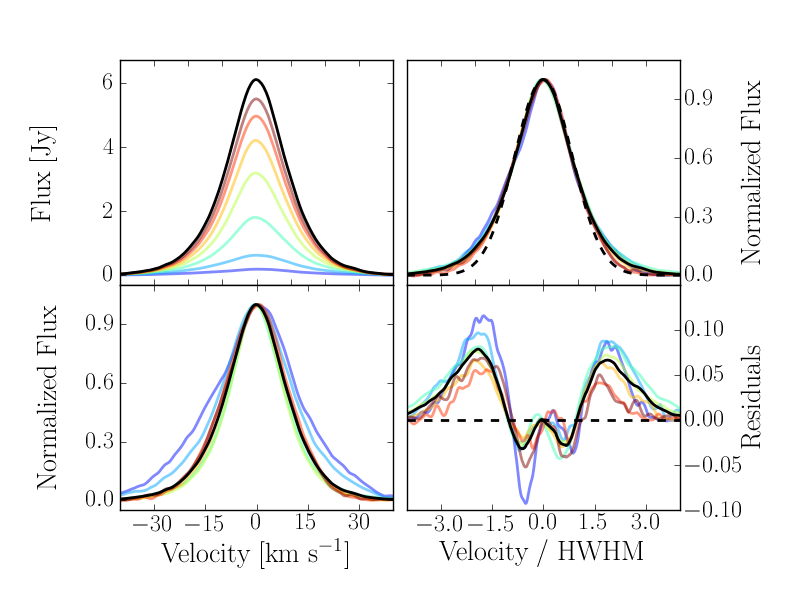
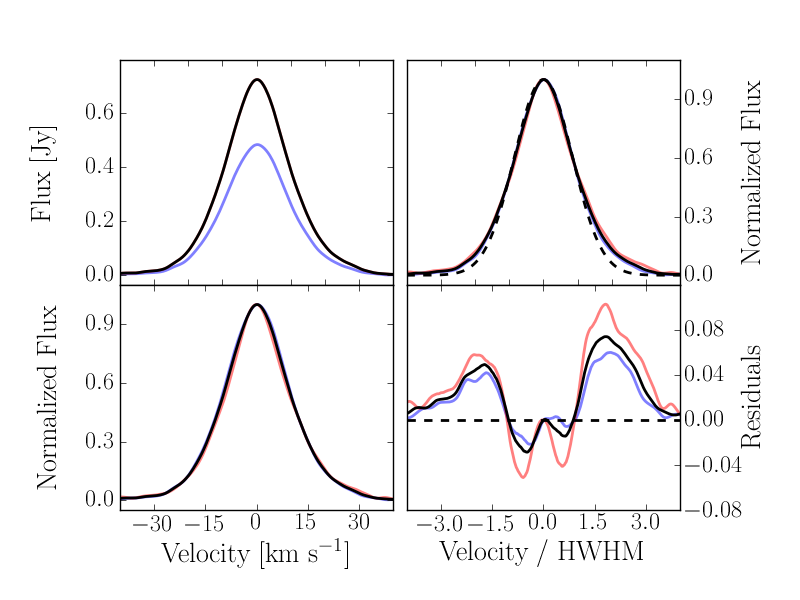
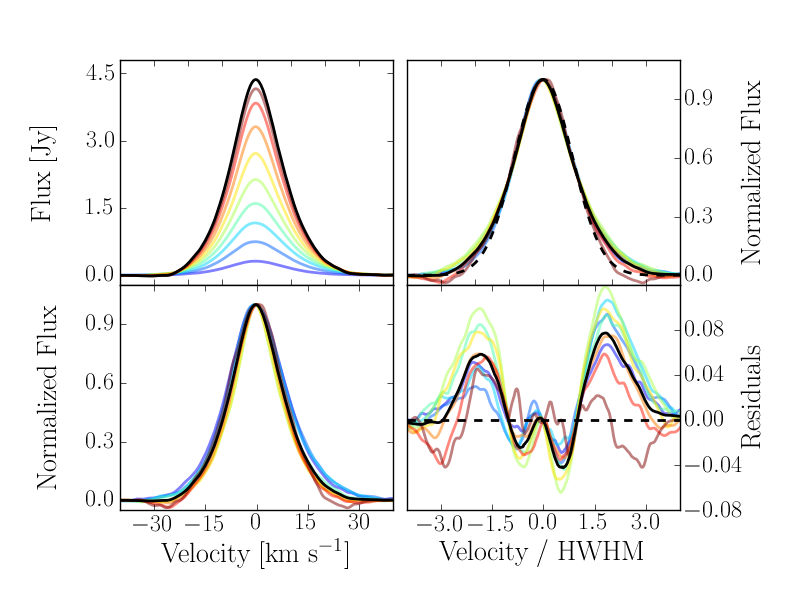
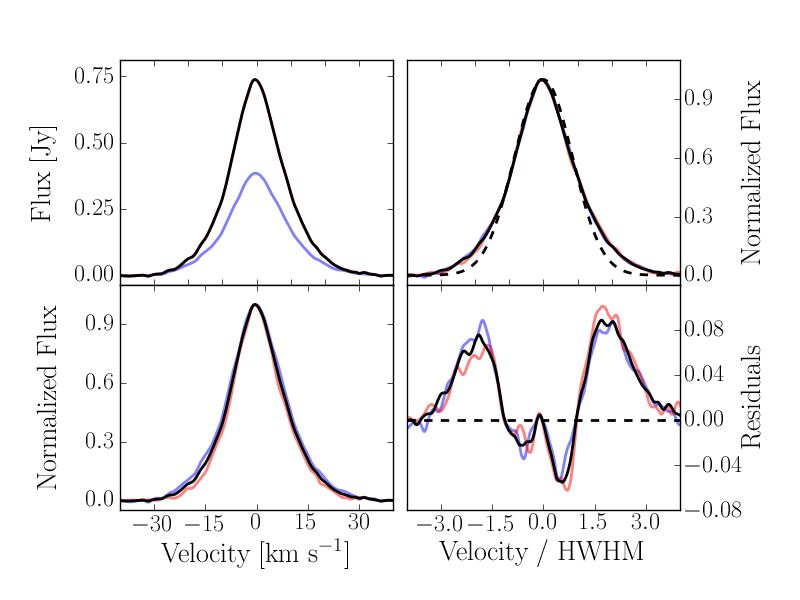
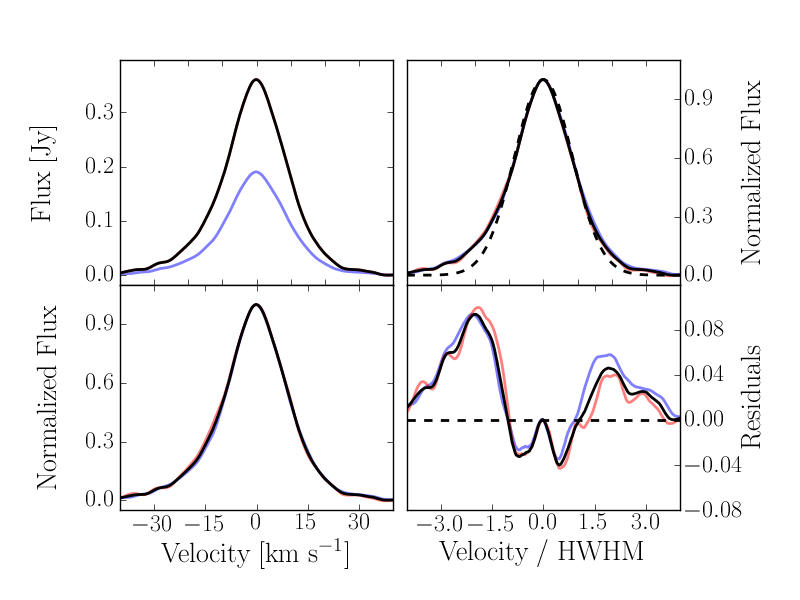
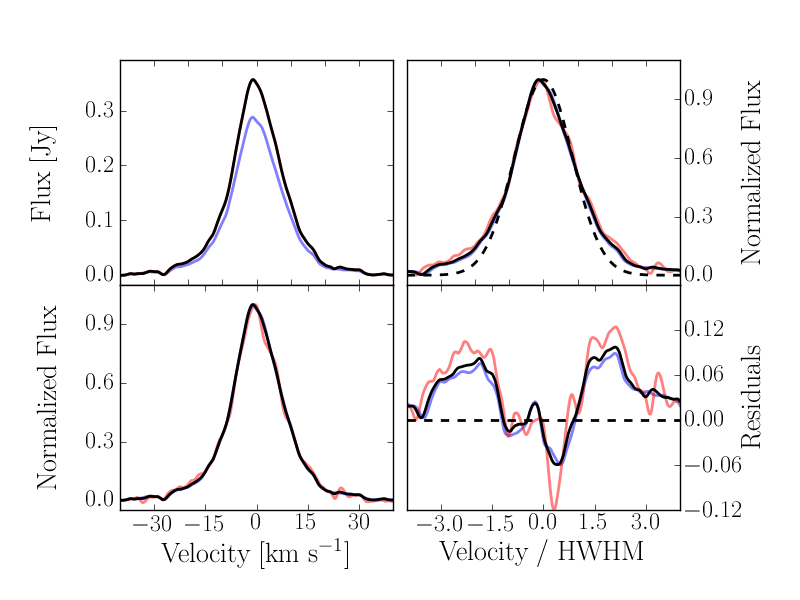
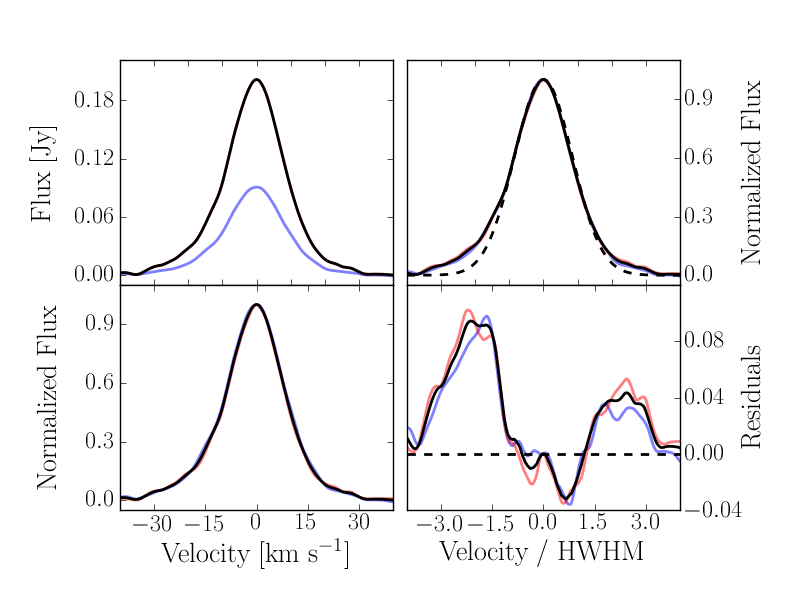
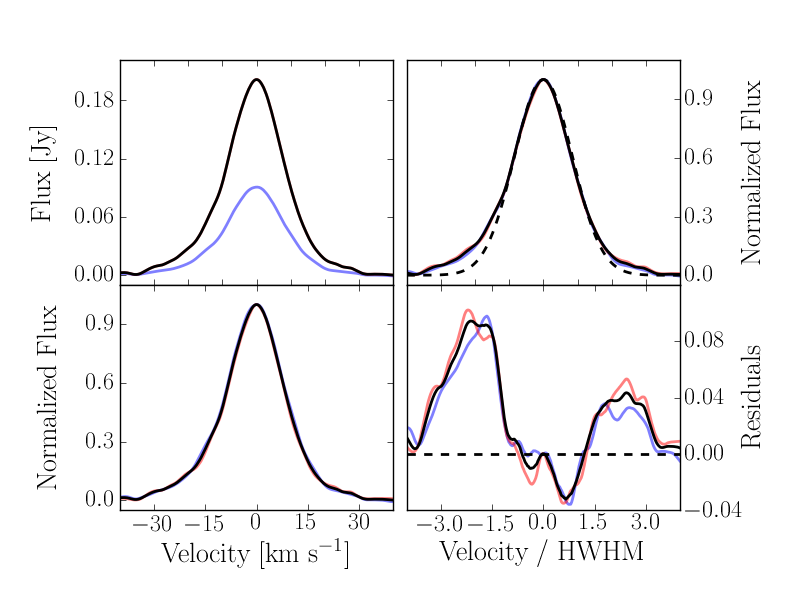
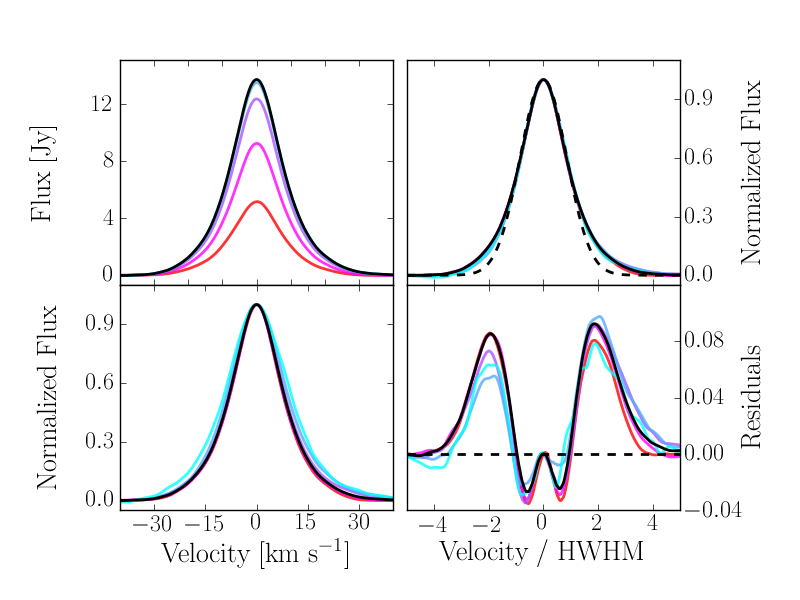
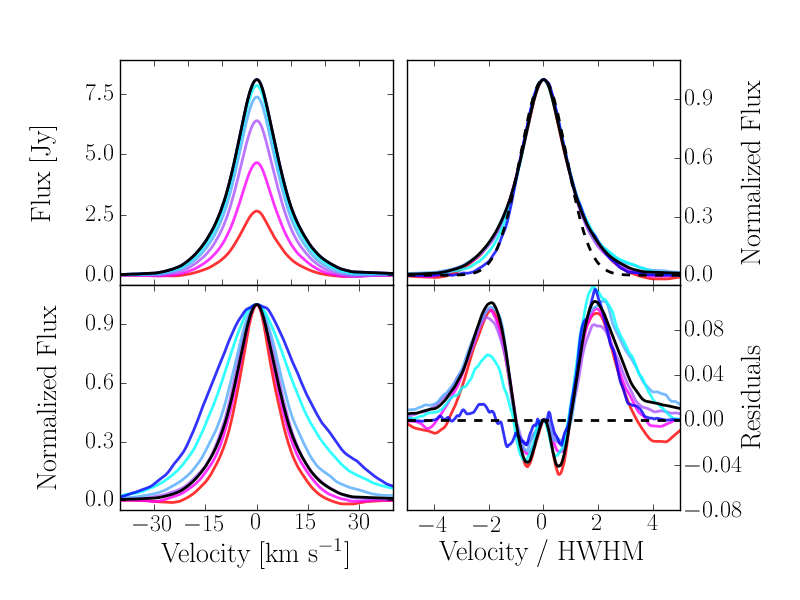
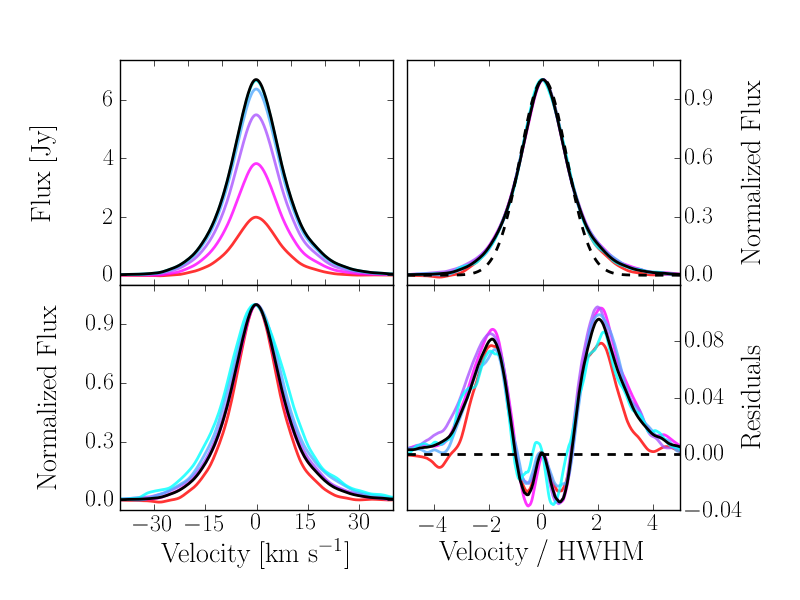
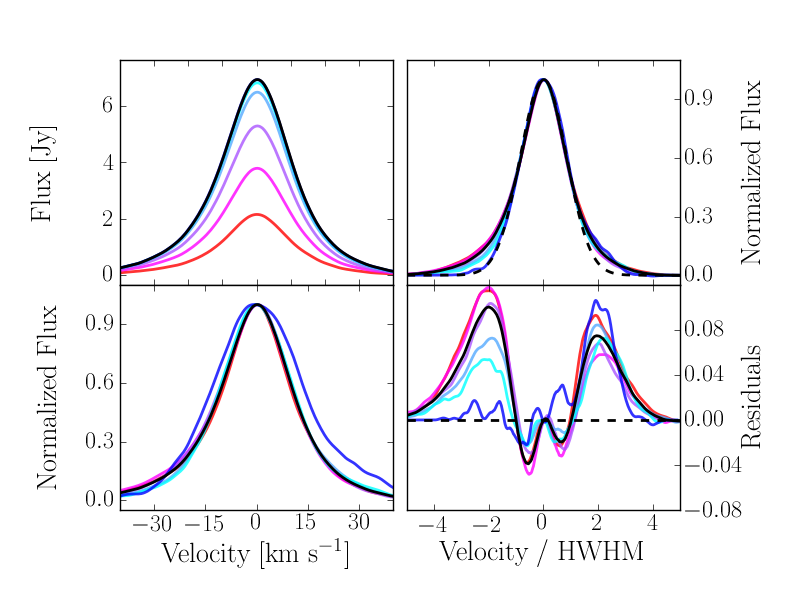
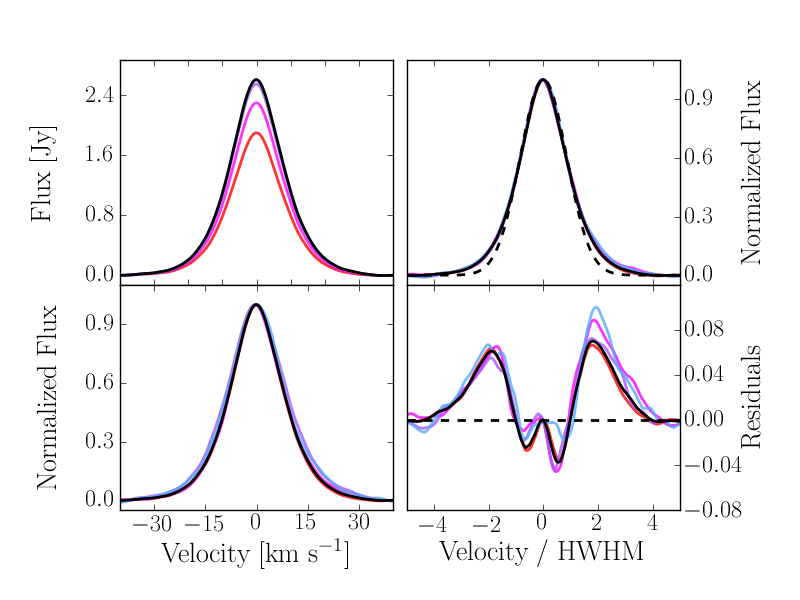
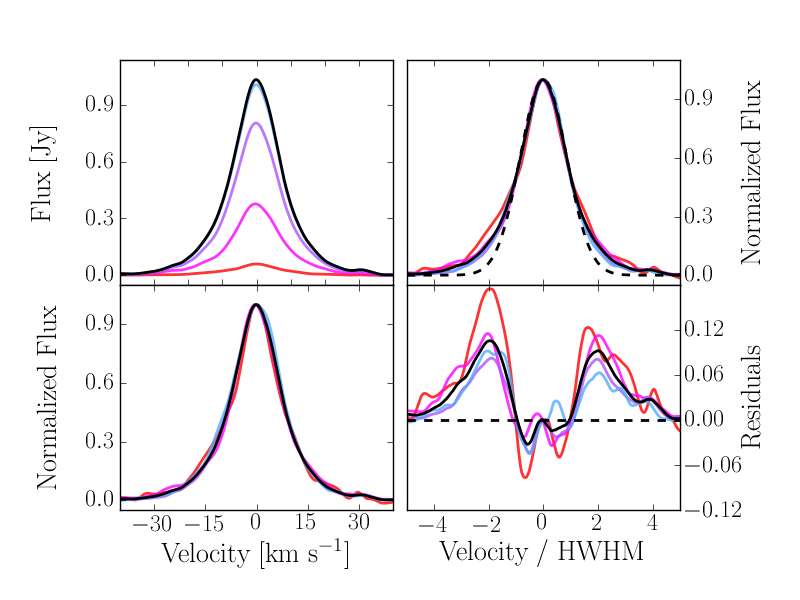
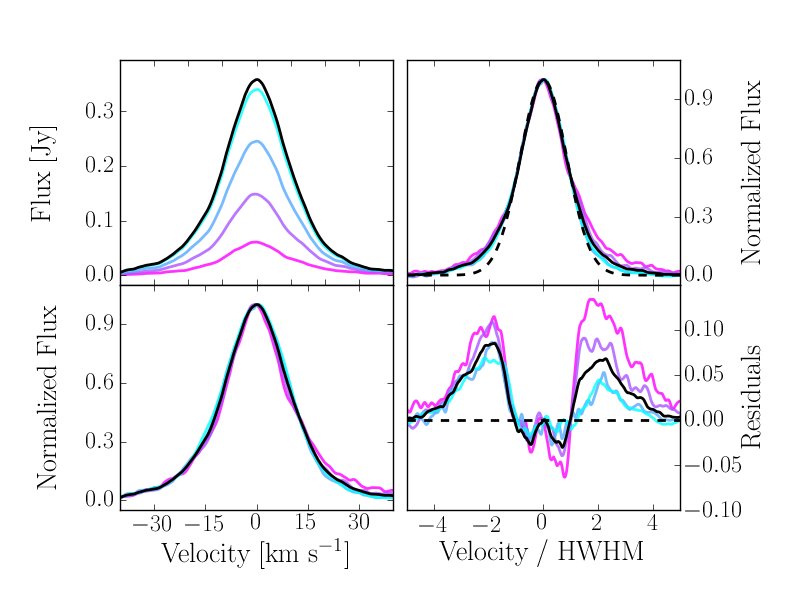
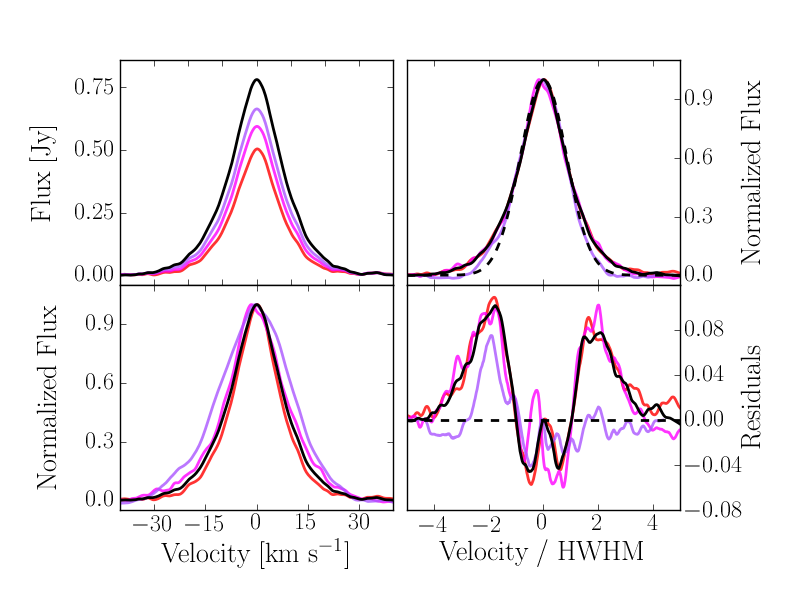
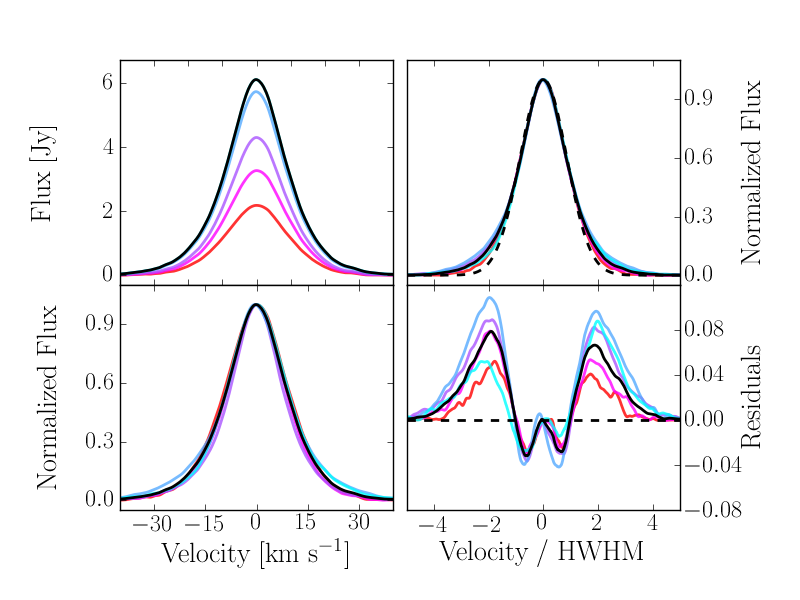
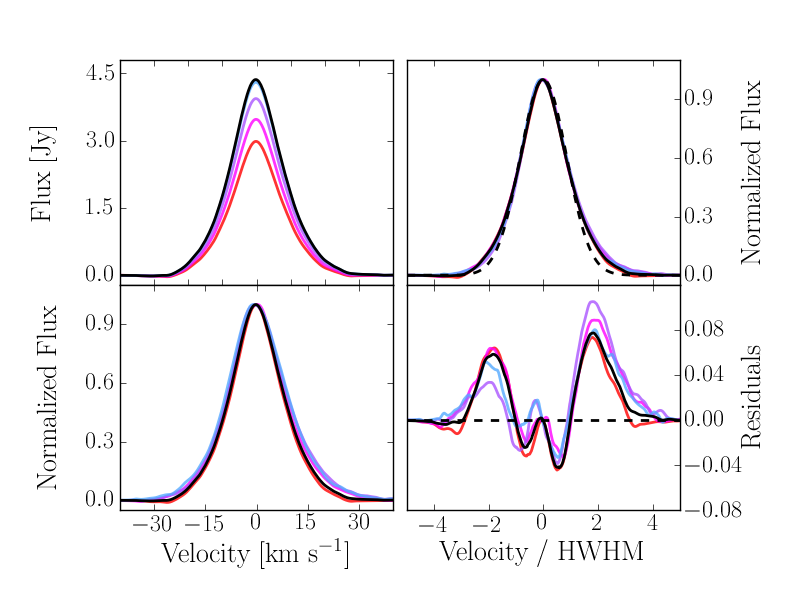
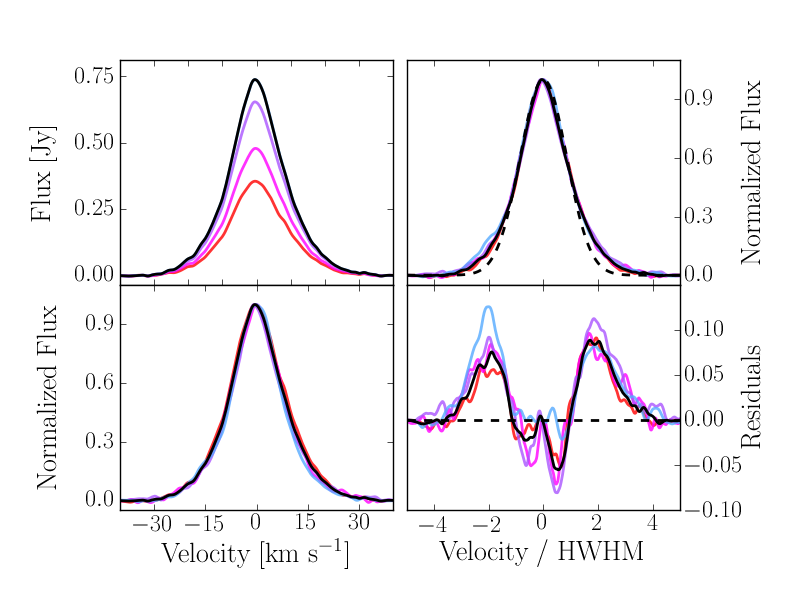
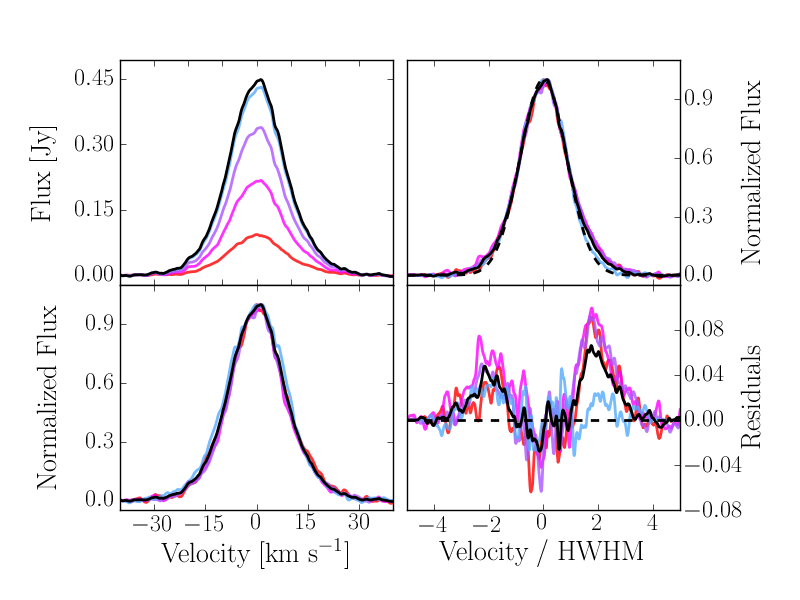
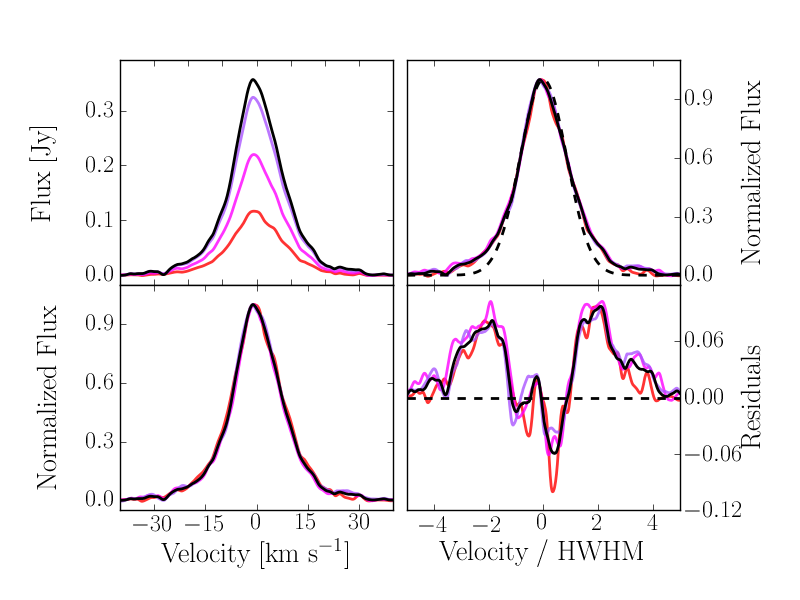
In Figure 3b, we show the superprofiles that correspond to the annuli in Figure 3a. In the upper left panel, we plot the observed superprofiles. To highlight the cumulative contribution from each radial annulus to the total superprofile, each resolved superprofile plotted also includes the superprofiles at all smaller radii. In the lower left panel, we have normalized each radial superprofile to the same peak amplitude. The superprofiles are clearly wider in the central regions of NGC 7793 than in the outskirts. This behavior has previously been observed in other galaxies but using the H i second moment (Boulanger & Viallefond, 1992; Petric & Rupen, 2007; Tamburro et al., 2009). In the upper right panel, we have normalized the superprofiles by their amplitude and HWHM, as determined from the HWHM-scaled Gaussian model (thick black line). As seen in Paper I, the shape of these normalized superprofiles is typically very similar. In the lower right panel, we show the residuals of the superprofiles minus the HWHM-scaled Gaussian model. When compared to a Gaussian profile, the superprofiles typically have more flux in the wings and are peakier in the center. This behavior was clearly seen in the global superprofiles from Paper I, but clearly persists when analyzed on smaller spatial scales.

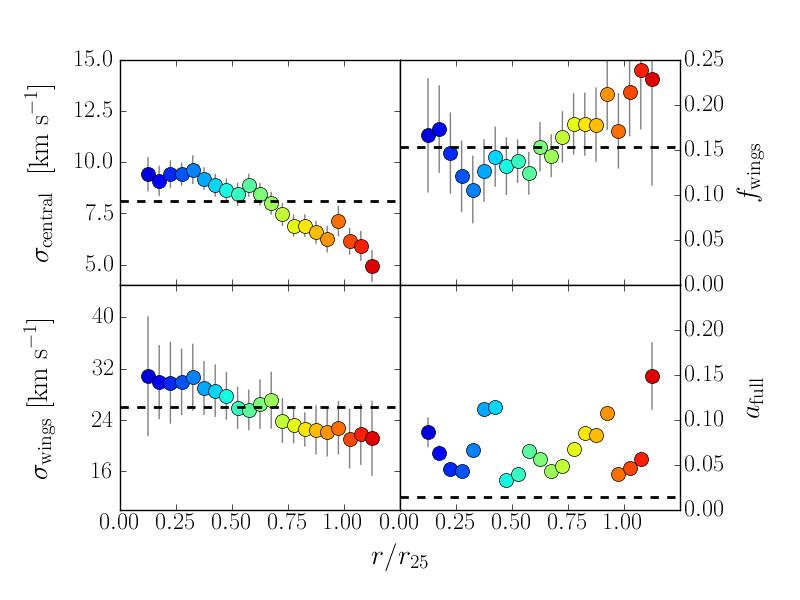
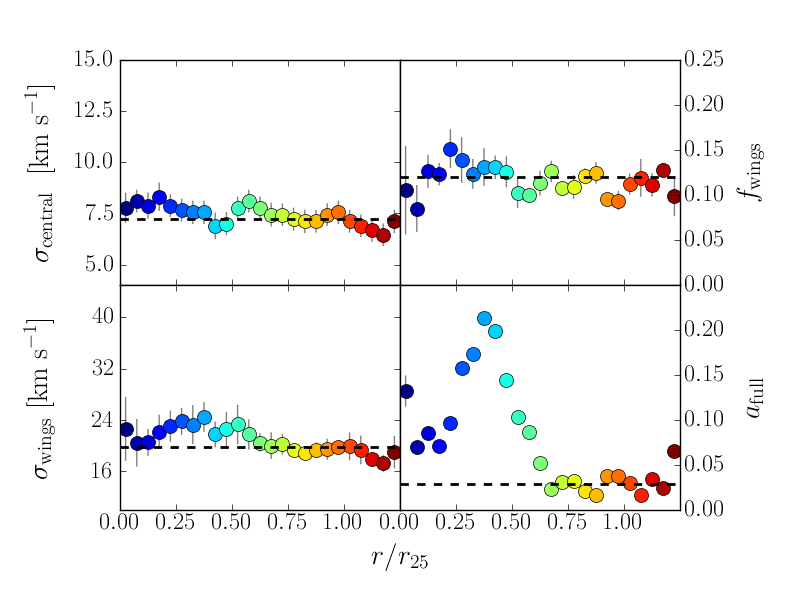
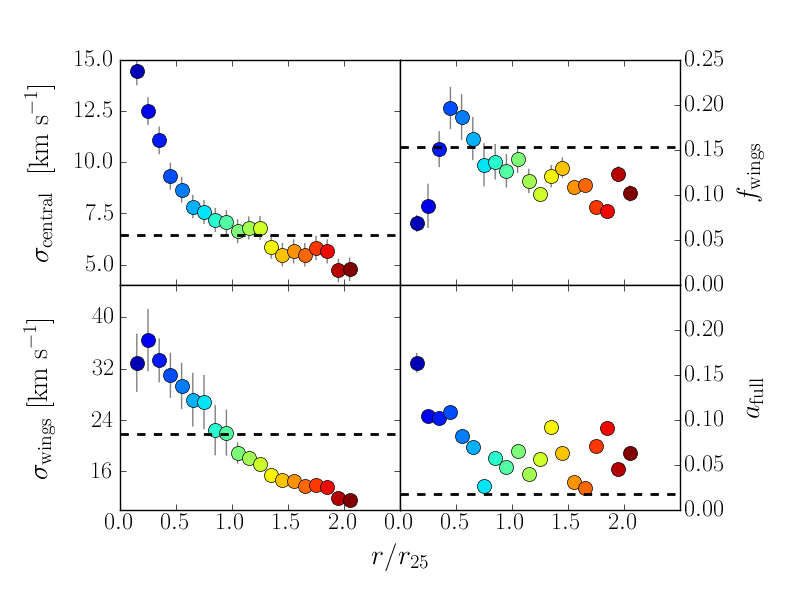
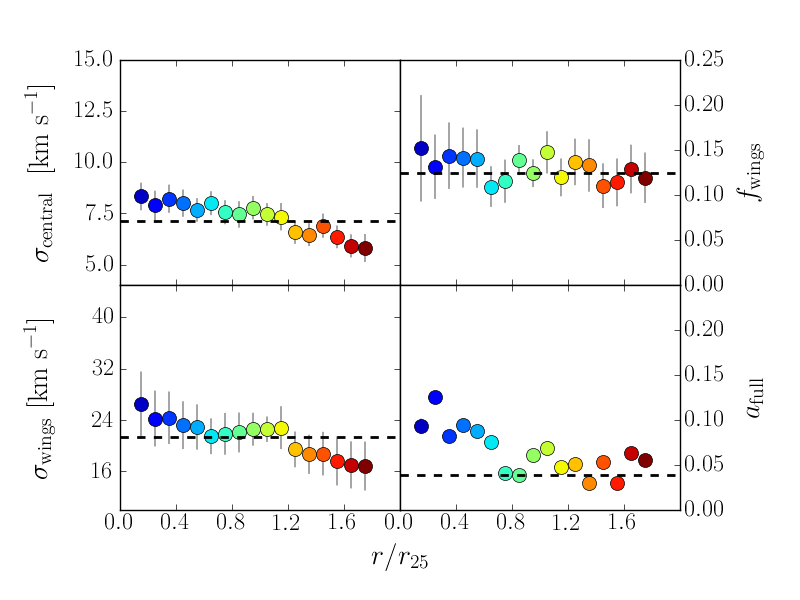
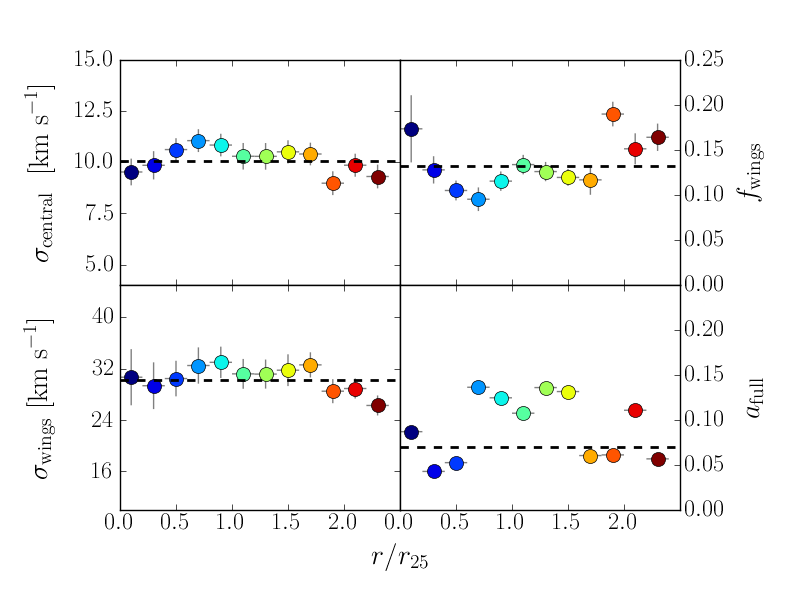
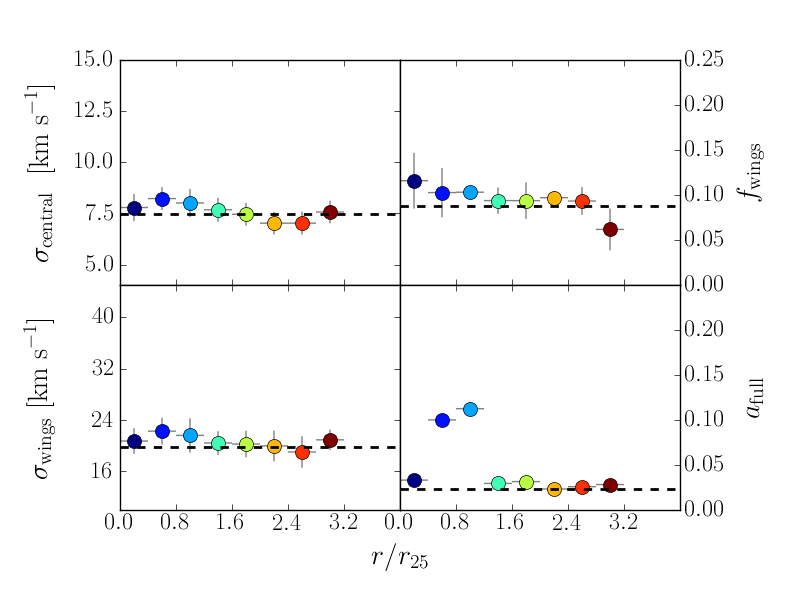
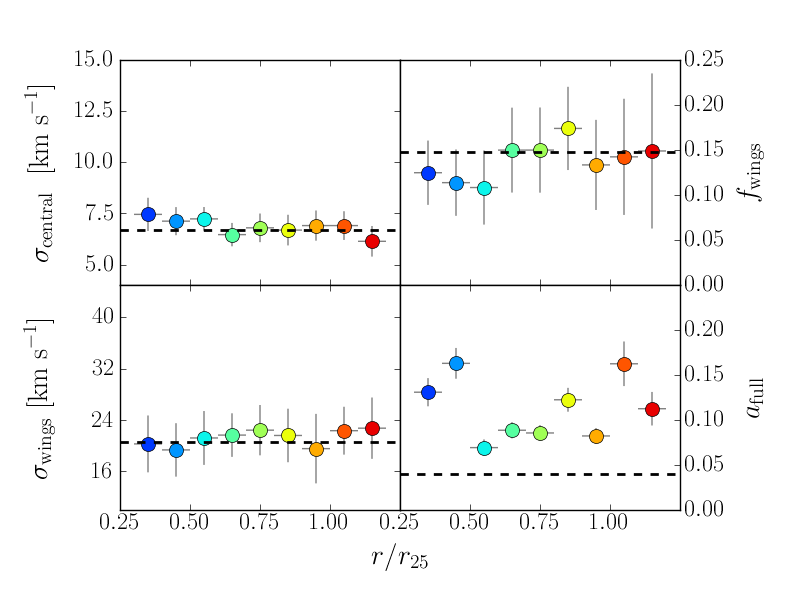
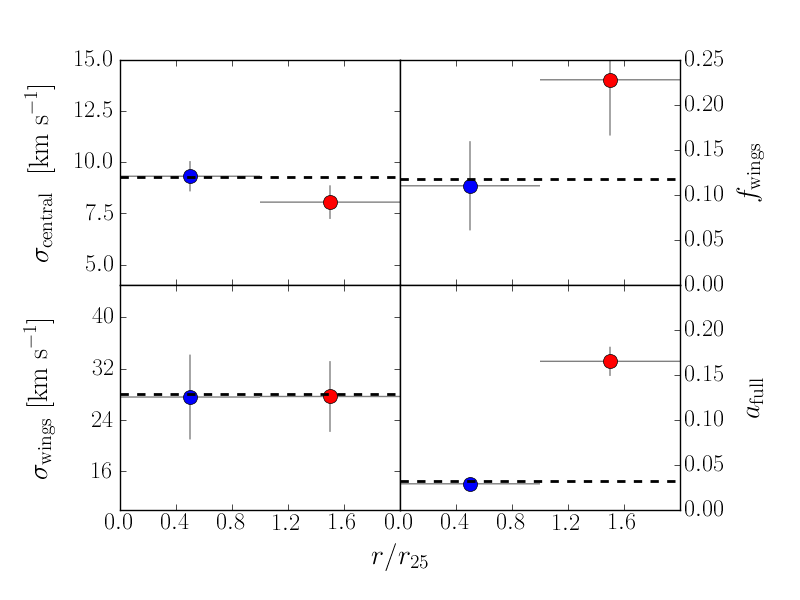
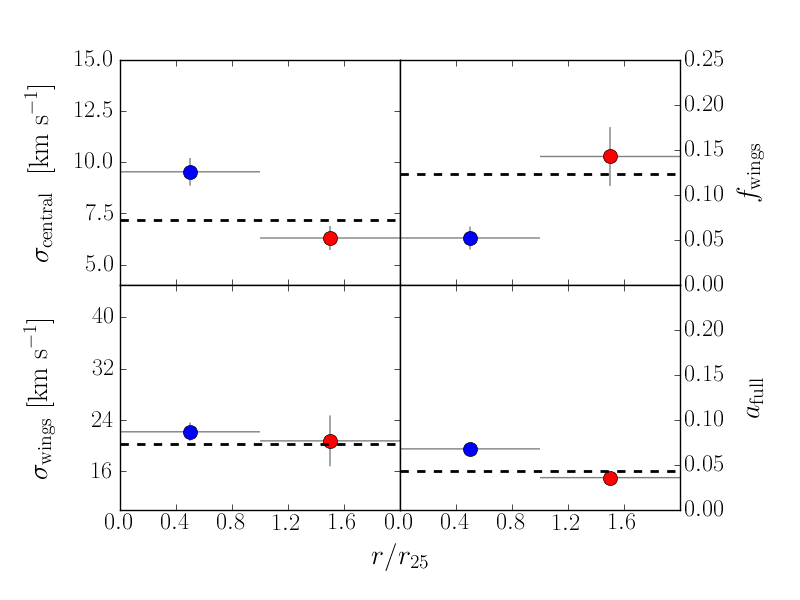
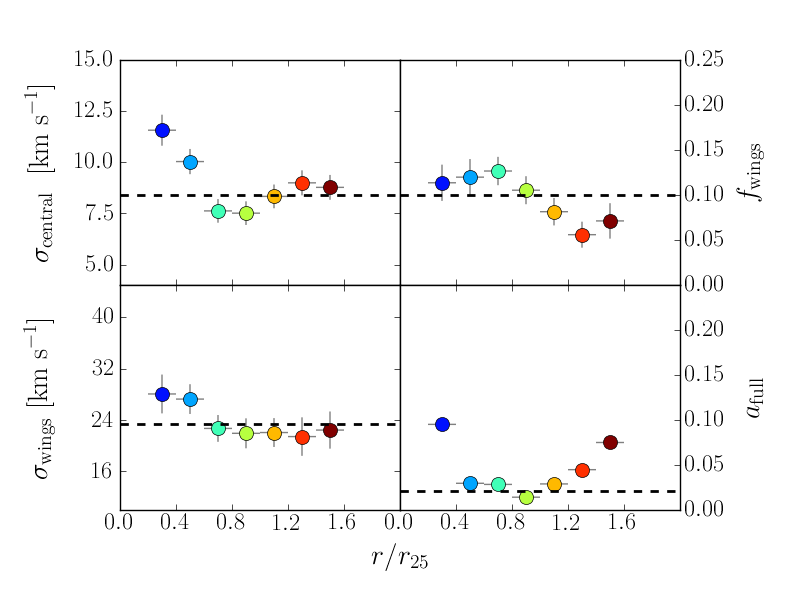
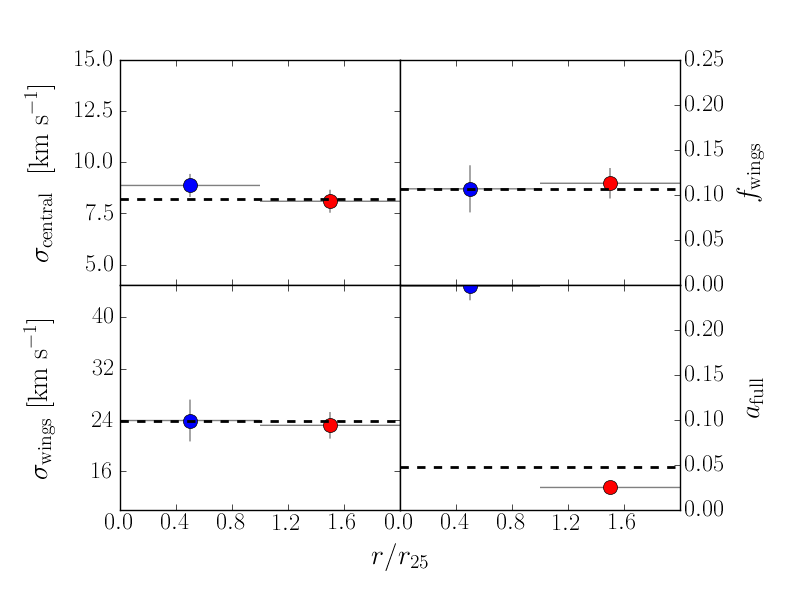
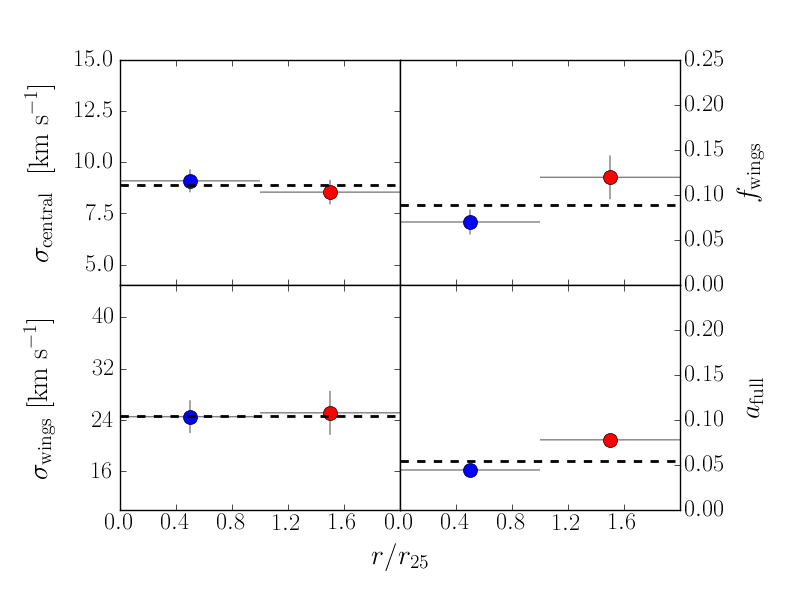
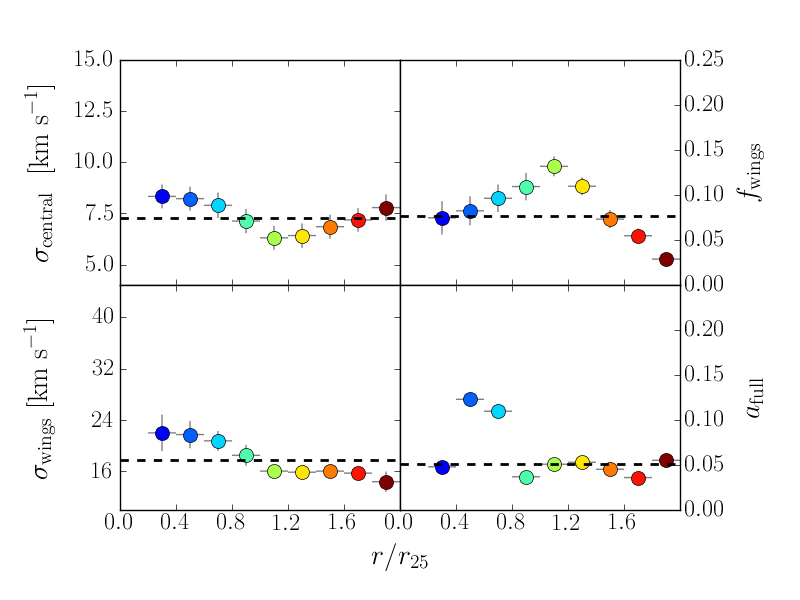
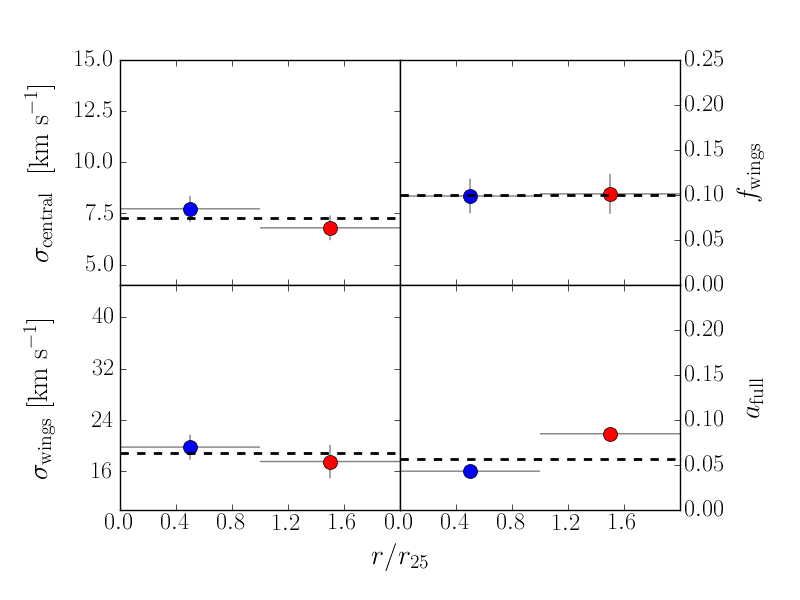
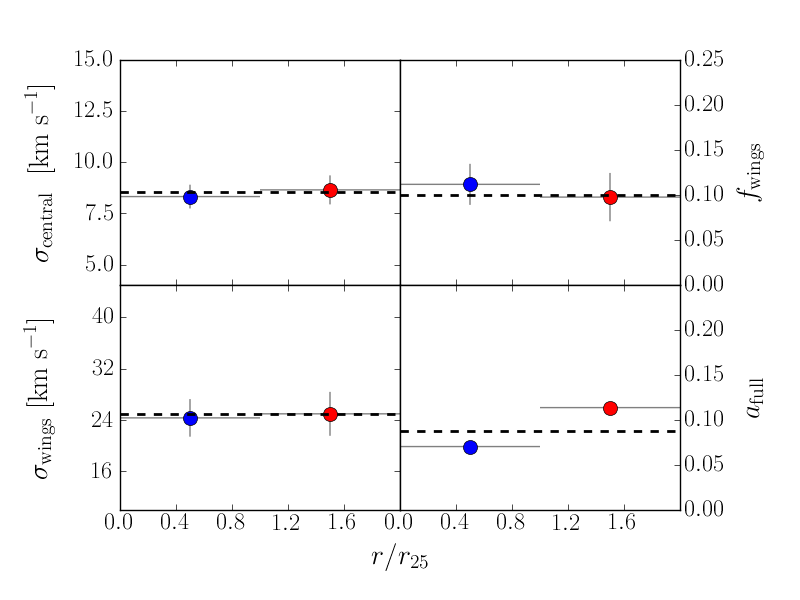
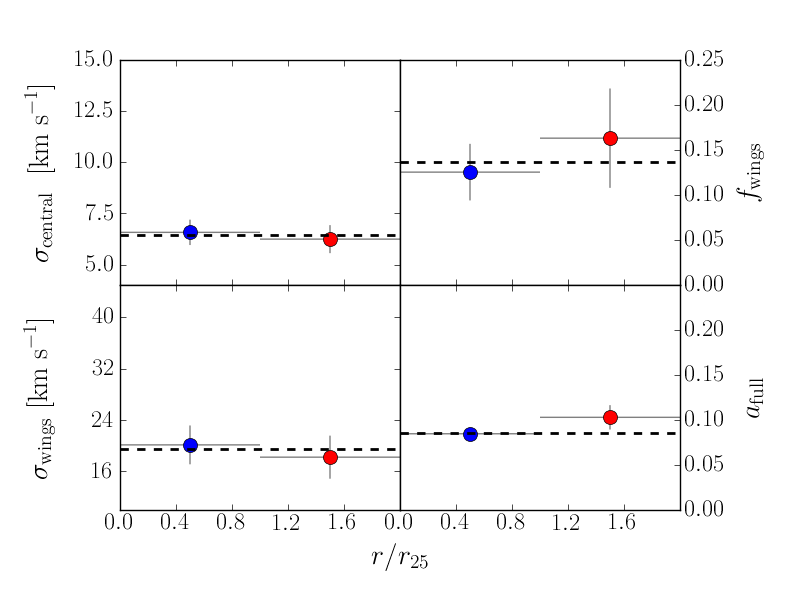
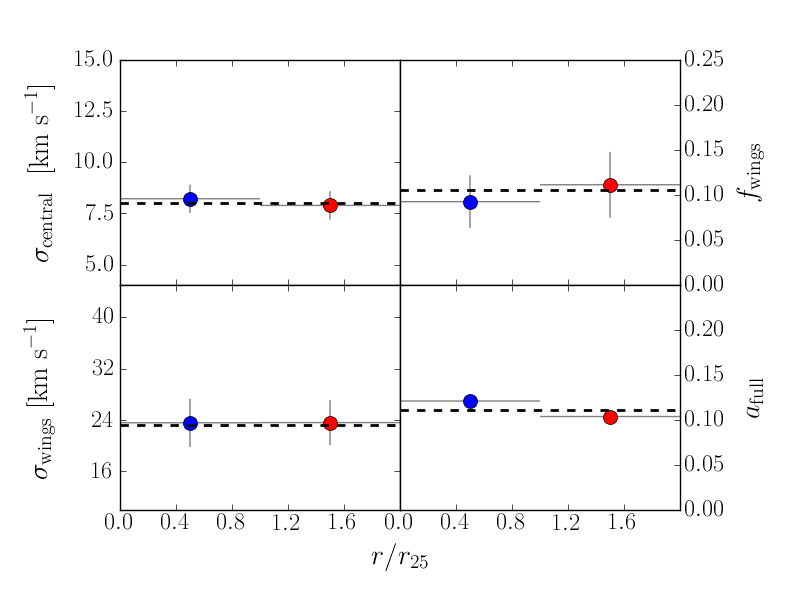
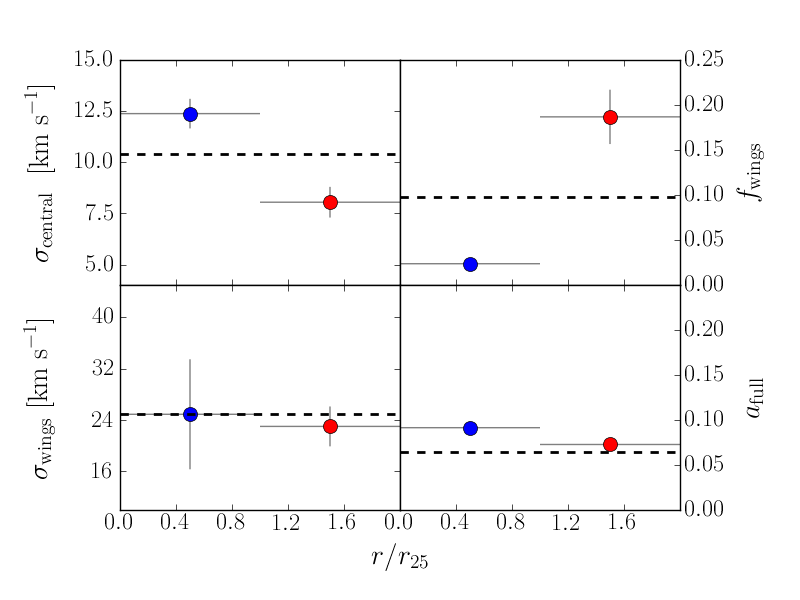
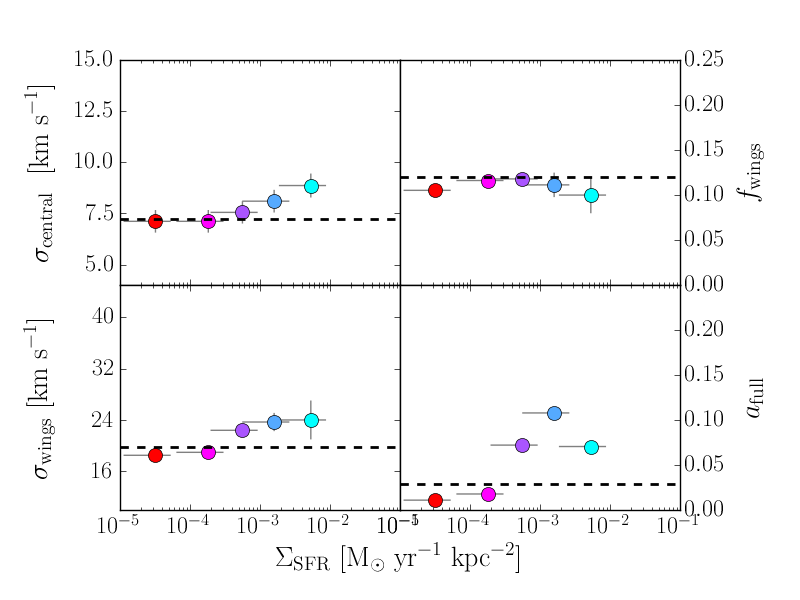
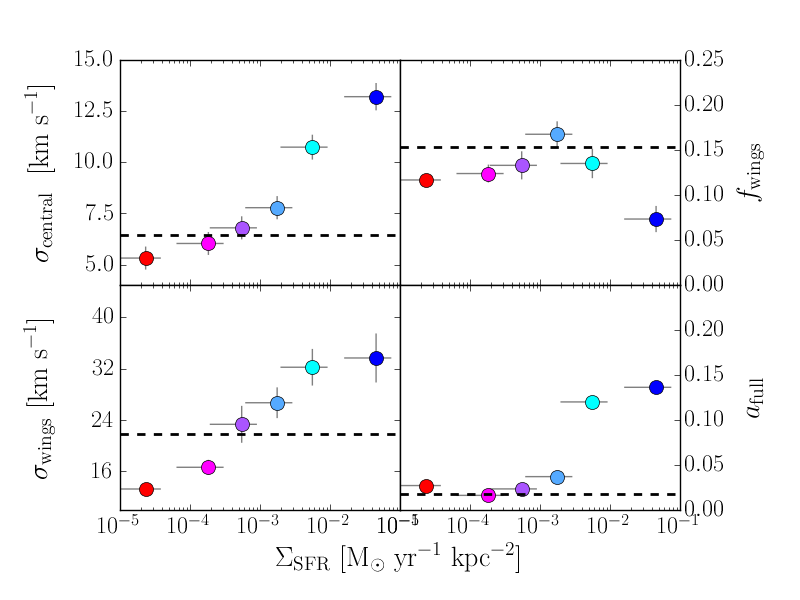
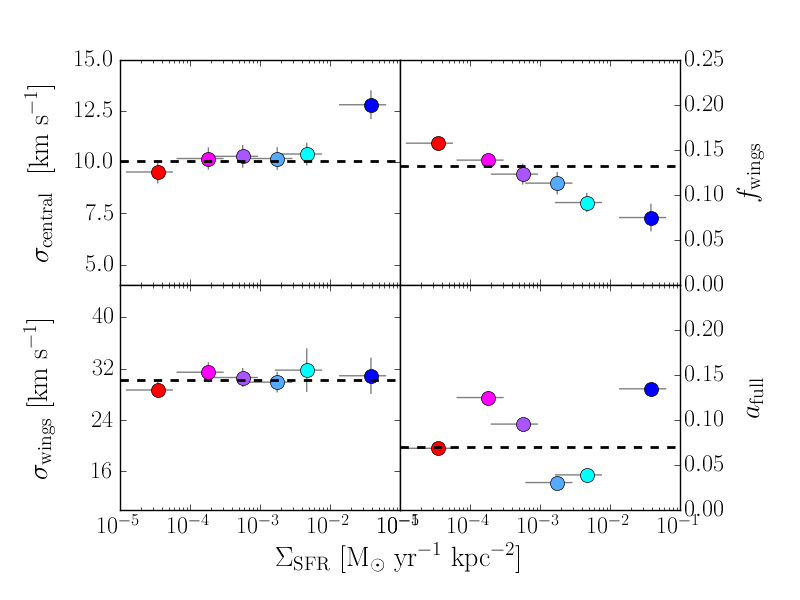
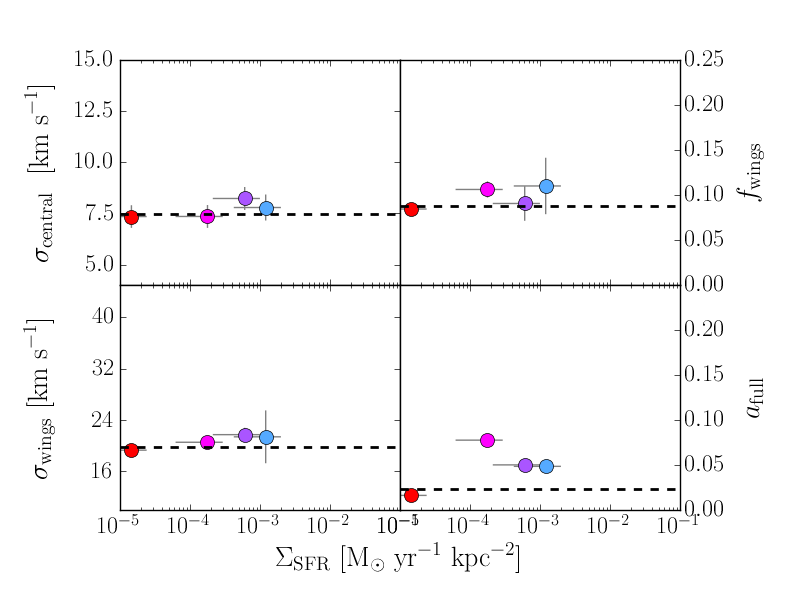
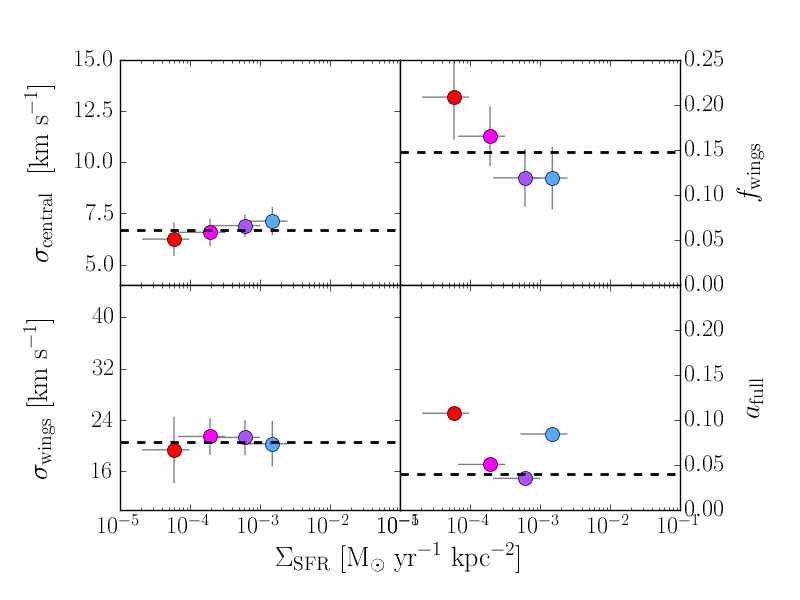
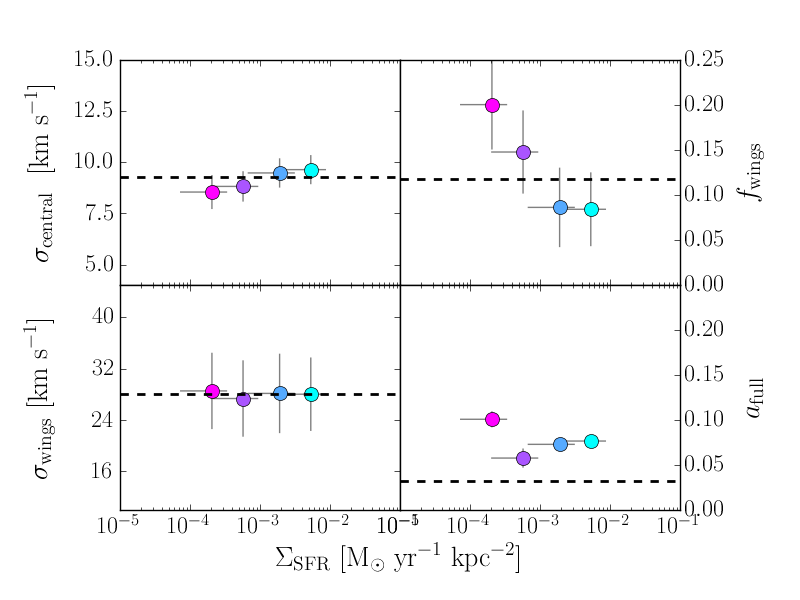
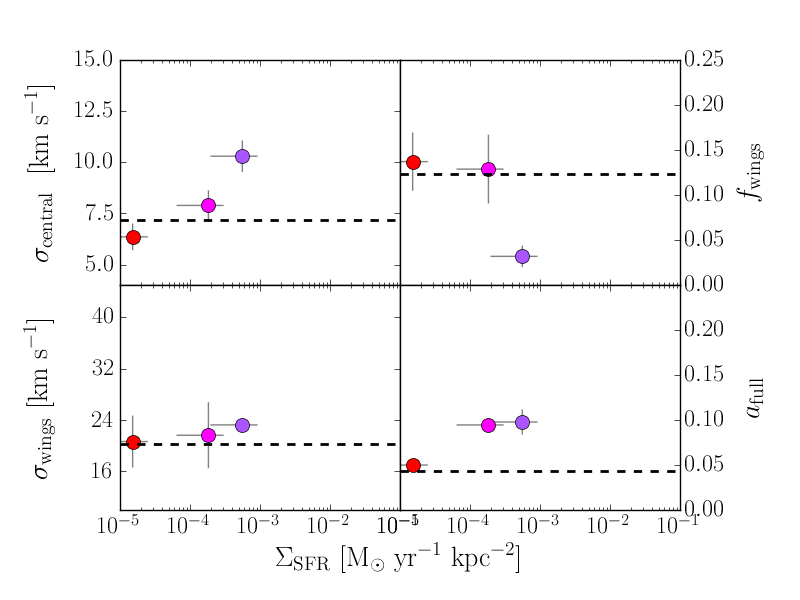
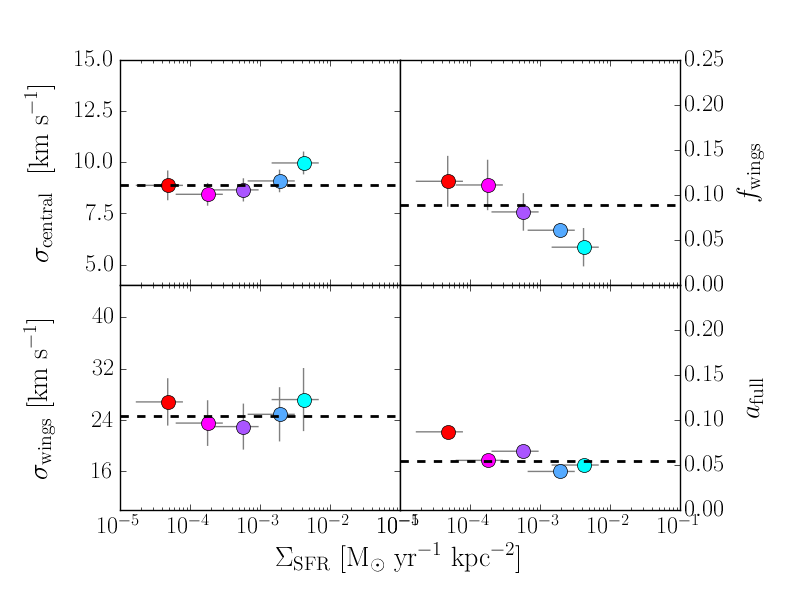
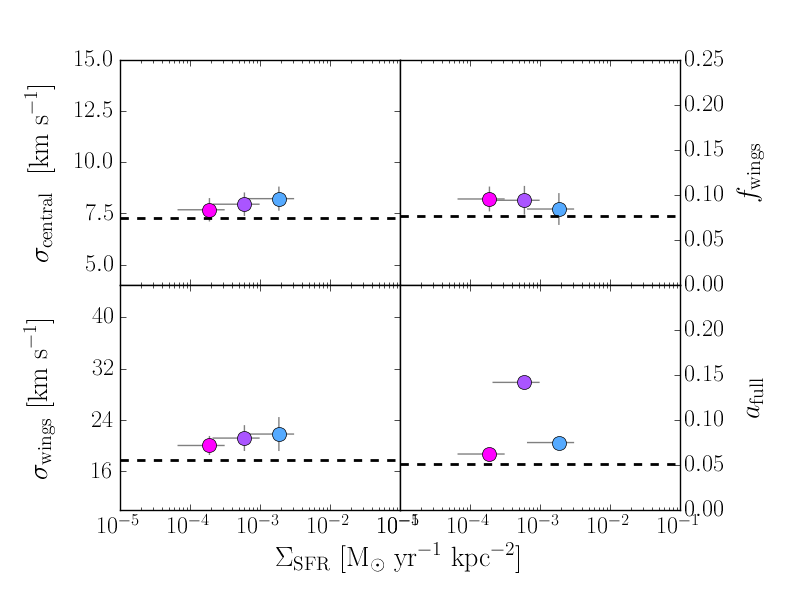
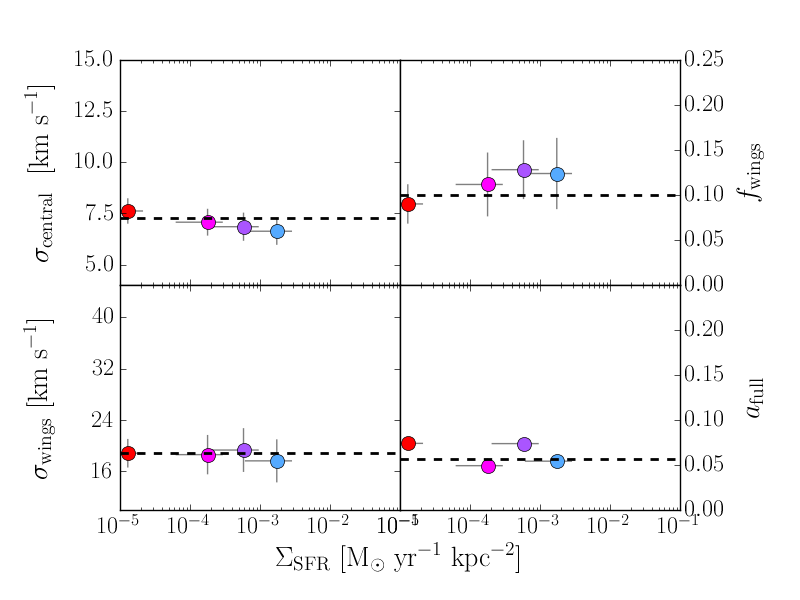
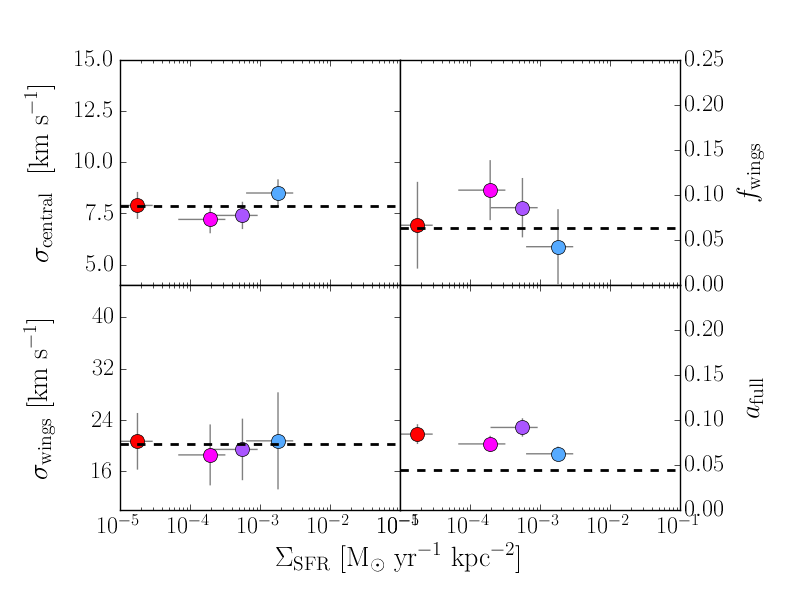
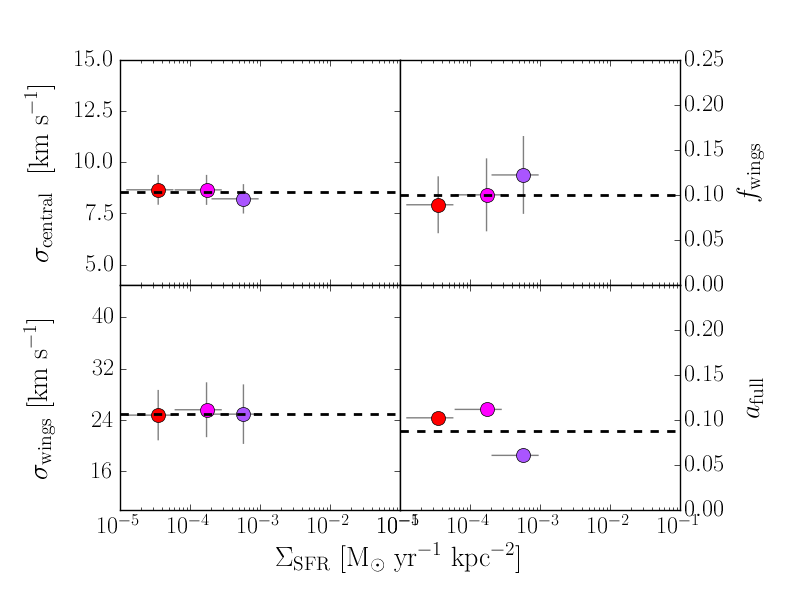
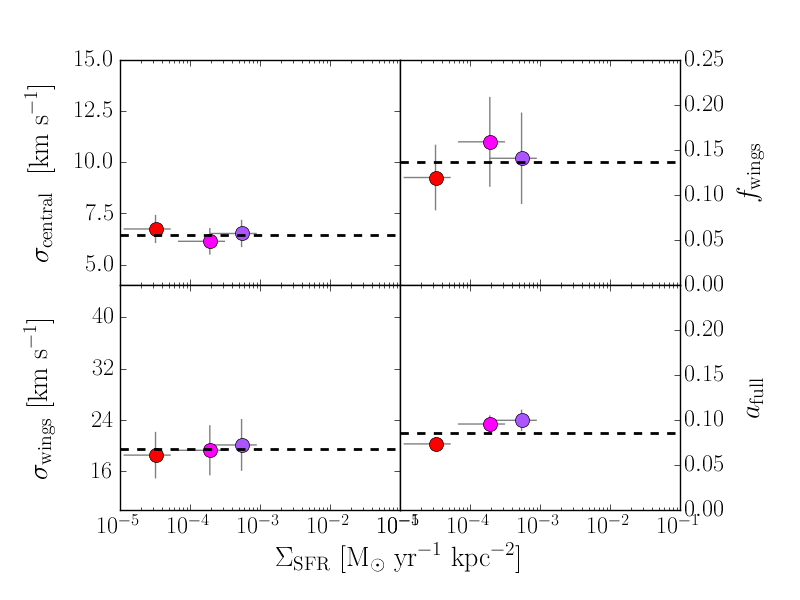
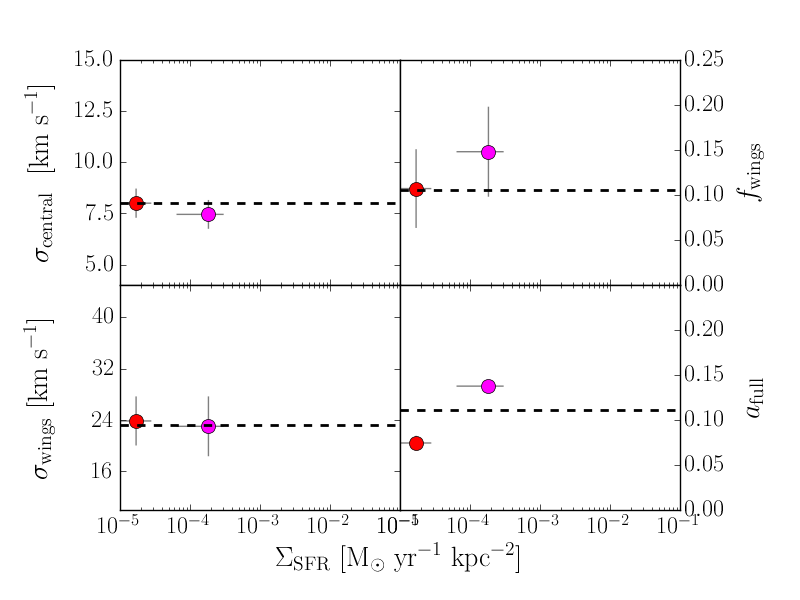
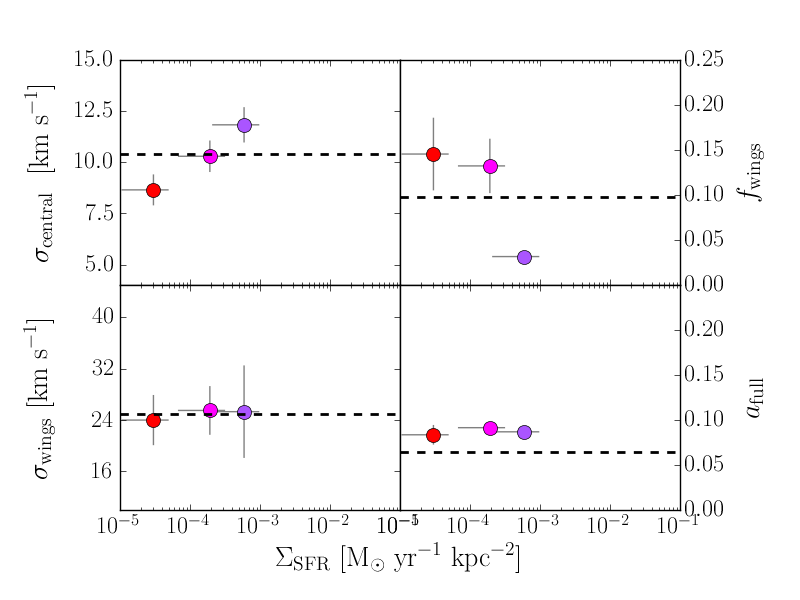
In Figure 3c, we show the behavior of the superprofile parameters for NGC 7793 as a function of radius, normalized to r25subscript𝑟25r_{25}. Again, the color of each point corresponds to the same colored annulus in Figure 3a. The left-hand panels show σcentralsubscript𝜎central\sigma_{\mathrm{central}} (upper) and σwingssubscript𝜎wings\sigma_{\mathrm{wings}} (lower), and the right-hand panels show fwingssubscript𝑓wingsf_{\mathrm{wings}} (upper) and afullsubscript𝑎fulla_{\mathrm{full}} (lower).

Refer to caption
Refer to caption
Figure 3a: Radial annuli in which radial superprofiles are generated for NGC 7793. In both panels, the background greyscale shows ΣHIsubscriptΣHI\Sigma_{\mathrm{HI}}, and the solid black line represents the S/N>5𝑆𝑁5S/N>5 threshold where we can accurately measure vpeaksubscript𝑣peakv_{\mathrm{peak}}. In the lower panel, the colored solid lines represent the average radius of each annulus, and the corresponding shaded regions of the same color indicate which pixels have contributed to each radial superprofile.
Refer to caption
Figure 3b: The radial superprofiles in NGC 7793, where colors indicate the corresponding radial annuli in the previous figure. The left hand panels show the raw superprofiles (upper left) and the superprofiles normalized to the same peak flux (lower left). The right hand panels show the flux-normalized superprofiles scaled by the HWHM (upper right) and the flux-normalized superprofiles minus the model of the Gaussian core (lower right). In all panels, the solid black line represents the global superprofile. In the left panels, we have shown the HWHM-scaled Gaussian model as the dashed black line.
Refer to caption
Figure 3c: Variation of the superprofile parameters as a function of normalized radius for NGC 7793. The dashed black line shows the parameter value for the global superprofile (Paper I). We have plotted the equivalent afullsubscript𝑎fulla_{\mathrm{full}} value of the global superprofile instead of a𝑎a, as measured in Paper I. The asymmetry of spatially-resolved profiles is higher than that of the global superprofile because smaller-scale asymmetries do not average out.

In Figure 4, we show the behavior of σcentralsubscript𝜎central\sigma_{\mathrm{central}} with radius for the sample. Inspection of these figures shows that the more massive galaxies, such as NGC 4214 and NGC 7793, tend to show declining σcentralsubscript𝜎central\sigma_{\mathrm{central}} and σwingssubscript𝜎wings\sigma_{\mathrm{wings}} with increasing radius. These trends are similar to those discussed by Tamburro et al. (2009), who found that H i second moment declined with radius in the more massive galaxies of their sample. In contrast, the parameters for the lower mass galaxies (e.g., Sextans A) do not vary as smoothly with radius as those in larger galaxies. Other galaxy properties, such as SFR or ΣHIsubscriptΣHI\Sigma_{\mathrm{HI}}, do not exhibit smooth radial trends in these dwarfs, so we would not necessarily expect smooth radial trends in the superprofile parameters of lower mass galaxies. This behavior reaffirms our expectation that H i kinematics are not determined by radius itself, but by other parameters that tend to correlate with radius in higher-mass galaxies.

Refer to caption
Figure 4: The velocity dispersion, σcentralsubscript𝜎central\sigma_{\mathrm{central}}, of the superprofiles generated in regions of constant radius. Each panel represents a single galaxy, and galaxies are ordered by decreasing Mbaryon,totsubscript𝑀baryontotM_{\mathrm{baryon,tot}}. Within one panel, each point represents one superprofile. For those galaxies where we have generated superprofiles inside and outside r25subscript𝑟25r_{25}, we plot the two superprofiles at r/r25=0.5𝑟subscript𝑟250.5r/r_{25}=0.5 and 1.51.51.5, respectively. The velocity dispersion decreases smoothly with radius for the more massive galaxies, but shows erratic behavior for lower mass galaxies.

We show the radially-resolved superprofiles for all sample galaxies at the end of the paper in Appendix B, in order of decreasing Mbaryon,totsubscript𝑀baryontotM_{\mathrm{baryon,tot}}. For those 10 dwarf galaxies where radial analysis is impossible, we plot the superprofiles inside and outside r25subscript𝑟25r_{25}, colored respectively by blue and red.

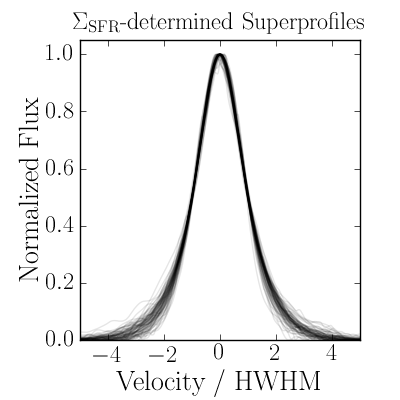
3.3.2 ΣSFRsubscriptΣSFR\Sigma_{\mathrm{SFR}}-determined Superprofiles

Because star formation is often connected to H i kinematics in the literature, we also generate superprofiles based on local values of the inclination-corrected star formation rate intensity ΣSFRsubscriptΣSFR\Sigma_{\mathrm{SFR}}. This choice allows us to characterize how H i kinematics change as the star formation rate varies across the galaxy in a more direct way than the radial method.

We have adopted six ΣSFRsubscriptΣSFR\Sigma_{\mathrm{SFR}} bins for our analysis:

ΣSFR<104Myr1kpc2104<ΣSFR<103.5103.5<ΣSFR<103103<ΣSFR<102.5102.5<ΣSFR<102102<ΣSFRmissing-subexpressionmissing-subexpressionsubscriptΣSFRsuperscript104subscriptMdirect-productsuperscriptyr1superscriptkpc2superscript104subscriptΣSFRsuperscript103.5superscript103.5subscriptΣSFRsuperscript103superscript103subscriptΣSFRsuperscript102.5superscript102.5subscriptΣSFRsuperscript102superscript102subscriptΣSFRmissing-subexpressionmissing-subexpression\begin{array}[]{lcccl}&&\Sigma_{\mathrm{SFR}}{}&<&10^{-4}\;\mathrm{M}_{\odot}\;\mathrm{yr}^{-1}\;\mathrm{kpc}^{-2}\\ 10^{-4}&<&\Sigma_{\mathrm{SFR}}{}&<&10^{-3.5}\\ 10^{-3.5}&<&\Sigma_{\mathrm{SFR}}{}&<&10^{-3}\\ 10^{-3}&<&\Sigma_{\mathrm{SFR}}{}&<&10^{-2.5}\\ 10^{-2.5}&<&\Sigma_{\mathrm{SFR}}{}&<&10^{-2}\\ 10^{-2}&<&\Sigma_{\mathrm{SFR}}{}&&\\ \end{array} (5)

These values span the observed ΣSFRsubscriptΣSFR\Sigma_{\mathrm{SFR}} range of our sample, but are small compared to typical ΣSFRsubscriptΣSFR\Sigma_{\mathrm{SFR}} values for larger spirals, which can exceed 101superscript10110^{-1} MsubscriptMdirect-product\mathrm{M}_{\odot} kpc-2 yr-1 in the central regions (e.g., Leroy et al., 2008).

For each galaxy, we generate superprofiles using pixels whose local ΣSFRsubscriptΣSFR\Sigma_{\mathrm{SFR}} falls in each bin. We note that star formation rates in some of the lower-mass galaxies do not span the full ΣSFRsubscriptΣSFR\Sigma_{\mathrm{SFR}} range sampled by our bins, and thus will have fewer than six superprofiles.

In Figure 5, we show histograms of the ΣSFRsubscriptΣSFR\Sigma_{\mathrm{SFR}} values for the galaxies in our sample, ordered by decreasing Mbaryon,totsubscript𝑀baryontotM_{\mathrm{baryon,tot}}. Each panel shows the distribution of inclination-corrected ΣSFRsubscriptΣSFR\Sigma_{\mathrm{SFR}} values for pixels that fall above the H i S/N>5𝑆𝑁5S/N>5 threshold for a single galaxy. The ΣSFRsubscriptΣSFR\Sigma_{\mathrm{SFR}} bin edges given in Equation 5 are displayed as dashed vertical black lines.

Refer to caption
Figure 5: Histograms of inclination-corrected ΣSFRsubscriptΣSFR\Sigma_{\mathrm{SFR}} values in each galaxy, in order of decreasing Mbaryon,totsubscript𝑀baryontotM_{\mathrm{baryon,tot}}. Each panel represents the distribution of ΣSFRsubscriptΣSFR\Sigma_{\mathrm{SFR}} values for pixels above the H i S/N>5𝑆𝑁5S/N>5 threshold for a single galaxy. The number in parentheses below the galaxy name indicates the number of independent resolution elements above the S/N>5𝑆𝑁5S/N>5 threshold for the entire galaxy. Note that not all galaxies have valid pixels in each bin.

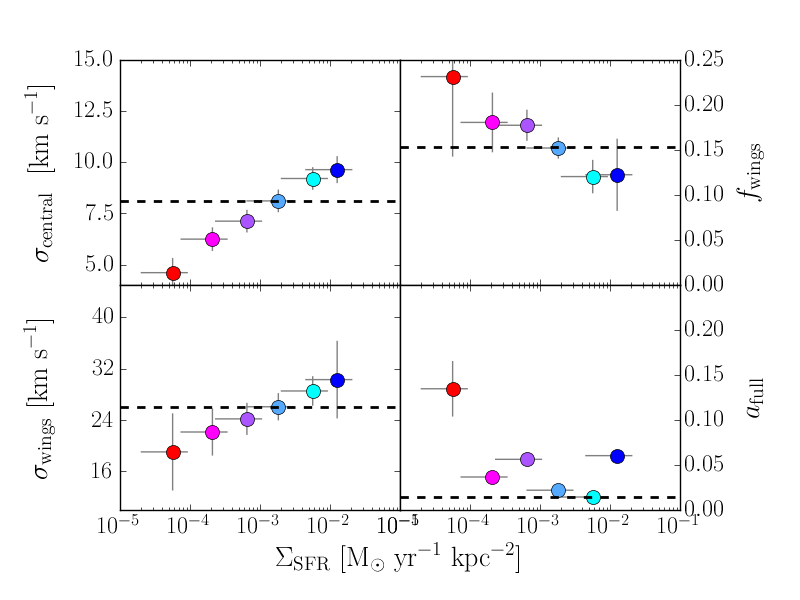
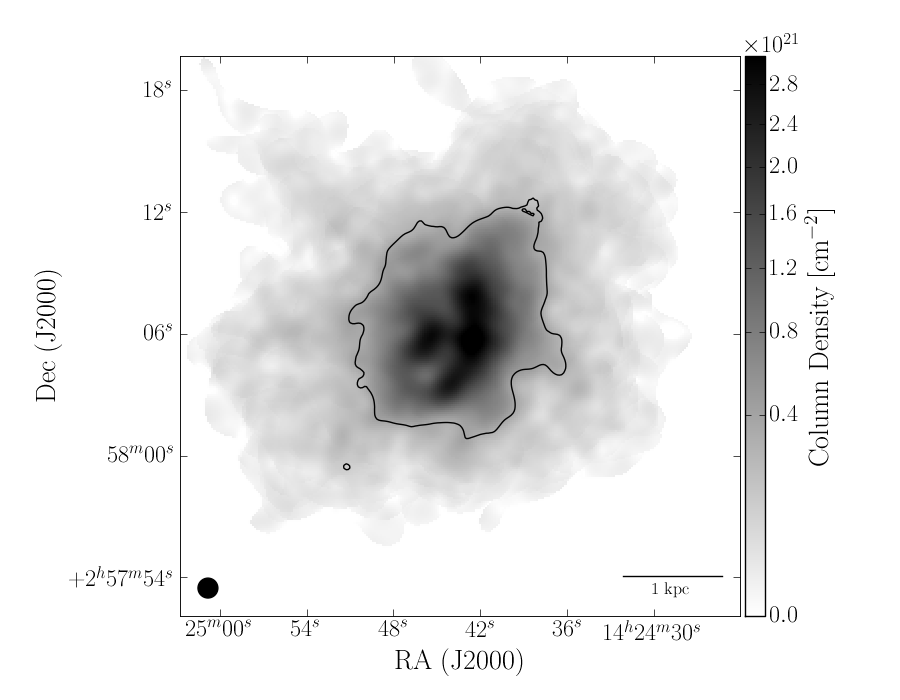
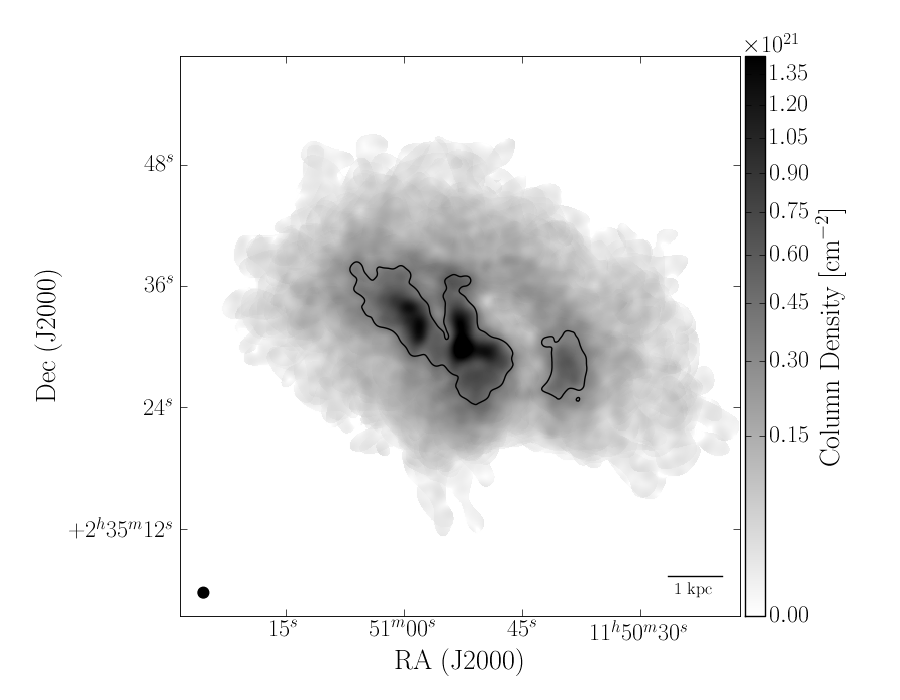
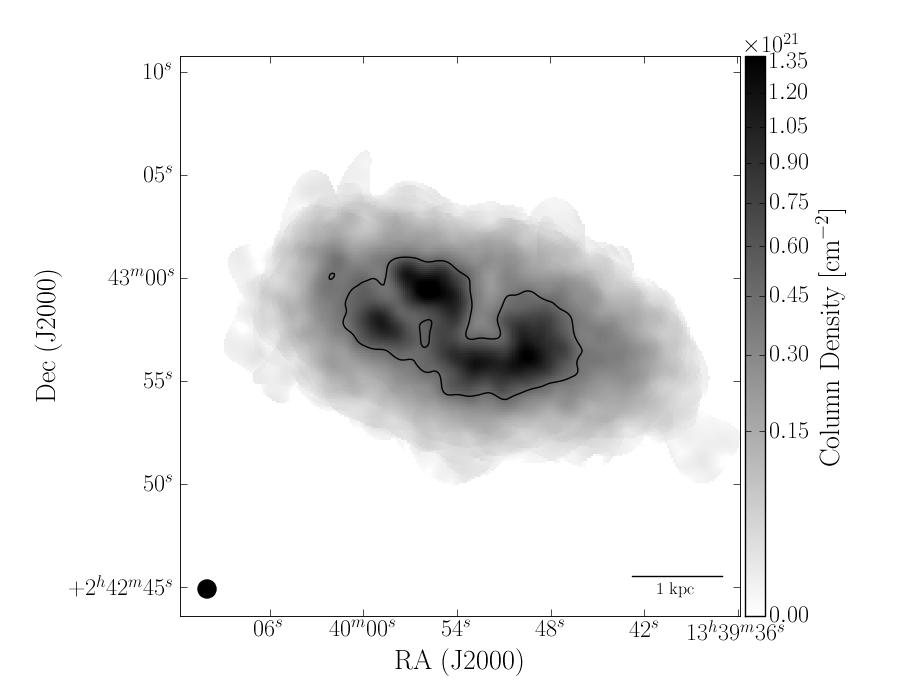
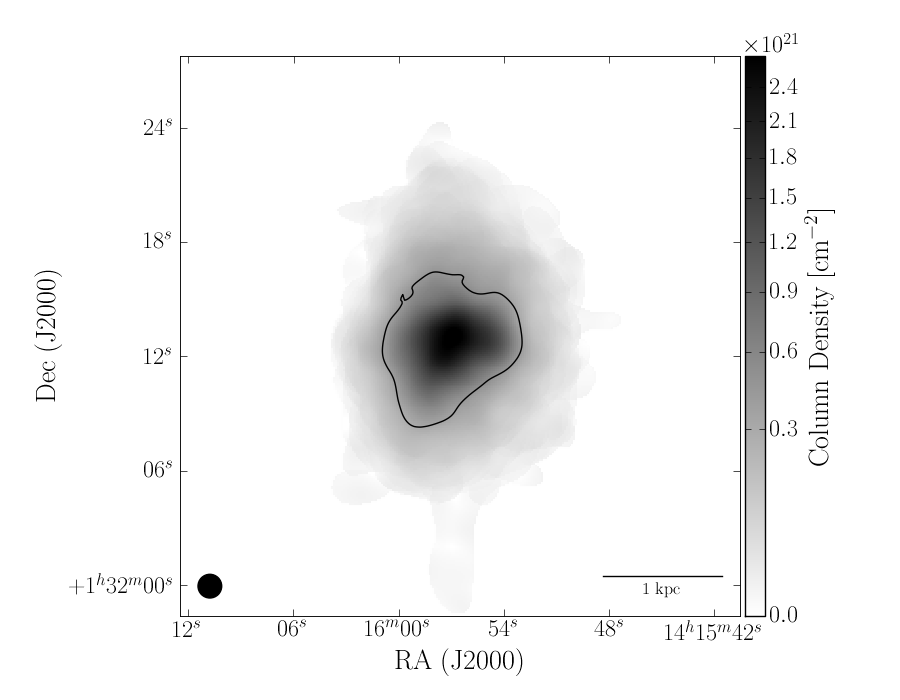
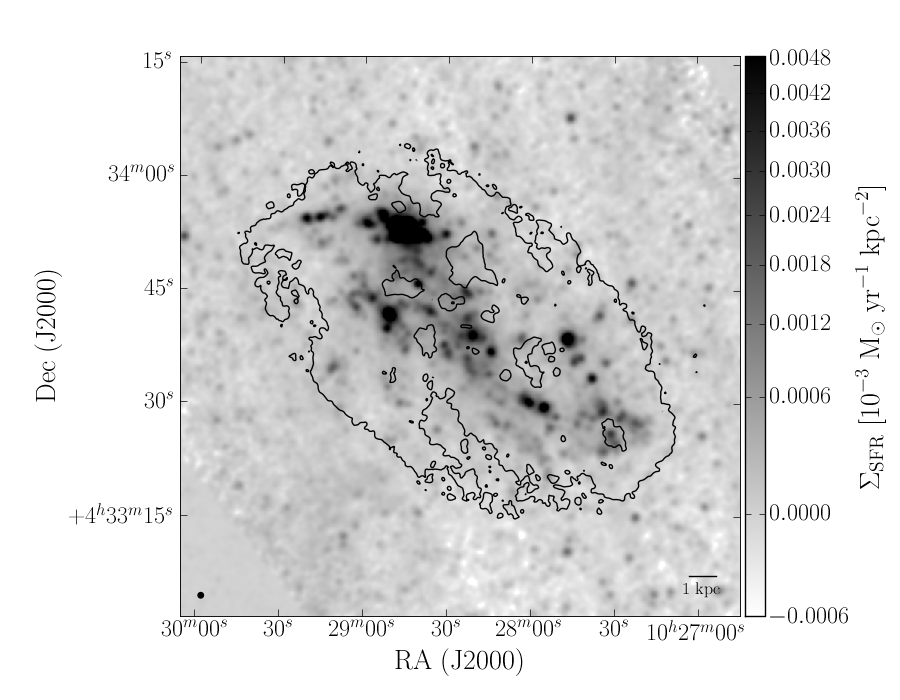
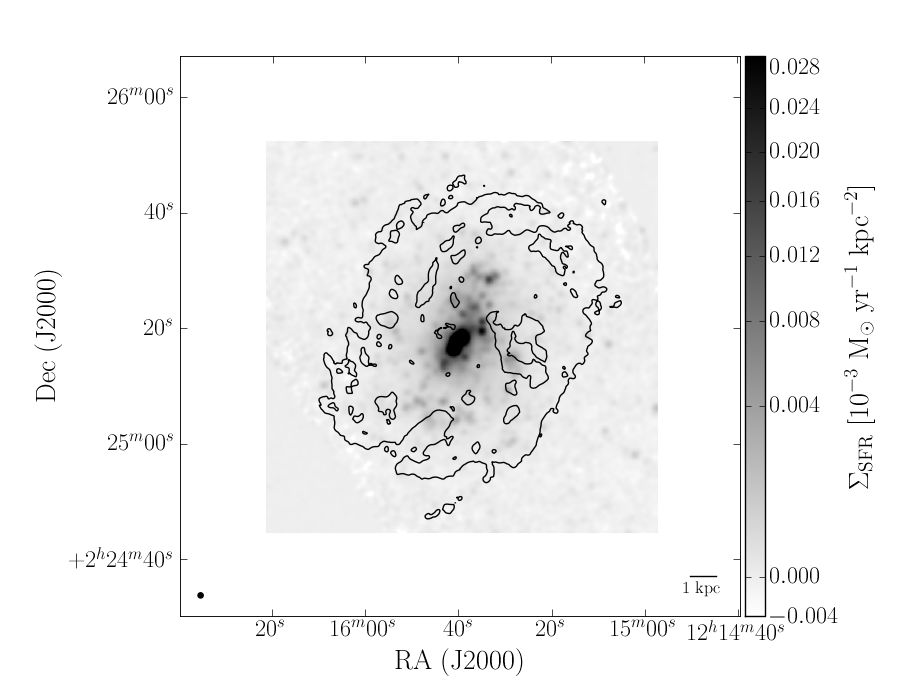
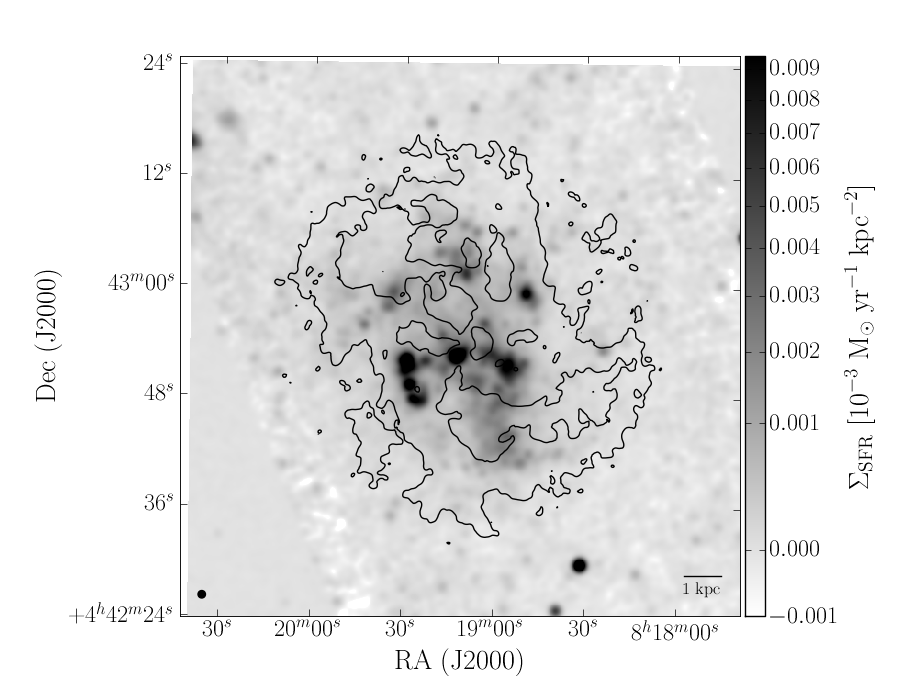
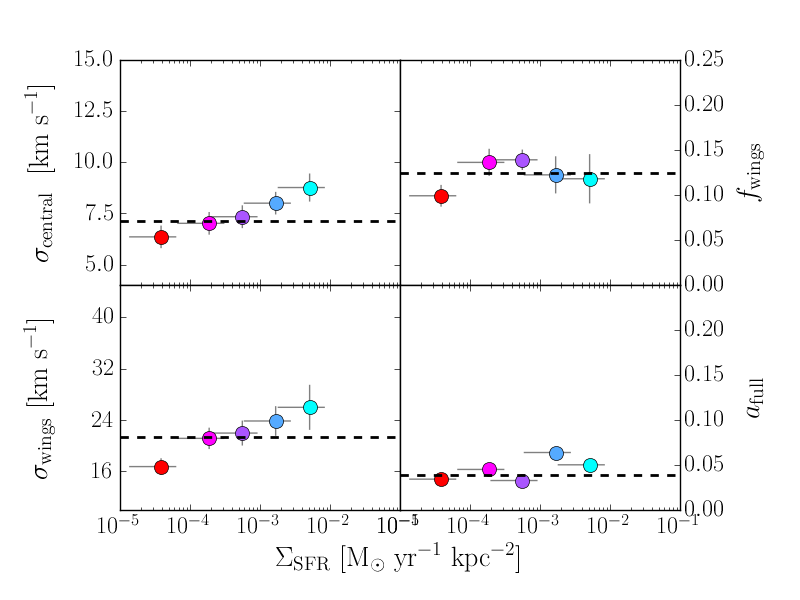
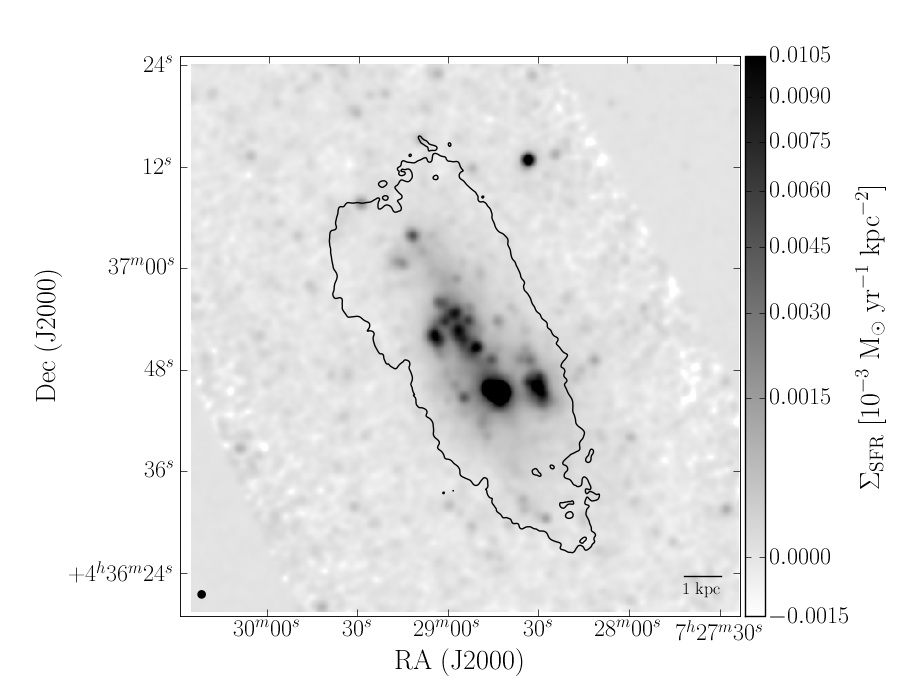
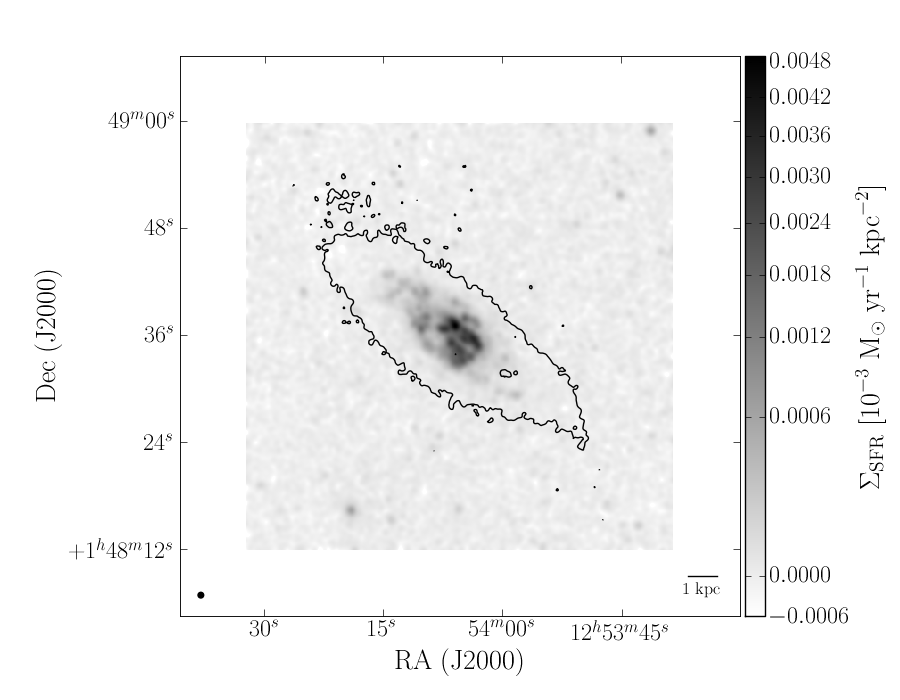
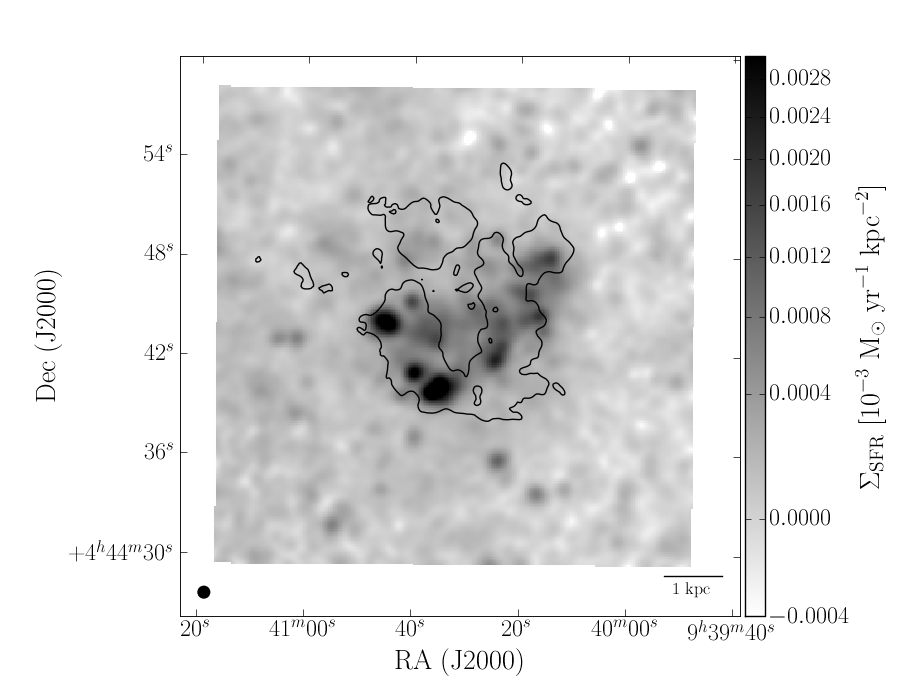
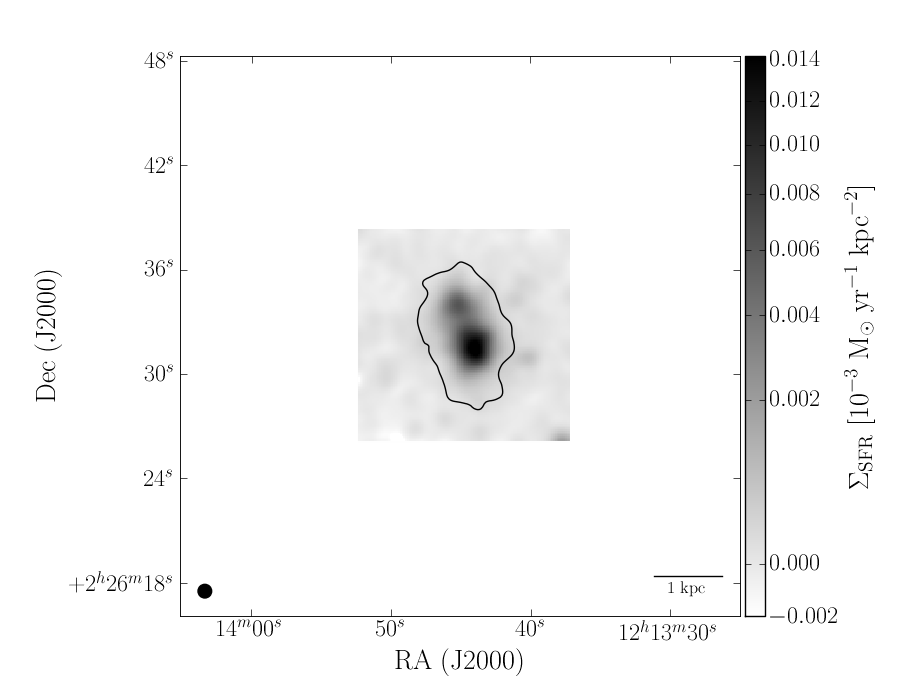
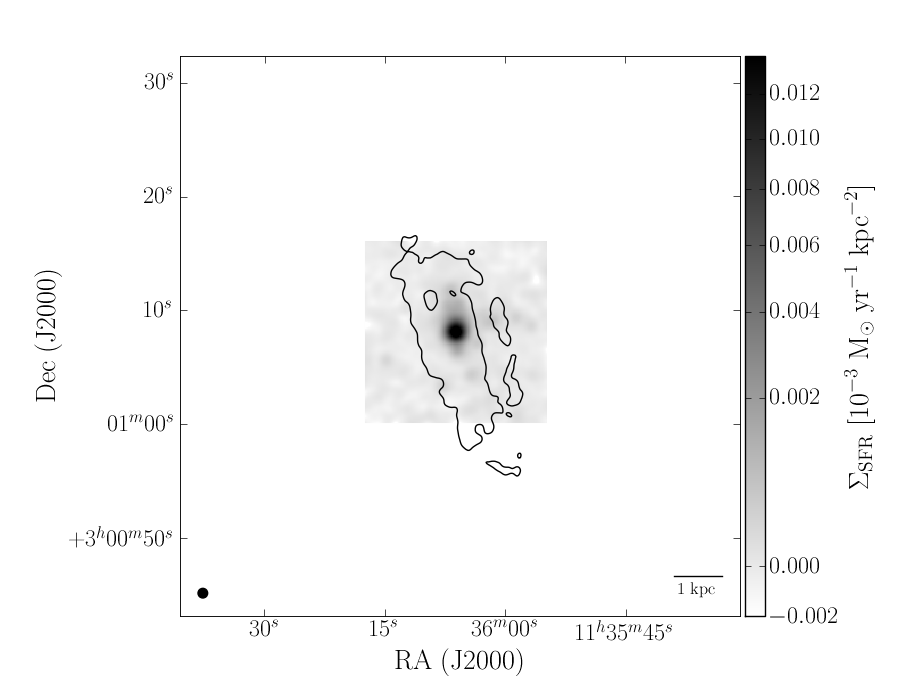
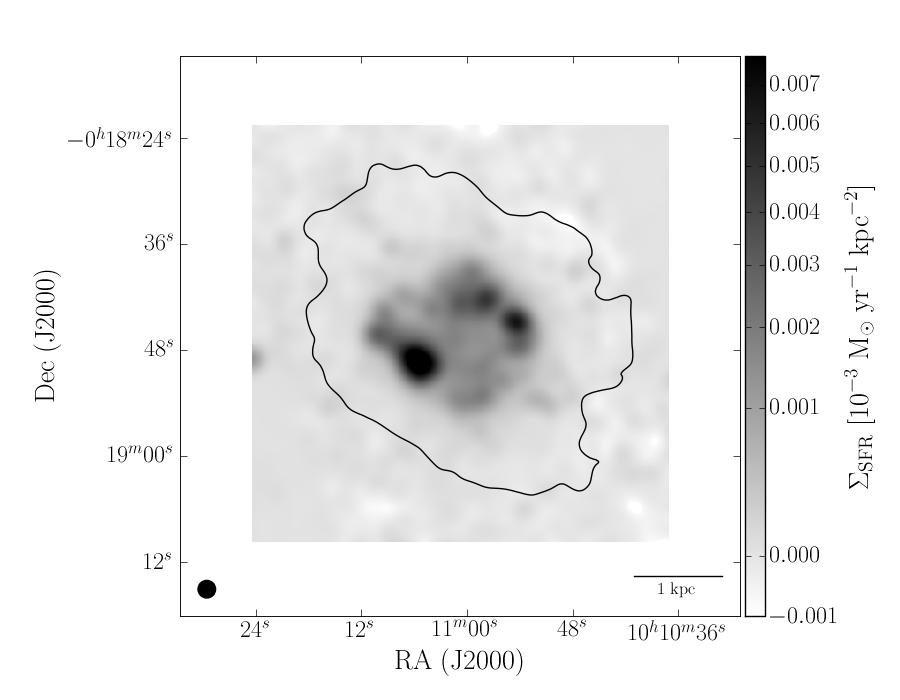
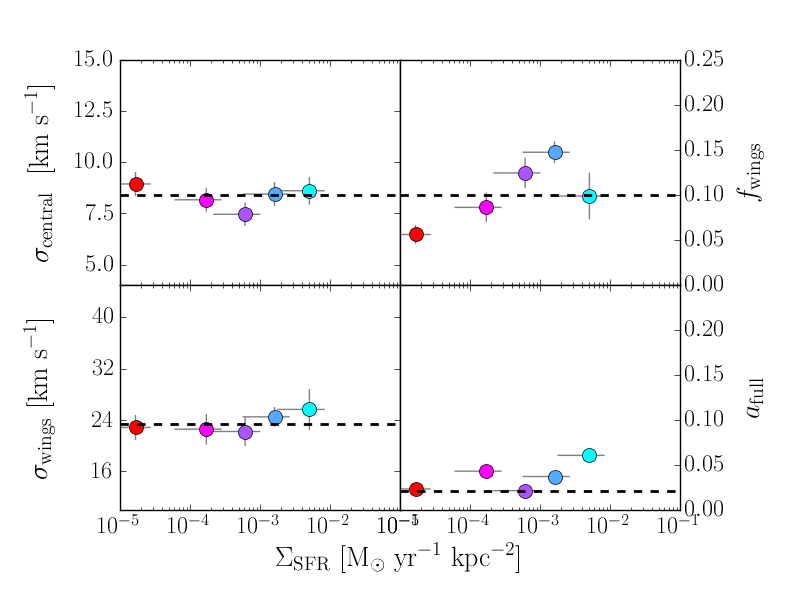
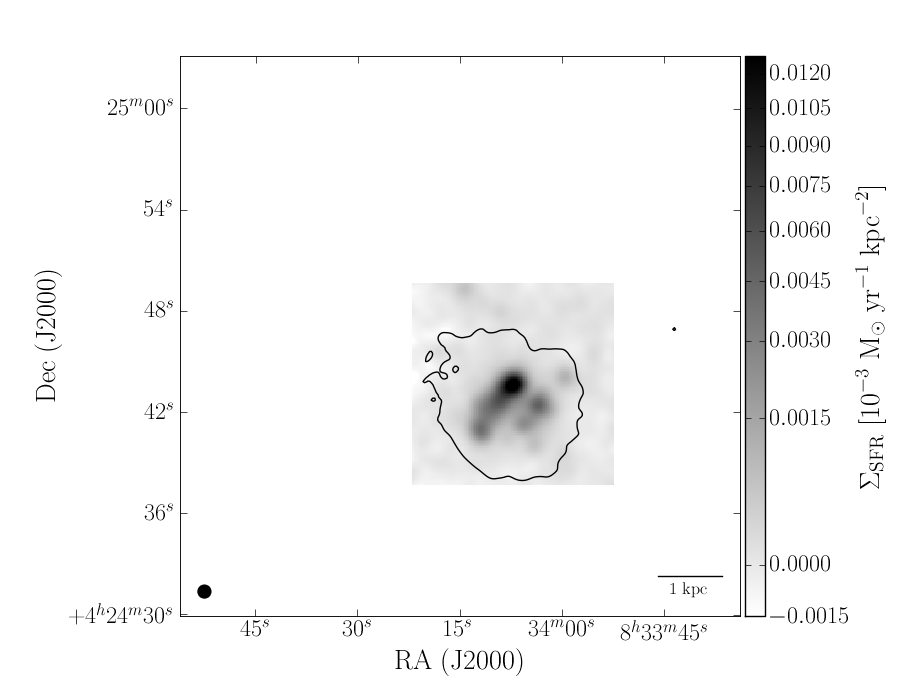
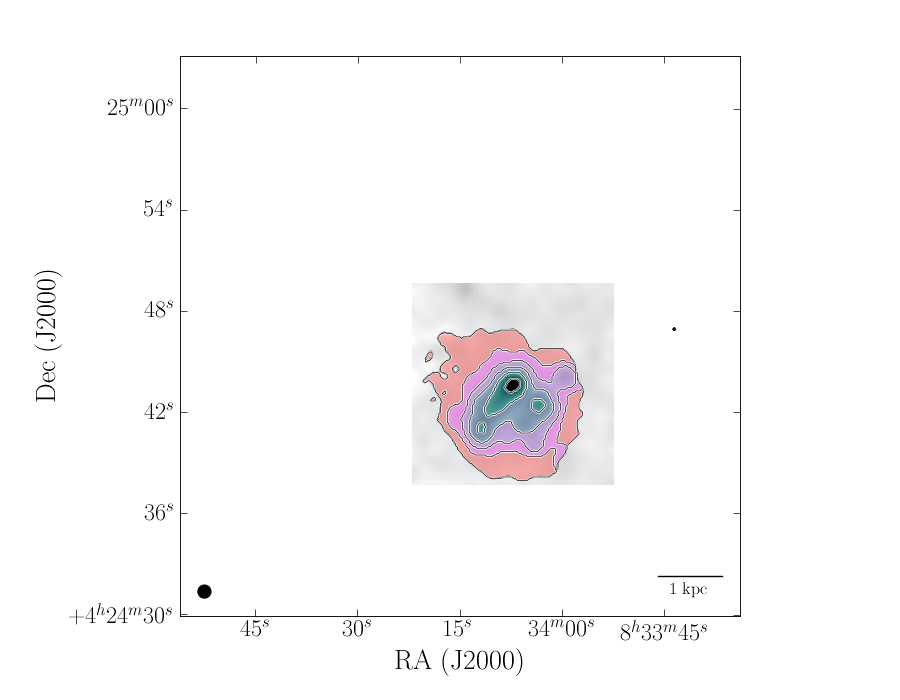
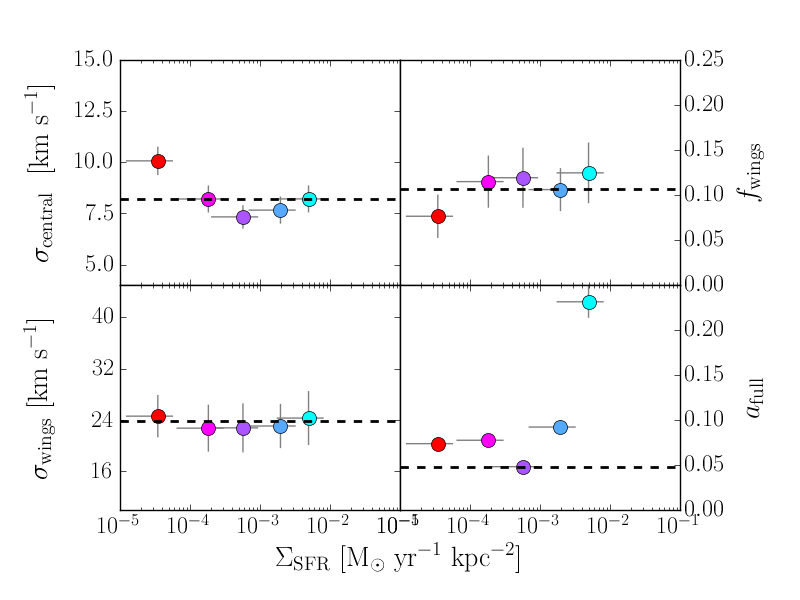
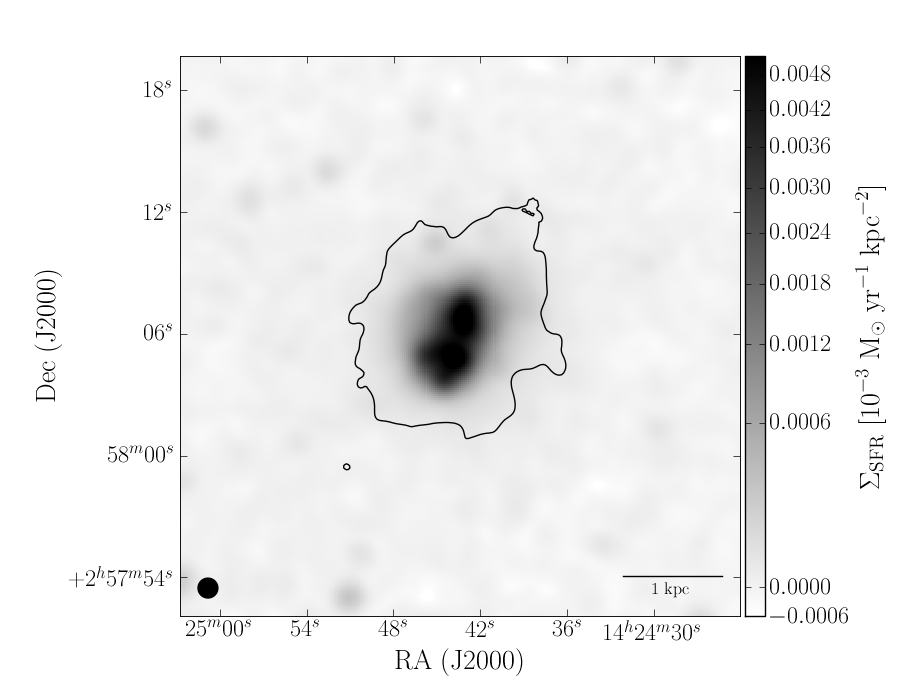
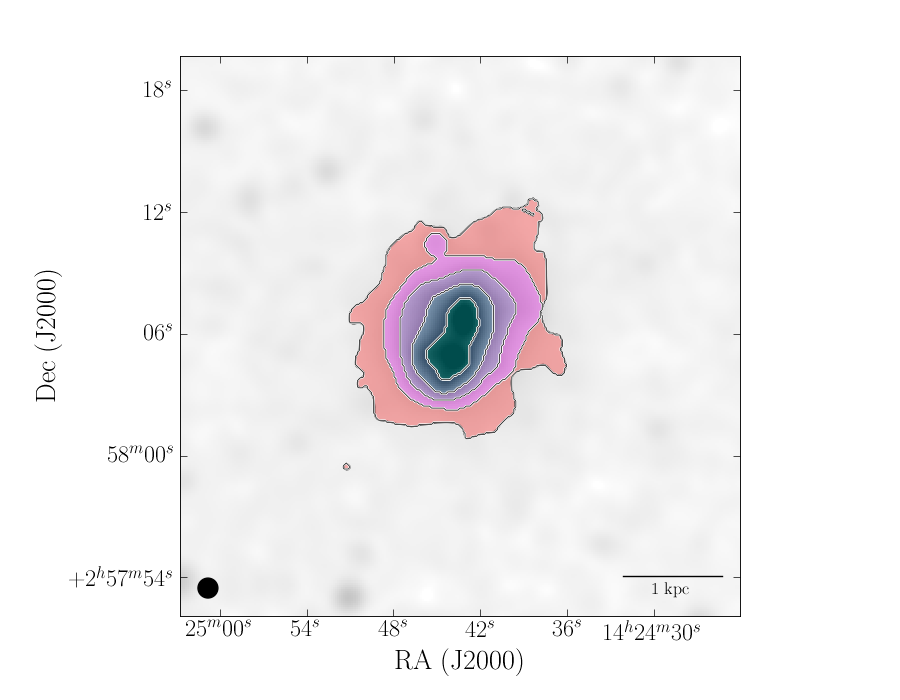
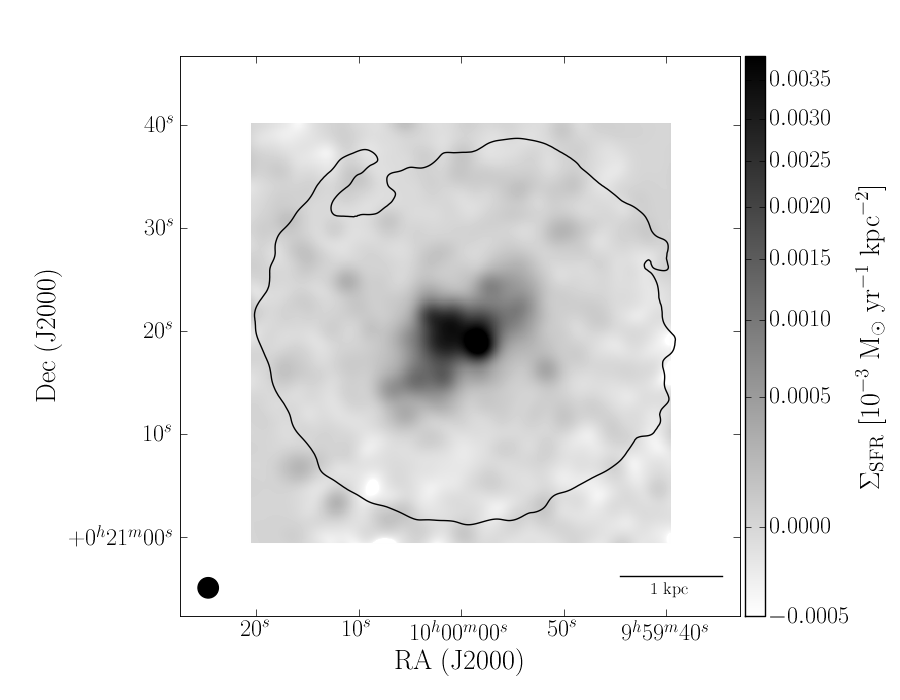
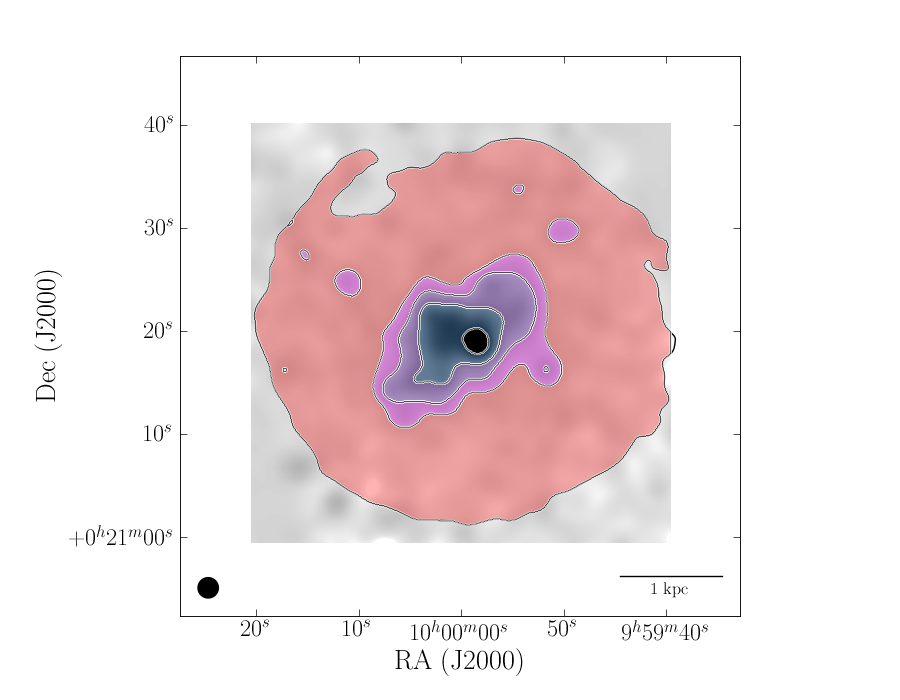
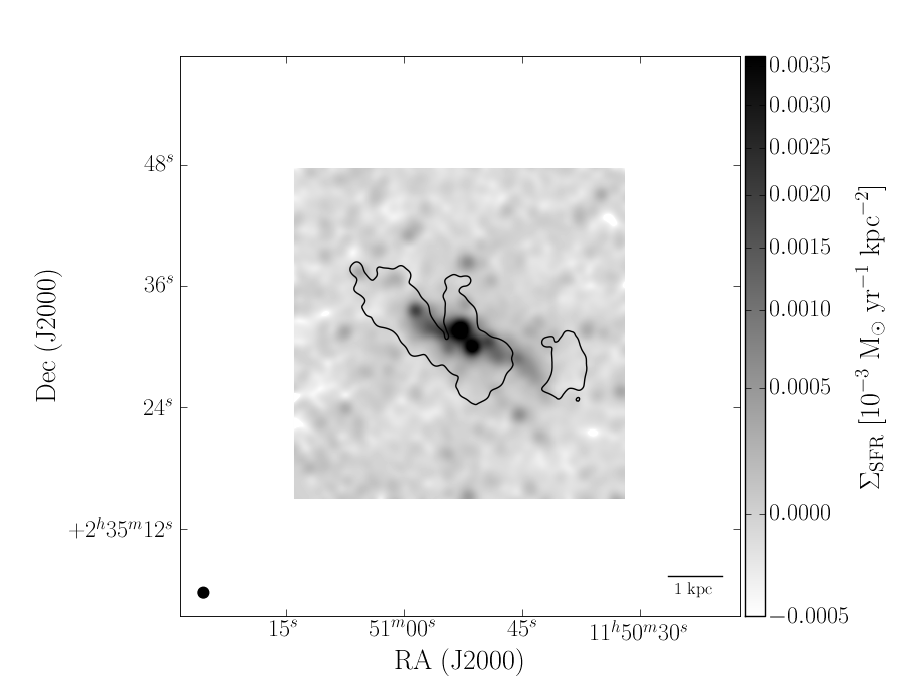
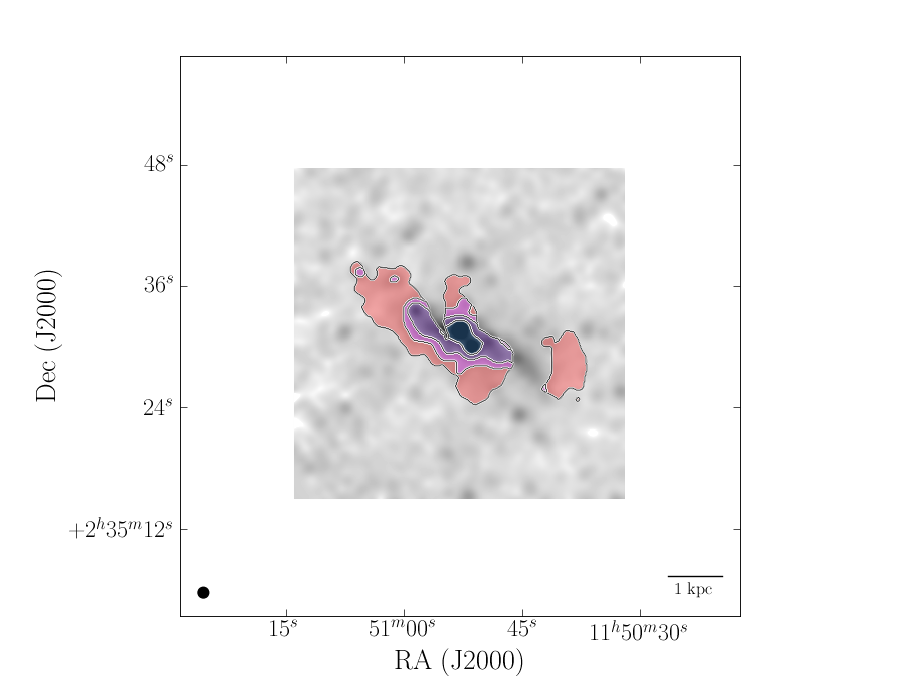
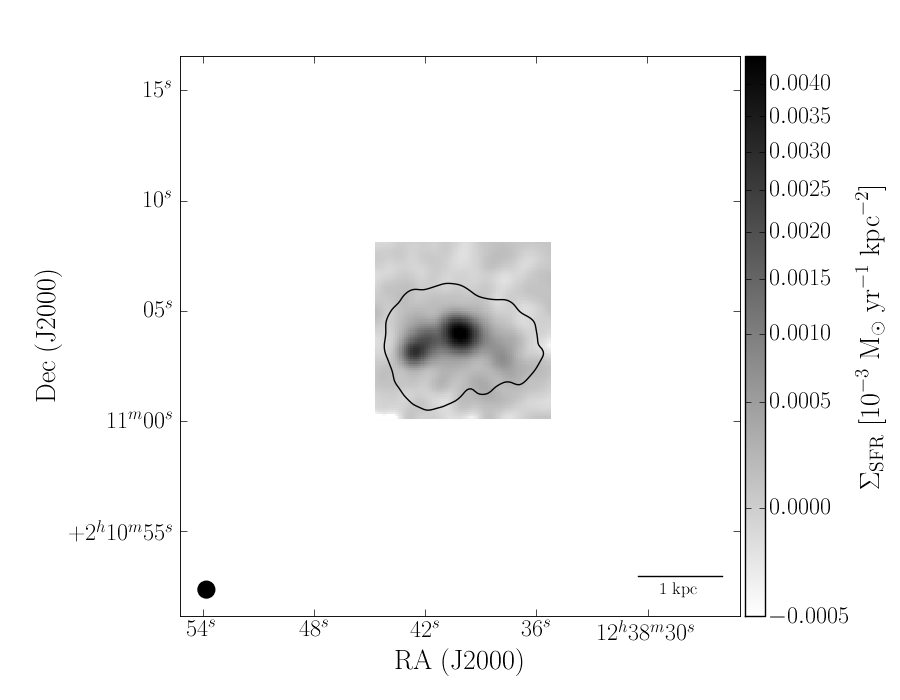
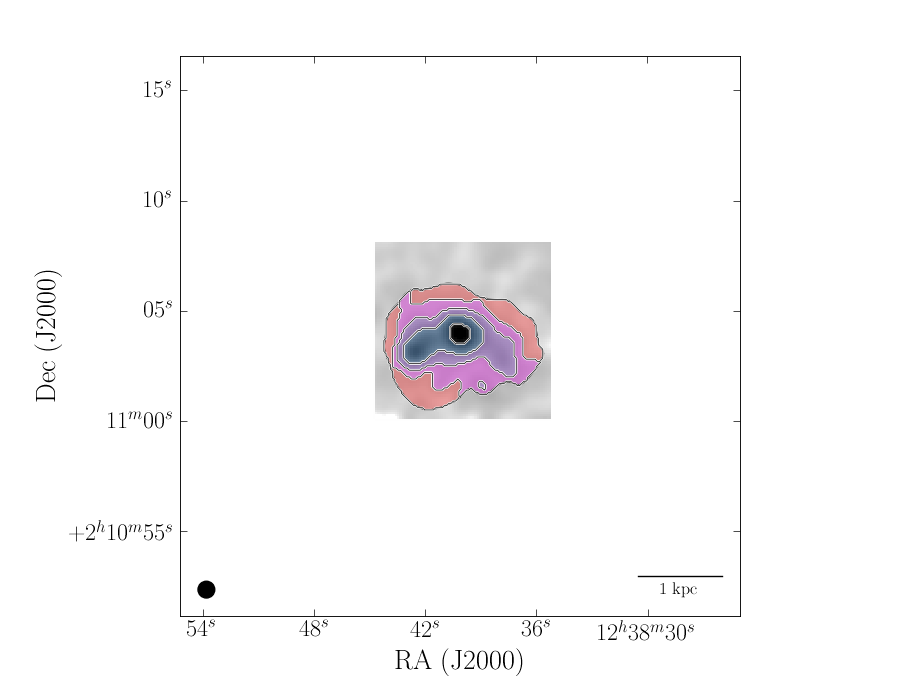
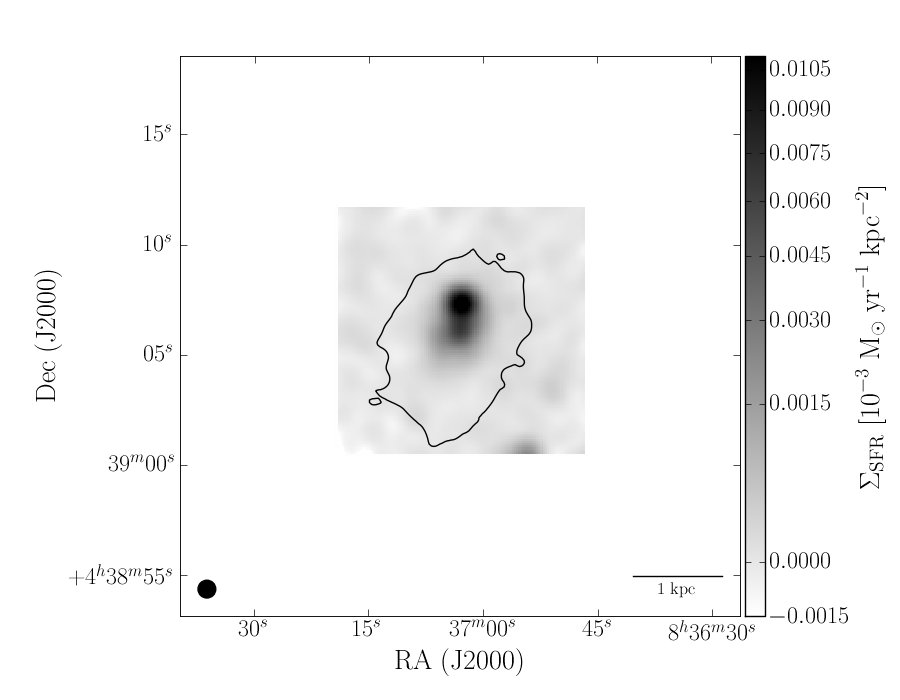
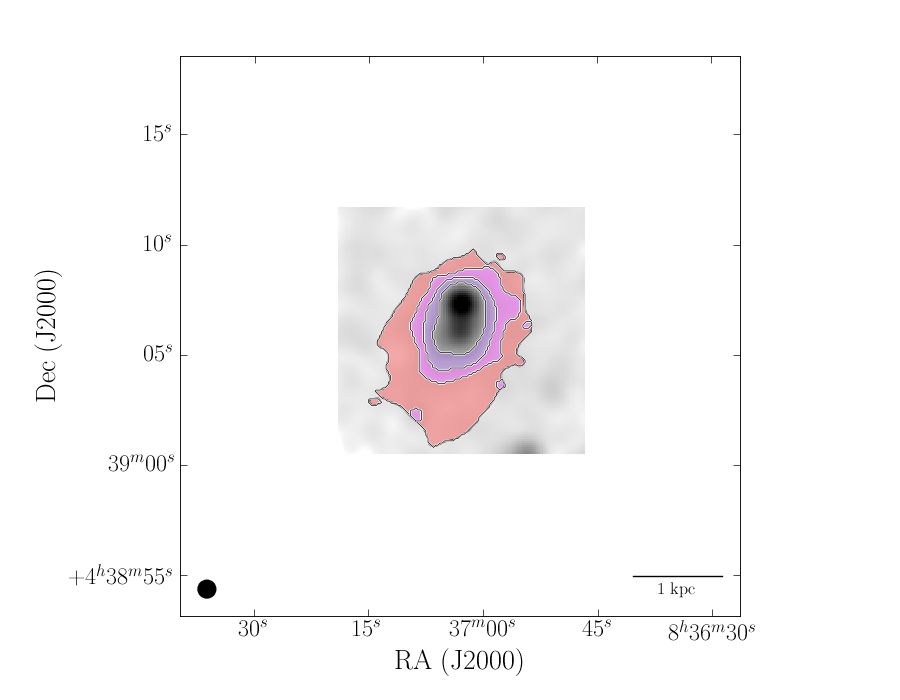
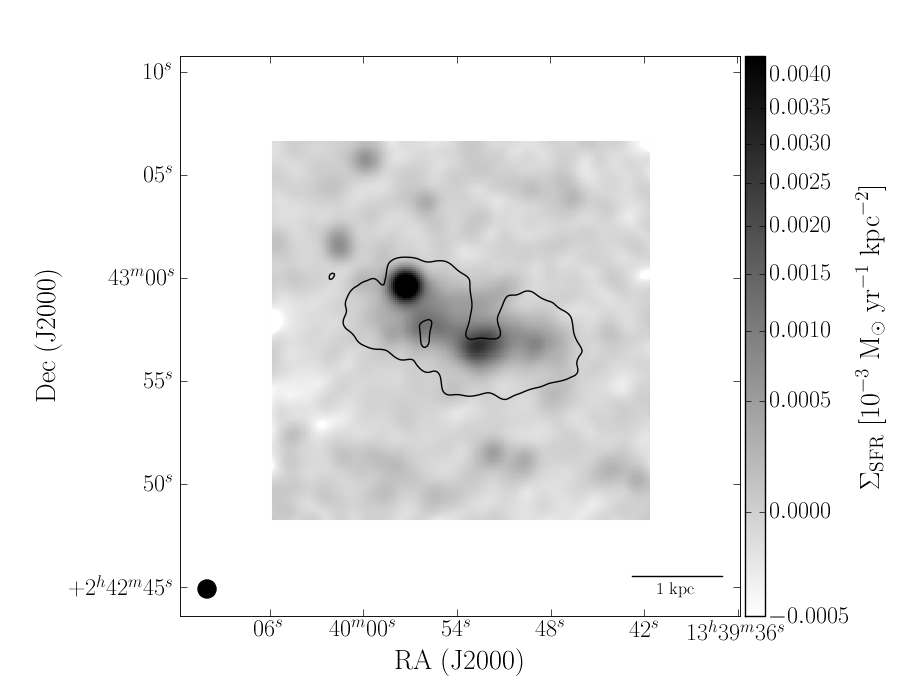
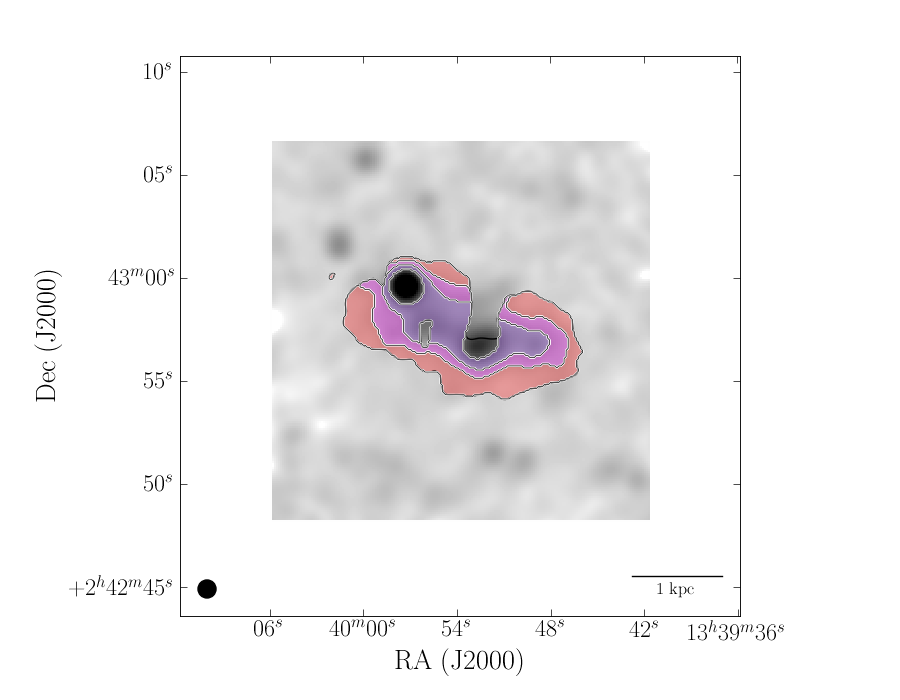
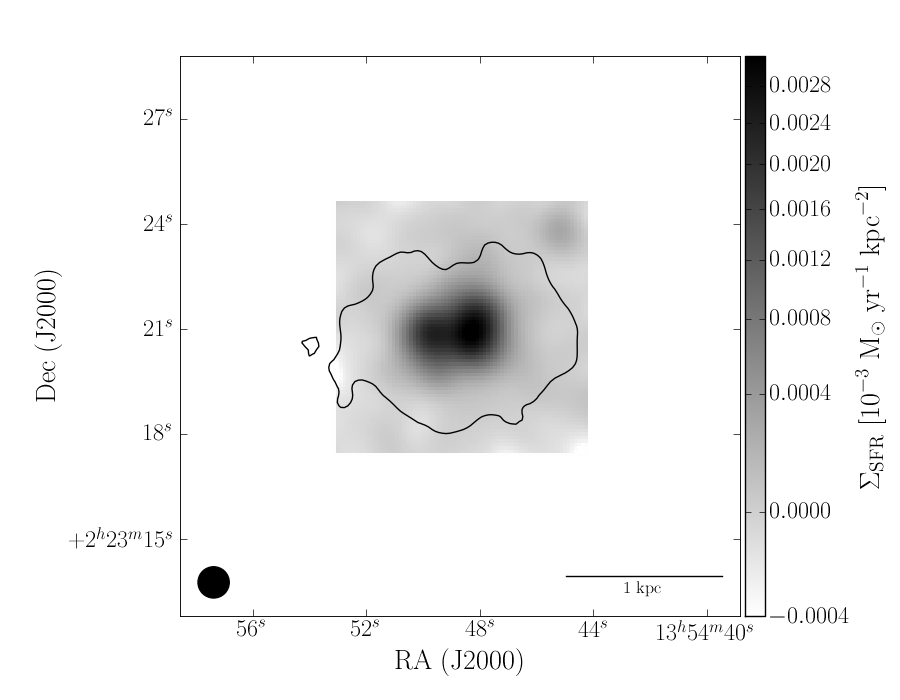
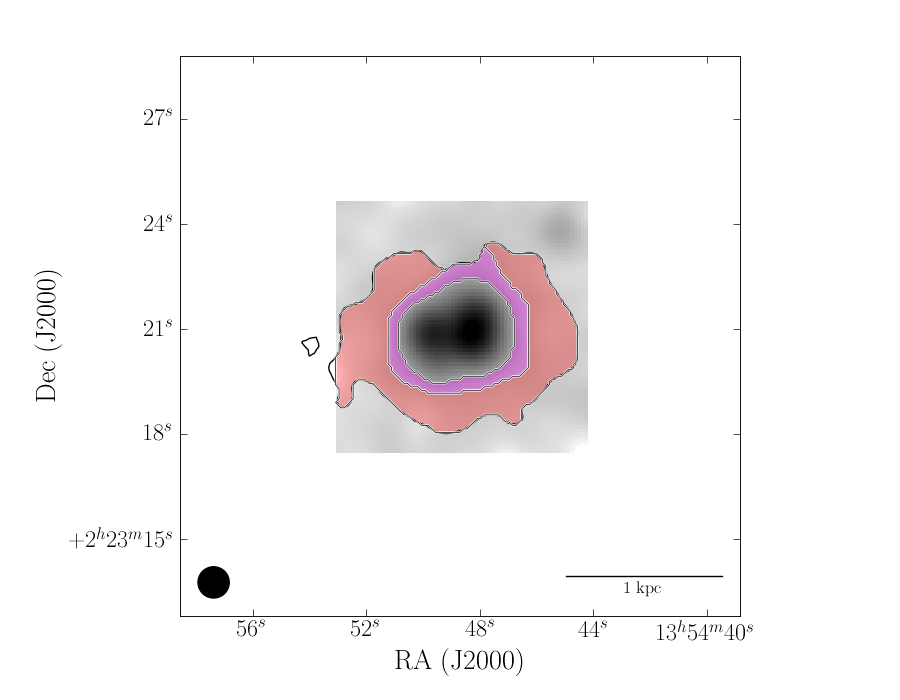
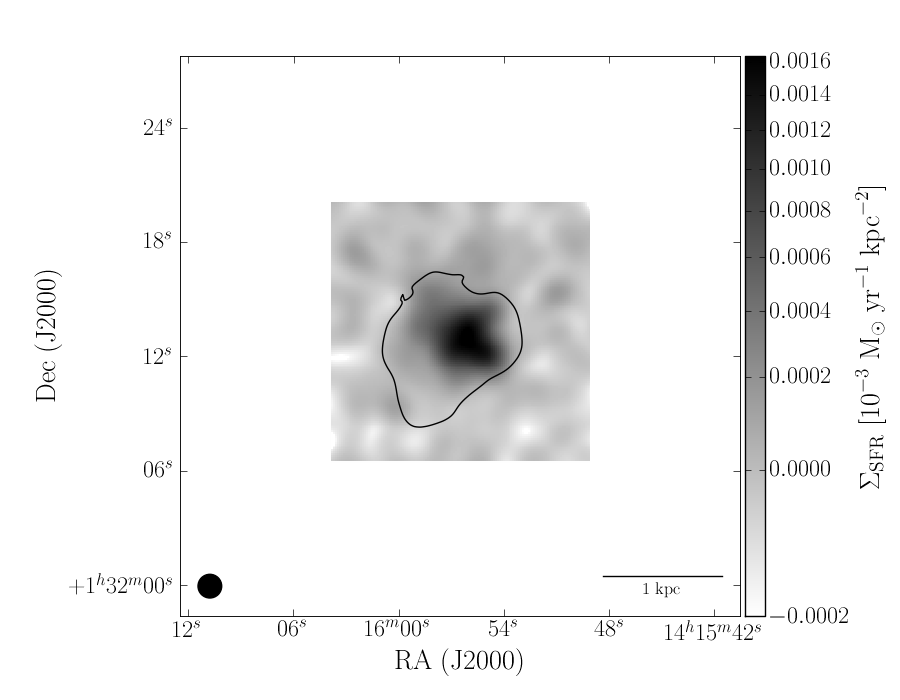
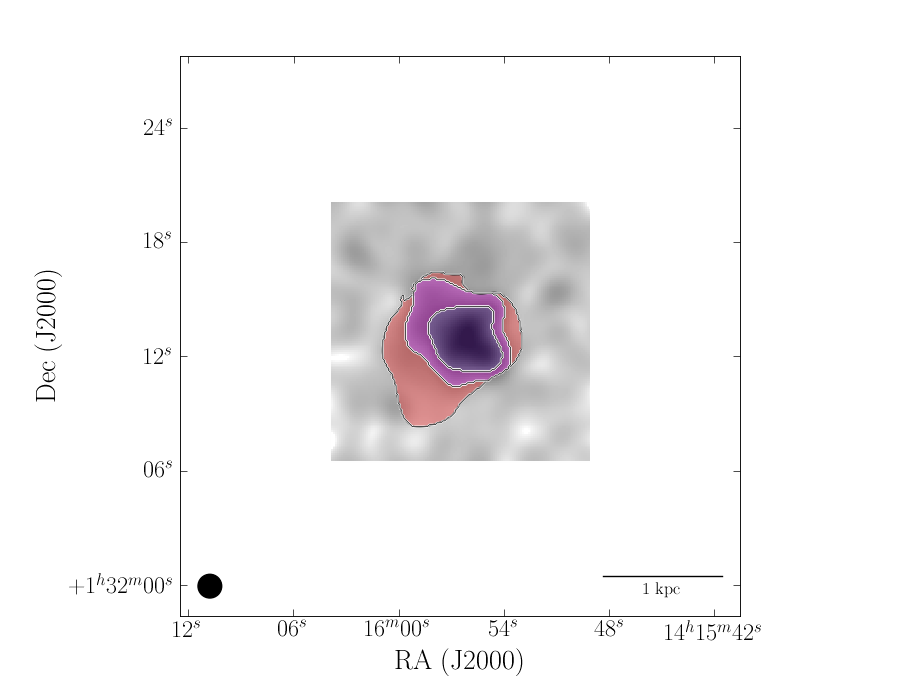
In Figures 6a - 6c, we show an example of the ΣSFRsubscriptΣSFR\Sigma_{\mathrm{SFR}} superprofiles for NGC 7793. The layout is similar to that used in the figures for the radially-resolved superprofiles (Figures 3a - 3c), with a few exceptions. in Figure 6a, the greyscale image is the ΣSFRsubscriptΣSFR\Sigma_{\mathrm{SFR}} map measured with FUV+24μ𝜇\mum emission instead of ΣHIsubscriptΣHI\Sigma_{\mathrm{HI}} as was used in Figure 3a. We have also plotted the parameters in Figure 6c as a function of ΣSFRsubscriptΣSFR\Sigma_{\mathrm{SFR}} instead of radius.

Refer to caption
Refer to caption
Figure 6a: ΣSFRsubscriptΣSFR\Sigma_{\mathrm{SFR}} regions in which superprofiles are generated for NGC 7793. In both panels, the background greyscale shows ΣSFRsubscriptΣSFR\Sigma_{\mathrm{SFR}}, and the solid black line represents the S/N>5𝑆𝑁5S/N>5 threshold where we can accurately measure vpeaksubscript𝑣peakv_{\mathrm{peak}}. In the lower panel, the colored regions show which pixels have contributed to each ΣSFRsubscriptΣSFR\Sigma_{\mathrm{SFR}} superprofile.
Refer to caption
Figure 6b: The ΣSFRsubscriptΣSFR\Sigma_{\mathrm{SFR}} superprofiles in NGC 7793, where colors indicate the corresponding regions in the previous figure. The left hand panels show the raw superprofiles (upper left) and the superprofiles normalized to the same peak flux (lower left). The right hand panels show the flux-normalized superprofiles scaled by the HWHM (upper right) and the flux-normalized superprofiles minus the model of the Gaussian core (lower right). In all panels, the solid black line represents the global superprofile. In the left panels, we have shown the HWHM-scaled Gaussian model as the dashed black line.
Refer to caption
Figure 6c: Variation of the ΣSFRsubscriptΣSFR\Sigma_{\mathrm{SFR}} superprofile parameters as a function of ΣSFRsubscriptΣSFR\Sigma_{\mathrm{SFR}} for NGC 7793. The solid dashed line shows the parameter value for the global superprofile (Paper I). As before, we have plotted the equivalent afullsubscript𝑎fulla_{\mathrm{full}} value of the global superprofile instead of a𝑎a, as measured in Paper I. Both σcentralsubscript𝜎central\sigma_{\mathrm{central}} and σwingssubscript𝜎wings\sigma_{\mathrm{wings}} increase with increasing ΣSFRsubscriptΣSFR\Sigma_{\mathrm{SFR}}, while fwingssubscript𝑓wingsf_{\mathrm{wings}} decreases with increasing ΣSFRsubscriptΣSFR\Sigma_{\mathrm{SFR}}. The trends between afullsubscript𝑎fulla_{\mathrm{full}} and ΣSFRsubscriptΣSFR\Sigma_{\mathrm{SFR}} is less smooth.

In Figure 7, we highlight the behavior of σcentralsubscript𝜎central\sigma_{\mathrm{central}} as a function of radius in the sample. As with the radial superprofiles, many of the more massive galaxies in the sample have parameters that vary smoothly as a function ΣSFRsubscriptΣSFR\Sigma_{\mathrm{SFR}}. In particular, both σcentralsubscript𝜎central\sigma_{\mathrm{central}} and σwingssubscript𝜎wings\sigma_{\mathrm{wings}} tend to increase with increasing ΣSFRsubscriptΣSFR\Sigma_{\mathrm{SFR}} in the more massive galaxies (IC 2574, NGC 4214, Ho II, NGC 3741), but this trend is not ubiquitous; a number of the galaxies show no strong trend or the opposite trend.

Refer to caption
Figure 7: The velocity dispersion, σcentralsubscript𝜎central\sigma_{\mathrm{central}}, of the superprofiles generated in regions of constant ΣSFRsubscriptΣSFR\Sigma_{\mathrm{SFR}}. Each panel represents a single galaxy, and galaxies are ordered by decreasing Mbaryon,totsubscript𝑀baryontotM_{\mathrm{baryon,tot}}. Within one panel, each point represents one superprofile. The velocity dispersion increases smoothly with ΣSFRsubscriptΣSFR\Sigma_{\mathrm{SFR}} for the more massive galaxies, but shows erratic behavior for lower mass galaxies.

The ΣSFRsubscriptΣSFR\Sigma_{\mathrm{SFR}} superprofiles for the sample are shown in Appendix B.2.

4 H i Kinematics as a Function of Local Galaxy Properties

In Paper I, we compared global superprofile parameters to galaxy physical properties, averaged over the entire galaxy. In this paper, we assess the behavior of superprofile parameters in regions of constant projected radius or ΣSFRsubscriptΣSFR\Sigma_{\mathrm{SFR}}, averaged over 200 pc scales. By deriving superprofiles in these subregions, we increase our sensitivity to any dependence of H i kinematics on local galaxy properties (i.e., ΣHIsubscriptΣHI\Sigma_{\mathrm{HI}}, ΣSFRsubscriptΣSFR\Sigma_{\mathrm{SFR}}, ΣbaryonsubscriptΣbaryon\Sigma_{\mathrm{baryon}}).

To determine whether a correlation exists between a superprofile parameter and a physical property, we use the Spearman rank correlation coefficient. As described in Paper I, this statistic tests for a monotonically increasing (rS>0subscript𝑟𝑆0r_{S}>0) or decreasing (rS<0subscript𝑟𝑆0r_{S}<0) relationship between the two variables. The corresponding pSsubscript𝑝𝑆p_{S} value gives the probability of finding an rSsubscript𝑟𝑆r_{S} value equal to or more extreme than the observed rSsubscript𝑟𝑆r_{S} from a random sample. We choose pS=0.01subscript𝑝𝑆0.01p_{S}=0.01 as a threshold for finding a significant correlation. The rSsubscript𝑟𝑆r_{S} and pSsubscript𝑝𝑆p_{S} values are given in Tables 1 for the radially-resolved superprofiles and in Table 4 for the ΣSFRsubscriptΣSFR\Sigma_{\mathrm{SFR}} superprofiles.

For the radial superprofiles, the larger galaxies in our sample have far more independent points than the smaller galaxies. In fact, as seen in Table LABEL:tab:resolved--sample-res the four most massive dwarfs (NGC 7793, IC 2574, NGC 4214, and Ho II) contribute over 50% of the points to the radial correlation plots, whereas the smallest dwarfs typically have only two radial bins each (inside and outside r25subscript𝑟25r_{25}). This overweighting of the larger galaxies is decreased when examining correlations in the ΣSFRsubscriptΣSFR\Sigma_{\mathrm{SFR}} superprofiles, for which higher mass and lower mass galaxies contribute similar numbers of points. The superprofiles in subregions of constant ΣSFRsubscriptΣSFR\Sigma_{\mathrm{SFR}} may therefore trace a more representative result for the entire sample compared to the superprofiles from radial subregions. In both the figures and text of this section, we discuss separately the superprofiles from smaller galaxies, with points only inside and outside r25subscript𝑟25r_{25}, and those from larger galaxies, with points from radial annuli.

We explore how various local properties correlate first with measures of H i velocity (σcentralsubscript𝜎central\sigma_{\mathrm{central}} and σwingssubscript𝜎wings\sigma_{\mathrm{wings}}; § 4.1) and second with measures of superprofile shape (fwingssubscript𝑓wingsf_{\mathrm{wings}} and afullsubscript𝑎fulla_{\mathrm{full}}; § 4.2). We now present the different correlations, but largely defer discussion of their physical interpretation until § 5. The correlation coefficient rssubscript𝑟𝑠r_{s} and corresponding pssubscript𝑝𝑠p_{s} values for all correlations are given in Tables 1 - 4.

4.1 H i Velocities

We start by exploring the correlations of σcentralsubscript𝜎central\sigma_{\mathrm{central}} and σwingssubscript𝜎wings\sigma_{\mathrm{wings}} with a variety of local properties, keeping in mind that we expect some degree of correlation between σcentralsubscript𝜎central\sigma_{\mathrm{central}} and σwingssubscript𝜎wings\sigma_{\mathrm{wings}}, as σwingssubscript𝜎wings\sigma_{\mathrm{wings}} is restricted to values greater than σcentralsubscript𝜎central\sigma_{\mathrm{central}} by definition (Equation 3).

4.1.1 H i Velocities versus Surface Mass Density

In Paper I, we found that σcentralsubscript𝜎central\sigma_{\mathrm{central}} and σwingssubscript𝜎wings\sigma_{\mathrm{wings}} were correlated most strongly with ΣHIsubscriptΣHI\Sigma_{\mathrm{HI}}, when averaged over the entire galaxy. In this section, we assess whether a similar correlation with ΣHIsubscriptΣHI\Sigma_{\mathrm{HI}} holds locally when the properties of the H i kinematics are derived in subregions of constant normalized radius or ΣSFRsubscriptΣSFR\Sigma_{\mathrm{SFR}}.

In Figure 8, we show σcentralsubscript𝜎central\sigma_{\mathrm{central}}, σwingssubscript𝜎wings\sigma_{\mathrm{wings}}, and σwings/σcentralsubscript𝜎wingssubscript𝜎central\sigma_{\mathrm{wings}}{}/\sigma_{\mathrm{central}}{} as a function of ΣHIsubscriptΣHI\Sigma_{\mathrm{HI}}, calculated in spatially-resolved subregions. The left-hand panels show superprofiles calculated inside and outside r25subscript𝑟25r_{25} for the smaller galaxies, and the middle panels show the superprofiles calculated in radial subregions of the larger galaxies. The points are color-coded by the normalized radius of the subregion (r/r25𝑟subscript𝑟25r/r_{25}, with blue indicating the central regions and red indicating the outskirts.

The right-hand panels of Figure 8 show the same parameters as those on the right, but for superprofiles calculated in ΣSFRsubscriptΣSFR\Sigma_{\mathrm{SFR}} subregions. The points are color-coded by the average ΣSFRsubscriptΣSFR\Sigma_{\mathrm{SFR}} of the region (Equation 5), with white indicating low ΣSFRsubscriptΣSFR\Sigma_{\mathrm{SFR}} and black indicating high ΣSFRsubscriptΣSFR\Sigma_{\mathrm{SFR}}. Both large and small galaxies contribute similar numbers of points to these panels compared to the superprofiles in radial subregions, so we do not separate the large and small galaxies.

Refer to caption
Figure 8: H i velocity measurements versus ΣHIsubscriptΣHI\Sigma_{\mathrm{HI}} for spatially-resolved superprofiles. Each point indicates the ΣHIsubscriptΣHI\Sigma_{\mathrm{HI}} and H i velocity measurement derived within one independent superprofile. The left-hand panels show σcentralsubscript𝜎central\sigma_{\mathrm{central}}, σwingssubscript𝜎wings\sigma_{\mathrm{wings}}, and σwings/σcentralsubscript𝜎wingssubscript𝜎central\sigma_{\mathrm{wings}}{}/\sigma_{\mathrm{central}}{} for superprofiles in generated inside and outside r25subscript𝑟25r_{25}, for the smaller galaxies. The middle panels show the same parameters, but for superprofiles generated in radial annuli for the larger galaxies. Blue indicates central regions, and red indicates outer regions. The right-hand panels show the same measurements, but now for superprofiles in ΣSFRsubscriptΣSFR\Sigma_{\mathrm{SFR}} subregions. In these panels, points are color-coded by the ΣSFRsubscriptΣSFR\Sigma_{\mathrm{SFR}} bin into which they fall, with black indicating high ΣSFRsubscriptΣSFR\Sigma_{\mathrm{SFR}} and white indicating low ΣSFRsubscriptΣSFR\Sigma_{\mathrm{SFR}}. Both σcentralsubscript𝜎central\sigma_{\mathrm{central}} and σwingssubscript𝜎wings\sigma_{\mathrm{wings}} show trends with ΣHIsubscriptΣHI\Sigma_{\mathrm{HI}}, though they are more pronounced in the radial superprofiles.

We find significant correlations between ΣHIsubscriptΣHI\Sigma_{\mathrm{HI}} and both σcentralsubscript𝜎central\sigma_{\mathrm{central}} and σwingssubscript𝜎wings\sigma_{\mathrm{wings}} for superprofiles generated in the r25subscript𝑟25r_{25}, radial, and ΣSFRsubscriptΣSFR\Sigma_{\mathrm{SFR}} subregions. In all cases, neither σcentralsubscript𝜎central\sigma_{\mathrm{central}} nor σwingssubscript𝜎wings\sigma_{\mathrm{wings}} is strongly determined by ΣHIsubscriptΣHI\Sigma_{\mathrm{HI}}; the observed spread in σcentralsubscript𝜎central\sigma_{\mathrm{central}} at a given ΣHIsubscriptΣHI\Sigma_{\mathrm{HI}} is comparable to the mean. We also find that the ratio between σwingssubscript𝜎wings\sigma_{\mathrm{wings}} and σcentralsubscript𝜎central\sigma_{\mathrm{central}} shows little structure with ΣHIsubscriptΣHI\Sigma_{\mathrm{HI}}. Typically values are σwings/σcentral23similar-tosubscript𝜎wingssubscript𝜎central23\sigma_{\mathrm{wings}}{}/\sigma_{\mathrm{central}}{}\sim 2-3.

Next, we examine correlations between H i velocities and ΣbaryonsubscriptΣbaryon\Sigma_{\mathrm{baryon}} in Figure 9. The figure layout is the same as Figure 8, but for correlations with ΣbaryonsubscriptΣbaryon\Sigma_{\mathrm{baryon}} instead of ΣHIsubscriptΣHI\Sigma_{\mathrm{HI}}. The correlations between σcentralsubscript𝜎central\sigma_{\mathrm{central}} and σwingssubscript𝜎wings\sigma_{\mathrm{wings}} are modestly stronger with ΣbaryonsubscriptΣbaryon\Sigma_{\mathrm{baryon}} than with ΣHIsubscriptΣHI\Sigma_{\mathrm{HI}}, but again, the spread is comparable to the range of the correlation. We also find that σcentralsubscript𝜎central\sigma_{\mathrm{central}} shows a lower bound that increases with increasing ΣbaryonsubscriptΣbaryon\Sigma_{\mathrm{baryon}}. Regions with high ΣbaryonsubscriptΣbaryon\Sigma_{\mathrm{baryon}} do not have low σcentralsubscript𝜎central\sigma_{\mathrm{central}} values, while regions with low ΣbaryonsubscriptΣbaryon\Sigma_{\mathrm{baryon}} can have either low or high σcentralsubscript𝜎central\sigma_{\mathrm{central}}. Similar behavior is seen for σwingssubscript𝜎wings\sigma_{\mathrm{wings}}, which may be a reflection of the fact that regions with higher σcentralsubscript𝜎central\sigma_{\mathrm{central}} values must by definition have higher σwingssubscript𝜎wings\sigma_{\mathrm{wings}} values.

Refer to caption
Figure 9: H i velocity measurements versus ΣbaryonsubscriptΣbaryon\Sigma_{\mathrm{baryon}} for spatially-resolved superprofiles. Each point indicates the ΣbaryonsubscriptΣbaryon\Sigma_{\mathrm{baryon}} and H i velocity measurement derived within one independent superprofile. The left-hand panels show σcentralsubscript𝜎central\sigma_{\mathrm{central}}, σwingssubscript𝜎wings\sigma_{\mathrm{wings}}, and σwings/σcentralsubscript𝜎wingssubscript𝜎central\sigma_{\mathrm{wings}}{}/\sigma_{\mathrm{central}}{} for superprofiles in generated inside and outside r25subscript𝑟25r_{25}, for the smaller galaxies. The middle panels show the same parameters, but for superprofiles generated in radial annuli for the larger galaxies. Blue indicates central regions, and red indicates outer regions. The right-hand panels show the same measurements, but now for superprofiles in ΣSFRsubscriptΣSFR\Sigma_{\mathrm{SFR}} subregions. In these panels, points are color-coded by the ΣSFRsubscriptΣSFR\Sigma_{\mathrm{SFR}} bin into which they fall, with black indicating high ΣSFRsubscriptΣSFR\Sigma_{\mathrm{SFR}} and white indicating low ΣSFRsubscriptΣSFR\Sigma_{\mathrm{SFR}}. Both σcentralsubscript𝜎central\sigma_{\mathrm{central}} and σwingssubscript𝜎wings\sigma_{\mathrm{wings}} show trends with ΣbaryonsubscriptΣbaryon\Sigma_{\mathrm{baryon}}, though they are more pronounced in the radial superprofiles.

4.1.2 H i Velocities versus Star Formation

We now address the behavior of H i velocities as a function of local star formation measures. We consider two measures of star formation: the local star formation intensity (ΣSFRsubscriptΣSFR\Sigma_{\mathrm{SFR}}) and the ratio of available star formation energy to the H i mass that the energy couples to (ΣHI/ΣSFRsubscriptΣHIsubscriptΣSFR\Sigma_{\mathrm{HI}}{}/\Sigma_{\mathrm{SFR}}{}). In Paper I, we did not find a correlation between σcentralsubscript𝜎central\sigma_{\mathrm{central}} and ΣSFRdelimited-⟨⟩subscriptΣSFR\langle\Sigma_{\mathrm{SFR}}{}\rangle, averaged over the entire galaxy, unless higher-mass galaxies were included.

In Figure 10 we show the behavior of H i superprofile velocities as a function of ΣSFRsubscriptΣSFR\Sigma_{\mathrm{SFR}}. The layout of the figure is the same as for Figure 8. We find that ΣSFRsubscriptΣSFR\Sigma_{\mathrm{SFR}} is correlated with both σcentralsubscript𝜎central\sigma_{\mathrm{central}} and σwingssubscript𝜎wings\sigma_{\mathrm{wings}} for superprofiles in the r25subscript𝑟25r_{25}, radial, and ΣSFRsubscriptΣSFR\Sigma_{\mathrm{SFR}} subregions. The observed correlation between ΣSFRsubscriptΣSFR\Sigma_{\mathrm{SFR}} and σcentralsubscript𝜎central\sigma_{\mathrm{central}} in the ΣSFRsubscriptΣSFR\Sigma_{\mathrm{SFR}} subregions is strongly driven by the three highest ΣSFRsubscriptΣSFR\Sigma_{\mathrm{SFR}} bins. When we calculate rSsubscript𝑟𝑆r_{S} for the lower three bins (ΣSFR<103subscriptΣSFRsuperscript103\Sigma_{\mathrm{SFR}}{}<10^{-3} M yr-1 kpc-2), the correlations disappear entirely (rS=0.02subscript𝑟𝑆0.02r_{S}=0.02 and pSsubscript𝑝𝑆p_{S} = 0.86, compared to rs=0.42subscript𝑟𝑠0.42r_{s}=0.42 and ps<0.001subscript𝑝𝑠0.001p_{s}<0.001 for the full range). At low ΣSFRsubscriptΣSFR\Sigma_{\mathrm{SFR}}, either H i kinematics do not appear to be influenced by star formation, or the measurements of ΣSFRsubscriptΣSFR\Sigma_{\mathrm{SFR}} have insufficient accuracy to reveal a correlation.

Even though it is strongly driven by the high ΣSFRsubscriptΣSFR\Sigma_{\mathrm{SFR}} regions, the correlation between ΣSFRsubscriptΣSFR\Sigma_{\mathrm{SFR}} and σcentralsubscript𝜎central\sigma_{\mathrm{central}} is new compared to Paper I. The local correlation was lost when averaged over the entire disk, as regions with both high and low star formation intensities were combined. In this case, we have sampled the H i kinematics and ΣSFRsubscriptΣSFR\Sigma_{\mathrm{SFR}} on local scales and therefore would expect a stronger correlation between these properties, if they are connected. Interestingly, regions of with very low star formation intensity (ΣSFR<103subscriptΣSFRsuperscript103\Sigma_{\mathrm{SFR}}{}<10^{-3} M yr-1 kpc-2) can still exhibit σcentralsubscript𝜎central\sigma_{\mathrm{central}} values of 10similar-toabsent10\sim 10 km s-1, comparable to those seen in higher ΣSFRsubscriptΣSFR\Sigma_{\mathrm{SFR}} regions. The σcentralsubscript𝜎central\sigma_{\mathrm{central}} and σwingssubscript𝜎wings\sigma_{\mathrm{wings}} again show a lower bound at a given ΣSFRsubscriptΣSFR\Sigma_{\mathrm{SFR}}, similar to that seen with ΣbaryonsubscriptΣbaryon\Sigma_{\mathrm{baryon}}.

Refer to caption
Figure 10: H i velocity measurements versus ΣSFRsubscriptΣSFR\Sigma_{\mathrm{SFR}} for spatially-resolved superprofiles. Each point indicates the ΣSFRsubscriptΣSFR\Sigma_{\mathrm{SFR}} and H i velocity measurement derived within one independent superprofile. The left-hand panels show σcentralsubscript𝜎central\sigma_{\mathrm{central}}, σwingssubscript𝜎wings\sigma_{\mathrm{wings}}, and σwings/σcentralsubscript𝜎wingssubscript𝜎central\sigma_{\mathrm{wings}}{}/\sigma_{\mathrm{central}}{} for superprofiles in generated inside and outside r25subscript𝑟25r_{25}, for the smaller galaxies. The middle panels show the same parameters, but for superprofiles generated in radial annuli for the larger galaxies. Blue indicates central regions, and red indicates outer regions. The right-hand panels show the same measurements, but now for superprofiles in ΣSFRsubscriptΣSFR\Sigma_{\mathrm{SFR}} subregions. In these panels, points are color-coded by the ΣSFRsubscriptΣSFR\Sigma_{\mathrm{SFR}} bin into which they fall, with black indicating high ΣSFRsubscriptΣSFR\Sigma_{\mathrm{SFR}} and white indicating low ΣSFRsubscriptΣSFR\Sigma_{\mathrm{SFR}}. The vertical lines of points in the left-hand panels are an artifact of the ΣSFRsubscriptΣSFR\Sigma_{\mathrm{SFR}} binning; the horizontal jitter is due to a different distribution of ΣSFRsubscriptΣSFR\Sigma_{\mathrm{SFR}} values in each bin. Both σcentralsubscript𝜎central\sigma_{\mathrm{central}} and σwingssubscript𝜎wings\sigma_{\mathrm{wings}} show trends with ΣSFRsubscriptΣSFR\Sigma_{\mathrm{SFR}}, though they are more pronounced in the radial superprofiles. We also observe a lower limit to σcentralsubscript𝜎central\sigma_{\mathrm{central}} that increases with ΣSFRsubscriptΣSFR\Sigma_{\mathrm{SFR}}.

We next compare the H i velocities to ΣSFR/ΣHIsubscriptΣSFRsubscriptΣHI\Sigma_{\mathrm{SFR}}{}/\Sigma_{\mathrm{HI}}{} in Figure 11. As stated before, this measurement provides an estimate of the energy available from star formation per unit gas mass, rather than a strict star formation efficiency measurement. Again, we find that σcentralsubscript𝜎central\sigma_{\mathrm{central}} and σwingssubscript𝜎wings\sigma_{\mathrm{wings}} are correlated with ΣSFR/ΣHIsubscriptΣSFRsubscriptΣHI\Sigma_{\mathrm{SFR}}{}/\Sigma_{\mathrm{HI}}{}, but with weaker correlation coefficients compared to ΣSFRsubscriptΣSFR\Sigma_{\mathrm{SFR}}. The connection between star formation and σcentralsubscript𝜎central\sigma_{\mathrm{central}} is not one-to-one; σcentralsubscript𝜎central\sigma_{\mathrm{central}} values at low ΣSFR/ΣHIsubscriptΣSFRsubscriptΣHI\Sigma_{\mathrm{SFR}}{}/\Sigma_{\mathrm{HI}}{} can be as high as 10 km s-1. Additionally, σcentralsubscript𝜎central\sigma_{\mathrm{central}} exhibits an increasing lower bound with increasing ΣSFR/ΣHIsubscriptΣSFRsubscriptΣHI\Sigma_{\mathrm{SFR}}{}/\Sigma_{\mathrm{HI}}{}, which could imply a minimum efficiency at which star formation affects the surrounding H i.

Refer to caption
Figure 11: H i velocity measurements versus ΣSFR/ΣHIsubscriptΣSFRsubscriptΣHI\Sigma_{\mathrm{SFR}}{}/\Sigma_{\mathrm{HI}}{} for spatially-resolved superprofiles. Each point indicates the ΣSFR/ΣHIsubscriptΣSFRsubscriptΣHI\Sigma_{\mathrm{SFR}}{}/\Sigma_{\mathrm{HI}}{} and H i velocity measurement derived within one independent superprofile. The left-hand panels show σcentralsubscript𝜎central\sigma_{\mathrm{central}}, σwingssubscript𝜎wings\sigma_{\mathrm{wings}}, and σwings/σcentralsubscript𝜎wingssubscript𝜎central\sigma_{\mathrm{wings}}{}/\sigma_{\mathrm{central}}{} for superprofiles in generated inside and outside r25subscript𝑟25r_{25}, for the smaller galaxies. The middle panels show the same parameters, but for superprofiles generated in radial annuli for the larger galaxies. Blue indicates central regions, and red indicates outer regions. The right-hand panels show the same measurements, but now for superprofiles in ΣSFRsubscriptΣSFR\Sigma_{\mathrm{SFR}} subregions. In these panels, points are color-coded by the ΣSFRsubscriptΣSFR\Sigma_{\mathrm{SFR}} bin into which they fall, with black indicating high ΣSFRsubscriptΣSFR\Sigma_{\mathrm{SFR}} and white indicating low ΣSFRsubscriptΣSFR\Sigma_{\mathrm{SFR}}. Both σcentralsubscript𝜎central\sigma_{\mathrm{central}} and σwingssubscript𝜎wings\sigma_{\mathrm{wings}} show trends with ΣSFR/ΣHIsubscriptΣSFRsubscriptΣHI\Sigma_{\mathrm{SFR}}{}/\Sigma_{\mathrm{HI}}{}.

4.2 Superprofile Shapes

We now address whether the shapes of the spatially-resolved superprofiles are connected to local ISM properties. In particular, we examine the fraction of gas in the wings of the superprofiles (fwingssubscript𝑓wingsf_{\mathrm{wings}}) and the asymmetry of the superprofiles (afullsubscript𝑎fulla_{\mathrm{full}}). In Paper I, we found that fwingssubscript𝑓wingsf_{\mathrm{wings}} increased with SFR/MHISFRsubscript𝑀HI\mathrm{SFR}/M_{\mathrm{HI}}{}, averaged on global scales, and that the asymmetry of the profiles, measured with a𝑎a, decreased with increasing total SFR and galaxy mass. We now assess whether similar correlations hold for superprofiles generated in radial bins or regions of similar ΣSFRsubscriptΣSFR\Sigma_{\mathrm{SFR}}. As with the H i velocities discussed in § 4.1, we examine correlations both with surface mass density (§ 4.2.1) and with measures of star formation (§ 4.2.2).

We note that the fwingssubscript𝑓wingsf_{\mathrm{wings}} and afullsubscript𝑎fulla_{\mathrm{full}} parameters may not be tracing the same effects in the resolved superprofiles as in the global superprofiles from Paper I. In the global superprofiles, line-of-sight spectra with a range of velocity dispersions were averaged together. The final superprofile was therefore a composite of H i profiles with different velocity dispersions. Some H i in the wings of those superprofiles could have been due to H i line-of-sight spectra with larger velocity dispersions compared to the average. Second, we measure the full asymmetry of the superprofiles (afullsubscript𝑎fulla_{\mathrm{full}}) in this paper instead of the asymmetry of the wings (a𝑎a). This difference is unlikely to be major, since the measurement of asymmetry in the global superprofiles was strongly weighted by the wings.

4.2.1 Surface Mass Density

We start by examining correlations between superprofile shape and surface mass density. We note that in Paper I, we found no correlations between surface density and either fwingssubscript𝑓wingsf_{\mathrm{wings}} or the wing asymmetry (as measured with a𝑎a), but any local correlations may have been obscured when averaging over the entire disk.

In Figure 12 we show the superprofile shape parameters as a function of ΣHIsubscriptΣHI\Sigma_{\mathrm{HI}}. The layout is similar to Figure 8, but we now plot fwingssubscript𝑓wingsf_{\mathrm{wings}} and afullsubscript𝑎fulla_{\mathrm{full}} for superprofiles derived in subregions of constant radius or ΣSFRsubscriptΣSFR\Sigma_{\mathrm{SFR}}. Very little structure is apparent in either fwingssubscript𝑓wingsf_{\mathrm{wings}} or afullsubscript𝑎fulla_{\mathrm{full}} with increasing ΣHIsubscriptΣHI\Sigma_{\mathrm{HI}}. We note that afullsubscript𝑎fulla_{\mathrm{full}} has a p𝑝p-value pS<0.01subscript𝑝𝑆0.01p_{S}<0.01 for the radial subregions, but the corresponding correlation coefficient is very low (rS=0.26subscript𝑟𝑆0.26r_{S}=0.26), indicating that the two quantities are not strongly correlated. Moreover, the correlation coefficients for the r25subscript𝑟25r_{25} subregions, in smaller galaxies, have the opposite sign than that of the radial subregions for larger galaxies. The two quantities are not significantly correlated for the ΣSFRsubscriptΣSFR\Sigma_{\mathrm{SFR}} subregions.

Refer to caption
Figure 12: H i superprofile shape parameters versus ΣHIsubscriptΣHI\Sigma_{\mathrm{HI}} for spatially-resolved superprofiles. Each point indicates the ΣHIsubscriptΣHI\Sigma_{\mathrm{HI}} measurement and superprofile shape parameter derived for one independent superprofile. The left-hand panels show fwingssubscript𝑓wingsf_{\mathrm{wings}} and afullsubscript𝑎fulla_{\mathrm{full}} for superprofiles in generated inside and outside r25subscript𝑟25r_{25}, for the smaller galaxies. The middle panels show the same parameters, but for superprofiles generated in radial annuli for the larger galaxies. Blue indicates central regions, and red indicates outer regions. The right-hand panels show the same measurements, but now for superprofiles in ΣSFRsubscriptΣSFR\Sigma_{\mathrm{SFR}} subregions. In these panels, points are color-coded by the ΣSFRsubscriptΣSFR\Sigma_{\mathrm{SFR}} bin into which they fall, with black indicating high ΣSFRsubscriptΣSFR\Sigma_{\mathrm{SFR}} and white indicating low ΣSFRsubscriptΣSFR\Sigma_{\mathrm{SFR}}.

In Figure 13, we show the same figure but for ΣbaryonsubscriptΣbaryon\Sigma_{\mathrm{baryon}} instead of ΣHIsubscriptΣHI\Sigma_{\mathrm{HI}}. As with ΣHIsubscriptΣHI\Sigma_{\mathrm{HI}}, the superprofile shapes are not strongly influenced by ΣbaryonsubscriptΣbaryon\Sigma_{\mathrm{baryon}}. The radial subregions of larger galaxies show significant correlations as measured by their pSsubscript𝑝𝑆p_{S} value, but as before, the corresponding correlation coefficients themselves are low and have the opposite sign of the r25subscript𝑟25r_{25} subregions of smaller galaxies. The correlations disappear entirely for the ΣSFRsubscriptΣSFR\Sigma_{\mathrm{SFR}} subregions. Because neither ΣHIsubscriptΣHI\Sigma_{\mathrm{HI}} nor ΣbaryonsubscriptΣbaryon\Sigma_{\mathrm{baryon}} show strong or consistent correlations with superprofile shape, surface mass density does not drive the properties of the velocity of the wings.

Refer to caption
Figure 13: H i superprofile shape parameters versus ΣbaryonsubscriptΣbaryon\Sigma_{\mathrm{baryon}} for spatially-resolved superprofiles. Each point indicates the ΣbaryonsubscriptΣbaryon\Sigma_{\mathrm{baryon}} measurement and H i superprofile parameter derived for one independent superprofile. The left-hand panels show fwingssubscript𝑓wingsf_{\mathrm{wings}} and afullsubscript𝑎fulla_{\mathrm{full}} for superprofiles in generated inside and outside r25subscript𝑟25r_{25}, for the smaller galaxies. The middle panels show the same parameters, but for superprofiles generated in radial annuli for the larger galaxies. Blue indicates central regions, and red indicates outer regions. The right-hand panels show the same measurements, but now for superprofiles in ΣSFRsubscriptΣSFR\Sigma_{\mathrm{SFR}} subregions. In these panels, points are color-coded by the ΣSFRsubscriptΣSFR\Sigma_{\mathrm{SFR}} bin into which they fall, with black indicating high ΣSFRsubscriptΣSFR\Sigma_{\mathrm{SFR}} and white indicating low ΣSFRsubscriptΣSFR\Sigma_{\mathrm{SFR}}.

4.2.2 Star Formation

We now compare the superprofile shapes with measures of star formation. As before, we examine correlations with both ΣSFRsubscriptΣSFR\Sigma_{\mathrm{SFR}} and ΣSFR/ΣHIsubscriptΣSFRsubscriptΣHI\Sigma_{\mathrm{SFR}}{}/\Sigma_{\mathrm{HI}}{}.

In Figure 14, we show fwingssubscript𝑓wingsf_{\mathrm{wings}} and afullsubscript𝑎fulla_{\mathrm{full}} for superprofiles generated in radial and ΣSFRsubscriptΣSFR\Sigma_{\mathrm{SFR}} subregions. The layout is the same as Figure 12. The H i superprofiles tend to have fwings0.1similar-tosubscript𝑓wings0.1f_{\mathrm{wings}}{}\sim 0.1, which suggests that average H i spectra are typically non-Gaussian in most ISM conditions.

Again, there are no strong correlations between these parameters and ΣSFRsubscriptΣSFR\Sigma_{\mathrm{SFR}}, indicating that there is no monotonic relationship between superprofile shape and star formation intensity. For the superprofiles from constant radial annuli or ΣSFRsubscriptΣSFR\Sigma_{\mathrm{SFR}}, the smallest values of fwingssubscript𝑓wingsf_{\mathrm{wings}} and afullsubscript𝑎fulla_{\mathrm{full}} do appear to occur in regions of low star formation intensity (ΣSFR<104subscriptΣSFRsuperscript104\Sigma_{\mathrm{SFR}}{}<10^{4} M yr-1 kpc-2), with higher values at moderate ΣSFRsubscriptΣSFR\Sigma_{\mathrm{SFR}}. This trend is reversed in the smaller galaxies, which have superprofiles inside and outside r25subscript𝑟25r_{25}. We also observe a tentative upper bound to fwingssubscript𝑓wingsf_{\mathrm{wings}} that decreases with increasing ΣSFRsubscriptΣSFR\Sigma_{\mathrm{SFR}}, but this behavior may reflect the lower bound between σcentralsubscript𝜎central\sigma_{\mathrm{central}} and ΣSFRsubscriptΣSFR\Sigma_{\mathrm{SFR}} (§ 4.1.2).

Refer to caption
Figure 14: H i superprofile shape parameters versus ΣSFRsubscriptΣSFR\Sigma_{\mathrm{SFR}} for spatially-resolved superprofiles. Each point indicates the ΣSFRsubscriptΣSFR\Sigma_{\mathrm{SFR}} measurement and H i superprofile parameter derived for one independent superprofile. The left-hand panels show fwingssubscript𝑓wingsf_{\mathrm{wings}} and afullsubscript𝑎fulla_{\mathrm{full}} for superprofiles in generated inside and outside r25subscript𝑟25r_{25}, for the smaller galaxies. The middle panels show the same parameters, but for superprofiles generated in radial annuli for the larger galaxies. Blue indicates central regions, and red indicates outer regions. The right-hand panels show the same measurements, but now for superprofiles in ΣSFRsubscriptΣSFR\Sigma_{\mathrm{SFR}} subregions. In these panels, points are color-coded by the ΣSFRsubscriptΣSFR\Sigma_{\mathrm{SFR}} bin into which they fall, with black indicating high ΣSFRsubscriptΣSFR\Sigma_{\mathrm{SFR}} and white indicating low ΣSFRsubscriptΣSFR\Sigma_{\mathrm{SFR}}. The vertical lines of points are an artifact of the ΣSFRsubscriptΣSFR\Sigma_{\mathrm{SFR}} binning; the horizontal jitter is due to a different distribution of ΣSFRsubscriptΣSFR\Sigma_{\mathrm{SFR}} values in each bin.

In Figure 15, we show the superprofile shapes versus ΣSFR/ΣHIsubscriptΣSFRsubscriptΣHI\Sigma_{\mathrm{SFR}}{}/\Sigma_{\mathrm{HI}}{}. As with the previous figures, there are no obvious trends between these parameters and ΣSFR/ΣHIsubscriptΣSFRsubscriptΣHI\Sigma_{\mathrm{SFR}}{}/\Sigma_{\mathrm{HI}}{}. A similar upper bound for fwingssubscript𝑓wingsf_{\mathrm{wings}} as a function of ΣSFR/ΣHIsubscriptΣSFRsubscriptΣHI\Sigma_{\mathrm{SFR}}{}/\Sigma_{\mathrm{HI}}{} is present, but it could again be an artifact of the lower bound in the σcentralsubscript𝜎central\sigma_{\mathrm{central}} versus ΣSFR/ΣHIsubscriptΣSFRsubscriptΣHI\Sigma_{\mathrm{SFR}}{}/\Sigma_{\mathrm{HI}}{} figure.

Refer to caption
Figure 15: H i superprofile shape parameters versus ΣSFR/ΣHIsubscriptΣSFRsubscriptΣHI\Sigma_{\mathrm{SFR}}{}/\Sigma_{\mathrm{HI}}{} for spatially-resolved superprofiles. Each point indicates the ΣSFR/ΣHIsubscriptΣSFRsubscriptΣHI\Sigma_{\mathrm{SFR}}{}/\Sigma_{\mathrm{HI}}{} measurement and H i superprofile parameter derived for one independent superprofile. The left-hand panels show fwingssubscript𝑓wingsf_{\mathrm{wings}} and afullsubscript𝑎fulla_{\mathrm{full}} for superprofiles in generated inside and outside r25subscript𝑟25r_{25}, for the smaller galaxies. The middle panels show the same parameters, but for superprofiles generated in radial annuli for the larger galaxies. Blue indicates central regions, and red indicates outer regions. The right-hand panels show the same measurements, but now for superprofiles in ΣSFRsubscriptΣSFR\Sigma_{\mathrm{SFR}} subregions. In these panels, points are color-coded by the ΣSFRsubscriptΣSFR\Sigma_{\mathrm{SFR}} bin into which they fall, with black indicating high ΣSFRsubscriptΣSFR\Sigma_{\mathrm{SFR}} and white indicating low ΣSFRsubscriptΣSFR\Sigma_{\mathrm{SFR}}.
Table 1: Correlation coefficients for superprofiles derived in subregions of constant radius, for the large galaxies only.
σcentralsubscript𝜎central\sigma_{\mathrm{central}} σwingssubscript𝜎wings\sigma_{\mathrm{wings}} fwingssubscript𝑓wingsf_{\mathrm{wings}} afullsubscript𝑎fulla_{\mathrm{full}}
Property rssubscript𝑟𝑠r_{s} pssubscript𝑝𝑠p_{s} rssubscript𝑟𝑠r_{s} pssubscript𝑝𝑠p_{s} rssubscript𝑟𝑠r_{s} pssubscript𝑝𝑠p_{s} rssubscript𝑟𝑠r_{s} pssubscript𝑝𝑠p_{s}
ΣHIsubscriptΣHI\Sigma_{\mathrm{HI}} 0.530 <<0.001 0.675 <<0.001 0.282 0.001 0.333 <<0.001
ΣbaryonsubscriptΣbaryon\Sigma_{\mathrm{baryon}} 0.599 <<0.001 0.745 <<0.001 0.367 <<0.001 0.373 <<0.001
ΣSFRsubscriptΣSFR\Sigma_{\mathrm{SFR}}{} 0.612 <<0.001 0.732 <<0.001 0.336 <<0.001 0.315 <<0.001
ΣSFR/ΣHIsubscriptΣSFRsubscriptΣHI\Sigma_{\mathrm{SFR}}/\Sigma_{\mathrm{HI}} 0.571 <<0.001 0.695 <<0.001 0.346 <<0.001 0.299 <<0.001

Note. — Spearman correlation coefficient rSsubscript𝑟𝑆r_{S} and probability pSsubscript𝑝𝑆p_{S} between superprofile parameters and physical properties for the superprofiles in regions of constant radius, for the large galaxies only. Significant correlations are shown in bold.

Table 2: Correlation coefficients for superprofiles derived in subregions of constant radius, for the small galaxies only.
σcentralsubscript𝜎central\sigma_{\mathrm{central}} σwingssubscript𝜎wings\sigma_{\mathrm{wings}} fwingssubscript𝑓wingsf_{\mathrm{wings}} afullsubscript𝑎fulla_{\mathrm{full}}
Property rssubscript𝑟𝑠r_{s} pssubscript𝑝𝑠p_{s} rssubscript𝑟𝑠r_{s} pssubscript𝑝𝑠p_{s} rssubscript𝑟𝑠r_{s} pssubscript𝑝𝑠p_{s} rssubscript𝑟𝑠r_{s} pssubscript𝑝𝑠p_{s}
ΣHIsubscriptΣHI\Sigma_{\mathrm{HI}} 0.565 0.009 0.438 0.054 -0.469 0.037 -0.068 0.777
ΣbaryonsubscriptΣbaryon\Sigma_{\mathrm{baryon}} 0.600 0.005 0.514 0.020 -0.397 0.083 -0.096 0.686
ΣSFRsubscriptΣSFR\Sigma_{\mathrm{SFR}}{} 0.543 0.013 0.226 0.339 -0.341 0.141 -0.146 0.539
ΣSFR/ΣHIsubscriptΣSFRsubscriptΣHI\Sigma_{\mathrm{SFR}}/\Sigma_{\mathrm{HI}} 0.499 0.025 0.104 0.663 -0.289 0.217 -0.126 0.596

Note. — Spearman correlation coefficient rSsubscript𝑟𝑆r_{S} and probability pSsubscript𝑝𝑆p_{S} between superprofile parameters and physical properties for the superprofiles generated inside and outside r25subscript𝑟25r_{25}, for the small galaxies only. Significant correlations are shown in bold.

Table 3: Correlation coefficients for superprofiles derived in subregions of constant radius, for all sample galaxies.
σcentralsubscript𝜎central\sigma_{\mathrm{central}} σwingssubscript𝜎wings\sigma_{\mathrm{wings}} fwingssubscript𝑓wingsf_{\mathrm{wings}} afullsubscript𝑎fulla_{\mathrm{full}}
Property rssubscript𝑟𝑠r_{s} pssubscript𝑝𝑠p_{s} rssubscript𝑟𝑠r_{s} pssubscript𝑝𝑠p_{s} rssubscript𝑟𝑠r_{s} pssubscript𝑝𝑠p_{s} rssubscript𝑟𝑠r_{s} pssubscript𝑝𝑠p_{s}
ΣHIsubscriptΣHI\Sigma_{\mathrm{HI}} 0.537 <<0.001 0.638 <<0.001 0.140 0.090 0.263 0.001
ΣbaryonsubscriptΣbaryon\Sigma_{\mathrm{baryon}} 0.590 <<0.001 0.714 <<0.001 0.251 0.002 0.309 <<0.001
ΣSFRsubscriptΣSFR\Sigma_{\mathrm{SFR}}{} 0.577 <<0.001 0.678 <<0.001 0.242 0.003 0.250 0.002
ΣSFR/ΣHIsubscriptΣSFRsubscriptΣHI\Sigma_{\mathrm{SFR}}/\Sigma_{\mathrm{HI}} 0.518 <<0.001 0.626 <<0.001 0.271 <<0.001 0.234 0.004

Note. — Spearman correlation coefficient rSsubscript𝑟𝑆r_{S} and probability pSsubscript𝑝𝑆p_{S} between superprofile parameters and physical properties for the superprofiles in regions of constant radius, for all sample galaxies. Significant correlations are shown in bold.

Table 4: Correlation coefficients for superprofiles derived in subregions of constant ΣSFRsubscriptΣSFR\Sigma_{\mathrm{SFR}}.
σcentralsubscript𝜎central\sigma_{\mathrm{central}} σwingssubscript𝜎wings\sigma_{\mathrm{wings}} fwingssubscript𝑓wingsf_{\mathrm{wings}} afullsubscript𝑎fulla_{\mathrm{full}}
Property rssubscript𝑟𝑠r_{s} pssubscript𝑝𝑠p_{s} rssubscript𝑟𝑠r_{s} pssubscript𝑝𝑠p_{s} rssubscript𝑟𝑠r_{s} pssubscript𝑝𝑠p_{s} rssubscript𝑟𝑠r_{s} pssubscript𝑝𝑠p_{s}
ΣHIsubscriptΣHI\Sigma_{\mathrm{HI}} 0.466 <<0.001 0.507 <<0.001 -0.249 0.025 0.137 0.224
ΣbaryonsubscriptΣbaryon\Sigma_{\mathrm{baryon}} 0.484 <<0.001 0.587 <<0.001 -0.142 0.205 0.107 0.341
ΣSFRsubscriptΣSFR\Sigma_{\mathrm{SFR}}{} 0.422 <<0.001 0.525 <<0.001 -0.058 0.605 0.052 0.645
ΣSFR/ΣHIsubscriptΣSFRsubscriptΣHI\Sigma_{\mathrm{SFR}}/\Sigma_{\mathrm{HI}} 0.358 0.001 0.463 <<0.001 -0.004 0.975 0.023 0.836

Note. — Spearman correlation coefficient rSsubscript𝑟𝑆r_{S} and probability pSsubscript𝑝𝑆p_{S} between superprofile parameters and physical properties for the ΣSFRsubscriptΣSFR\Sigma_{\mathrm{SFR}} superprofiles. Significant correlations are shown in bold.

5 Discussion

In § 4, we calculated the correlations between superprofile parameters and local ISM properties. The rSsubscript𝑟𝑆r_{S} correlation coefficients and corresponding pSsubscript𝑝𝑆p_{S} significance values for the correlations discussed in § 4 are listed in Table 1 for the radial subregions and in Table 4 for the ΣSFRsubscriptΣSFR\Sigma_{\mathrm{SFR}} subregions. In general, the correlations are weaker for the ΣSFRsubscriptΣSFR\Sigma_{\mathrm{SFR}} subregions compared to the radial or r25subscript𝑟25r_{25} subregions.

We find that measures of H i turbulent velocity, traced by σcentralsubscript𝜎central\sigma_{\mathrm{central}}, and wing velocity, traced by σwingssubscript𝜎wings\sigma_{\mathrm{wings}}, are correlated with all physical properties we have inspected (ΣHIsubscriptΣHI\Sigma_{\mathrm{HI}}, ΣbaryonsubscriptΣbaryon\Sigma_{\mathrm{baryon}}, ΣSFRsubscriptΣSFR\Sigma_{\mathrm{SFR}}, and ΣSFR/ΣHIsubscriptΣSFRsubscriptΣHI\Sigma_{\mathrm{SFR}}{}/\Sigma_{\mathrm{HI}}{}). The H i turbulent velocities also tend to show a lower bound for a given ΣSFRsubscriptΣSFR\Sigma_{\mathrm{SFR}} or ΣbaryonsubscriptΣbaryon\Sigma_{\mathrm{baryon}}. Individual galaxies can show smooth well-defined trends with increasing radius (Figure 4) or ΣSFRsubscriptΣSFR\Sigma_{\mathrm{SFR}} (Figure 7), as seen previously in Tamburro et al. (2009), but the galaxy-to-galaxy variation in the average value of these trends is large.

Because σwingssubscript𝜎wings\sigma_{\mathrm{wings}} and σcentralsubscript𝜎central\sigma_{\mathrm{central}} are correlated, we focus primarily on the correlations between the width of the central peak (σcentralsubscript𝜎central\sigma_{\mathrm{central}}) and local ISM properties. The parameters describing the shapes of the superprofiles, fwingssubscript𝑓wingsf_{\mathrm{wings}} and afullsubscript𝑎fulla_{\mathrm{full}}, do not show strong correlations with any of these properties, though there are weak correlations with measures of local SFR.

In this section, we discuss the physical meaning behind these correlations. We focus primarily on correlations between the central peak of the superprofile and ISM properties, in § 5.1. We then briefly discuss correlations with σwingssubscript𝜎wings\sigma_{\mathrm{wings}}, fwingssubscript𝑓wingsf_{\mathrm{wings}}, and afullsubscript𝑎fulla_{\mathrm{full}}, in § 5.2.

5.1 The Central H i peak

H i turbulent velocities are often thought to be caused by feedback from star formation. Tamburro et al. (2009) found that star formation provides enough energy to drive H i turbulence inside r25subscript𝑟25r_{25} for relatively massive disk galaxies, but that the relationship between ΣSFRsubscriptΣSFR\Sigma_{\mathrm{SFR}} and turbulence breaks down both in the outskirts of spiral galaxies or in dwarf galaxies where star formation rates are low. For our sample, which is dominated by systems in the latter regime, we find that the width of the central peak of the H i velocity dispersion correlates most strongly with ΣbaryonsubscriptΣbaryon\Sigma_{\mathrm{baryon}}, and less strongly with measures of star formation. We first discuss the origins and limitations of the correlation of σcentralsubscript𝜎central\sigma_{\mathrm{central}} with ΣSFRsubscriptΣSFR\Sigma_{\mathrm{SFR}}, and then discuss the stronger correlation with ΣbaryonsubscriptΣbaryon\Sigma_{\mathrm{baryon}}.

5.1.1 Turbulent H i Kinematics and Star Formation

We find significant correlations between σcentralsubscript𝜎central\sigma_{\mathrm{central}} and ΣSFRsubscriptΣSFR\Sigma_{\mathrm{SFR}}, for both types of subregions (Figure 10, Tables 1 and 4). The observed σcentralsubscript𝜎central\sigma_{\mathrm{central}}-ΣSFRsubscriptΣSFR\Sigma_{\mathrm{SFR}} correlation is strongest in the radial subregions (rs=0.61subscript𝑟𝑠0.61r_{s}=0.61), where ISM properties tend to track smoothly with radius. The correlation is weaker for smaller galaxies (inside and outside r25subscript𝑟25r_{25}; rs=0.54subscript𝑟𝑠0.54r_{s}=0.54), but the by-eye scatter of this correlation is relatively large. For the ΣSFRsubscriptΣSFR\Sigma_{\mathrm{SFR}}-based subregions, the correlation between σcentralsubscript𝜎central\sigma_{\mathrm{central}} and ΣSFRsubscriptΣSFR\Sigma_{\mathrm{SFR}} is weaker and is only seen when the highest SFR intensity bins (ΣSFR>103subscriptΣSFRsuperscript103\Sigma_{\mathrm{SFR}}{}>10^{-3} M yr-1 kpc-2) are included. The ΣSFR<103subscriptΣSFRsuperscript103\Sigma_{\mathrm{SFR}}{}<10^{-3} M yr-1 kpc-2 threshold occurs at approximately r25subscript𝑟25r_{25} in the largest dwarfs in our sample, as seen both in Figure 10 and in Tamburro et al. (2009) for H i kinematics inside r25subscript𝑟25r_{25} in larger galaxies, so the fact that the correlations break down at around this ΣSFRsubscriptΣSFR\Sigma_{\mathrm{SFR}} mirrors the Tamburro et al. (2009) results.

These results indicate that at low ΣSFRsubscriptΣSFR\Sigma_{\mathrm{SFR}}, H i kinematics do not appear to be strictly driven by star formation properties. Superprofiles generated in regions of low star formation can show velocity dispersions as high as 10 km s-1, values similar to their counterparts in regions of higher star formation.

Even at higher ΣSFRsubscriptΣSFR\Sigma_{\mathrm{SFR}}, the H i velocity dispersions are not uniquely defined by ΣSFRsubscriptΣSFR\Sigma_{\mathrm{SFR}}. The relationship between σcentralsubscript𝜎central\sigma_{\mathrm{central}} and ΣSFRsubscriptΣSFR\Sigma_{\mathrm{SFR}} has large scatter at low star formation intensities and inconsistent behavior within individual galaxies. Although the more massive galaxies in the sample tend to show increasing σcentralsubscript𝜎central\sigma_{\mathrm{central}} values with increasing ΣSFRsubscriptΣSFR\Sigma_{\mathrm{SFR}}, the behavior of σcentralsubscript𝜎central\sigma_{\mathrm{central}} compared to ΣSFRsubscriptΣSFR\Sigma_{\mathrm{SFR}} is more erratic in the low mass dwarfs. Some have no strong trends between σcentralsubscript𝜎central\sigma_{\mathrm{central}} and ΣSFRsubscriptΣSFR\Sigma_{\mathrm{SFR}} (e.g., DDO 154, Sextans A, UGCA 292), while others show the complete opposite trend as seen in the more massive spirals (e.g., DDO 53), with decreasing σcentralsubscript𝜎central\sigma_{\mathrm{central}} with increasing ΣSFRsubscriptΣSFR\Sigma_{\mathrm{SFR}}.

There are a number of reasons why σcentralsubscript𝜎central\sigma_{\mathrm{central}} may not couple strongly to the local ΣSFRsubscriptΣSFR\Sigma_{\mathrm{SFR}}. First, the discrepancy may be due to a mismatch between the timescale of the FUV+24μ𝜇\mum star formation tracer and the timescale on which star formation energy is injected. We assess this possibility in Paper III of this series (Stilp et al., 2013c) using time-resolved star formation histories. It may also be due to a mismatch in physical scale. If SF drives turbulence over an area larger than a subregion, then the turbulence and SFR may appear decoupled. In such a case, we may see stronger trends for galaxy-wide superprofiles (as in Paper I or Paper III) where all the SF and turbulent energy is considered. The discrepancy may also originate from the fact that star formation energy may couple more strongly to H i energy instead of turbulent velocity alone.

While the local star formation intensity does not appear to set the H i velocity dispersion, it does appear to provide a floor below which σcentralsubscript𝜎central\sigma_{\mathrm{central}} does not fall. This behavior can be seen as the clear lower bound in Figure 10, which approximately follows

σcentral6.8kms1(ΣSFR103Myr1kpc2)0.14.similar-tosubscript𝜎central6.8kmsuperscripts1superscriptsubscriptΣSFRsuperscript103subscriptMdirect-productsuperscriptyr1superscriptkpc20.14\sigma_{\mathrm{central}}\sim 6.8\;\mathrm{km\;s}^{-1}\left(\frac{\Sigma_{\mathrm{SFR}}{}}{10^{-3}\,\mathrm{M}_{\odot}{}\;\mathrm{yr}^{-1}\;\mathrm{kpc}^{-2}}\right)^{0.14}. (6)

The local star formation intensity may influence the smallest allowed velocity dispersion in a region, even if it does not solely drive the H i velocity dispersions.

5.1.2 Turbulent H i Energy

In addition to examining the correlations between σcentralsubscript𝜎central\sigma_{\mathrm{central}} and ΣSFRsubscriptΣSFR\Sigma_{\mathrm{SFR}}, we also compare the turbulent H i energy to the energy provided by SF. This comparison provides a more robust connection between ISM properties and SF because the star formation energy may couple at similar efficiencies in regions that have different H i masses.

As in Paper I, we estimate the energy contained in the central H i peak, EHI,centralsubscript𝐸HIcentralE_{\mathrm{HI,central}} as:

EHI,central=32MSP(1fwings)(1fcold)σcentral2.subscript𝐸HIcentral32subscript𝑀SP1subscript𝑓wings1subscript𝑓coldsuperscriptsubscript𝜎central2E_{\mathrm{HI,central}}=\frac{3}{2}M_{\mathrm{SP}}(1-f_{\mathrm{wings}}{})(1-f_{\mathrm{cold}})\sigma_{\mathrm{central}}^{2}. (7)

Here, MSPsubscript𝑀SPM_{\mathrm{SP}} is the total mass of the superprofile in MsubscriptMdirect-product\mathrm{M}_{\odot}, given by MSP=2.36×10⁵D2FSPΔvsubscript𝑀SP2.36superscript105superscript𝐷2subscript𝐹SPΔ𝑣M_{\mathrm{SP}}=2.36\times 10^{5}D^{2}F_{\mathrm{SP}}\Delta v, for a distance D𝐷D in Mpc and an integrated superprofile flux FSPΔvsubscript𝐹SPΔ𝑣F_{\mathrm{SP}}\Delta v in Jy km s-1. The factor of 3/2323/2 accounts for motion in three dimensions, assuming isotropy. The total mass in the central peak is given by MSP(1fwings)subscript𝑀SP1subscript𝑓wingsM_{\mathrm{SP}}(1-f_{\mathrm{wings}}{}). We exclude H i in the wings of each superprofile because it does not follow the Gaussian velocity structure of the central peak. We estimate that a fraction fcold=0.15subscript𝑓cold0.15f_{\mathrm{cold}}=0.15 of this mass is cold H i and has kinematics that are poorly represented by σcentralsubscript𝜎central\sigma_{\mathrm{central}}. The true amount and kinematics of cold H i are unknown, but limits on fcoldsubscript𝑓coldf_{\mathrm{cold}} in dwarf galaxies range between 1201201-20% (e.g., Young et al., 2003; Warren et al., 2012). This value also matches the approximate fraction of cold H i in the SMC (<15absent15<15%; Dickey et al., 2000). Because the kinematics of cold H i are likely not turbulent and may not be connected to star formation in the same way as warm H i, we exclude this estimated fraction of cold gas from our energy calculation.

If the H i is turbulent, its energy can be dissipated approximately over one turbulent timescale, τDsubscript𝜏𝐷\tau_{D}, defined by Mac Low (1999) as:

τD9.8Myr(λ100pc)(σ10kms1)1similar-to-or-equalssubscript𝜏𝐷9.8Myr𝜆100pcsuperscript𝜎10kmsuperscripts11\tau_{D}\simeq 9.8\;\mathrm{Myr}\left(\frac{\lambda}{100\;\mathrm{pc}}\right)\left(\frac{\sigma}{10\;\mathrm{km\;s^{-1}}}\right)^{-1} (8)

where λ𝜆\lambda is the turbulent driving scale and σ𝜎\sigma is the H i velocity dispersion. Following Paper I, we have approximated λ=100𝜆100\lambda=100 pc and σ=σcentral𝜎subscript𝜎central\sigma=\sigma_{\mathrm{central}}{}. To maintain the observed turbulent kinetic energy, sufficient energy must be replenished over this timescale.

5.1.3 Available Star Formation Energy

We now compare the turbulent kinetic H i energy to that provided by star formation, ESFsubscript𝐸SFE_{\mathrm{SF}}, over one turbulent timescale, τDsubscript𝜏𝐷\tau_{D}:

ESF=ηSN(SFR×τD)1051ergs,subscript𝐸SFsubscript𝜂SNSFRsubscript𝜏𝐷superscript1051ergsE_{\mathrm{SF}}=\eta_{\mathrm{SN}}\left(\mathrm{SFR}\times\tau_{D}\right)10^{51}\;\mathrm{ergs}, (9)

Here, ηSNsubscript𝜂SN\eta_{\mathrm{SN}} is the number of SN per unit stellar mass formed; we adopt ηSN=1.3×10²subscript𝜂SN1.3superscript102\eta_{\mathrm{SN}}=1.3\times 10^{-2} SN MsubscriptMdirect-product\mathrm{M}_{\odot}-1 based on a Kroupa (2001) IMF with a 120 MsubscriptMdirect-product\mathrm{M}_{\odot} upper mass limit. This equation assumes that the star formation rate is constant across a 1020102010-20 Myr interval, so it may be problematic for dwarf galaxies, which often have non-uniform recent SFHs (e.g., McQuinn et al., 2010; Weisz et al., 2011). It also assumes the SFR is averaged over the past 10100similar-toabsent10100\sim 10-100 Myr, without allowing for variations in SFH. Because star formation can provide energy for up to 50similar-toabsent50\sim 50 Myr after a burst, these assumption may not be strongly in error, but we refer the reader to the third paper in this series (Paper III). We also note that the stochastic sampling of the IMF and cluster mass function in regions of low star formation can introduce scatter into SFR estimates from FUV or Hα𝛼\alpha tracers (Weisz et al., 2012). Compared with Hα𝛼\alpha, FUV estimates of star formation are more likely to provide correct estimates of the SFR as they rely on both O and B stars instead of only those with M15greater-than-or-equivalent-to𝑀15M\gtrsim 15 MsubscriptMdirect-product\mathrm{M}_{\odot} (Lee et al., 2011; Kennicutt & Evans, 2012).

5.1.4 Efficiency of Coupling Star Formation Energy to Kinetic H i Energy

With estimates of both EHI,centralsubscript𝐸HIcentralE_{\mathrm{HI,central}} and ESFsubscript𝐸SFE_{\mathrm{SF}}, we next derive the range of efficiencies that are consistent with our measurements. If star formation is the only driver of H i velocity dispersions, then the conversion efficiency from star formation energy to H i kinetic energy is given by ϵEHI,central/ESFitalic-ϵsubscript𝐸HIcentralsubscript𝐸SF\epsilon\equiv E_{\mathrm{HI,central}}/E_{\mathrm{SF}}. The actual efficiency could be lower if additional drivers also contribute to the kinetic H i energy. The conversion efficiency has been limited by a number of various studies, including those focusing on H i holes (e.g., Weisz et al., 2009; Warren et al., 2012) and simulations (e.g., Tenorio-Tagle et al., 1991; Thornton et al., 1998), but estimates of ϵitalic-ϵ\epsilon vary widely in these studies, from as low as <1absent1<1% to up to 505050%.

We start by examining the behavior of EHI,centralsubscript𝐸HIcentralE_{\mathrm{HI,central}} and ESFsubscript𝐸SFE_{\mathrm{SF}} as a function of ΣSFRsubscriptΣSFR\Sigma_{\mathrm{SFR}} in Figure 16. For this figure, we normalize the energies by area, as larger radial annuli often have a larger area of contributing star formation but with lower intensities. We plot ΣHIsubscriptΣHI\Sigma_{\mathrm{HI}} (top panels), the energy surface density of the H i central peak (ΣE,HI,centralsubscriptΣ𝐸HIcentral\Sigma_{E,\mathrm{HI,central}}; middle panels), and the star formation energy surface density (ΣE,SFsubscriptΣ𝐸SF\Sigma_{E,\mathrm{SF}}; bottom panels) as a function of ΣSFRsubscriptΣSFR\Sigma_{\mathrm{SFR}}. The left-hand panels represent the superprofiles generated inside and outside r25subscript𝑟25r_{25}, for the smaller galaxies, while the middle panels show those in radial annuli for larger galaxies; points are colored by r/r25𝑟subscript𝑟25r/r_{25}. The right-hand panels show the superprofiles generated in subregions of constant ΣSFRsubscriptΣSFR\Sigma_{\mathrm{SFR}}; points are colored by ΣSFRsubscriptΣSFR\Sigma_{\mathrm{SFR}}.

Refer to caption
Figure 16: ΣHIsubscriptΣHI\Sigma_{\mathrm{HI}} (upper panels), ΣE,HIsubscriptΣEHI\Sigma_{\mathrm{E,HI}} (middle panels), and ΣE,SFsubscriptΣESF\Sigma_{\mathrm{E,SF}} (lower panels) as a function of ΣSFRsubscriptΣSFR\Sigma_{\mathrm{SFR}}. Each point represents one spatially-resolved superprofile. The left-hand panels show measurements for superprofiles in radial subregions (colored by normalized radius), and the right-hand panels show measurements for superprofiles in subregions of constant ΣSFRsubscriptΣSFR\Sigma_{\mathrm{SFR}} (colored by ΣSFRsubscriptΣSFR\Sigma_{\mathrm{SFR}}). The vertical black line in the lower right corner of each panel represents one order of magnitude, indicating that ΣE,SFsubscriptΣESF\Sigma_{\mathrm{E,SF}} covers a much larger range than either ΣHIsubscriptΣHI\Sigma_{\mathrm{HI}} or ΣE,HIsubscriptΣEHI\Sigma_{\mathrm{E,HI}}.

Figure 16 shows that ΣE,SFsubscriptΣESF\Sigma_{\mathrm{E,SF}} and ΣE,HIsubscriptΣEHI\Sigma_{\mathrm{E,HI}} both increase with increasing ΣSFRsubscriptΣSFR\Sigma_{\mathrm{SFR}}, but their ranges span very different orders of magnitude. To indicate this difference in range, we have also plotted a black vertical line indicating one order of magnitude in the lower right corner of each panel. The H i energy surface density, which depends on both ΣHIsubscriptΣHI\Sigma_{\mathrm{HI}} and σcentralsubscript𝜎central\sigma_{\mathrm{central}}, covers 2less-than-or-similar-toabsent2\lesssim 2 orders of magnitude, while the star formation energy density spans 4similar-toabsent4\sim 4 orders of magnitude. If star formation couples to H i with a universal efficiency, then we expect both ΣE,SFsubscriptΣESF\Sigma_{\mathrm{E,SF}} and ΣE,HIsubscriptΣEHI\Sigma_{\mathrm{E,HI}} to span approximately the same number of orders of magnitude.

We can recast the data from Figure 16 by examining the correlation between ESFsubscript𝐸SFE_{\mathrm{SF}} and EHIsubscript𝐸HIE_{\mathrm{HI}} directly. We plot this comparison in Figure 17 for both the correlation between ESFsubscript𝐸SFE_{\mathrm{SF}} and EHIsubscript𝐸HIE_{\mathrm{HI}} and for the inferred energy coupling efficiency ϵEHI/ESFitalic-ϵsubscript𝐸HIsubscript𝐸SF\epsilon\equiv E_{\mathrm{HI}}/E_{\mathrm{SF}}. Each point represents a single superprofile, and points are colored by r/r25𝑟subscript𝑟25r/r_{\mathrm{25}} for the r25subscript𝑟25r_{25} and radial subregions (left and middle panels) and by ΣSFRsubscriptΣSFR\Sigma_{\mathrm{SFR}} for the ΣSFRsubscriptΣSFR\Sigma_{\mathrm{SFR}} subregions (right panels). The top panels show EHIsubscript𝐸HIE_{\mathrm{HI}} versus ESFsubscript𝐸SFE_{\mathrm{SF}}, while the bottom panels show ϵitalic-ϵ\epsilon versus ΣSFRsubscriptΣSFR\Sigma_{\mathrm{SFR}}. Unphysical or theoretically-forbidden efficiencies (ϵ>1italic-ϵ1\epsilon>1 or ϵ>0.1italic-ϵ0.1\epsilon>0.1) are shown in dark or light grey, and lines of constant efficiency are shown as dashed grey lines.

Refer to caption
Figure 17: Comparison of H i and SF energies and coupling efficiencies for the spatially-resolved sample. The upper panels show EHIsubscript𝐸HIE_{\mathrm{HI}} versus ESFsubscript𝐸SFE_{\mathrm{SF}}, and the lower panels show ϵEHI/ESFitalic-ϵsubscript𝐸HIsubscript𝐸SF\epsilon\equiv E_{\mathrm{HI}}/E_{\mathrm{SF}}. The left panels represent measurements from the superprofiles in radial subregions (colored by normalized radius), and the right panels show measurements from superprofiles in subregions of constant ΣSFRsubscriptΣSFR\Sigma_{\mathrm{SFR}} (colored by ΣSFRsubscriptΣSFR\Sigma_{\mathrm{SFR}}). The shaded regions represent regions where ϵ>1italic-ϵ1\epsilon>1 (dark grey) and ϵ>0.1italic-ϵ0.1\epsilon>0.1 (light grey). In the lower panels, we have overlaid the scaling relation between ϵitalic-ϵ\epsilon and ΣSFRsubscriptΣSFR\Sigma_{\mathrm{SFR}} from simulations by Joung et al. (2009) as the thick dashed line. We also overlay the best-fit scaling relation to our data as the black solid line. In our data, ϵitalic-ϵ\epsilon has a steeper dependence on ΣSFRsubscriptΣSFR\Sigma_{\mathrm{SFR}} than in the Joung et al. (2009) simulations, which were for higher star formation intensities and more massive galaxies.

The data in Figure 17 clearly show that the coupling efficiency ϵitalic-ϵ\epsilon is lowest at the high SFR intensities characteristic of the inner disks of galaxies. At low SFR intensities (ΣSFR104less-than-or-similar-tosubscriptΣSFRsuperscript104\Sigma_{\mathrm{SFR}}{}\lesssim 10^{-4}), ϵitalic-ϵ\epsilon often has theoretically-forbidden (ϵ>0.1italic-ϵ0.1\epsilon>0.1 Thornton et al., 1998) or unphysical values (ϵ>1italic-ϵ1\epsilon>1). If star formation were the sole driver of H i velocity dispersions, we might expect to see efficiencies that were constant. Instead, the strong apparent increase of efficiency with decreasing ΣSFRsubscriptΣSFR\Sigma_{\mathrm{SFR}} may simply be due to the decrease of star formation energy with ΣSFRsubscriptΣSFR\Sigma_{\mathrm{SFR}} while H i energy remains relatively constant due to another driving mechanism unrelated to SF. It also seems unlikely that the efficiencies conspire to produce the observed well-defined trend.

The observed trend of decreasing efficiencies with increasing ΣSFRsubscriptΣSFR\Sigma_{\mathrm{SFR}} has also been seen in numerical simulations by Joung et al. (2009)111The exponent on this scaling is different than that published in Joung et al. (2009), but the author agreed with the change (Joung, private communication)., who found that ϵΣSFR0.29proportional-toitalic-ϵsuperscriptsubscriptΣSFR0.29\epsilon\propto\Sigma_{\mathrm{SFR}}^{-0.29}. We show this scaling as the thick dashed black line in the lower panels of Figure 17, with the caveat that we have normalized the relation to match our data range. The Joung et al. (2009) scaling relation from the simulations is shallower than the observed relationship between ΣSFRsubscriptΣSFR\Sigma_{\mathrm{SFR}} and ϵitalic-ϵ\epsilon in our sample. We also overlay the linear regression to the data as the solid black line, as given by logϵ=mlog(ΣSFR/Σ0)+bitalic-ϵ𝑚subscriptΣSFRsubscriptΣ0𝑏\log{\epsilon}=m\log{(\Sigma_{\mathrm{SFR}}{}/\Sigma_{0})}+b; the best-fit regression corresponds to ϵ=(ΣSFR/Σ0)0.61±0.09italic-ϵsuperscriptsubscriptΣSFRsubscriptΣ0plus-or-minus0.610.09\epsilon=(\Sigma_{\mathrm{SFR}}/\Sigma_{0})^{-0.61\pm 0.09}, ϵ=(ΣSFR/Σ0)0.68±0.03italic-ϵsuperscriptsubscriptΣSFRsubscriptΣ0plus-or-minus0.680.03\epsilon=(\Sigma_{\mathrm{SFR}}/\Sigma_{0})^{-0.68\pm 0.03}, and ϵ=(ΣSFR/Σ0)0.71±0.04italic-ϵsuperscriptsubscriptΣSFRsubscriptΣ0plus-or-minus0.710.04\epsilon=(\Sigma_{\mathrm{SFR}}/\Sigma_{0})^{-0.71\pm 0.04} for the superprofiles generated in subregions of constant radius or star formation intensity, respectively. The normalization is Σ0=(5.8±1.3)×104subscriptΣ0plus-or-minus5.81.3superscript104\Sigma_{0}=(5.8\pm 1.3)\times 10^{-4} MsubscriptMdirect-product\mathrm{M}_{\odot} yr-1 kpc-2 for the r25subscript𝑟25r_{25} subregions; Σ0=(6.0±1.3)×104subscriptΣ0plus-or-minus6.01.3superscript104\Sigma_{0}=(6.0\pm 1.3)\times 10^{-4} MsubscriptMdirect-product\mathrm{M}_{\odot} yr-1 kpc-2 for the radial annuli; and Σ0=(6.4±1.8)×104subscriptΣ0plus-or-minus6.41.8superscript104\Sigma_{0}=(6.4\pm 1.8)\times 10^{-4} MsubscriptMdirect-product\mathrm{M}_{\odot} yr-1 kpc-2 for the constant ΣSFRsubscriptΣSFR\Sigma_{\mathrm{SFR}} subregions. For all types of subregion, the relation between ΣSFRsubscriptΣSFR\Sigma_{\mathrm{SFR}} and ϵitalic-ϵ\epsilon is steeper than the relationship found by Joung et al. (2009). This discrepancy may exist because the Joung et al. (2009) simulations focused on more intense star formation regimes than our sample, spanning 151215121-512 times the SFR of the Milky Way. In addition, the scaling relations adopted in the Joung et al. (2009) simulations may not be appropriate for lower-mass galaxies like those in our sample. For example, Joung et al. (2009) assumed that ΣSFRΣgas1.4proportional-tosubscriptΣSFRsuperscriptsubscriptΣgas1.4\Sigma_{\mathrm{SFR}}{}\propto\Sigma_{\mathrm{gas}}^{1.4}, a value appropriate for the larger spirals in their simulations, but in the lower-mass SMC, Bolatto et al. (2011) found a much steeper relation of ΣSFRΣgas2.2proportional-tosubscriptΣSFRsuperscriptsubscriptΣgas2.2\Sigma_{\mathrm{SFR}}{}\propto\Sigma_{\mathrm{gas}}^{2.2}, a scaling more appropriate for our low-mass sample. In spite of the different SFR regimes and input assumptions, the observed behavior of declining efficiency with increasing ΣSFRsubscriptΣSFR\Sigma_{\mathrm{SFR}} is still qualitatively similar to the Joung et al. (2009) simulations.

A declining coupling efficiency with increasing ΣSFRsubscriptΣSFR\Sigma_{\mathrm{SFR}} is not theoretically unreasonable. The ISM is multiphase, and the neutral medium we trace here is probably less directly coupled to star formation than the dense molecular phase, which precedes star formation, or the hotter ionized phase, which is an immediate result of star formation. For example, if the energy of star formation, in the form of stellar winds and SN feedback, goes primarily into shock heating and producing ionized outflows, then any coupling to the neutral medium must occur primarily on the interfaces between the expanding SN-driven bubbles and the neutral gas reservoir, suggesting a relatively weak coupling consistent with what is seen here. At high enough ΣSFRsubscriptΣSFR\Sigma_{\mathrm{SFR}}, SN-driven outflows may be strong enough to break out of the galactic disk, allowing more of the star formation energy to escape (e.g., Dekel & Silk, 1986). Similarly, Monaco (2004) find different efficiencies are associated with SNe that are contained within the disk compared with those that undergo blowout. In addition, Lopez et al. (2011) have shown that hot gas in the intense star forming region 30 Doradus can leak out of the surrounding shell, consistent with this picture.

The star formation energy may also couple more strongly to the warm ionized phase of the ISM. Indeed, studies of Hα𝛼\alpha in dwarf galaxies indicate that the ionized gas shows both larger velocity dispersions and a larger dynamic range compared with H i (e.g., van Eymeren et al., 2010; Moiseev & Lozinskaya, 2012). For example, Sextans A contains a shell of ionized gas with expansion velocities of 60similar-toabsent60\sim 60 km s-1, much higher than surrounding H i velocity dispersions (Martin, 1998). One could imagine that as the SFR intensity decreases, a smaller fraction of the SN-driven bubbles actively undergo blowout, thus guaranteeing that most of the SN energy is deposited in the disk and increasing the coupling efficiency between star formation and H i energies. Indeed, extraplanar diffuse ionized gas has been seen primarily in spirals whose disks exceed a given ΣSFRsubscriptΣSFR\Sigma_{\mathrm{SFR}} threshold (Rossa & Dettmar, 2003), consistent with the picture that a stronger coupling to the ionized phase (and therefore a weaker coupling to H i) exists at higher ΣSFRsubscriptΣSFR\Sigma_{\mathrm{SFR}}.

The turbulent dissipation timescale in dwarf galaxies could potentially be longer than the fiducial 10similar-toabsent10\sim 10 Myr found by Mac Low (1999). At low SFRs, SNe are sparsely distributed across the disk, implying that the driving scale of turbulence in these systems could be larger as remnants could propagate farther through the disk. The increased scale heights of dwarf galaxies compared to larger spiral disks mean that SNe are still contained within the disk to larger radii than in more massive galaxies. The scale height therefore provides an upper limit to the driving scale, as energy can escape from the disk once the radius of the SNe is equal to the scale height. The scale heights of dwarf galaxies are a few times larger than more massive spiral counterparts (e.g., Banerjee et al., 2011). This difference only provides a factor of a few increase in the energy available from star formation, which is not enough to compensate for implied efficiencies of ϵ1greater-than-or-equivalent-toitalic-ϵ1\epsilon\gtrsim 1.

If star formation has nothing to do with setting turbulent H i velocity dispersions, we would also expect to see declining efficiencies with increasing ΣSFRsubscriptΣSFR\Sigma_{\mathrm{SFR}}. For a fixed H i turbulent energy, we would expect ϵΣE,SF1proportional-toitalic-ϵsuperscriptsubscriptΣESF1\epsilon\propto\Sigma_{\mathrm{E,SF}}^{-1}, implying a similar scaling between ϵitalic-ϵ\epsilon and ΣSFRsubscriptΣSFR\Sigma_{\mathrm{SFR}}. This scaling is steeper than the observed ϵΣSFR0.64proportional-toitalic-ϵsuperscriptsubscriptΣSFR0.64\epsilon\propto\Sigma_{\mathrm{SFR}}^{-0.64} from Figure 17, so it is likely that star formation does have some influence on H i turbulent velocity dispersions. However, the efficiencies reach unphysically high values at low star formation intensities, indicating that ΣSFRsubscriptΣSFR\Sigma_{\mathrm{SFR}} cannot be the sole driver of H i velocity dispersions. This scaling is also hampered by the fact that local ISM conditions also scale with star formation; for example, ΣHIsubscriptΣHI\Sigma_{\mathrm{HI}} and ΣSFRsubscriptΣSFR\Sigma_{\mathrm{SFR}} are correlated. We explore other drivers of turbulence in § 5.1.5 and 5.1.6.

5.1.5 Turbulent H i Kinematics and Surface Mass Density

Although the H i velocity dispersion correlates with the local ΣSFRsubscriptΣSFR\Sigma_{\mathrm{SFR}} at high star formation intensities, it is even more strongly correlated with ΣbaryonsubscriptΣbaryon\Sigma_{\mathrm{baryon}} (Tables 1 and 4). The mismatch between star formation energy and H i energy, especially at low star formation intensities, supports the idea that H i velocity dispersions are driven at least partially by other processes.

The fact that σcentralsubscript𝜎central\sigma_{\mathrm{central}} correlates most strongly with ΣbaryonsubscriptΣbaryon\Sigma_{\mathrm{baryon}} may indicate that H i velocity dispersions are driven by some type of gravitational instability in the low ΣSFRsubscriptΣSFR\Sigma_{\mathrm{SFR}}, low ΣbaryonsubscriptΣbaryon\Sigma_{\mathrm{baryon}} regime that dominates our sample. However, the solid-body rotation curves of low-mass galaxies do not provide the large shearing motions that are thought to be necessary to drive most gravitational instabilities (e.g., Kim & Ostriker, 2007; Agertz et al., 2009). A number of these gravitational instabilities also require the presence of strong spiral arms (e.g., Roberts, 1969; Lin & Shu, 1964), which are likewise not present in the majority of our sample. In addition, our earlier analysis of the global kinematics (Paper I) showed that one of these gravitational instabilities, as outlined by Wada et al. (2002), does not provide enough energy to drive H i velocity dispersions.

Simple energy scaling arguments for gravitational instabilities suggests that σcentralsubscript𝜎central\sigma_{\mathrm{central}} should increase as Σbaryon0.5superscriptsubscriptΣbaryon0.5\Sigma_{\mathrm{baryon}}^{0.5} for an isothermal disk with fixed scale height (e.g., van der Kruit, 1981). A MCMC fit (see Foreman-Mackey et al., 2012) to the σcentralsubscript𝜎central\sigma_{\mathrm{central}} and ΣbaryonsubscriptΣbaryon\Sigma_{\mathrm{baryon}} data yields

σcentral=(7.6±0.9)(Σbaryon107Mkpc2)0.13±0.01,subscript𝜎centralplus-or-minus7.60.9superscriptsubscriptΣbaryonsuperscript107subscriptMdirect-productsuperscriptkpc2plus-or-minus0.130.01\sigma_{\mathrm{central}}{}=(7.6\pm 0.9)\left(\frac{\Sigma_{\mathrm{baryon}}}{10^{7}\,\mathrm{M}_{\odot}{}\,\mathrm{kpc}^{-2}}\right)^{0.13\pm 0.01}, (10)

with a slope three times shallower than expected. This discrepancy may be due to the influence of the dark matter component within the disk, or to variable scale heights in our sample. Using the equation for scale height given by Ott et al. (2001):

hz=579pc(σgas10kms1)2(NHI1021cm2)1(ρHIρt),subscript𝑧579pcsuperscriptsubscript𝜎gas10kmsuperscripts12superscriptsubscript𝑁HIsuperscript1021superscriptcm21subscript𝜌HIsubscript𝜌𝑡h_{z}=579\;\mathrm{pc}\;\left(\frac{\sigma_{\mathrm{gas}}}{10\;\mathrm{km\;s}^{-1}}\right)^{2}\left(\frac{N_{\mathrm{HI}}}{10^{21}\;\mathrm{cm}^{-2}}\right)^{-1}\left(\frac{\rho_{\mathrm{HI}}}{\rho_{t}}\right), (11)

where σgassubscript𝜎gas\sigma_{\mathrm{gas}} is the velocity dispersion, NHIsubscript𝑁HIN_{\mathrm{HI}} is the H i column density, and ρHIsubscript𝜌HI\rho_{\mathrm{HI}} and ρtsubscript𝜌𝑡\rho_{t} are the H i and total mass densities of the disk, we derive scale heights ranging between 50900similar-toabsent50900\sim 50-900 pc for the subregions. The idea of a “scale height” may not be appropriate for the smallest dwarfs in our sample, which show very irregular H i distributions and high σ/w20𝜎subscript𝑤20\sigma/w_{20} ratios for disks. We note that this slope remains the same if we use the ΣSFRsubscriptΣSFR\Sigma_{\mathrm{SFR}} superprofiles instead of the radially-resolved ones. Both the fact that gravitational drivers are inefficient in these systems (Paper I) as well as the mismatch between the expected and measured scaling of σcentralsubscript𝜎central\sigma_{\mathrm{central}} with ΣbaryonsubscriptΣbaryon\Sigma_{\mathrm{baryon}} imply that gravity is not a strong factor in driving H i turbulence.

5.1.6 Other Possible Turbulent Drivers

Many of the other proposed non-stellar drivers of turbulence, such as the magnetorotational instability (MRI), require shear from differential rotation to extract energy from the gravitational potential and convert it to turbulence. Unfortunately, the rotation curves of dwarf galaxies are often solid-body and therefore lack the necessary shear. We note that H i in dwarf galaxies shows similar velocity dispersions to those measured in the outer regions of sprials, where shear is present. Because the MRI is expected to be less efficient in this regime, but H i velocity dispersions are similar, one can question the idea that MRI is a driver of H i velocity dispersions in spirals as well. On the other hand, non-circular motions in galaxies could potentially provide a source of shear to extract energy for turbulence, but the average amplitude of non-circular motions (5less-than-or-similar-toabsent5\lesssim 5 km s-1; Trachternach et al., 2008; Oh et al., 2011) is smaller than the typical H i velocity dispersions, thus requiring efficiencies in excess of 100%.

Recently, mass accretion has been proposed as a driver of turbulence in galaxies (Klessen & Hennebelle, 2010). In this scenario, infalling gas converts its kinetic energy to turbulent energy with some efficiency:

ϵacc|E˙decayE˙in|=Mgasσ3λM˙invin2,subscriptitalic-ϵaccsubscript˙𝐸decaysubscript˙𝐸insubscript𝑀gassuperscript𝜎3𝜆subscript˙𝑀insuperscriptsubscript𝑣in2\epsilon_{\mathrm{acc}}\equiv\left|\frac{\dot{E}_{\mathrm{decay}}}{\dot{E}_{\mathrm{in}}}\right|=\frac{M_{\mathrm{gas}}\sigma^{3}}{\lambda\dot{M}_{\mathrm{in}}v_{\mathrm{in}}^{2}}, (12)

where E˙decaysubscript˙𝐸decay\dot{E}_{\mathrm{decay}} and E˙insubscript˙𝐸in\dot{E}_{\mathrm{in}} are the rates of turbulent energy decay and energy input, respectively. Here, Mgassubscript𝑀gasM_{\mathrm{gas}} is the mass of turbulent gas, σ𝜎\sigma is the turbulent velocity dispersion, and λ𝜆\lambda the turbulent decay length. M˙insubscript˙𝑀in\dot{M}_{\mathrm{in}} and vinsubscript𝑣inv_{\mathrm{in}} represent the mass accretion rate and the velocity of infalling gas. The authors calculated the required coupling efficiencies for accretion-driven turbulence in 11 THINGS galaxies, under the assumption that M˙in=M˙SFsubscript˙𝑀insubscript˙𝑀SF\dot{M}_{\mathrm{in}}=\dot{M}_{\mathrm{SF}} (i.e., that all infalling gas is being converted to stars) and vin=vrotsubscript𝑣insubscript𝑣rotv_{\mathrm{in}}=v_{\mathrm{rot}}. They found that the efficiencies were ϵ10less-than-or-similar-toitalic-ϵ10\epsilon\lesssim 10% for the 8 spirals in their sample, including the outer disks, but the 3 of the 4 dwarfs that overlap with our sample required ϵ>1italic-ϵ1\epsilon>1 to drive observed levels of turbulence (IC 2574, NGC 4214, and Ho I). While this method may be a viable source of energy for turbulence in the outer disks of spirals, it does not appear to function effectively in dwarfs.

We note that SN bubbles or H ii regions could induce expanding gas motions, resulting in infalling material that could drive turbulence through a similar mechanism (“galactic fountain”; e.g., Shapiro & Field, 1976). In spiral galaxies, this idea is supported by the existence of extraplanar gas at anomalous velocities in some systems (e.g., Fraternali et al., 2001, 2002; Barbieri et al., 2005; Boomsma et al., 2008). Expanding ISM material has also been detected in both typical and starbursting dwarf galaxies (e.g., NGC 2366, NGC 4861, NGC 1569, NGC 4214; Schwartz & Martin, 2004; van Eymeren et al., 2009a, b, 2010). The timescale for this expanding gas to fall back to the disk is unclear, as ionized gas structures can be found in regions far from any current star formation (e.g., Hunter et al., 1993), thus hampering any energy calculations. In addition, the fact that less than half the dwarfs in the Hunter et al. (1993) sample showed evidence of expanding shells indicates that galactic fountains are unlikely to be responsible for accretion-driven turbulence in all dwarf galaxies.

Dynamical interactions with dark matter subhalos have recently been proposed as a cause for H i holes or both gaseous and stellar substructure in extended galaxy disks (e.g., Bekki & Chiba, 2006; Kazantzidis et al., 2008). These interactions could potentially be a source of energy for turbulence in low ΣSFRsubscriptΣSFR\Sigma_{\mathrm{SFR}} regions if energy could be extracted and transferred to the gas. Because the H i gas will dissipate its turbulent energy over 10similar-toabsent10\sim 10 Myr, the interactions must be at least this frequent to sustain observed levels of turbulence. Followup simulations have concluded that impacts from dark matter subhalos are an unlikely cause of H i holes (e.g., Kannan et al., 2012), but interactions that increase velocity dispersion are not necessarily restricted only to the energetic events necessary for hole creation . Halo impacts on the disk can increase gas velocity perpendicular the disk of order 510similar-toabsent510\sim 5-10 km s-1, but the effect is local (e.g., Kannan et al., 2012).

As a first test of this idea, we compare the gravitational potential energy of the galaxy, EGPEsubscript𝐸GPEE_{\mathrm{GPE}}, to the energy required to maintain the observed velocity dispersion, Eturb=E˙turbτDsubscript𝐸turbsubscript˙𝐸turbsubscript𝜏𝐷E_{\mathrm{turb}}=\dot{E}_{\mathrm{turb}}\tau_{D}, since a redshift of z=1𝑧1z=1. To first order, we can estimate the gravitational potential energy of a halo with an isothermal density profile as:

EGPE=GM2002R200=(10GH)2/3M2005/3,subscript𝐸GPE𝐺superscriptsubscript𝑀2002subscript𝑅200superscript10𝐺𝐻23superscriptsubscript𝑀20053E_{\mathrm{GPE}}=\frac{GM_{200}^{2}}{R_{200}}=(10GH)^{2/3}M_{200}^{5/3}, (13)

where G𝐺G is the gravitational constant, H𝐻H is the Hubble constant (70 km s-1 Mpc-1; Komatsu et al., 2011), and M200subscript𝑀200M_{\mathrm{200}} and R200subscript𝑅200R_{\mathrm{200}} are the mass and radius of the halo when the average density reaches 200200200 times the critical density of the universe. The dissipation rate of turbulent energy associated with a mass MHIsubscript𝑀HIM_{\mathrm{HI}} for a given velocity dispersion σ𝜎\sigma is

E˙turb=ηvkMHIσ3,subscript˙𝐸turbsubscript𝜂𝑣𝑘subscript𝑀HIsuperscript𝜎3\dot{E}_{\mathrm{turb}}=\eta_{v}kM_{\mathrm{HI}}\sigma^{3}, (14)

where ηv=0.21/πsubscript𝜂𝑣0.21𝜋\eta_{v}=0.21/\pi and k𝑘k is related to the driving length scale of turbulence by k=2π/λ𝑘2𝜋𝜆k=2\pi/\lambda (Mac Low, 1999).

We can compare the energy required to maintain a velocity dispersion of 101010 km s-1 since a redshift of z=1𝑧1z=1 to the gravitational potential energy of the halo by taking the ratio of Eturbsubscript𝐸turbE_{\mathrm{turb}} to EGPEsubscript𝐸GPEE_{\mathrm{GPE}}. If we assume that MHI=fgasMbaryonsubscript𝑀HIsubscript𝑓gassubscript𝑀baryonM_{\mathrm{HI}}=f_{\mathrm{gas}}M_{\mathrm{baryon}} and M200=Mbaryon/fbaryonsubscript𝑀200subscript𝑀baryonsubscript𝑓baryonM_{\mathrm{200}}=M_{\mathrm{baryon}}/f_{\mathrm{baryon}}, we can re-write the ratio E˙turb×t/EGPEsubscript˙𝐸turb𝑡subscript𝐸GPE\dot{E}_{\mathrm{turb}}\times t/E_{\mathrm{GPE}} as:

ϵ=0.078(fgas0.5)(fbaryon0.0066)5/3(Mbaryon108M)2/3(σ10kms1)3(λ100pc).italic-ϵ0.078subscript𝑓gas0.5superscriptsubscript𝑓baryon0.006653superscriptsubscript𝑀baryonsuperscript108subscriptMdirect-product23superscript𝜎10kmsuperscripts13𝜆100pc\epsilon=0.078\left(\frac{f_{\mathrm{gas}}}{0.5}\right)\left(\frac{f_{\mathrm{baryon}}}{0.0066}\right)^{5/3}\left(\frac{M_{\mathrm{baryon}}}{10^{8}\;\mathrm{M}_{\odot}{}}\right)^{-2/3}\left(\frac{\sigma}{10\;\mathrm{km\,s}^{-1}}\right)^{3}\left(\frac{\lambda}{100\;\mathrm{pc}}\right). (15)

In this case, we have assumed fgas=0.5subscript𝑓gas0.5f_{\mathrm{gas}}=0.5, a value compatible with the MHIsubscript𝑀HIM_{\mathrm{HI}} and Mbaryonsubscript𝑀baryonM_{\mathrm{baryon}} measurements of our sample. Estimates for fbaryonsubscript𝑓baryonf_{\mathrm{baryon}} for the range of Mstarsubscript𝑀starM_{\mathrm{star}} in our sample are 0.010.1fcosmic0.010.1subscript𝑓cosmic0.01-0.1f_{\mathrm{cosmic}} (Trujillo-Gomez et al., 2011), where fcosmicsubscript𝑓cosmicf_{\mathrm{cosmic}} is the cosmic baryon fraction of the universe (i.e., Ωbaryon/ΩmattersubscriptΩbaryonsubscriptΩmatter\Omega_{\mathrm{baryon}}/\Omega_{\mathrm{matter}}); we choose the median fbaryon=0.05fcosmicsubscript𝑓baryon0.05subscript𝑓cosmicf_{\mathrm{baryon}}=0.05f_{\mathrm{cosmic}}. We use H=70𝐻70H=70 km s-1 Mpc-1, as consistent with the seventh year WMAP results (Komatsu et al., 2011).

The ratio of Eturbsubscript𝐸turbE_{\mathrm{turb}} to EGPEsubscript𝐸GPEE_{\mathrm{GPE}} is 0.0780.0780.078 for halos with Mbaryon=108subscript𝑀baryonsuperscript108M_{\mathrm{baryon}}=10^{8} MsubscriptMdirect-product\mathrm{M}_{\odot}, the mean stellar mass of our sample, and increases for the lower-mass dwarfs in our sample with smaller Mbaryonsubscript𝑀baryonM_{\mathrm{baryon}}. If energy can be extracted from the gravitational potential of the galaxy (i.e., due to interactions between the disk and dark matter subhalos), the ratio given in Equation 15 must at the very least be less than the canonical fraction of mass in subhalos smaller than a given halo mass (10%; e.g., Klypin et al., 1999; Ghigna et al., 2000). Since dark matter is collisionless and can only affect the disk gravitationally, one would expect the efficiency of extracting energy to be very low. It would also depend on the interaction rate between subhalos and the gaseous disk, as not all subhalos have orbits that pass through the H i disk (e.g., Kannan et al., 2012). This method may be potentially feasible for massive galaxies, with larger gravitational potentials, but is unlikely to provide enough energy in the lower-mass galaxies where other potential drivers of turbulence (e.g., the MRI or gravitational instabilities) are also unable to function.

5.1.7 Implications

H i velocity dispersions in dwarf galaxies are typically comparable to those in spirals. In this paper, we have examined a number of potential sources of energy for turbulent velocity dispersions (star formation, known gravitational instabilities, the MRI, and accretion-driven turbulence) and found that no single one is able to consistently sustain the observed velocity dispersions in all regions of dwarf galaxies. If some instability could extract energy from the rotational energy of the galaxies, it would require efficiencies on the order of ϵ(σcentral/vrot)2similar-toitalic-ϵsuperscriptsubscript𝜎centralsubscript𝑣rot2\epsilon\sim(\sigma_{\mathrm{central}}/v_{\mathrm{rot}})^{2}, which ranges from ϵ0.410similar-toitalic-ϵ0.410\epsilon\sim 0.4-10% for a median σcentral=7.8subscript𝜎central7.8\sigma_{\mathrm{central}}{}=7.8 km s-1 and the range of vrotw20/2similar-tosubscript𝑣rotsubscript𝑤202v_{\mathrm{rot}}\sim w_{\mathrm{20}}/2 values of our sample. These efficiencies are not unreasonable, but the mechanism to extract this energy is unknown.

In addition, it is not necessary to limit the energy for turbulence to a single source. Instead, it may come from a number of sources, e.g.:

Etotal=ϵSFESF+ϵgravEgrav+ϵaccrEaccr+subscript𝐸totalsubscriptitalic-ϵSFsubscript𝐸SFsubscriptitalic-ϵgravsubscript𝐸gravsubscriptitalic-ϵaccrsubscript𝐸accrE_{\mathrm{total}}=\epsilon_{\mathrm{SF}}E_{\mathrm{SF}}+\epsilon_{\mathrm{grav}}E_{\mathrm{grav}}+\epsilon_{\mathrm{accr}}E_{\mathrm{accr}}+... (16)

for contributions from star formation, gravitational, accretion energies, and other sources, respectively, but disentangling the required efficiencies for each energetic component is beyond the scope of this paper.

It is also possible that the observed velocity dispersions are thermal in nature, instead of turbulent. A UV background could potentially drive thermal velocity dispersions to 6similar-toabsent6\sim 6 km s-1 (Schaye, 2004; Tamburro et al., 2009), but is unlikely to explain the higher velocity dispersions of 10similar-toabsent10\sim 10 km s-1. If some other mechanism is able to heat H i to higher temperatures (i.e., the decay of previous turbulent energy into thermal energy), the combination of low metallicity from inefficient SF and the low pressure due to low surface density means that H i is likely to exist primarily in the warm phase. We can test this by assuming that existing SF couples to the surrounding H i gas at a 10% efficiency, producing H i with a turbulent velocity dispersion σturbsubscript𝜎turb\sigma_{\mathrm{turb}}, with thermal broadening at a level σthermalsubscript𝜎thermal\sigma_{\mathrm{thermal}} making up the remainder of the observed velocity dispersion. By adding the two velocity dispersions in quadrature to obtain observed σcentralsubscript𝜎central\sigma_{\mathrm{central}} values (i.e., σcentral2=σthermal2+σturb2superscriptsubscript𝜎central2superscriptsubscript𝜎thermal2superscriptsubscript𝜎turb2\sigma_{\mathrm{central}}^{2}=\sigma_{\mathrm{thermal}}^{2}+\sigma_{\mathrm{turb}}^{2}), we estimate the necessary σthermalsubscript𝜎thermal\sigma_{\mathrm{thermal}} as:

σthermal=(σcentral20.123ΣE,SFΣHI)1/2.subscript𝜎thermalsuperscriptsuperscriptsubscript𝜎central20.123subscriptΣESFsubscriptΣHI12\sigma_{\mathrm{thermal}}=\left(\sigma_{\mathrm{central}}^{2}-0.1\frac{2}{3}\frac{\Sigma_{\mathrm{E,SF}}}{\Sigma_{\mathrm{HI}}}\right)^{1/2}. (17)

Here, 0.10.10.1 represents a fiducial coupling efficiency between SF energy and H i turbulent energy. This approximation is valid only in low ΣSFRsubscriptΣSFR\Sigma_{\mathrm{SFR}} regimes, as observed efficiencies can be 0.1less-than-or-similar-toabsent0.1\lesssim 0.1 in higher ΣSFRsubscriptΣSFR\Sigma_{\mathrm{SFR}} regions.

In Figure 18 we plot the implied σthermalsubscript𝜎thermal\sigma_{\mathrm{thermal}} and corresponding implied temperature T𝑇T as a function of ΣSFRsubscriptΣSFR\Sigma_{\mathrm{SFR}} for superprofiles in regions of constant radius (top) and constant ΣSFRsubscriptΣSFR\Sigma_{\mathrm{SFR}} (bottom). The implied T𝑇T values span a wide range, from 1001600010016000100-16000 K, with many σthermalsubscript𝜎thermal\sigma_{\mathrm{thermal}} values requiring temperatures in the unstable regime of the phase diagram (e.g., Wolfire et al., 1995). In the Milky Way, roughly 505050% of H i has been observed to have temperatures in this unstable regime (Heiles, 2001; Heiles & Troland, 2003), so it may not be unrealistic to expect similar results in other galaxies. A small number of superprofiles have implied temperatures greater than 104superscript10410^{4} K, approximately the maximum temperature expected for H i (e.g., Wolfire et al., 1995). The Mach numbers implied by σthermalsubscript𝜎thermal\sigma_{\mathrm{thermal}} and σturbsubscript𝜎turb\sigma_{\mathrm{turb}} are typically subsonic for estimates of σthermalsubscript𝜎thermal\sigma_{\mathrm{thermal}} from Equation 17 or from assuming that all H i has T=7000𝑇7000T=7000 K. If the H i were cold (T=100𝑇100T=100 K), the Mach numbers indicate supersonic turbulent motions for the superprofiles.

Refer to caption
Figure 18: Implied thermal velocity dispersions and corresponding temperatures for superprofiles in regions of constant radius (top panel) and constant ΣSFRsubscriptΣSFR\Sigma_{\mathrm{SFR}} (bottom panel), assuming a coupling efficiency of 0.1 between star formation and H i energy. The horizontal dashed lines are the two stable temperatures expected for H i (Wolfire et al., 1995). We have shaded T>104𝑇superscript104T>10^{4} K, where H i is not expected to exist.

For the low column densities and larger scale heights of dwarf galaxies, we might expect the majority of H i to be in the warm phase, with T104similar-to𝑇superscript104T\sim 10^{4} K. The low metallicity characteristic of these galaxies plus lower gas densities means that n2superscript𝑛2n^{2} cooling processes are less efficient, and thus gas will remain in the warm phase for longer times. Therefore, it may not be unreasonable to expect that H i velocity dispersions are primarily thermal in low ΣSFRsubscriptΣSFR\Sigma_{\mathrm{SFR}} regions. However, implied temperatures greater than 104superscript10410^{4} K suggest that both turbulence due to star formation and thermal broadening are unable to explain the velocity dispersion of all H i line profiles.

In summary, we have determined that none of the proposed drivers of turbulence alone can function effectively in dwarf galaxies where the typical ΣSFRsubscriptΣSFR\Sigma_{\mathrm{SFR}} is low. In all cases, more energy is required than can be provided by any driver alone. If the velocity dispersions are indeed due to turbulence, the only apparent solution is that the turbulent energy is not being dissipated at the expected rate. It is therefore unclear what mechanism is driving the turbulence in the low-ΣSFRsubscriptΣSFR\Sigma_{\mathrm{SFR}} regime. Thermal broadening can potentially provide broadening at the observed levels of velocity dispersion, but the connection between thermal velocity dispersions and star formation is not necessarily clear when both high and low ΣSFRsubscriptΣSFR\Sigma_{\mathrm{SFR}} regions are taken into account.

5.2 The Superprofile Wings

We find that only a small fraction (15less-than-or-similar-toabsent15\lesssim 15%) of the H i gas exists at high velocities compared to σcentralsubscript𝜎central\sigma_{\mathrm{central}}. These small fractions may either indicate small systematic non-Gaussianity inherent in H i line profiles (e.g., Petric & Rupen, 2007) or be due to small amounts of H i gas accelerated to high velocities by SN feedback. We see no significant trend between fwingssubscript𝑓wingsf_{\mathrm{wings}} and the local star formation intensity. The only possible trend is an indication that fwingssubscript𝑓wingsf_{\mathrm{wings}} has lower scatter at higher star formation intensities, which may be due only to the small number of measurements at these extreme values. While the lack of strong correlations suggests only a tenuous connection between high velocity gas and star formation or a poor mismatch of the spatial and temporal scales to which are measurements are sensitive, the lack of a clear lifetime for high velocity gas makes any firm conclusions difficult, given that the presence of high velocity gas may be restricted to timescales either much shorter or longer than the timescale associated with FUV+24μ𝜇\mum SFR estimates. We investigate this possibility further in Paper III of this series.

Like the width of the central peak of the superprofiles, σwingssubscript𝜎wings\sigma_{\mathrm{wings}} also tends to increase with increasing measures of mass surface density and/or star formation. If this trend is interpreted physically, this behavior is consistent with the idea that star formation drives bulk H i motions to faster velocities, for some fraction of the H i disk. However, σwingssubscript𝜎wings\sigma_{\mathrm{wings}} is correlated with σcentralsubscript𝜎central\sigma_{\mathrm{central}} by definition (Equation 3), so superprofiles with higher σcentralsubscript𝜎central\sigma_{\mathrm{central}} values must necessarily have higher σwingssubscript𝜎wings\sigma_{\mathrm{wings}} values as well. The correlation between σwingssubscript𝜎wings\sigma_{\mathrm{wings}} and measures of mass or star formation surface density may be due to an underlying correlation with σcentralsubscript𝜎central\sigma_{\mathrm{central}}.

In Paper I, we proposed that the asymmetry of the wings had more scatter in lower mass galaxies due to star formation. In that scenario, individual star formation regions drove asymmetric H i motions, so galaxies with fewer star formation regions had a higher chance of retaining asymmetry in the superprofile. If that were the case, we might expect to see increased asymmetry in the spatially resolved superprofiles with increased measures of star formation, as traced by either ΣSFRsubscriptΣSFR\Sigma_{\mathrm{SFR}} or ΣSFR/ΣHIsubscriptΣSFRsubscriptΣHI\Sigma_{\mathrm{SFR}}{}/\Sigma_{\mathrm{HI}}{}. In general, the afullsubscript𝑎fulla_{\mathrm{full}} parameter does not show the expected trends, though some individual galaxies do show increasing afullsubscript𝑎fulla_{\mathrm{full}} with increasing ΣSFRsubscriptΣSFR\Sigma_{\mathrm{SFR}} (i.e., IC 2574, NGC 4214, DDO 53).

The asymmetry of the superprofiles may therefore be due to other factors, such as infalling or outflowing H i. The trend of decreasing scatter in a𝑎a with increasing SFR found in Paper I could also be attributed to the fact that galaxies with lower total SFRs tend to be lower mass, with shallower potentials that are more conducive to sloshing motions that could induce the observed asymmetry. For example, the velocity field of of UGC 4483 has been shown to be consistent with rotation plus 5similar-toabsent5\sim 5 km s-1 radial motions (Lelli et al., 2012). As stated before, average non-circular motions are 5less-than-or-similar-toabsent5\lesssim 5 km s-1 in THINGS dwarf galaxies in our sample (Trachternach et al., 2008; Oh et al., 2011). If these motions are not uniform across the galaxy disk, they could produce asymmetries that propagate to the superprofiles.

5.3 Universality in H i profile shapes

As proposed in Petric & Rupen (2007) and discussed in Paper I, average H i line profiles tend to show very similar shapes when normalized to the same width. We now determine if the spatially-resolved superprofiles also have similar shapes. In Figure 19, we show the resolved superprofiles after scaling to the same amplitude and HWHM. Both radial superprofiles (left) and ΣSFRsubscriptΣSFR\Sigma_{\mathrm{SFR}} superprofiles (right) are shown. We find similar behavior for the spatially-resolved superprofiles as in Paper I and Petric & Rupen (2007). The primary differences manifest in the wing regions, with some galaxies showing more flux in the wings compared to others. This finding supports the idea that the H i emission tends to follow a non-Gaussian profile shape.
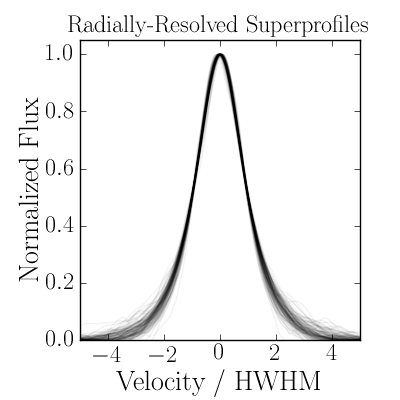
Refer to caption
Refer to caption
Figure 19: Superprofiles scaled to the same amplitude and HWHM for our sample. The left panel shows all superprofiles from radial subregions, while the right shows the all superprofiles from subregions of constant ΣSFRsubscriptΣSFR\Sigma_{\mathrm{SFR}}. Each line represents a single superprofile, and has been plotted with a transparency value. Darker regions indicate more overlapping superprofiles. In both cases, the superprofiles have very similar shapes when scaled to the same HWHM, with the majority of fluctuations in the wing regions. The similarity of average H i line shapes suggests that the intrinsic H i profiles may not be Gaussian.

6 Conclusions

We have presented average H i spectra on spatially-resolved scales in a number of nearby dwarf galaxies from VLA-ANGST and THINGS. To produce these superprofiles, we have co-added H i line-of-sight spectra after removal of the rotational velocity for regions determined both by radius and by the local ΣSFRsubscriptΣSFR\Sigma_{\mathrm{SFR}}. Like the global superprofiles presented in Paper I, the spatially-resolved superprofiles typically exhibit a narrow central peak with higher velocity wings to either side.

As with the global superprofiles, the shape of the spatially-resolved H i superprofiles, when scaled to the same HWHM, is very similar from galaxy to galaxy. The majority of the differences in shape are in the wings of the superprofiles. The similarity in shape supports the idea discussed in Paper I that average H i profiles are non-Gaussian.

We follow the interpretation in Paper I and characterize the central peak as turbulent with a width σcentralsubscript𝜎central\sigma_{\mathrm{central}}. We interpret the higher-velocity wings as representing anomalous H i motions, and characterize their rms velocity (σwingssubscript𝜎wings\sigma_{\mathrm{wings}}) and the fraction of H i in the wings (fwingssubscript𝑓wingsf_{\mathrm{wings}}). We also measure the asymmetry of the full superprofile, afullsubscript𝑎fulla_{\mathrm{full}}. By comparing these parameters to the spatially-resolved physical properties, we have found a number of correlations.

  • σcentralsubscript𝜎central\sigma_{\mathrm{central}}: The width of the central peak shows correlations with all physical properties we have measured (ΣHIsubscriptΣHI\Sigma_{\mathrm{HI}}, ΣbaryonsubscriptΣbaryon\Sigma_{\mathrm{baryon}}, ΣSFRsubscriptΣSFR\Sigma_{\mathrm{SFR}}, and ΣSFR/ΣHIsubscriptΣSFRsubscriptΣHI\Sigma_{\mathrm{SFR}}{}/\Sigma_{\mathrm{HI}}{}). The correlations with star formation are strongly driven by the highest ΣSFRsubscriptΣSFR\Sigma_{\mathrm{SFR}} regions in our sample. At ΣSFR<103subscriptΣSFRsuperscript103\Sigma_{\mathrm{SFR}}{}<10^{-3} MsubscriptMdirect-product\mathrm{M}_{\odot} yr-1 kpc-2, H i velocity dispersions do not appear to be connected to ΣSFRsubscriptΣSFR\Sigma_{\mathrm{SFR}} and can even be as high as 10 km s-1. However, star formation does appear to set a lower threshold below which velocity dispersions cannot fall.

  • σwingssubscript𝜎wings\sigma_{\mathrm{wings}}: The rms velocity of the wings is also correlated with all physical properties we have measured. This behavior could indicate that star formation can drive surrounding H i to faster velocities, but it may also be caused by correlations between our parameters; higher σcentralsubscript𝜎central\sigma_{\mathrm{central}} values produce higher σwingssubscript𝜎wings\sigma_{\mathrm{wings}} values by definition.

  • fwingssubscript𝑓wingsf_{\mathrm{wings}}: We do not find strong correlations between fwingssubscript𝑓wingsf_{\mathrm{wings}} and physical properties, which may indicate that the wings of the H i profiles are not due to star formation but instead reflect an intrinsic H i profile shape.

  • afullsubscript𝑎fulla_{\mathrm{full}}: The asymmetry of the full superprofiles does not appear to be connected with local ISM properties, and therefore may be due to other effects, such as warps or inflowing gas.

We have also compared the energy from star formation to the H i kinetic energy in the central turbulent peak of the superprofiles over one turbulent timescale. As previously observed, the coupling efficiency must increase with radius in large dwarfs if star formation is the sole driver of H i kinematics. Similarly, the coupling efficiency between star formation energy and H i kinetic energy decreases as a function of ΣSFRsubscriptΣSFR\Sigma_{\mathrm{SFR}}. Otherwise, the efficiencies are realistic (ϵ<0.1italic-ϵ0.1\epsilon<0.1) only in regions where ΣSFR>5×10⁴subscriptΣSFR5superscript104\Sigma_{\mathrm{SFR}}{}>5\times 10^{-4} MsubscriptMdirect-product\mathrm{M}_{\odot} yr-1 kpc-2.

Star formation therefore does not appear to be the sole driver of H i kinematics in dwarf galaxies, though our data suggest that it does influence them. Star formation may also provide a lower threshold to the surrounding H i velocity dispersions. It is therefore likely that some other physical mechanism is inducing turbulent motions in regions of low star formation, or that the velocity dispersions are thermal in nature. Many of the proposed drivers of turbulence cannot function efficiently in the systems studied in this paper, but simulations of dwarf galaxies are necessary to estimate the effectiveness of other instabilities in a non-shearing, low ΣSFRsubscriptΣSFR\Sigma_{\mathrm{SFR}} regime.

We thank the referee for helpful comments that improved this paper. We thank the THINGS team for providing additional data sets used in this paper, as well as Cliff Johnson and Daniel Dale for generously allowing us to use their 3.6μ𝜇\mum point subtracted maps. The National Radio Astronomy Observatory is a facility of the National Science foundation operated under cooperative agreement by Associated Universities, Inc. Support for this work was provided by the National Science Foundation collaborative research grant “Star Formation, Feedback, and the ISM: Time Resolved Constraints from a Large VLA Survey of Nearby Galaxies,” grant number AST-0807710. This material is based on work supported by the National Science Foundation under grant No. DGE-0718124 as awarded to A.M.S.

Appendix A Robustness and Verification

We performed a number of tests in Paper I to ensure that the superprofiles do not exhibit artificial signals. In particular, we examined the effects of finite spatial resolution; finite velocity resolution; uncertainties in vpeaksubscript𝑣peakv_{\mathrm{peak}}; and noise. Of these effects, the only one whose uncertainties should not change when we move to spatially-resolved superprofiles is that for finite velocity resolution; we therefore adopt uncertainties from Paper I for this effect. For the other three effects, we perform the same tests described in Paper I on the spatially-resolved superprofiles. We discuss those tests and their results in this section.

A.1 Finite Spatial Resolution

Line widths in the central regions of galaxies can be affected by finite spatial resolution, as the velocity gradient across a single resolution element can be appreciable, leading to “beam smearing.” This affect is most problematic in massive galaxies with steeply rising rotation curves or high inclinations. In contrast, our sample is composed primarily of dwarfs with relatively small rotational velocities and shallow velocity gradients in the central regions. We therefore expect that beam smearing should not strongly influence our results, but the central regions of the more massive galaxies may be susceptible to increased effects from finite spatial resolution. As a check, we use models of NGC 2366 that includes the effects of beam smearing from Paper I. This galaxy has both a well-measured rotation curve (Oh et al., 2008) as well as a high inclination (636363). It should therefore exhibit some of the strongest effects of beam smearing in our sample.

For this test, we follow the same procedure outlined in Paper I to produce model data cubes both with and without the presence of beam smearing (“true” and “convolved,” respectively). We use two models; both have a rotational curve that mimics the observed rotation curve, with a linear rise to rflat=1.9subscript𝑟flat1.9r_{\mathrm{flat}}=1.9 kpc and vflat=60subscript𝑣flat60v_{\mathrm{flat}}=60 km s-1, as measured by Oh et al. (2008). For the first model, we assume that all line-of-sight spectra are Gaussian with an intrinsic velocity dispersion of 6 km s-1. In the second model, we again assume that all line-of-sight spectra are Gaussian. To determine the Gaussian width of a line-of-sight spectrum at a given radius, we fit an exponential to the average second moment value in radial annuli and adopt that scaling as the velocity dispersion.

Using these model cubes, we can generate superprofiles in radial bins from both the “true” and “convolved” cubes to assess the effects that beam smearing has at each radius. We show the difference between σcentralsubscript𝜎central\sigma_{\mathrm{central}} for the “convolved” and the “true” cubes in Figure 20. The upper panel shows σcentralsubscript𝜎central\sigma_{\mathrm{central}} values for the model with fixed velocity dispersion, and the lower panel shows σcentralsubscript𝜎central\sigma_{\mathrm{central}} values for the model with exponentially-declining velocity dispersion. Within each panel, the black line with filled markers represents σcentralsubscript𝜎central\sigma_{\mathrm{central}} from the “true” model in each radial bin. The dashed red line shows σcentralsubscript𝜎central\sigma_{\mathrm{central}} for the “convolved” data cube in the same radial bins. We have scaled the y𝑦y-axis to show the approximate range of σcentralsubscript𝜎central\sigma_{\mathrm{central}} measured in our sample. We find that beam smearing has a <10absent10<10% effect on the width of line profiles for the first model, and <5absent5<5% for the second model. Finite spatial resolution also does not contribute a significant fraction of flux to the wings, so σwingssubscript𝜎wings\sigma_{\mathrm{wings}} and fwingssubscript𝑓wingsf_{\mathrm{wings}} are not affected by beam smearing.

Refer to caption
Figure 20: The effects of beam smearing on radial superprofiles for a model galaxy based on NGC 2366. The upper panel shows the effects on a model data cube with 6 km s-1 intrinsic velocity dispersion, and the lower is for one with an exponentially-declining intrinsic velocity dispersion. The black solid line with filled circles shows the “true” cube, unaffected by beam smearing. The red dashed line with unfilled circles shows the “convolved” cube, which has the effects of beam smearing included. We have scaled the y𝑦y-axis to show the approximate range of measured σcentralsubscript𝜎central\sigma_{\mathrm{central}} values in our sample. At all radii, beam smearing increases σcentralsubscript𝜎central\sigma_{\mathrm{central}} by <10absent10<10%. It therefore cannot account for the larger variation of observed σcentralsubscript𝜎central\sigma_{\mathrm{central}} values.

Because a good understanding of the rotation curve is necessary to assess the detailed effects of beam smearing in this fashion, we adopt the 0.5 km s-1 uncertainty on σcentralsubscript𝜎central\sigma_{\mathrm{central}} from Paper I.

A.2 Uncertainties in vpeaksubscript𝑣peakv_{\mathrm{peak}}

The regions with the lowest ΣSFRsubscriptΣSFR\Sigma_{\mathrm{SFR}} are often in the outskirts of galaxies where H i surface densities are also lower. At low H i surface densities, individual line-of-sight spectra tend to have lower S/N𝑆𝑁S/N, therefore hindering the determination of vpeaksubscript𝑣peakv_{\mathrm{peak}}. We have repeated the test detailed in Paper I to assess the effects of vpeaksubscript𝑣peakv_{\mathrm{peak}} uncertainties on the superprofiles as a function of radius. In this test, we use the Monte Carlo assessment of vpeaksubscript𝑣peakv_{\mathrm{peak}} uncertainties for a representative sample of galaxies (NGC 2366, Sextans A, DDO 190, GR 8, and UGC 4483). For each selected pixel, we generate a fake superprofile (Sfake(v)subscript𝑆fake𝑣S_{\mathrm{fake}}(v)) by co-adding Gaussian profiles with amplitude Aisubscript𝐴𝑖A_{i} determined by the S/N𝑆𝑁S/N ratio of each pixel, offset μisubscript𝜇𝑖\mu_{i} drawn randomly from a Gaussian distribution with that pixel’s vpeaksubscript𝑣peakv_{\mathrm{peak}} uncertainty as its standard deviation, and width of σ=6𝜎6\sigma=6 km s-1:

Sfake(v)=iAiexp[12(vμi6kms1)2]subscript𝑆fake𝑣subscript𝑖subscript𝐴𝑖expdelimited-[]12superscript𝑣subscript𝜇𝑖6kmsuperscripts12S_{\mathrm{fake}}(v)=\sum_{i}A_{i}\;\mathrm{exp}\left[\frac{1}{2}\left(\frac{v-\mu_{i}}{6\;\mathrm{km\;s^{-1}}}\right)^{2}\right] (A1)

We then compare this superprofile to what would have been obtained in the absence of any vpeaksubscript𝑣peakv_{\mathrm{peak}} uncertainties. We find that the differences between the “observed” fake superprofile and the “true” fake superprofile are <2absent2<2% in all cases. Therefore, vpeaksubscript𝑣peakv_{\mathrm{peak}} uncertainties do not strongly affect the observed superprofiles, even in low S/N𝑆𝑁S/N regions; we do not include uncertainties from this effect.

A.3 Noise

The noise of the final superprofile can also influence the determined parameters. We use our estimate of noise (Equation 1) to assess the approximate uncertainties on each superprofile parameter. For this test, we assume that the measured superprofile is the true superprofile. We then add an estimate of noise to each pixel, drawn from a Gaussian distribution whose width is determined by the estimated noise of that point. For this “noisy” superprofile, we again measure the σcentralsubscript𝜎central\sigma_{\mathrm{central}}, σwingssubscript𝜎wings\sigma_{\mathrm{wings}}, fwingssubscript𝑓wingsf_{\mathrm{wings}}, and afullsubscript𝑎fulla_{\mathrm{full}} parameters. We repeat this process 10,000 times and fit a Gaussian function to the range of allowed “noisy” parameters. We adopt the width of this Gaussian as the uncertainty due to noise.

A.4 Final Parameter Uncertainties

We include effects from finite velocity resolution using the tests presented in Paper I. These uncertainties should not change when we move to spatially-resolved scales.

For each superprofile, the final uncertainty for σcentralsubscript𝜎central\sigma_{\mathrm{central}} is given by:

Δσcentral=(0.5kms1)2+(0.17kms1)2+(Δσcentral,noise)2.Δsubscript𝜎centralsuperscript0.5kmsuperscripts12superscript0.17kmsuperscripts12superscriptΔsubscript𝜎centralnoise2\Delta\sigma_{\mathrm{central}}{}=\sqrt{(0.5\;\mathrm{km\;s^{-1}})^{2}+(0.17\;\mathrm{km\;s^{-1}})^{2}+(\Delta\sigma_{\mathrm{central,noise}})^{2}}. (A2)

Here, the first term represents the uncertainty due to spatial resolution; we have adopted the more conservative uncertainty from Paper I. The second term is taken from the finite velocity resolution tests in Paper I.

The final uncertainty for σwingssubscript𝜎wings\sigma_{\mathrm{wings}} is:

Δσwings=(0.13kms1)2+(Δσwings,noise)2.Δsubscript𝜎wingssuperscript0.13kmsuperscripts12superscriptΔsubscript𝜎wingsnoise2\Delta\sigma_{\mathrm{wings}}{}=\sqrt{(0.13\;\mathrm{km\;s^{-1}})^{2}+(\Delta\sigma_{\mathrm{wings,noise}})^{2}}. (A3)

The 0.130.130.13 km s-1 uncertainty is due to the effects of finite velocity resolution from Paper I.

The final uncertainty for fwingssubscript𝑓wingsf_{\mathrm{wings}} is:

Δfwings=Δfwings,noise.Δsubscript𝑓wingsΔsubscript𝑓wingsnoise\Delta f_{\mathrm{wings}}{}=\Delta f_{\mathrm{wings,noise}}. (A4)

Neither finite spatial resolution or finite velocity resolution from Paper I affect fwingssubscript𝑓wingsf_{\mathrm{wings}} by >0.01absent0.01>0.01.

The final uncertainty for afullsubscript𝑎fulla_{\mathrm{full}} is:

Δafull=(0.003)2+(Δafull,noise)2,Δsubscript𝑎fullsuperscript0.0032superscriptΔsubscript𝑎fullnoise2\Delta a_{\mathrm{full}}{}=\sqrt{(0.003)^{2}+(\Delta a_{\mathrm{full,noise}})^{2}}, (A5)

where we have recalculated the standard deviation due to velocity resolution on ΔafullΔsubscript𝑎full\Delta a_{\mathrm{full}}{} instead of a𝑎a based on the finite velocity resolution tests from Paper I.

Appendix B Spatially-Resolved Superprofiles for the Entire Sample

In this section, we present the spatially-resolved superprofiles for the entire sample. In Appendix  B.1, we show the superprofiles derived in subregions of constant radius, and in Appendix  B.2 we show the superprofiles derived in subregions of constant ΣSFRsubscriptΣSFR\Sigma_{\mathrm{SFR}}. In both sections, the figures are ordered by decreasing galaxy Mbaryon,totsubscript𝑀baryontotM_{\mathrm{baryon,tot}}.

B.1 Radial Superprofiles

In the following pages, we present the superprofiles generated in subregions of constant radius. For a single galaxy, the figures are the same as Figures 3a - 3c. Galaxies are shown in order of decreasing Mbaryon,totsubscript𝑀baryontotM_{\mathrm{baryon,tot}}, with the exception of NGC 7993, which was previously shown in the text.
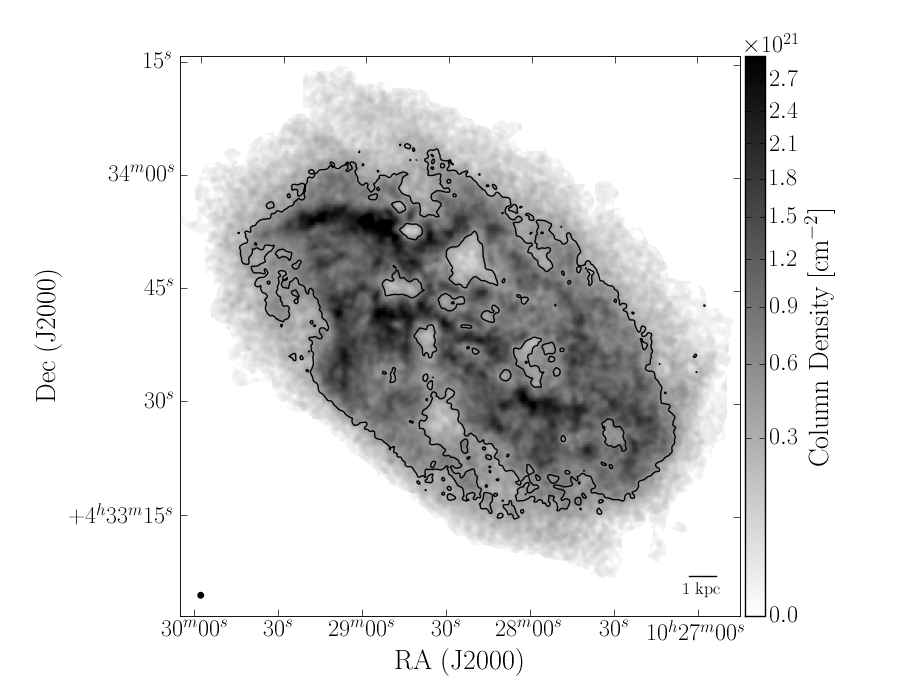
Refer to caption
Refer to caption
Figure 21a: Radial annuli in which radial superprofiles are generated for IC2574. In both panels, the background greyscale shows ΣHIsubscriptΣHI\Sigma_{\mathrm{HI}}, and the solid black line represents the S/N>5𝑆𝑁5S/N>5 threshold where we can accurately measure vpeaksubscript𝑣peakv_{\mathrm{peak}}. In the lower panel, the colored solid lines represent the average radius of each annulus, and the corresponding shaded regions of the same color indicate which pixels have contributed to each radial superprofile.
Refer to caption
Figure 21b: The radial superprofiles in IC 2574, where colors indicate the corresponding radial annuli in the previous figure. The left hand panels show the raw superprofiles (upper left) and the superprofiles normalized to the same peak flux (lower left). The right hand panels show the flux-normalized superprofiles scaled by the HWHM (upper right) and the flux-normalized superprofiles minus the model of the Gaussian core (lower right). In all panels, the solid black line represents the global superprofile. In the left panels, we have shown the HWHM-scaled Gaussian model as the dashed black line.
Refer to caption
Figure 21c: Variation of the superprofile parameters as a function of normalized radius for IC 2574. The solid dashed line shows the parameter value for the global superprofile (Paper I). The left panels show σcentralsubscript𝜎central\sigma_{\mathrm{central}} (upper) and σwingssubscript𝜎wings\sigma_{\mathrm{wings}} (lower), and the right panels show fwingssubscript𝑓wingsf_{\mathrm{wings}} (upper) and afullsubscript𝑎fulla_{\mathrm{full}} (lower).
Refer to caption
Refer to caption
Figure 22a: Radial annuli in which radial superprofiles are generated for NGC 4214. In both panels, the background greyscale shows ΣHIsubscriptΣHI\Sigma_{\mathrm{HI}}, and the solid black line represents the S/N>5𝑆𝑁5S/N>5 threshold where we can accurately measure vpeaksubscript𝑣peakv_{\mathrm{peak}}. In the lower panel, the colored solid lines represent the average radius of each annulus, and the corresponding shaded regions of the same color indicate which pixels have contributed to each radial superprofile.
Refer to caption
Figure 22b: The radial superprofiles in NGC 4214, where colors indicate the corresponding radial annuli in the previous figure. The left hand panels show the raw superprofiles (upper left) and the superprofiles normalized to the same peak flux (lower left). The right hand panels show the flux-normalized superprofiles scaled by the HWHM (upper right) and the flux-normalized superprofiles minus the model of the Gaussian core (lower right). In all panels, the solid black line represents the global superprofile. In the left panels, we have shown the HWHM-scaled Gaussian model as the dashed black line.
Refer to caption
Figure 22c: Variation of the superprofile parameters as a function of normalized radius for NGC 4214. The solid dashed line shows the parameter value for the global superprofile (Paper I). The left panels show σcentralsubscript𝜎central\sigma_{\mathrm{central}} (upper) and σwingssubscript𝜎wings\sigma_{\mathrm{wings}} (lower), and the right panels show fwingssubscript𝑓wingsf_{\mathrm{wings}} (upper) and afullsubscript𝑎fulla_{\mathrm{full}} (lower).
Refer to caption
Refer to caption
Figure 23a: Radial annuli in which radial superprofiles are generated for Ho II. In both panels, the background greyscale shows ΣHIsubscriptΣHI\Sigma_{\mathrm{HI}}, and the solid black line represents the S/N>5𝑆𝑁5S/N>5 threshold where we can accurately measure vpeaksubscript𝑣peakv_{\mathrm{peak}}. In the lower panel, the colored solid lines represent the average radius of each annulus, and the corresponding shaded regions of the same color indicate which pixels have contributed to each radial superprofile.
Refer to caption
Figure 23b: The radial superprofiles in Ho II, where colors indicate the corresponding radial annuli in the previous figure. The left hand panels show the raw superprofiles (upper left) and the superprofiles normalized to the same peak flux (lower left). The right hand panels show the flux-normalized superprofiles scaled by the HWHM (upper right) and the flux-normalized superprofiles minus the model of the Gaussian core (lower right). In all panels, the solid black line represents the global superprofile. In the left panels, we have shown the HWHM-scaled Gaussian model as the dashed black line.
Refer to caption
Figure 23c: Variation of the superprofile parameters as a function of normalized radius for Ho II. The solid dashed line shows the parameter value for the global superprofile (Paper I). The left panels show σcentralsubscript𝜎central\sigma_{\mathrm{central}} (upper) and σwingssubscript𝜎wings\sigma_{\mathrm{wings}} (lower), and the right panels show fwingssubscript𝑓wingsf_{\mathrm{wings}} (upper) and afullsubscript𝑎fulla_{\mathrm{full}} (lower).
Refer to caption
Refer to caption
Figure 24a: Radial annuli in which radial superprofiles are generated for NGC 2366. In both panels, the background greyscale shows ΣHIsubscriptΣHI\Sigma_{\mathrm{HI}}, and the solid black line represents the S/N>5𝑆𝑁5S/N>5 threshold where we can accurately measure vpeaksubscript𝑣peakv_{\mathrm{peak}}. In the lower panel, the colored solid lines represent the average radius of each annulus, and the corresponding shaded regions of the same color indicate which pixels have contributed to each radial superprofile.
Refer to caption
Figure 24b: The radial superprofiles in NGC 2366, where colors indicate the corresponding radial annuli in the previous figure. The left hand panels show the raw superprofiles (upper left) and the superprofiles normalized to the same peak flux (lower left). The right hand panels show the flux-normalized superprofiles scaled by the HWHM (upper right) and the flux-normalized superprofiles minus the model of the Gaussian core (lower right). In all panels, the solid black line represents the global superprofile. In the left panels, we have shown the HWHM-scaled Gaussian model as the dashed black line.
Refer to caption
Figure 24c: Variation of the superprofile parameters as a function of normalized radius for NGC 2366. The solid dashed line shows the parameter value for the global superprofile (Paper I). The left panels show σcentralsubscript𝜎central\sigma_{\mathrm{central}} (upper) and σwingssubscript𝜎wings\sigma_{\mathrm{wings}} (lower), and the right panels show fwingssubscript𝑓wingsf_{\mathrm{wings}} (upper) and afullsubscript𝑎fulla_{\mathrm{full}} (lower).
Refer to caption
Refer to caption
Figure 25a: Radial annuli in which radial superprofiles are generated for DDO 154. In both panels, the background greyscale shows ΣHIsubscriptΣHI\Sigma_{\mathrm{HI}}, and the solid black line represents the S/N>5𝑆𝑁5S/N>5 threshold where we can accurately measure vpeaksubscript𝑣peakv_{\mathrm{peak}}. In the lower panel, the colored solid lines represent the average radius of each annulus, and the corresponding shaded regions of the same color indicate which pixels have contributed to each radial superprofile.
Refer to caption
Figure 25b: The radial superprofiles in DDO 154, where colors indicate the corresponding radial annuli in the previous figure. The left hand panels show the raw superprofiles (upper left) and the superprofiles normalized to the same peak flux (lower left). The right hand panels show the flux-normalized superprofiles scaled by the HWHM (upper right) and the flux-normalized superprofiles minus the model of the Gaussian core (lower right). In all panels, the solid black line represents the global superprofile. In the left panels, we have shown the HWHM-scaled Gaussian model as the dashed black line.
Refer to caption
Figure 25c: Variation of the superprofile parameters as a function of normalized radius for DDO 154. The solid dashed line shows the parameter value for the global superprofile (Paper I). The left panels show σcentralsubscript𝜎central\sigma_{\mathrm{central}} (upper) and σwingssubscript𝜎wings\sigma_{\mathrm{wings}} (lower), and the right panels show fwingssubscript𝑓wingsf_{\mathrm{wings}} (upper) and afullsubscript𝑎fulla_{\mathrm{full}} (lower).
Refer to caption
Refer to caption
Figure 26a: Radial annuli in which radial superprofiles are generated for Ho I. In both panels, the background greyscale shows ΣHIsubscriptΣHI\Sigma_{\mathrm{HI}}, and the solid black line represents the S/N>5𝑆𝑁5S/N>5 threshold where we can accurately measure vpeaksubscript𝑣peakv_{\mathrm{peak}}. In the lower panel, the colored solid lines represent the average radius of each annulus, and the corresponding shaded regions of the same color indicate which pixels have contributed to each radial superprofile.
Refer to caption
Figure 26b: The radial superprofiles in Ho I, where colors indicate the corresponding radial annuli in the previous figure. The left hand panels show the raw superprofiles (upper left) and the superprofiles normalized to the same peak flux (lower left). The right hand panels show the flux-normalized superprofiles scaled by the HWHM (upper right) and the flux-normalized superprofiles minus the model of the Gaussian core (lower right). In all panels, the solid black line represents the global superprofile. In the left panels, we have shown the HWHM-scaled Gaussian model as the dashed black line.
Refer to caption
Figure 26c: Variation of the superprofile parameters as a function of normalized radius for Ho I. The solid dashed line shows the parameter value for the global superprofile (Paper I). The left panels show σcentralsubscript𝜎central\sigma_{\mathrm{central}} (upper) and σwingssubscript𝜎wings\sigma_{\mathrm{wings}} (lower), and the right panels show fwingssubscript𝑓wingsf_{\mathrm{wings}} (upper) and afullsubscript𝑎fulla_{\mathrm{full}} (lower).
Refer to caption
Refer to caption
Figure 27a: Radial annuli in which radial superprofiles are generated for NGC 4190. In both panels, the background greyscale shows ΣHIsubscriptΣHI\Sigma_{\mathrm{HI}}, and the solid black line represents the S/N>5𝑆𝑁5S/N>5 threshold where we can accurately measure vpeaksubscript𝑣peakv_{\mathrm{peak}}. In the lower panel, the colored solid lines represent the average radius of each annulus, and the corresponding shaded regions of the same color indicate which pixels have contributed to each radial superprofile.
Refer to caption
Figure 27b: The radial superprofiles in NGC 4190, where colors indicate the corresponding radial annuli in the previous figure. The left hand panels show the raw superprofiles (upper left) and the superprofiles normalized to the same peak flux (lower left). The right hand panels show the flux-normalized superprofiles scaled by the HWHM (upper right) and the flux-normalized superprofiles minus the model of the Gaussian core (lower right). In all panels, the solid black line represents the global superprofile. In the left panels, we have shown the HWHM-scaled Gaussian model as the dashed black line.
Refer to caption
Figure 27c: Variation of the superprofile parameters as a function of normalized radius for NGC 4190. The solid dashed line shows the parameter value for the global superprofile (Paper I). The left panels show σcentralsubscript𝜎central\sigma_{\mathrm{central}} (upper) and σwingssubscript𝜎wings\sigma_{\mathrm{wings}} (lower), and the right panels show fwingssubscript𝑓wingsf_{\mathrm{wings}} (upper) and afullsubscript𝑎fulla_{\mathrm{full}} (lower).
Refer to caption
Refer to caption
Figure 28a: Radial annuli in which radial superprofiles are generated for NGC 3741. In both panels, the background greyscale shows ΣHIsubscriptΣHI\Sigma_{\mathrm{HI}}, and the solid black line represents the S/N>5𝑆𝑁5S/N>5 threshold where we can accurately measure vpeaksubscript𝑣peakv_{\mathrm{peak}}. In the lower panel, the colored solid lines represent the average radius of each annulus, and the corresponding shaded regions of the same color indicate which pixels have contributed to each radial superprofile.
Refer to caption
Figure 28b: The radial superprofiles in NGC 3741, where colors indicate the corresponding radial annuli in the previous figure. The left hand panels show the raw superprofiles (upper left) and the superprofiles normalized to the same peak flux (lower left). The right hand panels show the flux-normalized superprofiles scaled by the HWHM (upper right) and the flux-normalized superprofiles minus the model of the Gaussian core (lower right). In all panels, the solid black line represents the global superprofile. In the left panels, we have shown the HWHM-scaled Gaussian model as the dashed black line.
Refer to caption
Figure 28c: Variation of the superprofile parameters as a function of normalized radius for NGC 3741. The solid dashed line shows the parameter value for the global superprofile (Paper I). The left panels show σcentralsubscript𝜎central\sigma_{\mathrm{central}} (upper) and σwingssubscript𝜎wings\sigma_{\mathrm{wings}} (lower), and the right panels show fwingssubscript𝑓wingsf_{\mathrm{wings}} (upper) and afullsubscript𝑎fulla_{\mathrm{full}} (lower).
Refer to caption
Refer to caption
Figure 29a: Radial annuli in which radial superprofiles are generated for Sextans A. In both panels, the background greyscale shows ΣHIsubscriptΣHI\Sigma_{\mathrm{HI}}, and the solid black line represents the S/N>5𝑆𝑁5S/N>5 threshold where we can accurately measure vpeaksubscript𝑣peakv_{\mathrm{peak}}. In the lower panel, the colored solid lines represent the average radius of each annulus, and the corresponding shaded regions of the same color indicate which pixels have contributed to each radial superprofile.
Refer to caption
Figure 29b: The radial superprofiles in Sextans A, where colors indicate the corresponding radial annuli in the previous figure. The left hand panels show the raw superprofiles (upper left) and the superprofiles normalized to the same peak flux (lower left). The right hand panels show the flux-normalized superprofiles scaled by the HWHM (upper right) and the flux-normalized superprofiles minus the model of the Gaussian core (lower right). In all panels, the solid black line represents the global superprofile. In the left panels, we have shown the HWHM-scaled Gaussian model as the dashed black line.
Refer to caption
Figure 29c: Variation of the superprofile parameters as a function of normalized radius for Sextans A. The solid dashed line shows the parameter value for the global superprofile (Paper I). The left panels show σcentralsubscript𝜎central\sigma_{\mathrm{central}} (upper) and σwingssubscript𝜎wings\sigma_{\mathrm{wings}} (lower), and the right panels show fwingssubscript𝑓wingsf_{\mathrm{wings}} (upper) and afullsubscript𝑎fulla_{\mathrm{full}} (lower).
Refer to caption
Refer to caption
Figure 30a: Radial annuli in which radial superprofiles are generated for DDO 53. In both panels, the background greyscale shows ΣHIsubscriptΣHI\Sigma_{\mathrm{HI}}, and the solid black line represents the S/N>5𝑆𝑁5S/N>5 threshold where we can accurately measure vpeaksubscript𝑣peakv_{\mathrm{peak}}. In the lower panel, the colored solid lines represent the average radius of each annulus, and the corresponding shaded regions of the same color indicate which pixels have contributed to each radial superprofile.
Refer to caption
Figure 30b: The radial superprofiles in DDO 53, where colors indicate the corresponding radial annuli in the previous figure. The left hand panels show the raw superprofiles (upper left) and the superprofiles normalized to the same peak flux (lower left). The right hand panels show the flux-normalized superprofiles scaled by the HWHM (upper right) and the flux-normalized superprofiles minus the model of the Gaussian core (lower right). In all panels, the solid black line represents the global superprofile. In the left panels, we have shown the HWHM-scaled Gaussian model as the dashed black line.
Refer to caption
Figure 30c: Variation of the superprofile parameters as a function of normalized radius for DDO 53. The solid dashed line shows the parameter value for the global superprofile (Paper I). The left panels show σcentralsubscript𝜎central\sigma_{\mathrm{central}} (upper) and σwingssubscript𝜎wings\sigma_{\mathrm{wings}} (lower), and the right panels show fwingssubscript𝑓wingsf_{\mathrm{wings}} (upper) and afullsubscript𝑎fulla_{\mathrm{full}} (lower).
Refer to caption
Refer to caption
Figure 31a: Radial annuli in which radial superprofiles are generated for DDO 190. In both panels, the background greyscale shows ΣHIsubscriptΣHI\Sigma_{\mathrm{HI}}, and the solid black line represents the S/N>5𝑆𝑁5S/N>5 threshold where we can accurately measure vpeaksubscript𝑣peakv_{\mathrm{peak}}. In the lower panel, the colored solid lines represent the average radius of each annulus, and the corresponding shaded regions of the same color indicate which pixels have contributed to each radial superprofile.
Refer to caption
Figure 31b: The radial superprofiles in DDO 190, where colors indicate the corresponding radial annuli in the previous figure. The left hand panels show the raw superprofiles (upper left) and the superprofiles normalized to the same peak flux (lower left). The right hand panels show the flux-normalized superprofiles scaled by the HWHM (upper right) and the flux-normalized superprofiles minus the model of the Gaussian core (lower right). In all panels, the solid black line represents the global superprofile. In the left panels, we have shown the HWHM-scaled Gaussian model as the dashed black line.
Refer to caption
Figure 31c: Variation of the superprofile parameters as a function of normalized radius for DDO 190. The solid dashed line shows the parameter value for the global superprofile (Paper I). The left panels show σcentralsubscript𝜎central\sigma_{\mathrm{central}} (upper) and σwingssubscript𝜎wings\sigma_{\mathrm{wings}} (lower), and the right panels show fwingssubscript𝑓wingsf_{\mathrm{wings}} (upper) and afullsubscript𝑎fulla_{\mathrm{full}} (lower).
Refer to caption
Refer to caption
Figure 32a: Radial annuli in which radial superprofiles are generated for Sextans B. In both panels, the background greyscale shows ΣHIsubscriptΣHI\Sigma_{\mathrm{HI}}, and the solid black line represents the S/N>5𝑆𝑁5S/N>5 threshold where we can accurately measure vpeaksubscript𝑣peakv_{\mathrm{peak}}. In the lower panel, the colored solid lines represent the average radius of each annulus, and the corresponding shaded regions of the same color indicate which pixels have contributed to each radial superprofile.
Refer to caption
Figure 32b: The radial superprofiles in Sextans B, where colors indicate the corresponding radial annuli in the previous figure. The left hand panels show the raw superprofiles (upper left) and the superprofiles normalized to the same peak flux (lower left). The right hand panels show the flux-normalized superprofiles scaled by the HWHM (upper right) and the flux-normalized superprofiles minus the model of the Gaussian core (lower right). In all panels, the solid black line represents the global superprofile. In the left panels, we have shown the HWHM-scaled Gaussian model as the dashed black line.
Refer to caption
Figure 32c: Variation of the superprofile parameters as a function of normalized radius for Sextans B. The solid dashed line shows the parameter value for the global superprofile (Paper I). The left panels show σcentralsubscript𝜎central\sigma_{\mathrm{central}} (upper) and σwingssubscript𝜎wings\sigma_{\mathrm{wings}} (lower), and the right panels show fwingssubscript𝑓wingsf_{\mathrm{wings}} (upper) and afullsubscript𝑎fulla_{\mathrm{full}} (lower).
Refer to caption
Refer to caption
Figure 33a: Radial annuli in which radial superprofiles are generated for DDO 99. In both panels, the background greyscale shows ΣHIsubscriptΣHI\Sigma_{\mathrm{HI}}, and the solid black line represents the S/N>5𝑆𝑁5S/N>5 threshold where we can accurately measure vpeaksubscript𝑣peakv_{\mathrm{peak}}. In the lower panel, the colored solid lines represent the average radius of each annulus, and the corresponding shaded regions of the same color indicate which pixels have contributed to each radial superprofile.
Refer to caption
Figure 33b: The radial superprofiles in DDO 99, where colors indicate the corresponding radial annuli in the previous figure. The left hand panels show the raw superprofiles (upper left) and the superprofiles normalized to the same peak flux (lower left). The right hand panels show the flux-normalized superprofiles scaled by the HWHM (upper right) and the flux-normalized superprofiles minus the model of the Gaussian core (lower right). In all panels, the solid black line represents the global superprofile. In the left panels, we have shown the HWHM-scaled Gaussian model as the dashed black line.
Refer to caption
Figure 33c: Variation of the superprofile parameters as a function of normalized radius for DDO 99. The solid dashed line shows the parameter value for the global superprofile (Paper I). The left panels show σcentralsubscript𝜎central\sigma_{\mathrm{central}} (upper) and σwingssubscript𝜎wings\sigma_{\mathrm{wings}} (lower), and the right panels show fwingssubscript𝑓wingsf_{\mathrm{wings}} (upper) and afullsubscript𝑎fulla_{\mathrm{full}} (lower).
Refer to caption
Refer to caption
Figure 34a: Radial annuli in which radial superprofiles are generated for UGCA 292. In both panels, the background greyscale shows ΣHIsubscriptΣHI\Sigma_{\mathrm{HI}}, and the solid black line represents the S/N>5𝑆𝑁5S/N>5 threshold where we can accurately measure vpeaksubscript𝑣peakv_{\mathrm{peak}}. In the lower panel, the colored solid lines represent the average radius of each annulus, and the corresponding shaded regions of the same color indicate which pixels have contributed to each radial superprofile.
Refer to caption
Figure 34b: The radial superprofiles in UGCA 292, where colors indicate the corresponding radial annuli in the previous figure. The left hand panels show the raw superprofiles (upper left) and the superprofiles normalized to the same peak flux (lower left). The right hand panels show the flux-normalized superprofiles scaled by the HWHM (upper right) and the flux-normalized superprofiles minus the model of the Gaussian core (lower right). In all panels, the solid black line represents the global superprofile. In the left panels, we have shown the HWHM-scaled Gaussian model as the dashed black line.
Refer to caption
Figure 34c: Variation of the superprofile parameters as a function of normalized radius for UGCA 292. The solid dashed line shows the parameter value for the global superprofile (Paper I). The left panels show σcentralsubscript𝜎central\sigma_{\mathrm{central}} (upper) and σwingssubscript𝜎wings\sigma_{\mathrm{wings}} (lower), and the right panels show fwingssubscript𝑓wingsf_{\mathrm{wings}} (upper) and afullsubscript𝑎fulla_{\mathrm{full}} (lower).
Refer to caption
Refer to caption
Figure 35a: Radial annuli in which radial superprofiles are generated for UGC 4483. In both panels, the background greyscale shows ΣHIsubscriptΣHI\Sigma_{\mathrm{HI}}, and the solid black line represents the S/N>5𝑆𝑁5S/N>5 threshold where we can accurately measure vpeaksubscript𝑣peakv_{\mathrm{peak}}. In the lower panel, the colored solid lines represent the average radius of each annulus, and the corresponding shaded regions of the same color indicate which pixels have contributed to each radial superprofile.
Refer to caption
Figure 35b: The radial superprofiles in UGC 4483, where colors indicate the corresponding radial annuli in the previous figure. The left hand panels show the raw superprofiles (upper left) and the superprofiles normalized to the same peak flux (lower left). The right hand panels show the flux-normalized superprofiles scaled by the HWHM (upper right) and the flux-normalized superprofiles minus the model of the Gaussian core (lower right). In all panels, the solid black line represents the global superprofile. In the left panels, we have shown the HWHM-scaled Gaussian model as the dashed black line.
Refer to caption
Figure 35c: Variation of the superprofile parameters as a function of normalized radius for UGC 4483. The solid dashed line shows the parameter value for the global superprofile (Paper I). The left panels show σcentralsubscript𝜎central\sigma_{\mathrm{central}} (upper) and σwingssubscript𝜎wings\sigma_{\mathrm{wings}} (lower), and the right panels show fwingssubscript𝑓wingsf_{\mathrm{wings}} (upper) and afullsubscript𝑎fulla_{\mathrm{full}} (lower).
Refer to caption
Refer to caption
Figure 36a: Radial annuli in which radial superprofiles are generated for DDO 181. In both panels, the background greyscale shows ΣHIsubscriptΣHI\Sigma_{\mathrm{HI}}, and the solid black line represents the S/N>5𝑆𝑁5S/N>5 threshold where we can accurately measure vpeaksubscript𝑣peakv_{\mathrm{peak}}. In the lower panel, the colored solid lines represent the average radius of each annulus, and the corresponding shaded regions of the same color indicate which pixels have contributed to each radial superprofile.
Refer to caption
Figure 36b: The radial superprofiles in DDO 181, where colors indicate the corresponding radial annuli in the previous figure. The left hand panels show the raw superprofiles (upper left) and the superprofiles normalized to the same peak flux (lower left). The right hand panels show the flux-normalized superprofiles scaled by the HWHM (upper right) and the flux-normalized superprofiles minus the model of the Gaussian core (lower right). In all panels, the solid black line represents the global superprofile. In the left panels, we have shown the HWHM-scaled Gaussian model as the dashed black line.
Refer to caption
Figure 36c: Variation of the superprofile parameters as a function of normalized radius for DDO 181. The solid dashed line shows the parameter value for the global superprofile (Paper I). The left panels show σcentralsubscript𝜎central\sigma_{\mathrm{central}} (upper) and σwingssubscript𝜎wings\sigma_{\mathrm{wings}} (lower), and the right panels show fwingssubscript𝑓wingsf_{\mathrm{wings}} (upper) and afullsubscript𝑎fulla_{\mathrm{full}} (lower).
Refer to caption
Refer to caption
Figure 37a: Radial annuli in which radial superprofiles are generated for UGC 8833. In both panels, the background greyscale shows ΣHIsubscriptΣHI\Sigma_{\mathrm{HI}}, and the solid black line represents the S/N>5𝑆𝑁5S/N>5 threshold where we can accurately measure vpeaksubscript𝑣peakv_{\mathrm{peak}}. In the lower panel, the colored solid lines represent the average radius of each annulus, and the corresponding shaded regions of the same color indicate which pixels have contributed to each radial superprofile.
Refer to caption
Figure 37b: The radial superprofiles in UGC 8833, where colors indicate the corresponding radial annuli in the previous figure. The left hand panels show the raw superprofiles (upper left) and the superprofiles normalized to the same peak flux (lower left). The right hand panels show the flux-normalized superprofiles scaled by the HWHM (upper right) and the flux-normalized superprofiles minus the model of the Gaussian core (lower right). In all panels, the solid black line represents the global superprofile. In the left panels, we have shown the HWHM-scaled Gaussian model as the dashed black line.
Refer to caption
Figure 37c: Variation of the superprofile parameters as a function of normalized radius for UGC 8833. The solid dashed line shows the parameter value for the global superprofile (Paper I). The left panels show σcentralsubscript𝜎central\sigma_{\mathrm{central}} (upper) and σwingssubscript𝜎wings\sigma_{\mathrm{wings}} (lower), and the right panels show fwingssubscript𝑓wingsf_{\mathrm{wings}} (upper) and afullsubscript𝑎fulla_{\mathrm{full}} (lower).
Refer to caption
Refer to caption
Figure 38a: Radial annuli in which radial superprofiles are generated for DDO 187. In both panels, the background greyscale shows ΣHIsubscriptΣHI\Sigma_{\mathrm{HI}}, and the solid black line represents the S/N>5𝑆𝑁5S/N>5 threshold where we can accurately measure vpeaksubscript𝑣peakv_{\mathrm{peak}}. In the lower panel, the colored solid lines represent the average radius of each annulus, and the corresponding shaded regions of the same color indicate which pixels have contributed to each radial superprofile.
Refer to caption
Figure 38b: The radial superprofiles in DDO 187, where colors indicate the corresponding radial annuli in the previous figure. The left hand panels show the raw superprofiles (upper left) and the superprofiles normalized to the same peak flux (lower left). The right hand panels show the flux-normalized superprofiles scaled by the HWHM (upper right) and the flux-normalized superprofiles minus the model of the Gaussian core (lower right). In all panels, the solid black line represents the global superprofile. In the left panels, we have shown the HWHM-scaled Gaussian model as the dashed black line.
Refer to caption
Figure 38c: Variation of the superprofile parameters as a function of normalized radius for DDO 187. The solid dashed line shows the parameter value for the global superprofile (Paper I). The left panels show σcentralsubscript𝜎central\sigma_{\mathrm{central}} (upper) and σwingssubscript𝜎wings\sigma_{\mathrm{wings}} (lower), and the right panels show fwingssubscript𝑓wingsf_{\mathrm{wings}} (upper) and afullsubscript𝑎fulla_{\mathrm{full}} (lower).

B.2 ΣSFRsubscriptΣSFR\Sigma_{\mathrm{SFR}} Superprofiles

In the following pages, we present the superprofiles generated in subregions of constant ΣSFRsubscriptΣSFR\Sigma_{\mathrm{SFR}}. For a single galaxy, the figures are the same as Figures 6a and 6c. Galaxies are shown in order of decreasing Mbaryon,totsubscript𝑀baryontotM_{\mathrm{baryon,tot}}, with the exception of NGC 7993, which was previously shown in the text.
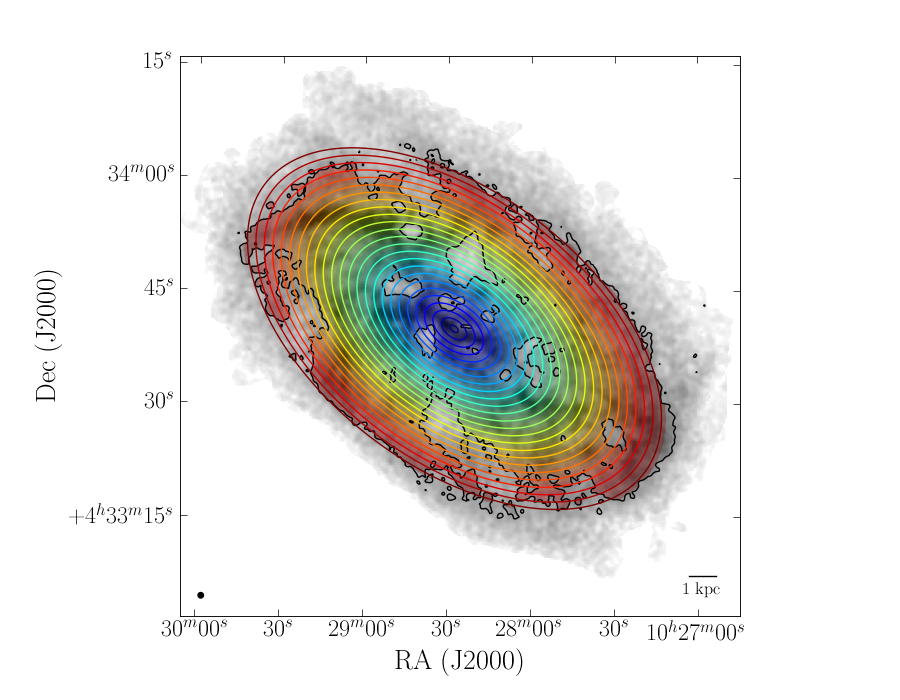
Refer to caption
Refer to caption
Figure 39a: Subregions in which ΣSFRsubscriptΣSFR\Sigma_{\mathrm{SFR}} superprofiles are generated for IC2574. In both panels, the background greyscale shows ΣSFRsubscriptΣSFR\Sigma_{\mathrm{SFR}}, and the solid black line represents the S/N>5𝑆𝑁5S/N>5 threshold where we can accurately measure vpeaksubscript𝑣peakv_{\mathrm{peak}}. In the lower panel, the colored regions show which pixels have contributed to each ΣSFRsubscriptΣSFR\Sigma_{\mathrm{SFR}} superprofile.
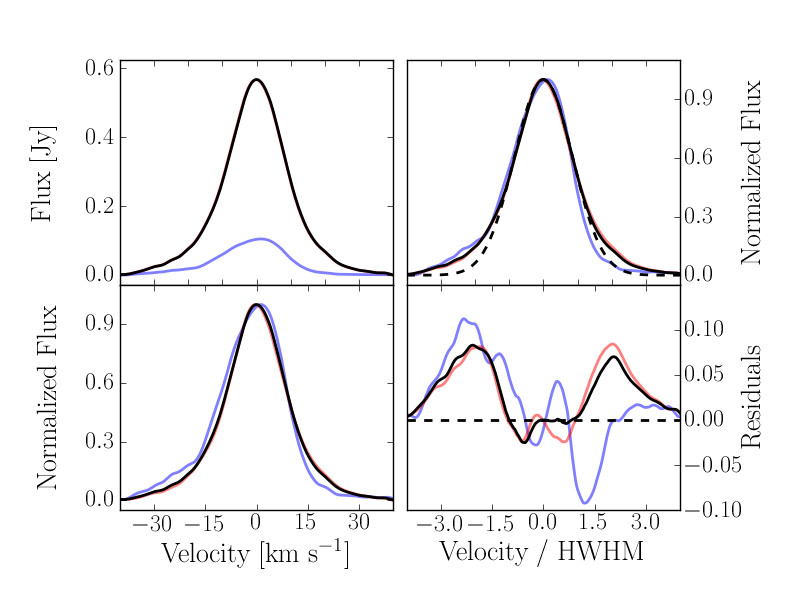
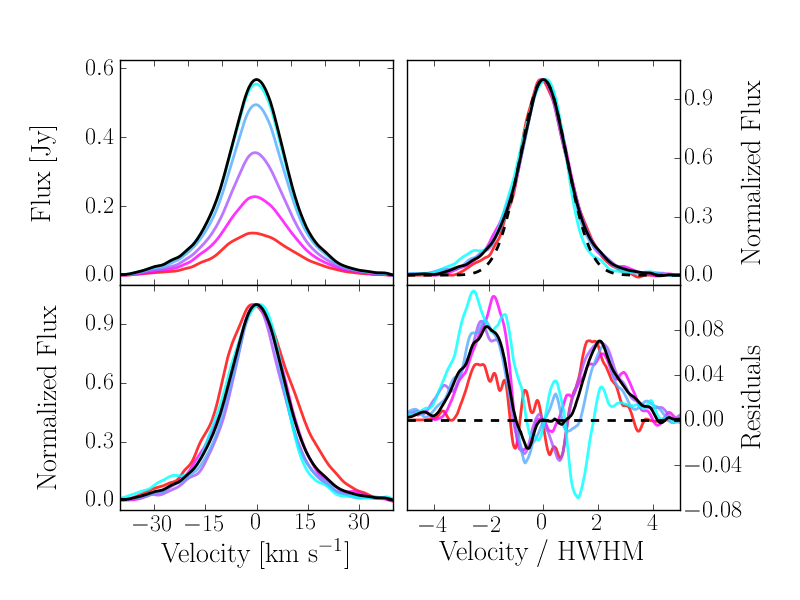
Refer to caption
Figure 39b: The ΣSFRsubscriptΣSFR\Sigma_{\mathrm{SFR}} superprofiles in IC 2574, where colors indicate the corresponding ΣSFRsubscriptΣSFR\Sigma_{\mathrm{SFR}} regions in the previous figure. The left hand panels show the raw superprofiles (upper left) and the superprofiles normalized to the same peak flux (lower left). The right hand panels show the flux-normalized superprofiles scaled by the HWHM (upper right) and the flux-normalized superprofiles minus the model of the Gaussian core (lower right). In all panels, the solid black line represents the global superprofile. In the left panels, we have shown the HWHM-scaled Gaussian model as the dashed black line.
Refer to caption
Figure 39c: Variation of the superprofile parameters as a function of ΣSFRsubscriptΣSFR\Sigma_{\mathrm{SFR}} for IC 2574. The solid dashed line shows the parameter value for the global superprofile (Paper I). The left panels show σcentralsubscript𝜎central\sigma_{\mathrm{central}} (upper) and σwingssubscript𝜎wings\sigma_{\mathrm{wings}} (lower), and the right panels show fwingssubscript𝑓wingsf_{\mathrm{wings}} (upper) and afullsubscript𝑎fulla_{\mathrm{full}} (lower).
Refer to caption
Refer to caption
Figure 40a: ΣSFRsubscriptΣSFR\Sigma_{\mathrm{SFR}} regions in which radial superprofiles are generated for NGC 4214. In both panels, the background greyscale shows ΣSFRsubscriptΣSFR\Sigma_{\mathrm{SFR}}, and the solid black line represents the S/N>5𝑆𝑁5S/N>5 threshold where we can accurately measure vpeaksubscript𝑣peakv_{\mathrm{peak}}. In the lower panel, the colored regions show which pixels have contributed to each ΣSFRsubscriptΣSFR\Sigma_{\mathrm{SFR}} superprofile.
Refer to caption
Figure 40b: The ΣSFRsubscriptΣSFR\Sigma_{\mathrm{SFR}} superprofiles in NGC 4214, where colors indicate the corresponding ΣSFRsubscriptΣSFR\Sigma_{\mathrm{SFR}} regions in the previous figure. The left hand panels show the raw superprofiles (upper left) and the superprofiles normalized to the same peak flux (lower left). The right hand panels show the flux-normalized superprofiles scaled by the HWHM (upper right) and the flux-normalized superprofiles minus the model of the Gaussian core (lower right). In all panels, the solid black line represents the global superprofile. In the left panels, we have shown the HWHM-scaled Gaussian model as the dashed black line.
Refer to caption
Figure 40c: Variation of the superprofile parameters as a function of ΣSFRsubscriptΣSFR\Sigma_{\mathrm{SFR}} for NGC 4214. The solid dashed line shows the parameter value for the global superprofile (Paper I). The left panels show σcentralsubscript𝜎central\sigma_{\mathrm{central}} (upper) and σwingssubscript𝜎wings\sigma_{\mathrm{wings}} (lower), and the right panels show fwingssubscript𝑓wingsf_{\mathrm{wings}} (upper) and afullsubscript𝑎fulla_{\mathrm{full}} (lower).
Refer to caption
Refer to caption
Figure 41a: Subregions in which ΣSFRsubscriptΣSFR\Sigma_{\mathrm{SFR}} superprofiles are generated for Ho II. In both panels, the background greyscale shows ΣSFRsubscriptΣSFR\Sigma_{\mathrm{SFR}}, and the solid black line represents the S/N>5𝑆𝑁5S/N>5 threshold where we can accurately measure vpeaksubscript𝑣peakv_{\mathrm{peak}}. In the lower panel, the colored regions show which pixels have contributed to each ΣSFRsubscriptΣSFR\Sigma_{\mathrm{SFR}} superprofile.
Refer to caption
Figure 41b: The ΣSFRsubscriptΣSFR\Sigma_{\mathrm{SFR}} superprofiles in Ho II, where colors indicate the corresponding ΣSFRsubscriptΣSFR\Sigma_{\mathrm{SFR}} regions in the previous figure. The left hand panels show the raw superprofiles (upper left) and the superprofiles normalized to the same peak flux (lower left). The right hand panels show the flux-normalized superprofiles scaled by the HWHM (upper right) and the flux-normalized superprofiles minus the model of the Gaussian core (lower right). In all panels, the solid black line represents the global superprofile. In the left panels, we have shown the HWHM-scaled Gaussian model as the dashed black line.
Refer to caption
Figure 41c: Variation of the superprofile parameters as a function of ΣSFRsubscriptΣSFR\Sigma_{\mathrm{SFR}} for Ho II. The solid dashed line shows the parameter value for the global superprofile (Paper I). The left panels show σcentralsubscript𝜎central\sigma_{\mathrm{central}} (upper) and σwingssubscript𝜎wings\sigma_{\mathrm{wings}} (lower), and the right panels show fwingssubscript𝑓wingsf_{\mathrm{wings}} (upper) and afullsubscript𝑎fulla_{\mathrm{full}} (lower).
Refer to caption
Refer to caption
Figure 42a: Subregions in which ΣSFRsubscriptΣSFR\Sigma_{\mathrm{SFR}} superprofiles are generated for NGC 2366. In both panels, the background greyscale shows ΣSFRsubscriptΣSFR\Sigma_{\mathrm{SFR}}, and the solid black line represents the S/N>5𝑆𝑁5S/N>5 threshold where we can accurately measure vpeaksubscript𝑣peakv_{\mathrm{peak}}. In the lower panel, the colored regions show which pixels have contributed to each ΣSFRsubscriptΣSFR\Sigma_{\mathrm{SFR}} superprofile.
Refer to caption
Figure 42b: The ΣSFRsubscriptΣSFR\Sigma_{\mathrm{SFR}} superprofiles in NGC 2366, where colors indicate the corresponding ΣSFRsubscriptΣSFR\Sigma_{\mathrm{SFR}} regions in the previous figure. The left hand panels show the raw superprofiles (upper left) and the superprofiles normalized to the same peak flux (lower left). The right hand panels show the flux-normalized superprofiles scaled by the HWHM (upper right) and the flux-normalized superprofiles minus the model of the Gaussian core (lower right). In all panels, the solid black line represents the global superprofile. In the left panels, we have shown the HWHM-scaled Gaussian model as the dashed black line.
Refer to caption
Figure 42c: Variation of the superprofile parameters as a function of ΣSFRsubscriptΣSFR\Sigma_{\mathrm{SFR}} for NGC 2366. The solid dashed line shows the parameter value for the global superprofile (Paper I). The left panels show σcentralsubscript𝜎central\sigma_{\mathrm{central}} (upper) and σwingssubscript𝜎wings\sigma_{\mathrm{wings}} (lower), and the right panels show fwingssubscript𝑓wingsf_{\mathrm{wings}} (upper) and afullsubscript𝑎fulla_{\mathrm{full}} (lower).
Refer to caption
Refer to caption
Figure 43a: Subregions in which ΣSFRsubscriptΣSFR\Sigma_{\mathrm{SFR}} superprofiles are generated for DDO 154. In both panels, the background greyscale shows ΣSFRsubscriptΣSFR\Sigma_{\mathrm{SFR}}, and the solid black line represents the S/N>5𝑆𝑁5S/N>5 threshold where we can accurately measure vpeaksubscript𝑣peakv_{\mathrm{peak}}. In the lower panel, the colored regions show which pixels have contributed to each ΣSFRsubscriptΣSFR\Sigma_{\mathrm{SFR}} superprofile.
Refer to caption
Figure 43b: The ΣSFRsubscriptΣSFR\Sigma_{\mathrm{SFR}} superprofiles in DDO 154, where colors indicate the corresponding ΣSFRsubscriptΣSFR\Sigma_{\mathrm{SFR}} regions in the previous figure. The left hand panels show the raw superprofiles (upper left) and the superprofiles normalized to the same peak flux (lower left). The right hand panels show the flux-normalized superprofiles scaled by the HWHM (upper right) and the flux-normalized superprofiles minus the model of the Gaussian core (lower right). In all panels, the solid black line represents the global superprofile. In the left panels, we have shown the HWHM-scaled Gaussian model as the dashed black line.
Refer to caption
Figure 43c: Variation of the superprofile parameters as a function of ΣSFRsubscriptΣSFR\Sigma_{\mathrm{SFR}} for DDO 154. The solid dashed line shows the parameter value for the global superprofile (Paper I). The left panels show σcentralsubscript𝜎central\sigma_{\mathrm{central}} (upper) and σwingssubscript𝜎wings\sigma_{\mathrm{wings}} (lower), and the right panels show fwingssubscript𝑓wingsf_{\mathrm{wings}} (upper) and afullsubscript𝑎fulla_{\mathrm{full}} (lower).
Refer to caption
Refer to caption
Figure 44a: Subregions in which ΣSFRsubscriptΣSFR\Sigma_{\mathrm{SFR}} superprofiles are generated for Ho I. In both panels, the background greyscale shows ΣSFRsubscriptΣSFR\Sigma_{\mathrm{SFR}}, and the solid black line represents the S/N>5𝑆𝑁5S/N>5 threshold where we can accurately measure vpeaksubscript𝑣peakv_{\mathrm{peak}}. In the lower panel, the colored regions show which pixels have contributed to each ΣSFRsubscriptΣSFR\Sigma_{\mathrm{SFR}} superprofile.
Refer to caption
Figure 44b: The ΣSFRsubscriptΣSFR\Sigma_{\mathrm{SFR}} superprofiles in Ho I, where colors indicate the corresponding ΣSFRsubscriptΣSFR\Sigma_{\mathrm{SFR}} regions in the previous figure. The left hand panels show the raw superprofiles (upper left) and the superprofiles normalized to the same peak flux (lower left). The right hand panels show the flux-normalized superprofiles scaled by the HWHM (upper right) and the flux-normalized superprofiles minus the model of the Gaussian core (lower right). In all panels, the solid black line represents the global superprofile. In the left panels, we have shown the HWHM-scaled Gaussian model as the dashed black line.
Refer to caption
Figure 44c: Variation of the superprofile parameters as a function of ΣSFRsubscriptΣSFR\Sigma_{\mathrm{SFR}} for Ho I. The solid dashed line shows the parameter value for the global superprofile (Paper I). The left panels show σcentralsubscript𝜎central\sigma_{\mathrm{central}} (upper) and σwingssubscript𝜎wings\sigma_{\mathrm{wings}} (lower), and the right panels show fwingssubscript𝑓wingsf_{\mathrm{wings}} (upper) and afullsubscript𝑎fulla_{\mathrm{full}} (lower).
Refer to caption
Refer to caption
Figure 45a: Subregions in which ΣSFRsubscriptΣSFR\Sigma_{\mathrm{SFR}} superprofiles are generated for NGC 4190. In both panels, the background greyscale shows ΣSFRsubscriptΣSFR\Sigma_{\mathrm{SFR}}, and the solid black line represents the S/N>5𝑆𝑁5S/N>5 threshold where we can accurately measure vpeaksubscript𝑣peakv_{\mathrm{peak}}. In the lower panel, the colored regions show which pixels have contributed to each ΣSFRsubscriptΣSFR\Sigma_{\mathrm{SFR}} superprofile.
Refer to caption
Figure 45b: The ΣSFRsubscriptΣSFR\Sigma_{\mathrm{SFR}} superprofiles in NGC 4190, where colors indicate the corresponding ΣSFRsubscriptΣSFR\Sigma_{\mathrm{SFR}} regions in the previous figure. The left hand panels show the raw superprofiles (upper left) and the superprofiles normalized to the same peak flux (lower left). The right hand panels show the flux-normalized superprofiles scaled by the HWHM (upper right) and the flux-normalized superprofiles minus the model of the Gaussian core (lower right). In all panels, the solid black line represents the global superprofile. In the left panels, we have shown the HWHM-scaled Gaussian model as the dashed black line.
Refer to caption
Figure 45c: Variation of the superprofile parameters as a function of ΣSFRsubscriptΣSFR\Sigma_{\mathrm{SFR}} for NGC 4190. The solid dashed line shows the parameter value for the global superprofile (Paper I). The left panels show σcentralsubscript𝜎central\sigma_{\mathrm{central}} (upper) and σwingssubscript𝜎wings\sigma_{\mathrm{wings}} (lower), and the right panels show fwingssubscript𝑓wingsf_{\mathrm{wings}} (upper) and afullsubscript𝑎fulla_{\mathrm{full}} (lower).
Refer to caption
Refer to caption
Figure 46a: Subregions in which ΣSFRsubscriptΣSFR\Sigma_{\mathrm{SFR}} superprofiles are generated for NGC 3741. In both panels, the background greyscale shows ΣSFRsubscriptΣSFR\Sigma_{\mathrm{SFR}}, and the solid black line represents the S/N>5𝑆𝑁5S/N>5 threshold where we can accurately measure vpeaksubscript𝑣peakv_{\mathrm{peak}}. In the lower panel, the colored regions show which pixels have contributed to each ΣSFRsubscriptΣSFR\Sigma_{\mathrm{SFR}} superprofile.
Refer to caption
Figure 46b: The ΣSFRsubscriptΣSFR\Sigma_{\mathrm{SFR}} superprofiles in NGC 3741, where colors indicate the corresponding ΣSFRsubscriptΣSFR\Sigma_{\mathrm{SFR}} regions in the previous figure. The left hand panels show the raw superprofiles (upper left) and the superprofiles normalized to the same peak flux (lower left). The right hand panels show the flux-normalized superprofiles scaled by the HWHM (upper right) and the flux-normalized superprofiles minus the model of the Gaussian core (lower right). In all panels, the solid black line represents the global superprofile. In the left panels, we have shown the HWHM-scaled Gaussian model as the dashed black line.
Refer to caption
Figure 46c: Variation of the superprofile parameters as a function of ΣSFRsubscriptΣSFR\Sigma_{\mathrm{SFR}} for NGC 3741. The solid dashed line shows the parameter value for the global superprofile (Paper I). The left panels show σcentralsubscript𝜎central\sigma_{\mathrm{central}} (upper) and σwingssubscript𝜎wings\sigma_{\mathrm{wings}} (lower), and the right panels show fwingssubscript𝑓wingsf_{\mathrm{wings}} (upper) and afullsubscript𝑎fulla_{\mathrm{full}} (lower).
Refer to caption
Refer to caption
Figure 47a: Subregions in which ΣSFRsubscriptΣSFR\Sigma_{\mathrm{SFR}} superprofiles are generated for Sextans A. In both panels, the background greyscale shows ΣSFRsubscriptΣSFR\Sigma_{\mathrm{SFR}}, and the solid black line represents the S/N>5𝑆𝑁5S/N>5 threshold where we can accurately measure vpeaksubscript𝑣peakv_{\mathrm{peak}}. In the lower panel, the colored regions show which pixels have contributed to each ΣSFRsubscriptΣSFR\Sigma_{\mathrm{SFR}} superprofile.
Refer to caption
Figure 47b: The ΣSFRsubscriptΣSFR\Sigma_{\mathrm{SFR}} superprofiles in Sextans A, where colors indicate the corresponding ΣSFRsubscriptΣSFR\Sigma_{\mathrm{SFR}} regions in the previous figure. The left hand panels show the raw superprofiles (upper left) and the superprofiles normalized to the same peak flux (lower left). The right hand panels show the flux-normalized superprofiles scaled by the HWHM (upper right) and the flux-normalized superprofiles minus the model of the Gaussian core (lower right). In all panels, the solid black line represents the global superprofile. In the left panels, we have shown the HWHM-scaled Gaussian model as the dashed black line.
Refer to caption
Figure 47c: Variation of the superprofile parameters as a function of ΣSFRsubscriptΣSFR\Sigma_{\mathrm{SFR}} for Sextans A. The solid dashed line shows the parameter value for the global superprofile (Paper I). The left panels show σcentralsubscript𝜎central\sigma_{\mathrm{central}} (upper) and σwingssubscript𝜎wings\sigma_{\mathrm{wings}} (lower), and the right panels show fwingssubscript𝑓wingsf_{\mathrm{wings}} (upper) and afullsubscript𝑎fulla_{\mathrm{full}} (lower).
Refer to caption
Refer to caption
Figure 48a: Subregions in which ΣSFRsubscriptΣSFR\Sigma_{\mathrm{SFR}} superprofiles are generated for DDO 53. In both panels, the background greyscale shows ΣSFRsubscriptΣSFR\Sigma_{\mathrm{SFR}}, and the solid black line represents the S/N>5𝑆𝑁5S/N>5 threshold where we can accurately measure vpeaksubscript𝑣peakv_{\mathrm{peak}}. In the lower panel, the colored regions show which pixels have contributed to each ΣSFRsubscriptΣSFR\Sigma_{\mathrm{SFR}} superprofile.
Refer to caption
Figure 48b: The ΣSFRsubscriptΣSFR\Sigma_{\mathrm{SFR}} superprofiles in DDO 53, where colors indicate the corresponding ΣSFRsubscriptΣSFR\Sigma_{\mathrm{SFR}} regions in the previous figure. The left hand panels show the raw superprofiles (upper left) and the superprofiles normalized to the same peak flux (lower left). The right hand panels show the flux-normalized superprofiles scaled by the HWHM (upper right) and the flux-normalized superprofiles minus the model of the Gaussian core (lower right). In all panels, the solid black line represents the global superprofile. In the left panels, we have shown the HWHM-scaled Gaussian model as the dashed black line.
Refer to caption
Figure 48c: Variation of the superprofile parameters as a function of ΣSFRsubscriptΣSFR\Sigma_{\mathrm{SFR}} for DDO 53. The solid dashed line shows the parameter value for the global superprofile (Paper I). The left panels show σcentralsubscript𝜎central\sigma_{\mathrm{central}} (upper) and σwingssubscript𝜎wings\sigma_{\mathrm{wings}} (lower), and the right panels show fwingssubscript𝑓wingsf_{\mathrm{wings}} (upper) and afullsubscript𝑎fulla_{\mathrm{full}} (lower).
Refer to caption
Refer to caption
Figure 49a: Subregions in which ΣSFRsubscriptΣSFR\Sigma_{\mathrm{SFR}} superprofiles are generated for DDO 190. In both panels, the background greyscale shows ΣSFRsubscriptΣSFR\Sigma_{\mathrm{SFR}}, and the solid black line represents the S/N>5𝑆𝑁5S/N>5 threshold where we can accurately measure vpeaksubscript𝑣peakv_{\mathrm{peak}}. In the lower panel, the colored regions show which pixels have contributed to each ΣSFRsubscriptΣSFR\Sigma_{\mathrm{SFR}} superprofile.
Refer to caption
Figure 49b: The ΣSFRsubscriptΣSFR\Sigma_{\mathrm{SFR}} superprofiles in DDO 190, where colors indicate the corresponding ΣSFRsubscriptΣSFR\Sigma_{\mathrm{SFR}} regions in the previous figure. The left hand panels show the raw superprofiles (upper left) and the superprofiles normalized to the same peak flux (lower left). The right hand panels show the flux-normalized superprofiles scaled by the HWHM (upper right) and the flux-normalized superprofiles minus the model of the Gaussian core (lower right). In all panels, the solid black line represents the global superprofile. In the left panels, we have shown the HWHM-scaled Gaussian model as the dashed black line.
Refer to caption
Figure 49c: Variation of the superprofile parameters as a function of ΣSFRsubscriptΣSFR\Sigma_{\mathrm{SFR}} for DDO 190. The solid dashed line shows the parameter value for the global superprofile (Paper I). The left panels show σcentralsubscript𝜎central\sigma_{\mathrm{central}} (upper) and σwingssubscript𝜎wings\sigma_{\mathrm{wings}} (lower), and the right panels show fwingssubscript𝑓wingsf_{\mathrm{wings}} (upper) and afullsubscript𝑎fulla_{\mathrm{full}} (lower).
Refer to caption
Refer to caption
Figure 50a: Subregions in which ΣSFRsubscriptΣSFR\Sigma_{\mathrm{SFR}} superprofiles are generated for Sextans B. In both panels, the background greyscale shows ΣSFRsubscriptΣSFR\Sigma_{\mathrm{SFR}}, and the solid black line represents the S/N>5𝑆𝑁5S/N>5 threshold where we can accurately measure vpeaksubscript𝑣peakv_{\mathrm{peak}}. In the lower panel, the colored regions show which pixels have contributed to each ΣSFRsubscriptΣSFR\Sigma_{\mathrm{SFR}} superprofile.
Refer to caption
Figure 50b: The ΣSFRsubscriptΣSFR\Sigma_{\mathrm{SFR}} superprofiles in Sextans B, where colors indicate the corresponding ΣSFRsubscriptΣSFR\Sigma_{\mathrm{SFR}} regions in the previous figure. The left hand panels show the raw superprofiles (upper left) and the superprofiles normalized to the same peak flux (lower left). The right hand panels show the flux-normalized superprofiles scaled by the HWHM (upper right) and the flux-normalized superprofiles minus the model of the Gaussian core (lower right). In all panels, the solid black line represents the global superprofile. In the left panels, we have shown the HWHM-scaled Gaussian model as the dashed black line.
Refer to caption
Figure 50c: Variation of the superprofile parameters as a function of ΣSFRsubscriptΣSFR\Sigma_{\mathrm{SFR}} for Sextans B. The solid dashed line shows the parameter value for the global superprofile (Paper I). The left panels show σcentralsubscript𝜎central\sigma_{\mathrm{central}} (upper) and σwingssubscript𝜎wings\sigma_{\mathrm{wings}} (lower), and the right panels show fwingssubscript𝑓wingsf_{\mathrm{wings}} (upper) and afullsubscript𝑎fulla_{\mathrm{full}} (lower).
Refer to caption
Refer to caption
Figure 51a: Subregions in which ΣSFRsubscriptΣSFR\Sigma_{\mathrm{SFR}} superprofiles are generated for DDO 99. In both panels, the background greyscale shows ΣSFRsubscriptΣSFR\Sigma_{\mathrm{SFR}}, and the solid black line represents the S/N>5𝑆𝑁5S/N>5 threshold where we can accurately measure vpeaksubscript𝑣peakv_{\mathrm{peak}}. In the lower panel, the colored regions show which pixels have contributed to each ΣSFRsubscriptΣSFR\Sigma_{\mathrm{SFR}} superprofile.
Refer to caption
Figure 51b: The ΣSFRsubscriptΣSFR\Sigma_{\mathrm{SFR}} superprofiles in DDO 99, where colors indicate the corresponding ΣSFRsubscriptΣSFR\Sigma_{\mathrm{SFR}} regions in the previous figure. The left hand panels show the raw superprofiles (upper left) and the superprofiles normalized to the same peak flux (lower left). The right hand panels show the flux-normalized superprofiles scaled by the HWHM (upper right) and the flux-normalized superprofiles minus the model of the Gaussian core (lower right). In all panels, the solid black line represents the global superprofile. In the left panels, we have shown the HWHM-scaled Gaussian model as the dashed black line.
Refer to caption
Figure 51c: Variation of the superprofile parameters as a function of ΣSFRsubscriptΣSFR\Sigma_{\mathrm{SFR}} for DDO 99. The solid dashed line shows the parameter value for the global superprofile (Paper I). The left panels show σcentralsubscript𝜎central\sigma_{\mathrm{central}} (upper) and σwingssubscript𝜎wings\sigma_{\mathrm{wings}} (lower), and the right panels show fwingssubscript𝑓wingsf_{\mathrm{wings}} (upper) and afullsubscript𝑎fulla_{\mathrm{full}} (lower).
Refer to caption
Refer to caption
Figure 52a: Subregions in which ΣSFRsubscriptΣSFR\Sigma_{\mathrm{SFR}} superprofiles are generated for UGCA 292. In both panels, the background greyscale shows ΣSFRsubscriptΣSFR\Sigma_{\mathrm{SFR}}, and the solid black line represents the S/N>5𝑆𝑁5S/N>5 threshold where we can accurately measure vpeaksubscript𝑣peakv_{\mathrm{peak}}. In the lower panel, the colored regions show which pixels have contributed to each ΣSFRsubscriptΣSFR\Sigma_{\mathrm{SFR}} superprofile.
Refer to caption
Figure 52b: The ΣSFRsubscriptΣSFR\Sigma_{\mathrm{SFR}} superprofiles in UGCA 292, where colors indicate the corresponding ΣSFRsubscriptΣSFR\Sigma_{\mathrm{SFR}} regions in the previous figure. The left hand panels show the raw superprofiles (upper left) and the superprofiles normalized to the same peak flux (lower left). The right hand panels show the flux-normalized superprofiles scaled by the HWHM (upper right) and the flux-normalized superprofiles minus the model of the Gaussian core (lower right). In all panels, the solid black line represents the global superprofile. In the left panels, we have shown the HWHM-scaled Gaussian model as the dashed black line.
Refer to caption
Figure 52c: Variation of the superprofile parameters as a function of ΣSFRsubscriptΣSFR\Sigma_{\mathrm{SFR}} for UGCA 292. The solid dashed line shows the parameter value for the global superprofile (Paper I). The left panels show σcentralsubscript𝜎central\sigma_{\mathrm{central}} (upper) and σwingssubscript𝜎wings\sigma_{\mathrm{wings}} (lower), and the right panels show fwingssubscript𝑓wingsf_{\mathrm{wings}} (upper) and afullsubscript𝑎fulla_{\mathrm{full}} (lower).
Refer to caption
Refer to caption
Figure 53a: Subregions in which ΣSFRsubscriptΣSFR\Sigma_{\mathrm{SFR}} superprofiles are generated for UGC 4483. In both panels, the background greyscale shows ΣSFRsubscriptΣSFR\Sigma_{\mathrm{SFR}}, and the solid black line represents the S/N>5𝑆𝑁5S/N>5 threshold where we can accurately measure vpeaksubscript𝑣peakv_{\mathrm{peak}}. In the lower panel, the colored regions show which pixels have contributed to each ΣSFRsubscriptΣSFR\Sigma_{\mathrm{SFR}} superprofile.
Refer to caption
Figure 53b: The ΣSFRsubscriptΣSFR\Sigma_{\mathrm{SFR}} superprofiles in UGC 4483, where colors indicate the corresponding ΣSFRsubscriptΣSFR\Sigma_{\mathrm{SFR}} regions in the previous figure. The left hand panels show the raw superprofiles (upper left) and the superprofiles normalized to the same peak flux (lower left). The right hand panels show the flux-normalized superprofiles scaled by the HWHM (upper right) and the flux-normalized superprofiles minus the model of the Gaussian core (lower right). In all panels, the solid black line represents the global superprofile. In the left panels, we have shown the HWHM-scaled Gaussian model as the dashed black line.
Refer to caption
Figure 53c: Variation of the superprofile parameters as a function of ΣSFRsubscriptΣSFR\Sigma_{\mathrm{SFR}} for UGC 4483. The solid dashed line shows the parameter value for the global superprofile (Paper I). The left panels show σcentralsubscript𝜎central\sigma_{\mathrm{central}} (upper) and σwingssubscript𝜎wings\sigma_{\mathrm{wings}} (lower), and the right panels show fwingssubscript𝑓wingsf_{\mathrm{wings}} (upper) and afullsubscript𝑎fulla_{\mathrm{full}} (lower).
Refer to caption
Refer to caption
Figure 54a: Subregions in which ΣSFRsubscriptΣSFR\Sigma_{\mathrm{SFR}} superprofiles are generated for DDO 181. In both panels, the background greyscale shows ΣSFRsubscriptΣSFR\Sigma_{\mathrm{SFR}}, and the solid black line represents the S/N>5𝑆𝑁5S/N>5 threshold where we can accurately measure vpeaksubscript𝑣peakv_{\mathrm{peak}}. In the lower panel, the colored regions show which pixels have contributed to each ΣSFRsubscriptΣSFR\Sigma_{\mathrm{SFR}} superprofile.
Refer to caption
Figure 54b: The ΣSFRsubscriptΣSFR\Sigma_{\mathrm{SFR}} superprofiles in DDO 181, where colors indicate the corresponding ΣSFRsubscriptΣSFR\Sigma_{\mathrm{SFR}} regions in the previous figure. The left hand panels show the raw superprofiles (upper left) and the superprofiles normalized to the same peak flux (lower left). The right hand panels show the flux-normalized superprofiles scaled by the HWHM (upper right) and the flux-normalized superprofiles minus the model of the Gaussian core (lower right). In all panels, the solid black line represents the global superprofile. In the left panels, we have shown the HWHM-scaled Gaussian model as the dashed black line.
Refer to caption
Figure 54c: Variation of the superprofile parameters as a function of ΣSFRsubscriptΣSFR\Sigma_{\mathrm{SFR}} for DDO 181. The solid dashed line shows the parameter value for the global superprofile (Paper I). The left panels show σcentralsubscript𝜎central\sigma_{\mathrm{central}} (upper) and σwingssubscript𝜎wings\sigma_{\mathrm{wings}} (lower), and the right panels show fwingssubscript𝑓wingsf_{\mathrm{wings}} (upper) and afullsubscript𝑎fulla_{\mathrm{full}} (lower).
Refer to caption
Refer to caption
Figure 55a: Subregions in which ΣSFRsubscriptΣSFR\Sigma_{\mathrm{SFR}} superprofiles are generated for UGC 8833. In both panels, the background greyscale shows ΣSFRsubscriptΣSFR\Sigma_{\mathrm{SFR}}, and the solid black line represents the S/N>5𝑆𝑁5S/N>5 threshold where we can accurately measure vpeaksubscript𝑣peakv_{\mathrm{peak}}. In the lower panel, the colored regions show which pixels have contributed to each ΣSFRsubscriptΣSFR\Sigma_{\mathrm{SFR}} superprofile.
Refer to caption
Figure 55b: The ΣSFRsubscriptΣSFR\Sigma_{\mathrm{SFR}} superprofiles in UGC 8833, where colors indicate the corresponding ΣSFRsubscriptΣSFR\Sigma_{\mathrm{SFR}} regions in the previous figure. The left hand panels show the raw superprofiles (upper left) and the superprofiles normalized to the same peak flux (lower left). The right hand panels show the flux-normalized superprofiles scaled by the HWHM (upper right) and the flux-normalized superprofiles minus the model of the Gaussian core (lower right). In all panels, the solid black line represents the global superprofile. In the left panels, we have shown the HWHM-scaled Gaussian model as the dashed black line.
Refer to caption
Figure 55c: Variation of the superprofile parameters as a function of ΣSFRsubscriptΣSFR\Sigma_{\mathrm{SFR}} for UGC 8833. The solid dashed line shows the parameter value for the global superprofile (Paper I). The left panels show σcentralsubscript𝜎central\sigma_{\mathrm{central}} (upper) and σwingssubscript𝜎wings\sigma_{\mathrm{wings}} (lower), and the right panels show fwingssubscript𝑓wingsf_{\mathrm{wings}} (upper) and afullsubscript𝑎fulla_{\mathrm{full}} (lower).
Refer to caption
Refer to caption
Figure 56a: Subregions in which ΣSFRsubscriptΣSFR\Sigma_{\mathrm{SFR}} superprofiles are generated for DDO 187. In both panels, the background greyscale shows ΣSFRsubscriptΣSFR\Sigma_{\mathrm{SFR}}, and the solid black line represents the S/N>5𝑆𝑁5S/N>5 threshold where we can accurately measure vpeaksubscript𝑣peakv_{\mathrm{peak}}. In the lower panel, the colored regions show which pixels have contributed to each ΣSFRsubscriptΣSFR\Sigma_{\mathrm{SFR}} superprofile.
Refer to caption
Figure 56b: The ΣSFRsubscriptΣSFR\Sigma_{\mathrm{SFR}} superprofiles in DDO 187, where colors indicate the corresponding ΣSFRsubscriptΣSFR\Sigma_{\mathrm{SFR}} regions in the previous figure. The left hand panels show the raw superprofiles (upper left) and the superprofiles normalized to the same peak flux (lower left). The right hand panels show the flux-normalized superprofiles scaled by the HWHM (upper right) and the flux-normalized superprofiles minus the model of the Gaussian core (lower right). In all panels, the solid black line represents the global superprofile. In the left panels, we have shown the HWHM-scaled Gaussian model as the dashed black line.
Refer to caption
Figure 56c: Variation of the superprofile parameters as a function of ΣSFRsubscriptΣSFR\Sigma_{\mathrm{SFR}} for DDO 187. The solid dashed line shows the parameter value for the global superprofile (Paper I). The left panels show σcentralsubscript𝜎central\sigma_{\mathrm{central}} (upper) and σwingssubscript𝜎wings\sigma_{\mathrm{wings}} (lower), and the right panels show fwingssubscript𝑓wingsf_{\mathrm{wings}} (upper) and afullsubscript𝑎fulla_{\mathrm{full}} (lower).

References

  • Agertz et al. (2009) Agertz, O., Lake, G., Teyssier, R., Moore, B., Mayer, L., & Romeo, A. B. 2009, MNRAS, 392, 294
  • Banerjee et al. (2011) Banerjee, A., Jog, C. J., Brinks, E., & Bagetakos, I. 2011, MNRAS, 415, 687
  • Barbieri et al. (2005) Barbieri, C. V., Fraternali, F., Oosterloo, T., Bertin, G., Boomsma, R., & Sancisi, R. 2005, A&A, 439, 947
  • Bekki & Chiba (2006) Bekki, K., & Chiba, M. 2006, ApJ, 637, L97
  • Bolatto et al. (2011) Bolatto, A. D. et al. 2011, ApJ, 741, 12
  • Boomsma et al. (2008) Boomsma, R., Oosterloo, T. A., Fraternali, F., van der Hulst, J. M., & Sancisi, R. 2008, A&A, 490, 555
  • Boulanger & Viallefond (1992) Boulanger, F., & Viallefond, F. 1992, A&A, 266, 37
  • Dalcanton et al. (2009) Dalcanton, J. J. et al. 2009, ApJS, 183, 67
  • Dale et al. (2009) Dale, D. A. et al. 2009, ApJ, 703, 517
  • Dekel & Silk (1986) Dekel, A., & Silk, J. 1986, ApJ, 303, 39
  • Dickey et al. (1990) Dickey, J. M., Hanson, M. M., & Helou, G. 1990, ApJ, 352, 522
  • Dickey et al. (2000) Dickey, J. M., Mebold, U., Stanimirovic, S., & Staveley-Smith, L. 2000, ApJ, 536, 756
  • Foreman-Mackey et al. (2012) Foreman-Mackey, D., Hogg, D. W., Lang, D., & Goodman, J. 2012, ArXiv e-prints
  • Fraternali et al. (2001) Fraternali, F., Oosterloo, T., Sancisi, R., & van Moorsel, G. 2001, ApJ, 562, L47
  • Fraternali et al. (2002) Fraternali, F., van Moorsel, G., Sancisi, R., & Oosterloo, T. 2002, AJ, 123, 3124
  • Ghigna et al. (2000) Ghigna, S., Moore, B., Governato, F., Lake, G., Quinn, T., & Stadel, J. 2000, ApJ, 544, 616
  • Heiles (2001) Heiles, C. 2001, ApJ, 551, L105
  • Heiles & Troland (2003) Heiles, C., & Troland, T. H. 2003, ApJ, 586, 1067
  • Hunter et al. (2001) Hunter, D. A., Elmegreen, B. G., & van Woerden, H. 2001, ApJ, 556, 773
  • Hunter et al. (1993) Hunter, D. A., Hawley, W. N., & Gallagher, III, J. S. 1993, AJ, 106, 1797
  • Hunter et al. (1999) Hunter, D. A., van Woerden, H., & Gallagher, J. S. 1999, AJ, 118, 2184
  • Ianjamasimanana et al. (2012) Ianjamasimanana, R., de Blok, W. J. G., Walter, F., & Heald, G. H. 2012, AJ, 144, 96
  • Joung et al. (2009) Joung, M. R., Mac Low, M.-M., & Bryan, G. L. 2009, ApJ, 704, 137
  • Kannan et al. (2012) Kannan, R., Macciò, A. V., Pasquali, A., Moster, B. P., & Walter, F. 2012, ApJ, 746, 10
  • Kazantzidis et al. (2008) Kazantzidis, S., Bullock, J. S., Zentner, A. R., Kravtsov, A. V., & Moustakas, L. A. 2008, ApJ, 688, 254
  • Kennicutt & Evans (2012) Kennicutt, R. C., & Evans, N. J. 2012, ARA&A, 50, 531
  • Kim & Ostriker (2007) Kim, W.-T., & Ostriker, E. C. 2007, ApJ, 660, 1232
  • Klessen & Hennebelle (2010) Klessen, R. S., & Hennebelle, P. 2010, A&A, 520, A17
  • Klypin et al. (1999) Klypin, A., Kravtsov, A. V., Valenzuela, O., & Prada, F. 1999, ApJ, 522, 82
  • Komatsu et al. (2011) Komatsu, E. et al. 2011, ApJS, 192, 18
  • Kroupa (2001) Kroupa, P. 2001, MNRAS, 322, 231
  • Lee et al. (2011) Lee, J. C. et al. 2011, ApJS, 192, 6
  • Lelli et al. (2012) Lelli, F., Verheijen, M., Fraternali, F., & Sancisi, R. 2012, A&A, 544, A145
  • Leroy et al. (2008) Leroy, A. K., Walter, F., Brinks, E., Bigiel, F., de Blok, W. J. G., Madore, B., & Thornley, M. D. 2008, AJ, 136, 2782
  • Lin & Shu (1964) Lin, C. C., & Shu, F. H. 1964, ApJ, 140, 646
  • Lopez et al. (2011) Lopez, L. A., Krumholz, M. R., Bolatto, A. D., Prochaska, J. X., & Ramirez-Ruiz, E. 2011, ApJ, 731, 91
  • Mac Low (1999) Mac Low, M.-M. 1999, ApJ, 524, 169
  • Mac Low & Klessen (2004) Mac Low, M.-M., & Klessen, R. S. 2004, Reviews of Modern Physics, 76, 125
  • Martin (1998) Martin, C. L. 1998, ApJ, 506, 222
  • McQuinn et al. (2010) McQuinn, K. B. W. et al. 2010, ApJ, 721, 297
  • Moiseev & Lozinskaya (2012) Moiseev, A. V., & Lozinskaya, T. A. 2012, MNRAS, 423, 1831
  • Monaco (2004) Monaco, P. 2004, MNRAS, 352, 181
  • Oh et al. (2011) Oh, S.-H., de Blok, W. J. G., Brinks, E., Walter, F., & Kennicutt, Jr., R. C. 2011, AJ, 141, 193
  • Oh et al. (2008) Oh, S.-H., de Blok, W. J. G., Walter, F., Brinks, E., & Kennicutt, Jr., R. C. 2008, AJ, 136, 2761
  • Ott et al. (2012) Ott, J. et al. 2012, AJ, 144, 123
  • Ott et al. (2001) Ott, J., Walter, F., Brinks, E., Van Dyk, S. D., Dirsch, B., & Klein, U. 2001, AJ, 122, 3070
  • Petric & Rupen (2007) Petric, A. O., & Rupen, M. P. 2007, AJ, 134, 1952
  • Roberts (1969) Roberts, W. W. 1969, ApJ, 158, 123
  • Rossa & Dettmar (2003) Rossa, J., & Dettmar, R.-J. 2003, A&A, 406, 505
  • Schaye (2004) Schaye, J. 2004, ApJ, 609, 667
  • Schwartz & Martin (2004) Schwartz, C. M., & Martin, C. L. 2004, ApJ, 610, 201
  • Sellwood & Balbus (1999) Sellwood, J. A., & Balbus, S. A. 1999, ApJ, 511, 660
  • Shapiro & Field (1976) Shapiro, P. R., & Field, G. B. 1976, ApJ, 205, 762
  • Stilp et al. (2013a) Stilp, A. M., Dalcanton, J. J., Warren, S. R., Skillman, E., Ott, J., & Koribalski, B. 2013a, ApJ, 765, 136
  • Stilp et al. (2013c) Stilp, A. M., Dalcanton, J. J., Weisz, D., Warren, S. R., Skillman, E., Ott, J., Williams, B. F., & Dolphin, A. E. 2013c, submitted to ApJ
  • Tamburro et al. (2009) Tamburro, D., Rix, H.-W., Leroy, A. K., Mac Low, M.-M., Walter, F., Kennicutt, R. C., Brinks, E., & de Blok, W. J. G. 2009, AJ, 137, 4424
  • Tenorio-Tagle et al. (1991) Tenorio-Tagle, G., Rozyczka, M., Franco, J., & Bodenheimer, P. 1991, MNRAS, 251, 318
  • Thornton et al. (1998) Thornton, K., Gaudlitz, M., Janka, H.-T., & Steinmetz, M. 1998, ApJ, 500, 95
  • Trachternach et al. (2008) Trachternach, C., de Blok, W. J. G., Walter, F., Brinks, E., & Kennicutt, Jr., R. C. 2008, AJ, 136, 2720
  • Trujillo-Gomez et al. (2011) Trujillo-Gomez, S., Klypin, A., Primack, J., & Romanowsky, A. J. 2011, ApJ, 742, 16
  • van der Kruit (1981) van der Kruit, P. C. 1981, A&A, 99, 298
  • van Eymeren et al. (2010) van Eymeren, J., Koribalski, B. S., López-Sánchez, Á. R., Dettmar, R.-J., & Bomans, D. J. 2010, MNRAS, 407, 113
  • van Eymeren et al. (2009a) van Eymeren, J., Marcelin, M., Koribalski, B., Dettmar, R.-J., Bomans, D. J., Gach, J.-L., & Balard, P. 2009a, A&A, 493, 511
  • van Eymeren et al. (2009b) van Eymeren, J., Marcelin, M., Koribalski, B. S., Dettmar, R.-J., Bomans, D. J., Gach, J.-L., & Balard, P. 2009b, A&A, 505, 105
  • van Zee & Bryant (1999) van Zee, L., & Bryant, J. 1999, AJ, 118, 2172
  • Wada et al. (2002) Wada, K., Meurer, G., & Norman, C. A. 2002, ApJ, 577, 197
  • Walter et al. (2008) Walter, F., Brinks, E., de Blok, W. J. G., Bigiel, F., Kennicutt, Jr., R. C., Thornley, M. D., & Leroy, A. 2008, AJ, 136, 2563
  • Warren et al. (2012) Warren, S. R. et al. 2012, ApJ, 757, 84
  • Weisz et al. (2011) Weisz, D. R. et al. 2011, ApJ, 739, 5
  • Weisz et al. (2012) —. 2012, ApJ, 744, 44
  • Weisz et al. (2009) Weisz, D. R., Skillman, E. D., Cannon, J. M., Dolphin, A. E., Kennicutt, Jr., R. C., Lee, J., & Walter, F. 2009, ApJ, 704, 1538
  • Wolfire et al. (1995) Wolfire, M. G., Hollenbach, D., McKee, C. F., Tielens, A. G. G. M., & Bakes, E. L. O. 1995, ApJ, 443, 152
  • Young et al. (2003) Young, L. M., van Zee, L., Lo, K. Y., Dohm-Palmer, R. C., & Beierle, M. E. 2003, ApJ, 592, 111
  • Zhang et al. (2012) Zhang, H.-X., Hunter, D. A., & Elmegreen, B. G. 2012, ApJ, 754, 29