Herschel††thanks: Herschel is an ESA space observatory with science instruments provided by European-led Principal Investigator consortia and with important participation from NASA.-ATLAS/GAMA: The Environmental Density of Far-Infrared Bright Galaxies at
Abstract
We compare the environmental and star formation properties of far-infrared detected and non–far-infrared detected galaxies out to . Using optical spectroscopy and photometry from the Galaxy And Mass Assembly (GAMA) and Sloan Digital Sky Survey (SDSS), with far-infrared observations from the Herschel-ATLAS Science Demonstration Phase (SDP), we apply the technique of Voronoi Tessellations to analyse the environmental densities of individual galaxies. Applying statistical analyses to colour, band magnitude and redshift-matched samples, we show there to be a significant difference at the 3.5 level between the normalized environmental densities of these two populations. This is such that infrared emission (a tracer of star formation activity) favours underdense regions compared to those inhabited by exclusively optically observed galaxies selected to be of the same band magnitude, colour and redshift. Thus more highly star-forming galaxies are found to reside in the most underdense environments, confirming previous studies that have proposed such a correlation. However, the degeneracy between redshift and far-infrared luminosity in our flux-density limited sample means that we are unable to make a stronger statement in this respect. We then apply our method to synthetic light cones generated from semi-analytic models, finding that over the whole redshift distribution the same correlations between star-formation rate and environmental density are found.
keywords:
method: data analysis – galaxies: statistics – galaxies: submillimetre– galaxies: star formation.1 Introduction
1.1 The environmental influence on galaxy formation and evolution
It is clear that if we are to understand the process by which galaxies form and evolve, we have to consider the role that their immediate environment plays. Dressler (1980) was the first to show that there is a correlation between the morphology of a galaxy population and the density of its environment. Further studies have since shown that disk dominated ‘late-type’ galaxy morphologies with high star formation rates (SFR) dominate underdense regions, while their elliptical ‘early-type’ counterparts, with low SFR, dominate the densest regions (Postman & Geller 1984; Dressler et al. 1997; Domínguez et al. 2001; Goto et al. 2003; Kauffmann et al. 2004; O’Mill et al. 2008; Lee et al. 2010; Wijesinghe et al. 2012).
It has also been shown, with the advent of large area surveys such as the Sloan Digital Sky Survey (SDSS; York et al. 2000), that these galaxies can be categorised into two distinct optical colour populations, ‘Red’ and ‘Blue’, where the colour of a galaxy is dependent on several internal properties that represent the evolutionary history of the galaxy; metallicity (), star formation history (SFH) and dust attenuation (). These two colour populations show, at a fixed luminosity, a correlation with density such that the densest regions are populated by the red, early-type passive galaxies, with blue, star-forming late-types observed in less dense regions (Poggianti et al., 2006). However, earlier work by Balogh et al. (1997, 1998) compared galaxies with similar luminosities and morphologies from both dense cluster and low density field environments, and found that that the SFR was still lower in dense cluster regions and thus the SFR-density correlation still held regardless of the morphology of the galaxy. This indicates that the observed SFR-density relation cannot be exclusively tied to the morphology-density relation; other processes must be influencing the observed correlations. It is currently believed that this reduction in SFR with increased environmental density is directly linked to the stripping of cold gas from galaxies via some type of direct interaction, and several mechanisms have been invoked to explain this observed correlation.
For example, major mergers (Barnes & Hernquist, 1992) can cause a burst of star-formation activity and feedback from such star-burst events is able to prevent gas cooling, and as a result the gas remains out of pressure equilibrium with its environment. Due to this pressure difference the gas expands out of the central regions of the galaxy sweeping up the inter-stellar medium (ISM). This ejection of the ISM from the merger remnant can lead to further suppression of star formation (Mac Low & Ferrara 1999; Gay et al. 2010). Alternatively, other processes such as harassment, strangulation and ram-pressure stripping may also play an important role (see e.g. Boselli & Gavazzi, 2006, for a review).
1.2 Far-infrared emission as a tracer of star formation
Star formation within a galaxy typically increases the dust content of the ISM through processes associated with the short-lived massive stars that inhabit these regions, such as supernovae, that redistribute material into the surrounding ISM (Dunne et al. 2003; Sugerman et al. 2006; Dunne et al. 2009; Gomez et al. 2012). This dust then absorbs a significant fraction of the ultra-violet (UV) light emitted by the young O-B type stars associated with these regions and is heated to temperatures of around 20-40 K, emitting thermal radiation at far-infrared wavelengths. This makes the use of far-infrared emission from a galaxy a widely used diagnostic for the obscured SFR of a galaxy (Kennicutt 1998; Hirashita et al. 2003; Driver et al. 2007; Cortese et al. 2008; Nordon et al. 2010; Buat et al. 2010; Dunne et al. 2011; Smith et al. 2012a).
However, other contributions to the UV radiation field which heats the dust, such as AGN and older stellar populations within the galaxy, may lead to overestimates of the SFR using far-infrared emission (Schmitt et al. 2006; da Cunha et al. 2008; Nardini et al. 2008; Bendo et al. 2010, 2012; Groves et al. 2012; Smith et al. 2012a; Smith et al. 2012b). Conversely, in galaxies where the ISM is optically thin at UV wavelengths, the measured SFR will emerge directly from the UV and not in the far-infrared. In these galaxies, deriving the star formation from far-infrared emission may lead to an underestimation of the total SFR (Kennicutt, 1998). However, as more than per cent of energy ever radiated from stars has been absorbed by dust and re-radiated into the infrared (Puget et al. 1996; Fixsen et al. 1998; Adelberger & Steidel 2000; Finn et al. 2010), with the bulk of star formation since occurring in dust obscured galaxies (Calzetti & Heckman 1999; Le Floc’h et al. 2005; Patel et al. 2013), only AGN, low metallicity systems and very passive but dusty galaxies will lie off the far-infrared to SFR relation.
Initial studies of the relationship between SFR and infrared emission from galaxies focused on shorter wavelengths using the Infrared Astronomical Satellite (IRAS; Neugebauer et al. 1984) and more recently the Spitzer Space Observatory (Rieke et al., 2004). IRAS surveyed the vast majority of the sky between m, providing a large census of dusty galaxies in the local Universe. Using these data, Goto (2005) investigated the optical properties of 4248 infrared-selected galaxies by positionally matching data from the IRAS with optical data from the SDSS. Using a volume limited sample at and applying a th-nearest neighbour density estimate, a trend was found such that galaxies with the highest infrared luminosities reside in relatively low-density local environments, suggesting that star-forming galaxies favour underdense regions, in agreement with previous studies at other wavelengths.
The environmental densities of IRAS-detected luminous infrared galaxies (LIRGs; ) at were also studied by Hwang et al. (2010). They found that the fraction of LIRGs was strongly dependent on both the morphology and the distance to the nearest neighbour galaxy. They conclude that the evolution of the SFR-density relation from high to low redshifts is consistent with the idea that galaxy-galaxy interactions and merging play a critical role in triggering star formation in LIRGs.
Additionally, Tekola et al. (2012) examined the relationship between star formation and the environments of LIRGs selected from IRAS and compared these with other types of high- and low- redshift galaxies out to . They identified that there was a luminosity () at which infrared selected galaxies preferentially resided in higher density environments, compared to “normal” galaxies. Above this luminosity the average density increases, whereas below this luminosity, infrared-selected galaxies reside in environments of equal density, similar to the general population. They conclude, therefore, that infrared activity for non-LIRGs is not dependent on density and that the SFR-density relationship for these galaxies is similar to that of blue galaxies at .
At higher redshifts, Feruglio et al. (2010) used m observations from Spitzer to investigate the environmental effects on star formation in LIRGs and ultra-luminous infrared galaxies (ULIRGs; ) in the Cosmic Evolution Survey (COSMOS; Scoville et al. 2007) at . They found the fraction of these galaxies to decrease with density out to , but that the relationship flattens out with increasing redshift.
Due to the wavelength coverage of IRAS (m), the majority of galaxies detected by these studies were found by Bregman et al. (1998) to be spirals and starbursts in the local universe (). This restriction resulted in the IRAS providing little information about the cooler dust, which traces the bulk of the dust mass (e.g. Dunne et al., 2011), in other galaxy populations, especially early-type morphologies. In comparison, Spitzer can probe longer wavelengths (m) and therefore is less susceptible to this bias, although galaxies with the coldest dust temperatures would still be missed (Eales et al. 2010; Symeonidis et al. 2011, 2013). Considering that cold dust is present across all types of galaxies and is a major contributor to infrared luminosity (Willmer et al., 2009), and closely traces the total dust mass, it is crucial that we are able to select galaxies at longer wavelengths.
With the launch of the Herschel Space Observatory (Pilbratt et al., 2010) we are now able to select galaxies at these longer wavelengths. A number of studies have begun to investigate how star formation in a galaxy, traced by far-infrared emission at m, is linked to the environment in which the galaxy resides. Dariush et al. (2011) used far-infrared data from the Herschel Astrophysical Terahertz Large Area Survey (H-ATLAS; Eales et al. 2010) Science Demonstration Phase (SDP) to examine the ultraviolet and optical properties and environments of low redshift galaxies () from the SDSS and the Galaxy And Mass Assembly survey (GAMA; Driver et al. 2011; Hill et al. 2011; Baldry et al. 2010). They found that H-ATLAS detects predominantly blue/star-forming galaxies, with a minor contribution from red galaxies (comprising highly obscured and passive systems). Using the 5th-nearest neighbour as an estimate of the environmental density, they found that the fraction of H-ATLAS detected galaxies is much higher ( per cent) in low-density environments compared to high-density environments, where the fraction was found to be per cent. However, the detection rate of red and blue galaxies appears to be similar for both high- and low-density environments, indicating that it is the colour of a galaxy, rather than the density of its local environment, that governs whether it is detectable by H-ATLAS.
A consistent result was also found by Rowlands et al. (2012), who found that H-ATLAS detected early-type galaxies tend to have bluer (NUV-r) colours, higher SSFRs and younger stellar populations than optically observed early-type morphologies. They compare 354 spiral and 30 early-type galaxy morphologies at low redshift (), finding no significant difference between the environmental densities of these populations. However, it is possible that they are not sampling a large enough range of environments with such small population samples.
Coppin et al. (2011) also used far-infrared data from H-ATLAS to examine the centres of optically selected galaxy clusters at to search for statistical evidence of obscured star formation in the cluster population. Using Voronoi Tessellations (described in Section 3.1) to locate cluster members, they found an excess in the surface density of far-infrared sources within Mpc of the centre of these clusters. They conclude that the far-infrared emission is associated with dust-obscured star formation in cluster galaxies, translating to a rate of yr-1. This SFR, maintained over the 3 Gyr since , would contribute enough mass to construct a typical S0-type bulge that would match the observed increase in bulge-dominated galaxies in cores of clusters over the same timescale.
The effects of environment on the far-infrared properties of galaxies are also discussed by Davies et al. (2010), who use data from the Herschel Virgo Cluster Survey (HeViCS; Davies et al. 2012), finding that relatively few faint far-infrared sources that can be associated with confirmed Virgo cluster members. Furthermore, studies by Cortese et al. (2010a, b) present Herschel observations of the perturbed galaxy NGC in the Virgo cluster and identify regions of extra-planar dust up to kpc away from the galaxy disk. This dust is found to closely follow the distribution of stripped atomic and molecular hydrogen, supporting the idea that gas and dust are perturbed in a similar way within the cluster environment.
In contrast to these results, Geach et al. (2011a), using 24m observations from Spitzer, investigated large-scale filamentary structure surrounding rich clusters out to , and found that the SFRs of individual galaxy members within a cluster are not significantly different to identically selected field galaxies. Although pockets of enhanced star formation were observed, they suggest that this is the result of some ‘pre-processing’ effect where satellite groups have star formation triggered via gravitational tidal interactions during cluster infall. However, they state that there is no environmental mechanism acting to enhance the star formation within individual galaxies.
It is evident that the majority of these studies have either used density measures that do not detect differences on the smallest scales (i.e. th-nearest neighbour or aperture gridding) and/or they have focused entirely on narrow and local redshifts (). In this paper we use data from H-ATLAS to investigate the environmental dependence of far-infrared emission using a technique based on Voronoi Tessellations. Unlike the th-nearest neighbour technique, Voronoi Tessellations calculate the environmental density of galaxies on individual galaxy scales and hence can probe the environmental density to a greater degree of accuracy.
In Section 2 we outline the optical and infrared data that we use. In Section 3 we present how both the spectroscopic and photometric redshifts for our sample of galaxies were measured and sampled and introduce our algorithm to estimate the environmental density. In Section 4 we present the results of our analysis to determine whether there are any differences in environmental density between the far-infrared bright and faint sources, and investigate whether the SFR is linked to the environmental density. In Section 5 we compare our results to semi-analytic models and discuss the physical mechanisms that may explain our results. In Section 6 we discuss our results in the context of the physical mechanisms outlined above and in Section 7 we summarise our findings. We adopt a cosmology throughout with , and kms-1 Mpc-1.
2 Observations
2.1 Far-infrared data
We use far-infrared data from the science demonstration phase of H-ATLAS (Rigby et al. 2011). H-ATLAS provides data across a wavelength range of 100-500 using the Photo-detector Array Camera and Spectrometer (PACS; Poglitsch et al. 2010) at 100 and 160 ; and the Spectral and Photometric Imaging REceiver (SPIRE; Griffin et al. 2010) at 250, 350 and 500. The H-ATLAS observations consist of two scans in parallel mode reaching 5 point source sensitivities of 132, 126, 32, 36 and 45 mJy in the 100, 160, 250, 350, and 500m channels, respectively, with beam sizes of approximately 9, 13, 18, 25 and 35 arcsec in the same five bands. The SPIRE and PACS map-making procedures are described by Pascale et al. (2011) and Ibar et al. (2010) respectively, while the catalogues are described by Rigby et al. (2011). Smith et al. (2011) used a likelihood ratio (LR) method to associate optical counterparts with the H-ATLAS galaxies down to a limiting magnitude of within a 10 arcsec radius. This resulted in optical counterparts for objects from the H-ATLAS 250m catalogue, each with a reliability which ensures not only that the contamination rate is low but also that only one band source dominates the far-infrared emission. While the entire H-ATLAS survey aims to compile a catalogue of 105 extra-galactic far-infrared sources out to z 3, the SDP field covered 3 per cent of this, over an area of 4.0 deg 3.6 deg centred on (09h05m, +0∘30’). To maintain consistency with our Optical catalogue outlined in Section 2.2, we limit our far-infrared catalogue magnitude to .
2.2 Optical and near-infrared data
We use spectroscopic redshifts from both the SDSS and the GAMA survey Data Release One (DR1). Spectroscopic redshifts are provided for magnitude limits of , and in the GAMA 9hr (G09) field which includes the H-ATLAS SDP. This is combined with photometric redshifts derived from the combination of optical (ugriz) SDSS and near-infrared (YJHK) UKIDSS-LAS imaging data as detailed in Smith et al. (2011). This complete optical–near-infrared catalogue, containing photometric and spectroscopic redshifts (hereafter named the Optical-9hr catalogue), totals 909,985 objects from which we remove all sources with due to the fact that at fainter magnitudes the signal-to-noise ratio deceases to an extent where errors associated with the photometry become large. In addition, we remove objects classified as point-like in the SDSS imaging. This reduced the Optical-9hr catalogue to objects, of which had spectroscopic redshifts across a redshift range of .
3 Environmental Density Measurement
In this section we describe our method of determining the environmental density of individual galaxies in redshift slices. First, as the vast majority of the galaxies in our sample do not have spectroscopic redshifts, we are forced to use their photometric redshifts in order to establish where they reside in three dimensional space. Spectroscopic redshifts have errors of the order of (Driver et al., 2011) with the average error associated with our photometric redshifts of the order of . As these photometric redshifts apply to both H-ATLAS and non–H-ATLAS sources, both populations would experience similar biases associated with these errors. Adopting a single redshift at the peak of the photometric redshift probability distribution (z-PDF) would not accurately represent our limited knowledge of the redshift of individual galaxies. We therefore use the full photometric z-PDF to carry out Monte-Carlo (MC) simulations which sample each z-PDF 1000 times generating 1000 MC cubes for each object. From these samples we ensure that we have a good statistical representation of the 3-dimensional distribution of galaxies within the survey area. However, where available, we use spectroscopic redshifts due to their smaller uncertainties.
3.1 Voronoi Tessellations
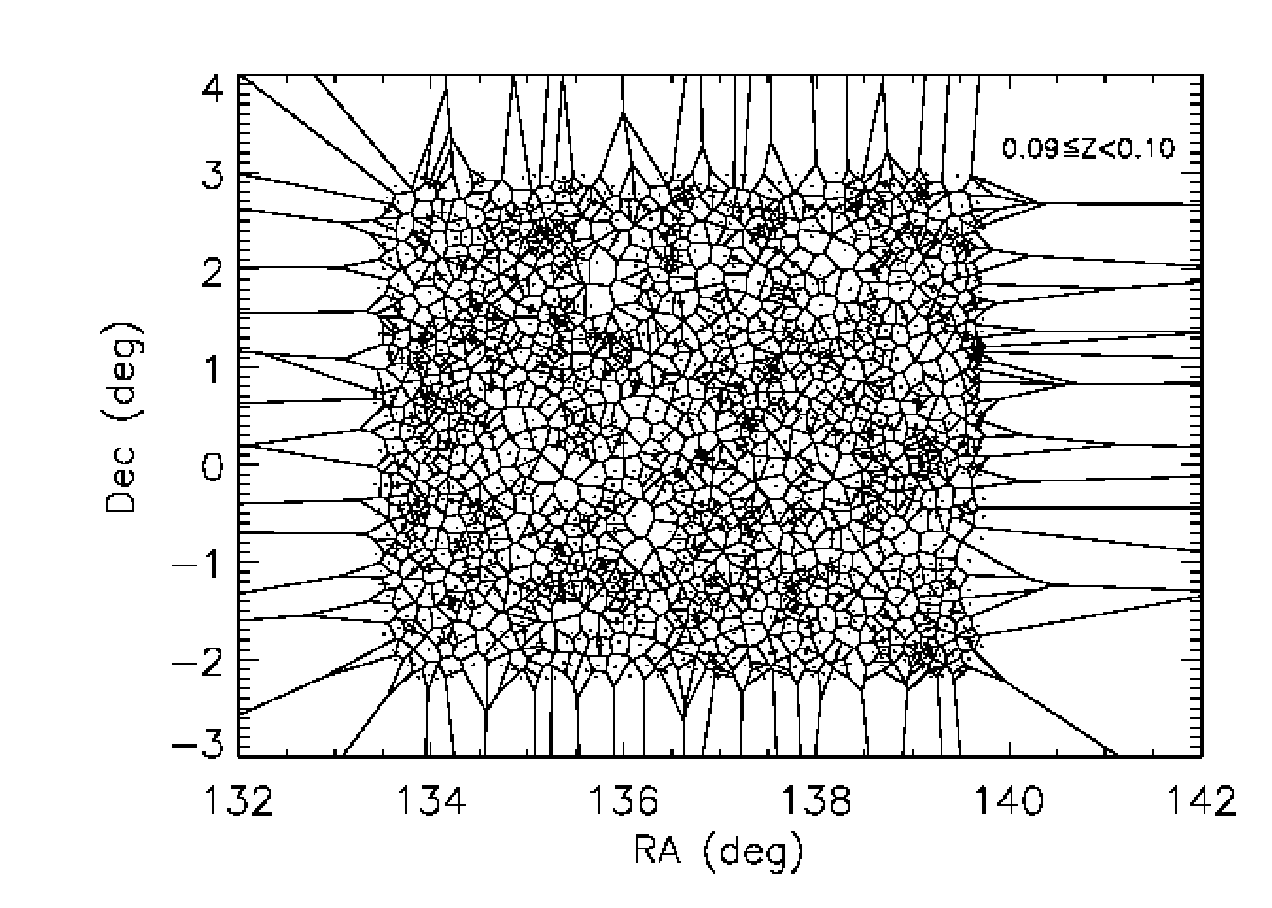
In order to calculate the environmental density of individual galaxies we apply a numerical algorithm called ‘Voronoi Tessellations’ (VT; Icke & van de Weygaert 1987; van de Weygaert & Icke 1989) to the Optical-9hr catalogue. The algorithm works by initially treating each object in the field as a single point source (or nucleus). It then constructs a convex polygon (or ‘Voronoi cell’) around each of these nuclei enclosing all points that are closer to that nucleus than any other. The area of the Voronoi cell is a good representation of the local environment of that object, such that the reciprocal of this area gives a direct measure of the density. The VT technique has been used in many areas of astronomy, initially in the study of large-scale structure of the universe (e.g., Icke & van de Weygaert 1987; van de Weygaert & Icke 1989; Diehl & Statler 2006) and more recently in studies of cluster detection (e.g., Kim et al. 2000; Ramella et al. 2001; van Breukelen et al. 2006a; van Breukelen et al. 2006b; van Breukelen & Clewley 2009; Geach et al. 2011b; Soares-Santos et al. 2011).
The VT algorithm does not take redshift into account when linking each nucleus together as we lack the necessary resolution in redshift to apply a three-dimensional VT algorithm. Therefore it is necessary to group galaxies into redshift slices so as to avoid projection effects. Subsequently each of the 1000 3D MC fields are split into redshift slices so that the VT algorithm can be applied to each slice individually; thus only objects within each slice have the VT algorithm applied to them, maximising the accuracy of the density calculation for each object. The width of each slice is limited such that, if too wide, projection effects may become a problem. In addition, if the slice is too small, an overdense region in terms of the rest of the field may go undetected by the VT algorithm if it is spread across multiple slices. The typical velocity dispersion between gravitationally bound group/cluster galaxies is within the region of a few hundred kilometres per second (Haynes et al. 1984; Martini et al. 2007), which equates to a spread in redshift of at . Therefore we adopt a redshift slice of width , easily incorporating associated galactic environments and resulting in 120 slices across each of the 1000 3D MC realisations across the full redshift range of our data out to .
For each object in each MC cube realisation its Voronoi cell area () is calculated, the mean of which () gives the overall mean area calculated for that object across all of the MC realisations. Taking an inverse of this mean area gives a value for the mean environmental density () for that object. Figure 1 shows an example of one VT slice (containing a smaller subset of the data for illustrative purposes) and it is immediately clear that objects towards the outside of the field have overly large Voronoi cell areas. This edge effect is the result of the VT algorithm not finding any objects outside of this boundary and consequently being unable to triangulate in these areas. In order to prevent this edge effect altering the mean density result, a cut is then made around the outside of the field to remove the outermost objects (and their overly large cell areas) from the Optical-9hr catalogue. The position of this cut was calculated by plotting the right ascension (RA) and declination (Dec) values separately against a value that represents a normalised value for the mean area, the significance () (this value is introduced to account for a peak in the number density of objects as explained in Section 3.2). The resultant plots showed, unsurprisingly, a sharp increase in mean area of the cells towards the outside of the field and that this edge effect penetrated the field by approximately degrees in both RA and Dec. As the Optical-9hr field extends well beyond the H–ATLAS-SDP field on all sides, this cut is not significant in terms of the number of sources lost and does not interfere with the accuracy of our analysis.
Furthermore, to ensure that the accuracy of the comparison between the two samples is maintained, it is necessary to include only Optical-9hr objects that reside within the boundary of the H–ATLAS-SDP field. This ensures that all objects included in the density measure are from across the same region and thus have been observed by both SDSS and H-ATLAS observations. Thus when comparing far-infrared detected and undetected galaxies we are not counting any far-infrared luminous galaxies that would otherwise be detected in the H-ATLAS SDP catalogue if it were not for the boundary limits of the H-ATLAS SDP region. After these region cuts are applied, the final Optical-9hr catalogue is reduced to 129,518 objects. In section 4.1, this catalogue is divided according to whether or not the galaxies have far-infrared emission in order that these sub-samples can then be compared. Table 1 shows the number of galaxies within these sub-samples in addition to the number of galaxies with photometric and spectroscopic redshifts.
3.2 Density normalization
With a value for the mean environmental density calculated for each object in the Optical-9hr field it is possible to examine the 3D density distribution across the entire redshift range. Due to the flux-density limit of the observations and the much larger volume being sampled at higher redshift, a peak in the density distribution is found at corresponding to the peak in the galaxy number density. This peak in the detection rate would naturally lead to an increase in the mean density being returned by the VT algorithm for redshift slices in this range. Therefore two Voronoi cells from two different redshift slices cannot be accurately compared in terms of their environment. In order to counteract this bias it is necessary to normalize the Voronoi cell areas across the entire redshift range to produce a normalized environmental density for each object.
We therefore create a separate random field by applying a random position to each Optical-9hr object within the H-ATLAS SDP region within each redshift slice of that MC realisation. We apply our VT algorithm to the random field and determine the mean cell area (defined as the sum of the individual cell areas in that slice divided by their number) and the standard deviation of each random redshift slice. Our density measure is therefore given by,
| (1) |
where is the measured VT cell area for each object from the real field per MC realisation and is the normalized density value in comparison to a random distribution for each object.
therefore shows how the real field compares to a completely random distribution, in terms of the standard deviation of that random distribution, and thus accounts for differences in uniformity of the field between slices. This normalisation also allows for the comparison of different objects from across redshift slices with different population densities. Taking the mean of these values across all MC realisations gives the mean normalized comparison density ().
3.3 Nearest-neighbour density comparison
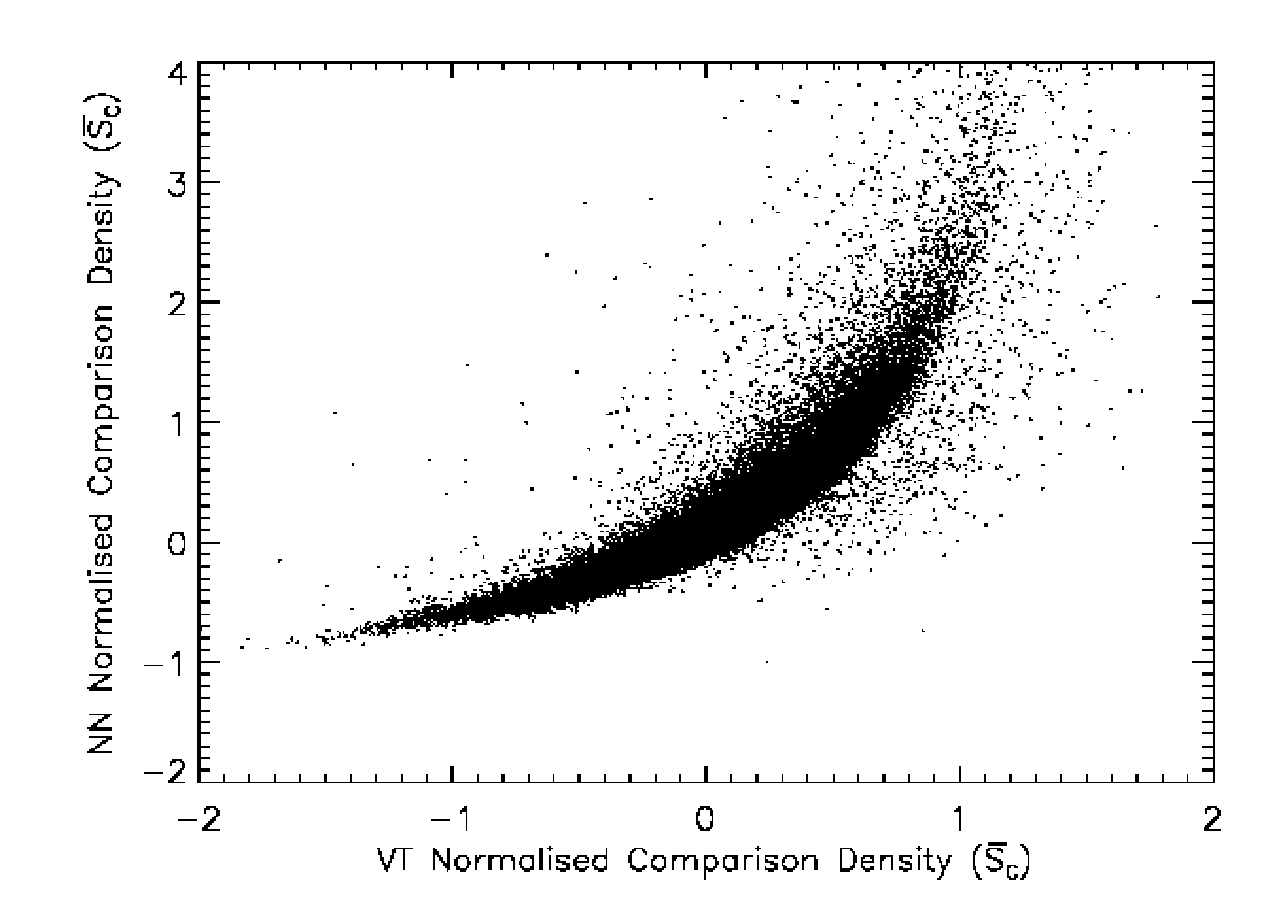
Using VT to probe galaxy environments on individual galaxy scales is a relatively new approach to the study of galaxy environmental density. Previous work in the analysis of galactic environments has instead predominantly relied on estimating the local density of galaxies using the projected th-nearest neighbour technique (), which measures the environmental density in terms of the number of galaxies within a circular region defined by the radius to the th-nearest galaxy (e.g., Dressler 1980; Lewis et al. 2002; Miller et al. 2003; Balogh et al. 2004; Cooper et al. 2005; Silverman et al. 2009; Cucciati et al. 2010; Hernández-Fernández et al. 2012; Wijesinghe et al. 2012). We therefore test our Voronoi Tessellation density measure (VT) against this th-nearest neighbour technique (NN) in order to establish whether there are any significant differences between the results obtained from both techniques, both in terms of how our overall density correlations are affected as well as a comparison of the techniques ability to probe detailed structure.
For our comparison we use in line with the majority of recent studies that have used the NN technique to examine local environmental densities of galaxies (e.g., Cucciati et al. 2010; Wijesinghe et al. 2012 and Hernández-Fernández et al. 2012). We use the NN algorithm in exactly the same way as our VT method described in Section 3.1, with the NN algorithm applied to each redshift slice within each MC cube, once more normalising the field to account for differences in number density and uniformity across the redshift range. The only difference between the methods comes as a result of the fact that, unlike a VT cell, the parameter represents larger densities with larger values and thus, to reflect this, we reverse the sign of such that positive values once more represent a normalized overdensity. We maintain the boundaries applied to our VT density calculation to both prevent such edge effects and to maintain comparison accuracy between the two methods.
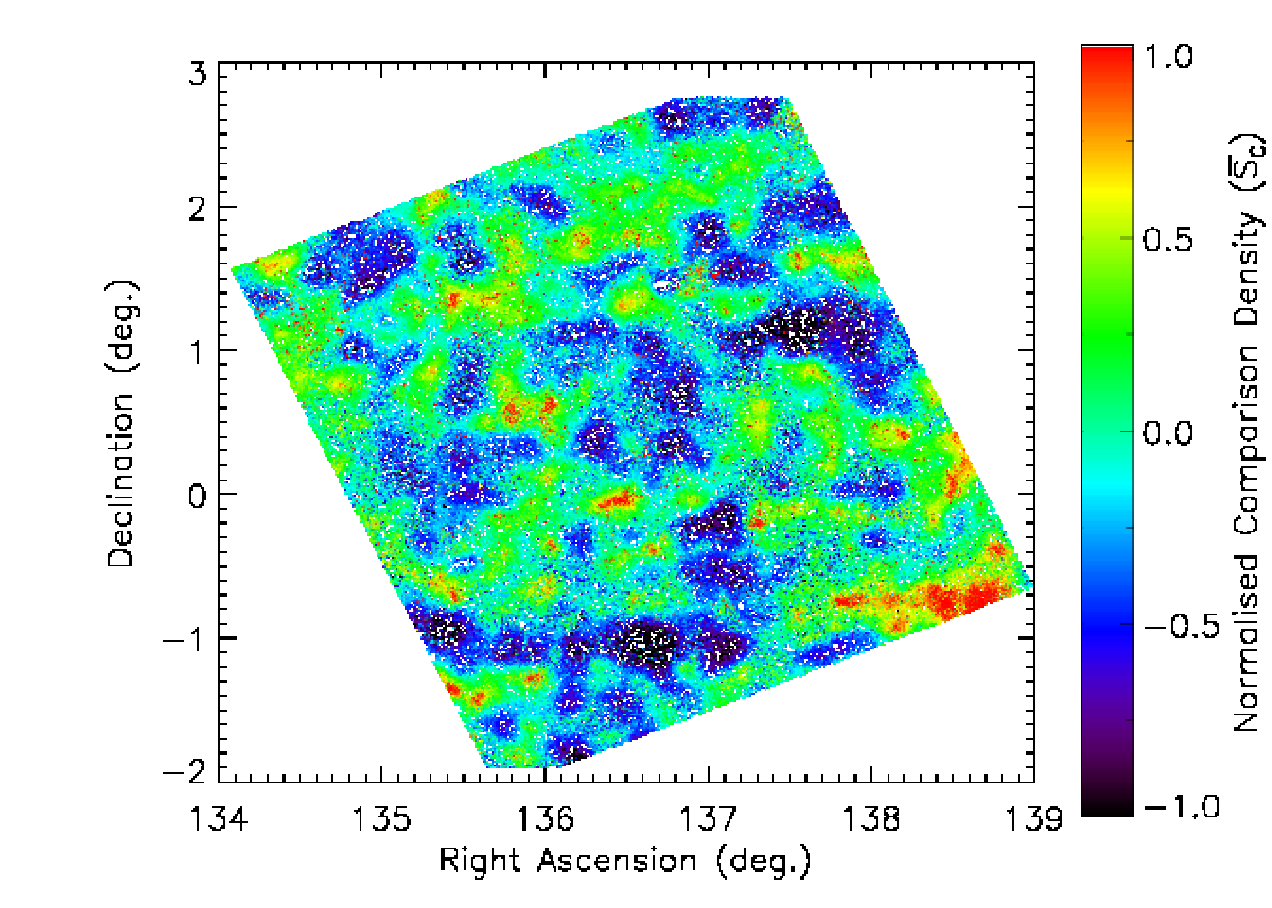
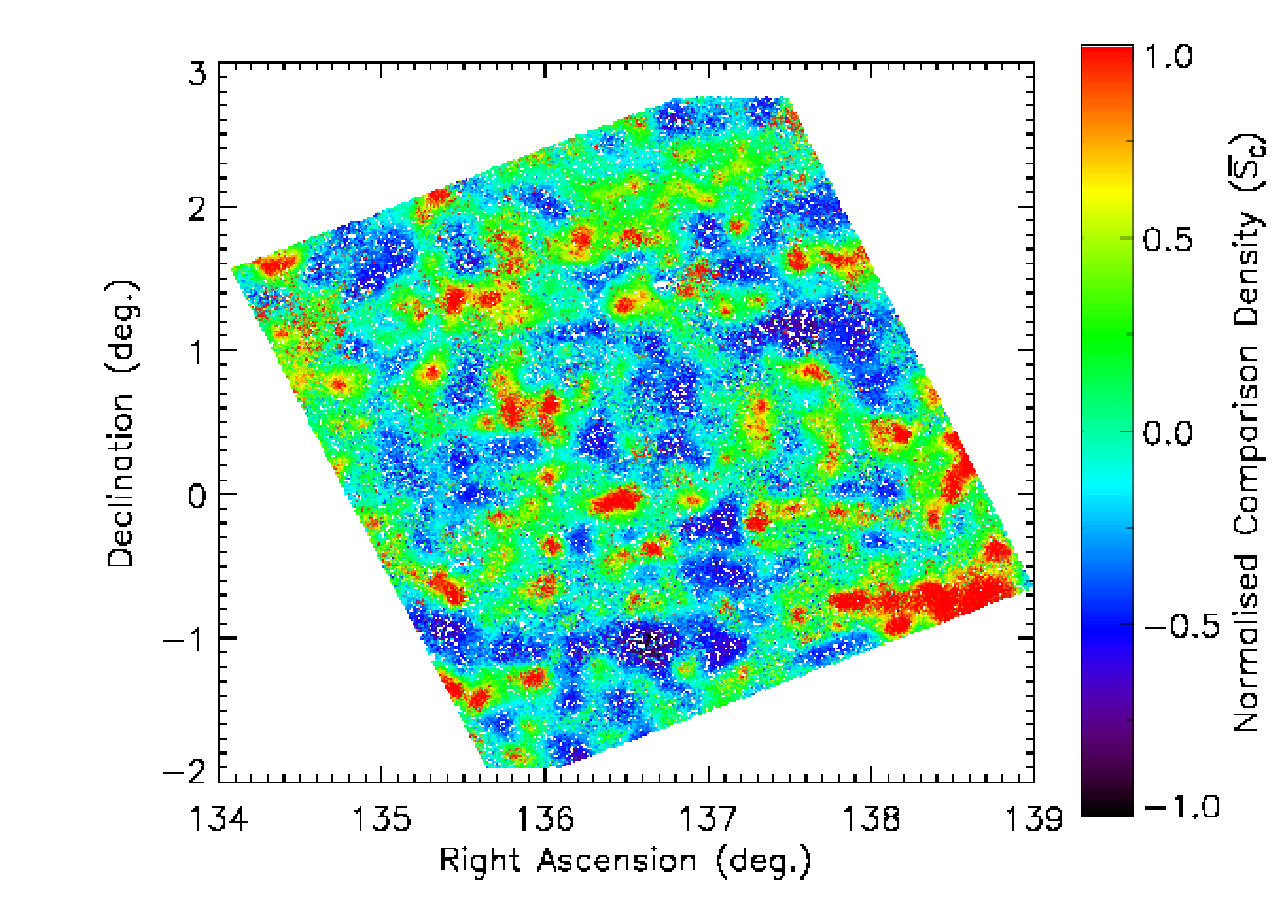
We apply both the Voronoi Tessellation and th-nearest neighbour techniques independently to our Optical-9hr catalogue; Figure 2 shows the relationship between the initial outputs returned by both techniques. Calculating the Spearman’s Rank Correlation Coefficient () between both density distributions returns a value of at a level, indicating a strong (although non-linear) correlation. In addition, Figure 3 shows the normalized comparison densities () returned by each technique plotted according to RA and Dec positions and coloured according to density. Both figures clearly show that each density measure has successfully reproduced the same general density structure across the field, with the most extreme over- and under-densities located by both methods. However, there are some noticeable differences between the methods indicating that the intensity of the local density in specific regions differs between each method.
From the direct comparison between the two methods in Figure 2, it is clear that the NN method has a greater dynamic range in the densest environments where the VT method saturates. Conversely the VT method appears more suited to distinguishing between less dense environments where the NN method saturates. Figure 3 shows that using the NN method results in larger regions of peak overdensities with less defined regions of intermediate density in comparison with the structure distribution from the VT method. A full investigation of the pros and cons of different density measures has been conducted by Muldrew et al. (2012) and we refer the reader to that paper for more information. But to summarise they find that the NN technique is very poorly correlated with the respective dark-matter-halo mass, although the NN technique is able to describe the internal densities of high-mass haloes.
It is also clear that the initial value selected for will determine the accuracy of the NN technique in various environments. Where the value of remains below the number of associated satellites, the measured density will increase with increasing values of . Subsequently in our comparison with the VT method, the peak over densities returned from the th-nearest neighbour would be reduced if, for example, only the rd-nearest neighbour were used. However, with a larger value of the NN method will lose resolution and become more susceptible to the projected separations between distinct overdense regions, influencing the density result.
In contrast, the VT method does not suffer from these issues, as essentially the number of neighbours used to define the density are not fixed. From the methodology of using the VT algorithm (Section 3.1) it is evident that one does not need to necessarily categorise each galaxy into a group or cluster, but can instead simply measure the surface density of that galaxy directly from the properties of its Voronoi cell. Consequently the VT method is fully adaptable to changes in uniformity of the field and calculates densities on individual galaxy scales. Therefore the VT method represents a reliable and accurate alternative to the more well established NN density measure.
4 ANALYSIS
4.1 Far-infrared and control samples
As described in Section 2.1, we use the likelihood-ratio technique of Smith et al. (2011) to associate the far-infrared sources with their optical counterparts. This cross-matched sample is hereafter named ‘FIR’ (consisting of 2,265 objects) while simultaneously removing them from the Optical-9hr catalogue reducing this sample to objects (hereafter named ‘Optical’). These sub-samples are shown in Table 1, where they are also divided according to the number of galaxies with photometric and spectroscopic redshifts.
| Sample | Total Number | Number of Photo-z | Number of Spec-z | |
|---|---|---|---|---|
| FIR | 2,265 | 1,489 | 776 | |
| Optical | 127,250 | 123,730 | 3,520 |
In order to accurately compare how values differ between the FIR and Optical catalogues it is necessary to ensure that we are comparing like with like, such that the objects selected for comparison should be considered to be from the same population. By selecting a matched sample of galaxies based on their colour, SDSS band model apparent magnitude and redshift distributions we ensure that these properties have no influence on any differences in environmental density found between the two catalogues. This is achieved by gridding the field in four dimensions in order to incorporate all , , and parameter space, selecting matched objects as only those which share an associated grid space in all four planes. The choice of and colours are selected as we limit our Optical catalogue in the -band apparent magnitude. As explained in Section 2.2 and as shown in Taylor et al. (2011), colours provide a reasonable method of matching sources in terms of their stellar mass over the redshift range under investigation here, although we also investigate this further in Section 4.5. The grid elements applied to the total and colour distributions incorporate and magnitudes respectively in colour space. This difference reflects the larger range of the total colour distribution. Simultaneously, the and ranges have grid elements incorporating in redshift and in band magnitude.
All Optical sources that share an associated grid space with a FIR detection in all four planes are initially grouped as potential matches to those FIR objects. Then, within each grid space, a multiple of the potential matches (totalling three times the FIR sources in that grid space) are selected as matched objects. Selecting Optical matches equal to a multiple of the FIR sources in each grid element allows for a more robust comparison without sacrificing any similarities between their distributions. Any additional Optical or FIR sources that are not matched are discarded. The FIR sample contains considerably fewer objects than the Optical sample ( against ), therefore a large proportion of the Optical sample will not have an associated FIR object and thus will be lost from the final cross-match. This reduces the sample size to and for the Optical and FIR samples respectively.
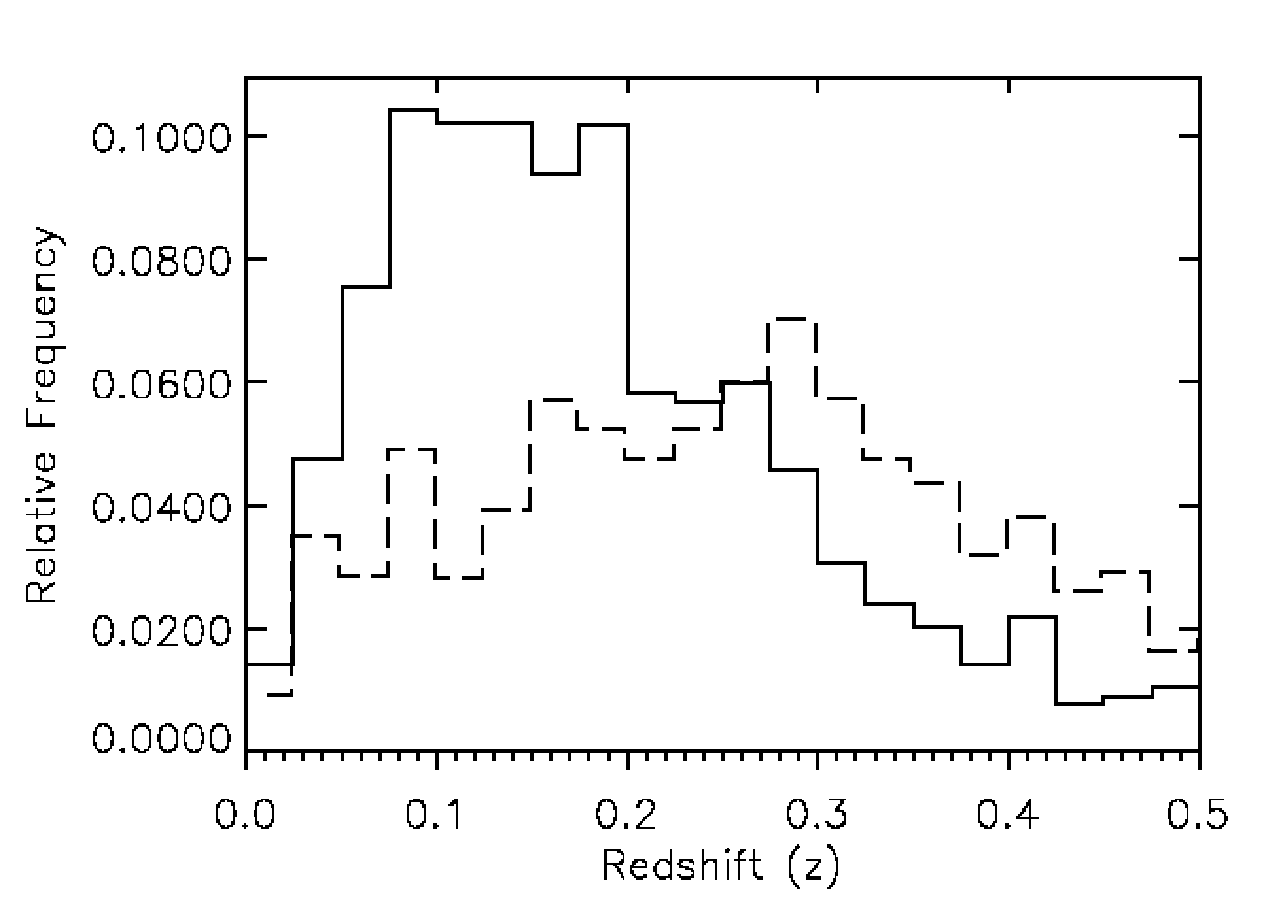
In addition, the number-density of galaxies reduces with increasing redshift to such an extent as to affect our sampling. Therefore we apply a maximum peak redshift limit onto the samples of . This maximum redshift does not influence the values of the remaining sample due to the fact that each value already incorporates the high redshift galaxies via the full z-PDF sampling achieved within the algorithm. Figures 4 & 5 show the colour, redshift and magnitude distributions for these two matched samples.
4.2 Comparison of the FIR and Optical samples
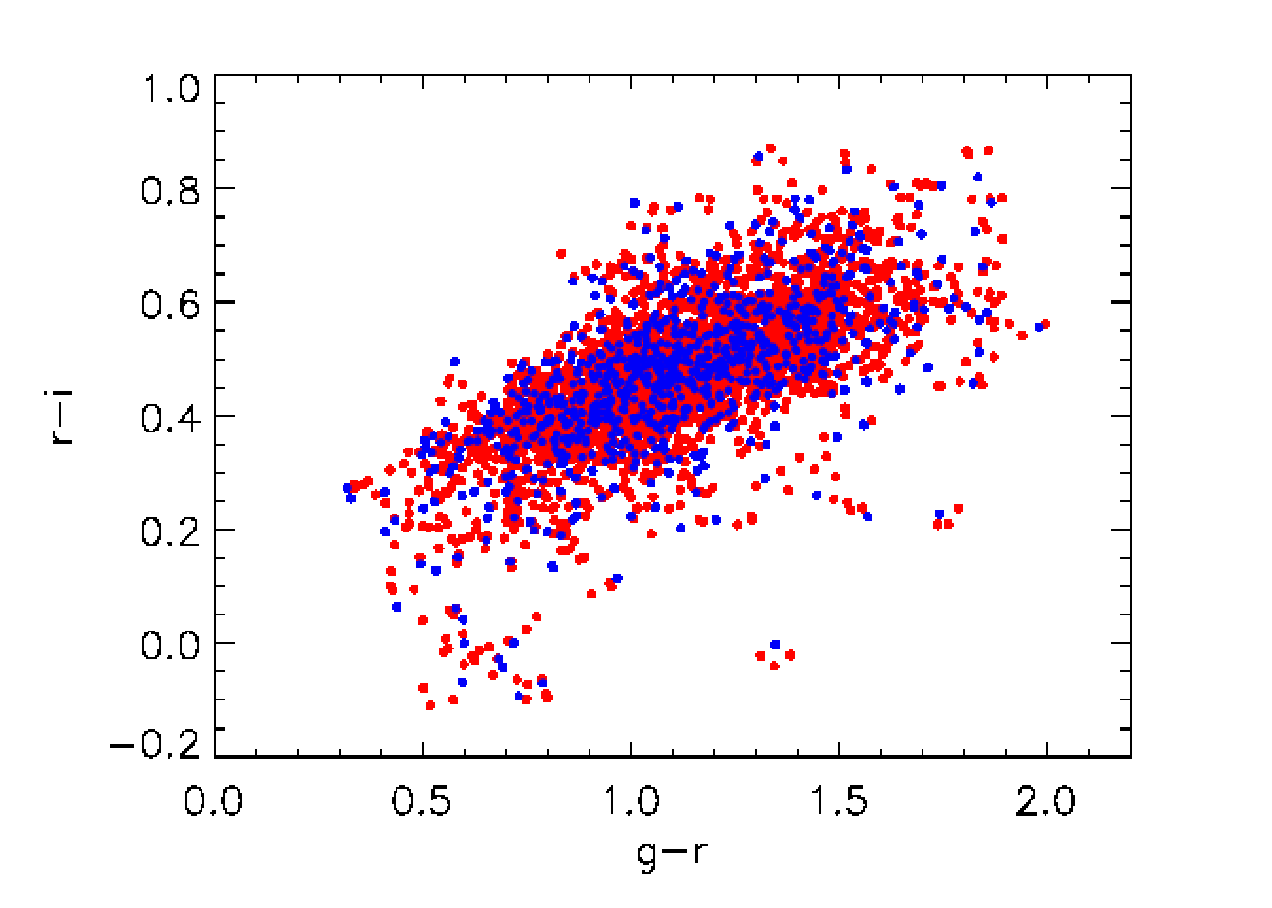
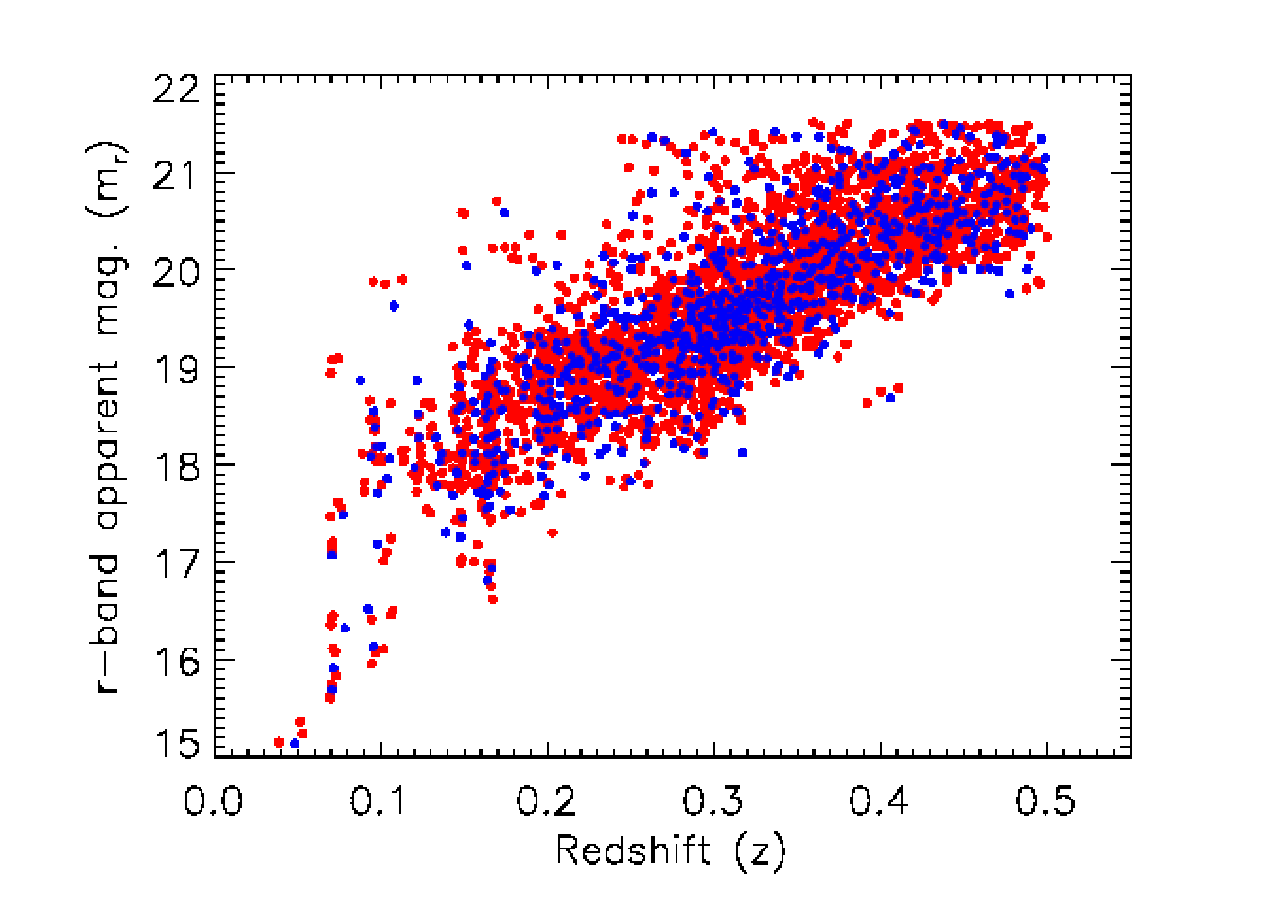
We use one- and two-dimensional Kolmogorov-Smirnoff tests (KS-tests) to confirm that our matched samples are consistent with having been drawn from the same underlying distribution in terms of their colour, magnitude and redshift distributions and that the various combinations are consistent with each other. These tests demonstrate that our null hypothesis, such that the ‘Optical’ control sample is drawn from the same underlying distribution as the FIR sample, cannot be rejected at a significant level. The results of these tests are presented in Table 2. We then applied the one-dimensional KS test to the environmental density measurements for the Optical and FIR samples (), which return a probability of just , rejecting the null hypothesis of them being drawn from the same underlying distribution at the level. Therefore we find a significant difference in the distribution of the galaxy environmental density between far-infrared selected galaxies and a control sample with no detectable far-infrared emission. To test this result further we applied a two-dimensional KS-test to both Optical and FIR populations comparing the environmental densities in conjunction with the optical properties and the redshifts. The two-dimensional KS-test comparing the colours, band magnitude and redshift distributions to the environmental density values are presented in Table 2 and show that the environmental densities of the FIR and Optical samples are significantly different in all cases.
| Distributions Compared | KS Prob. | MWU Prob. |
| vs | 0.999 | 0.403 |
| vs | 0.974 | 0.374 |
| vs | 0.395 | 0.239 |
| vs | 0.719 | 0.290 |
| vs | ||
| vs | 0.224 | - |
| vs | 0.956 | - |
| vs | 0.468 | - |
| vs | 0.755 | - |
| vs | 0.839 | - |
| vs | 0.339 | - |
| vs | 0.005 | - |
| vs | 0.005 | - |
| vs | 0.006 | - |
| vs | 0.010 | - |
| Redshift Slice | Optical | IR | KS Prob. | MWU Prob. |
|---|---|---|---|---|
| 680 | 227 | 0.028 | 0.028 | |
| 2,026 | 675 |
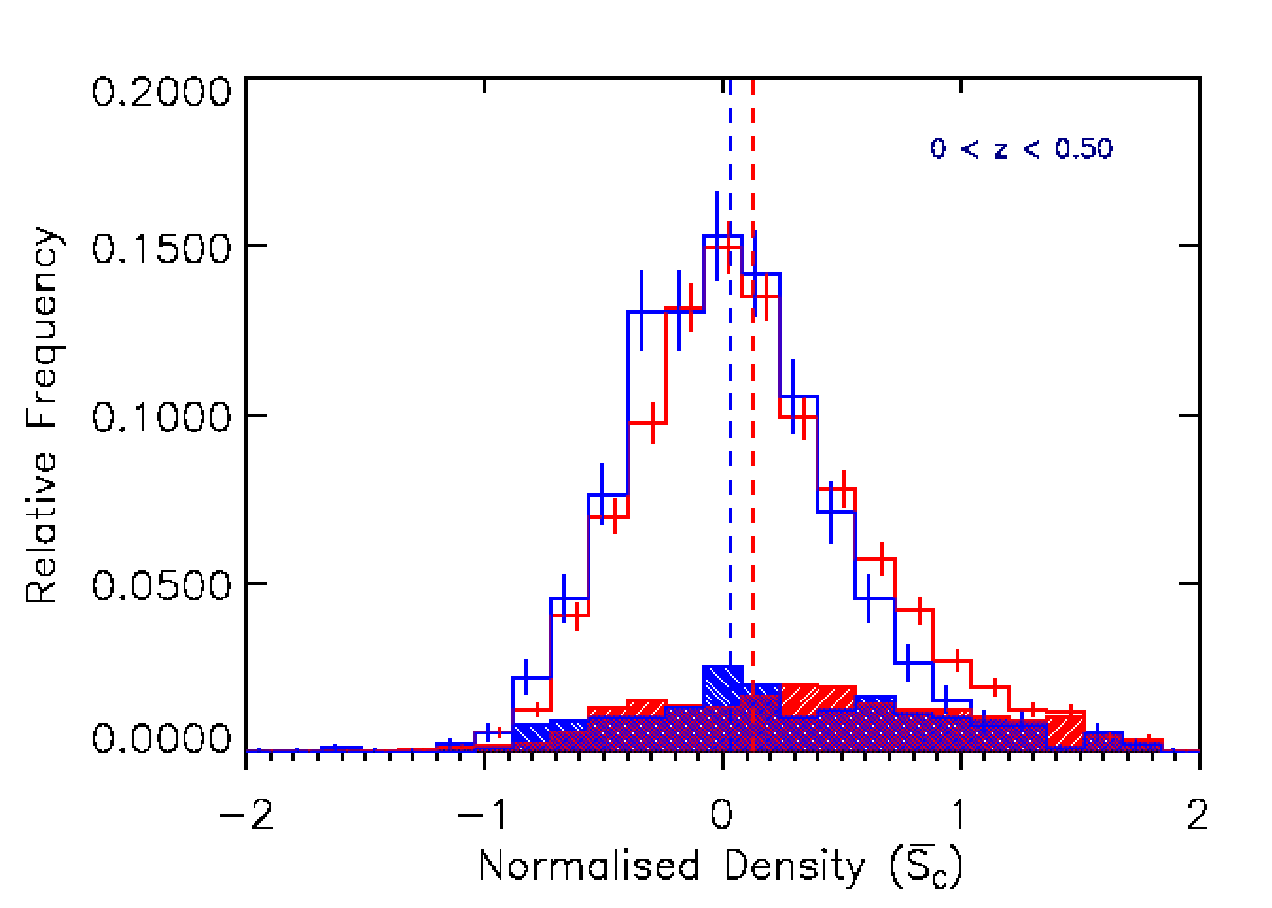
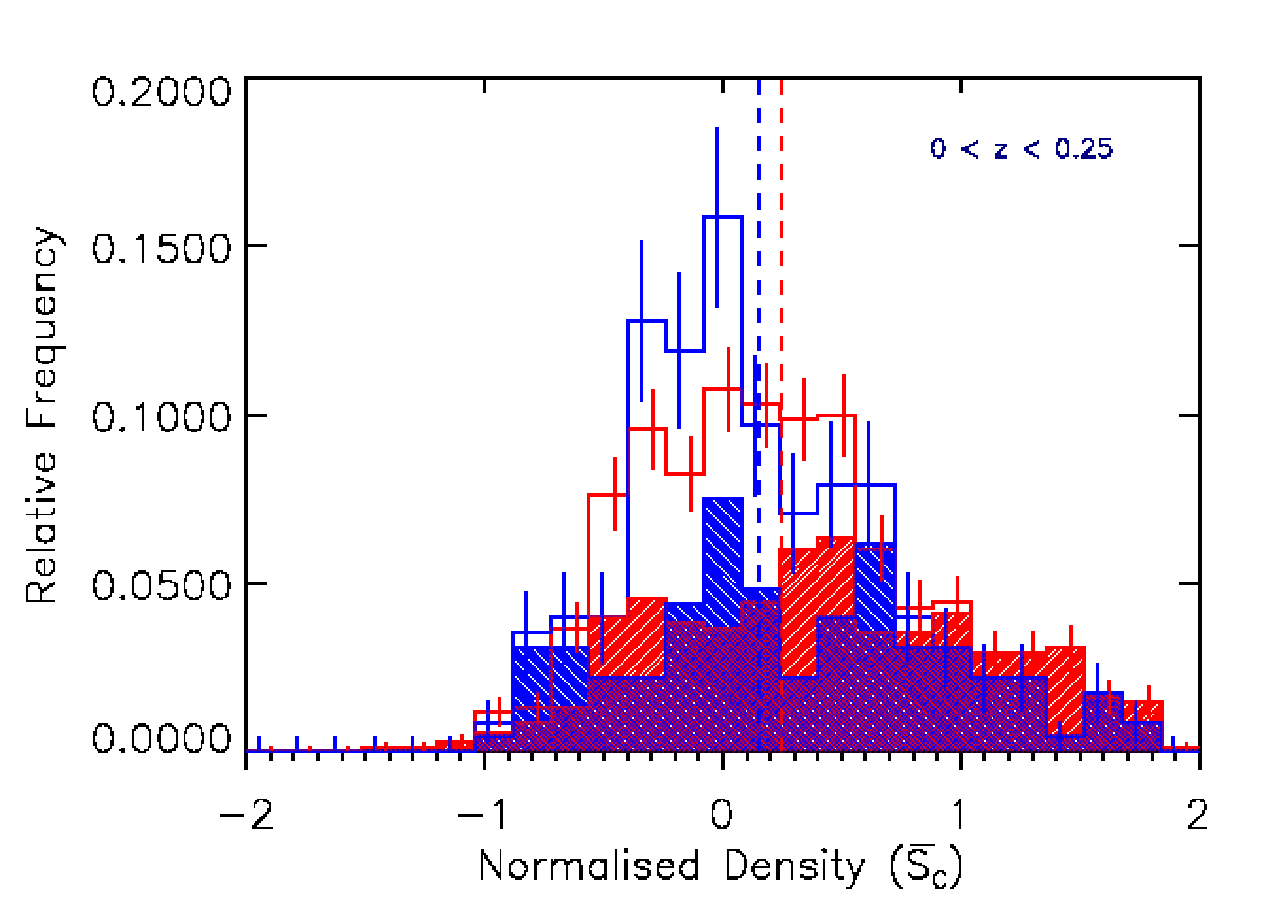
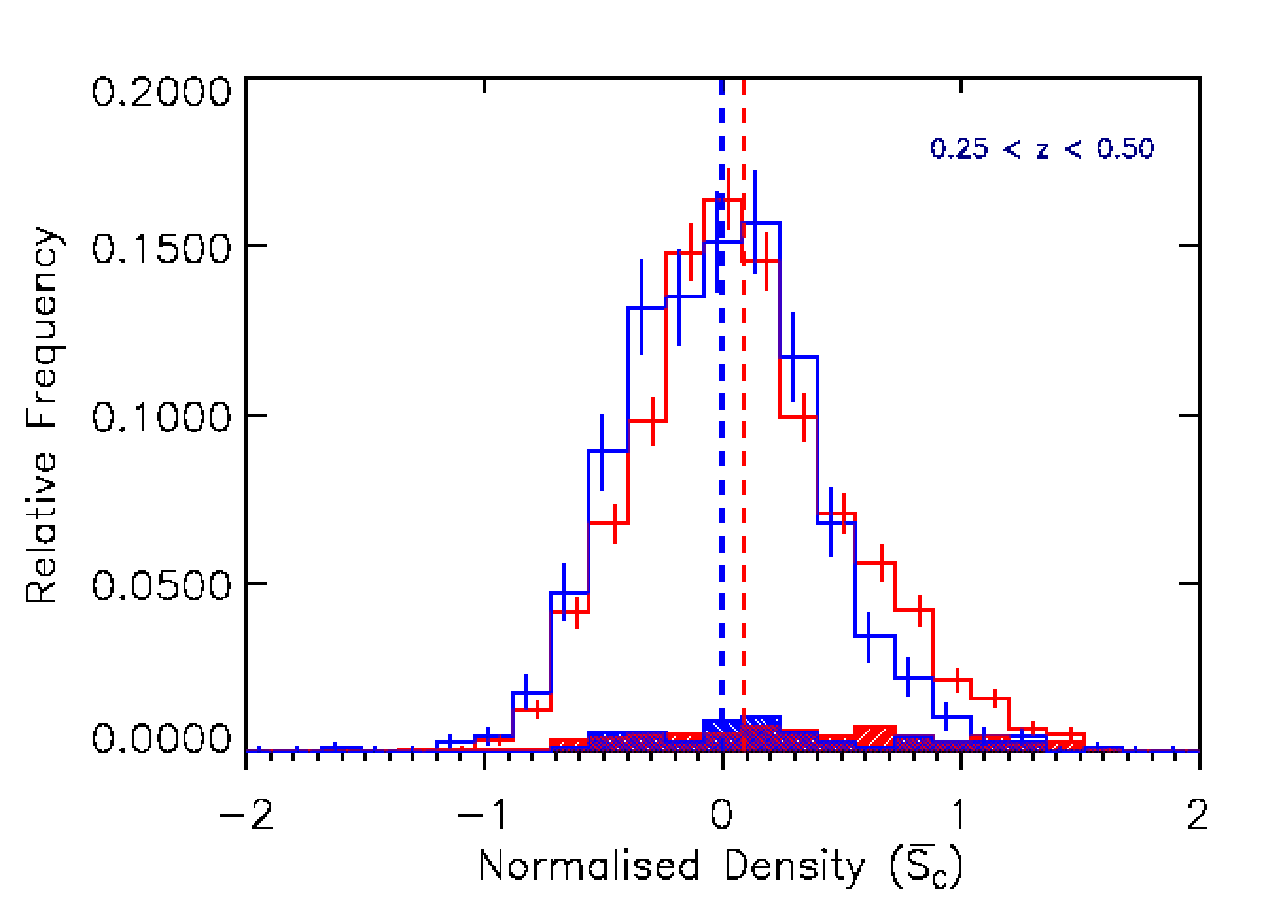
The extent of this difference is illustrated in Figure 6 where we show normalized histograms of the two environmental density distributions. It is clear that the Optical population (red), with the mean of its distribution at (denoted by the red dashed line), is more overdense (has larger values of ) than the FIR population (blue), with the mean of its distribution at (denoted by the blue dashed line). Using the Mann-Whitney U (MWU) test we also test for differences between the median values of the distributions. For the Optical and FIR populations the test returns a probability of , indicating that the two populations have significantly different median values at the level. In Section 4.6 we show the same result is returned when the NN method is used to calculate the environmental density, thus showing consistency with our VT result.
4.3 Redshift binning
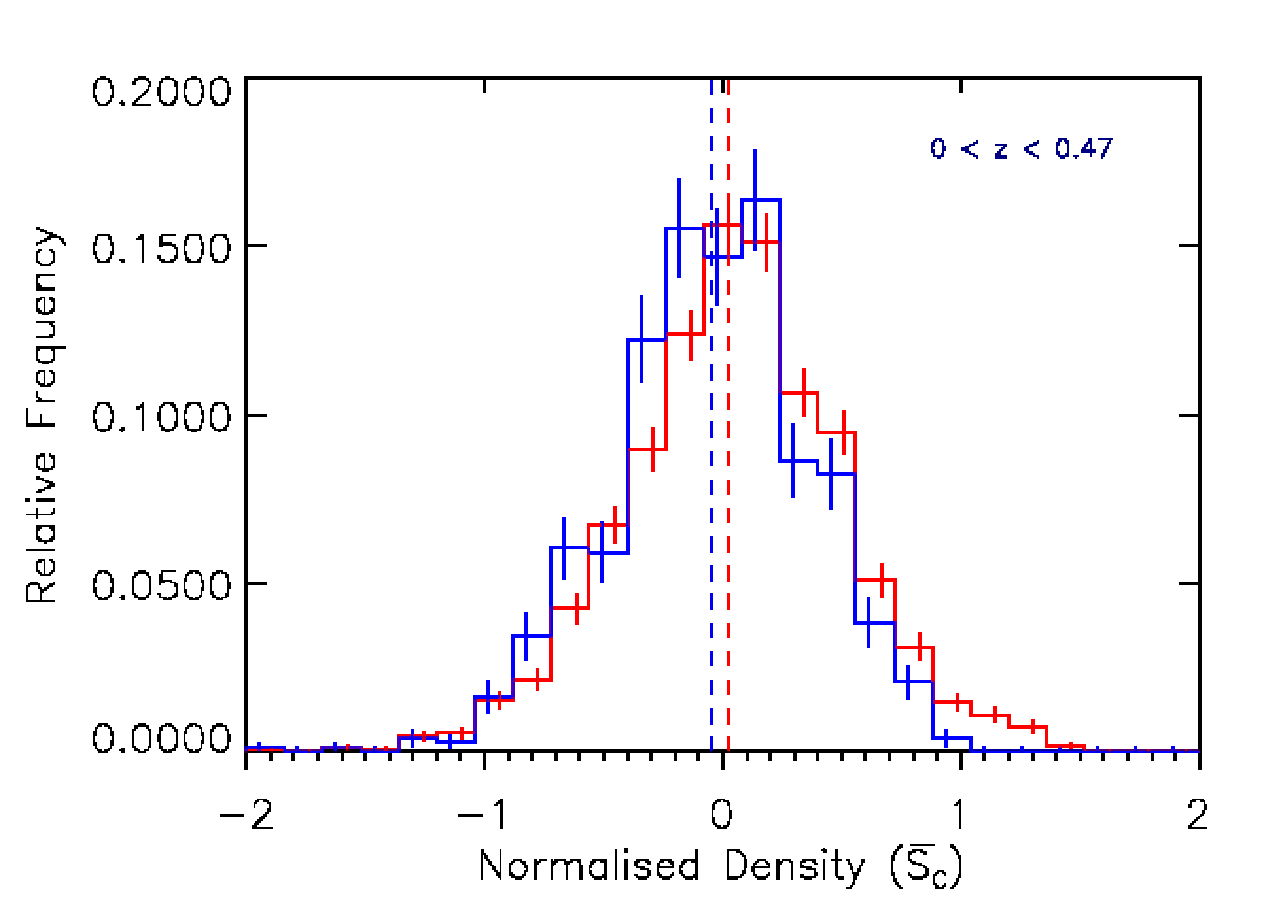
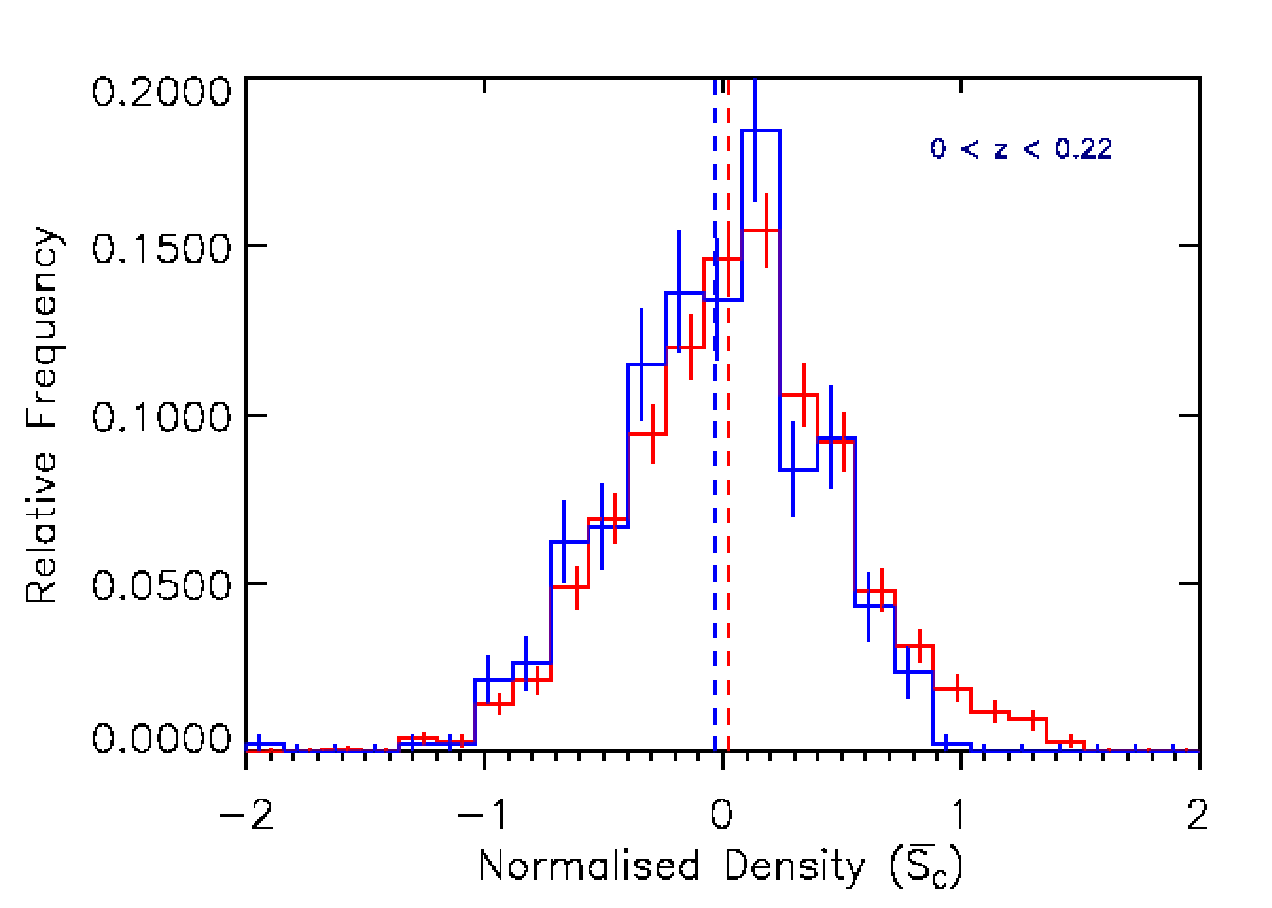
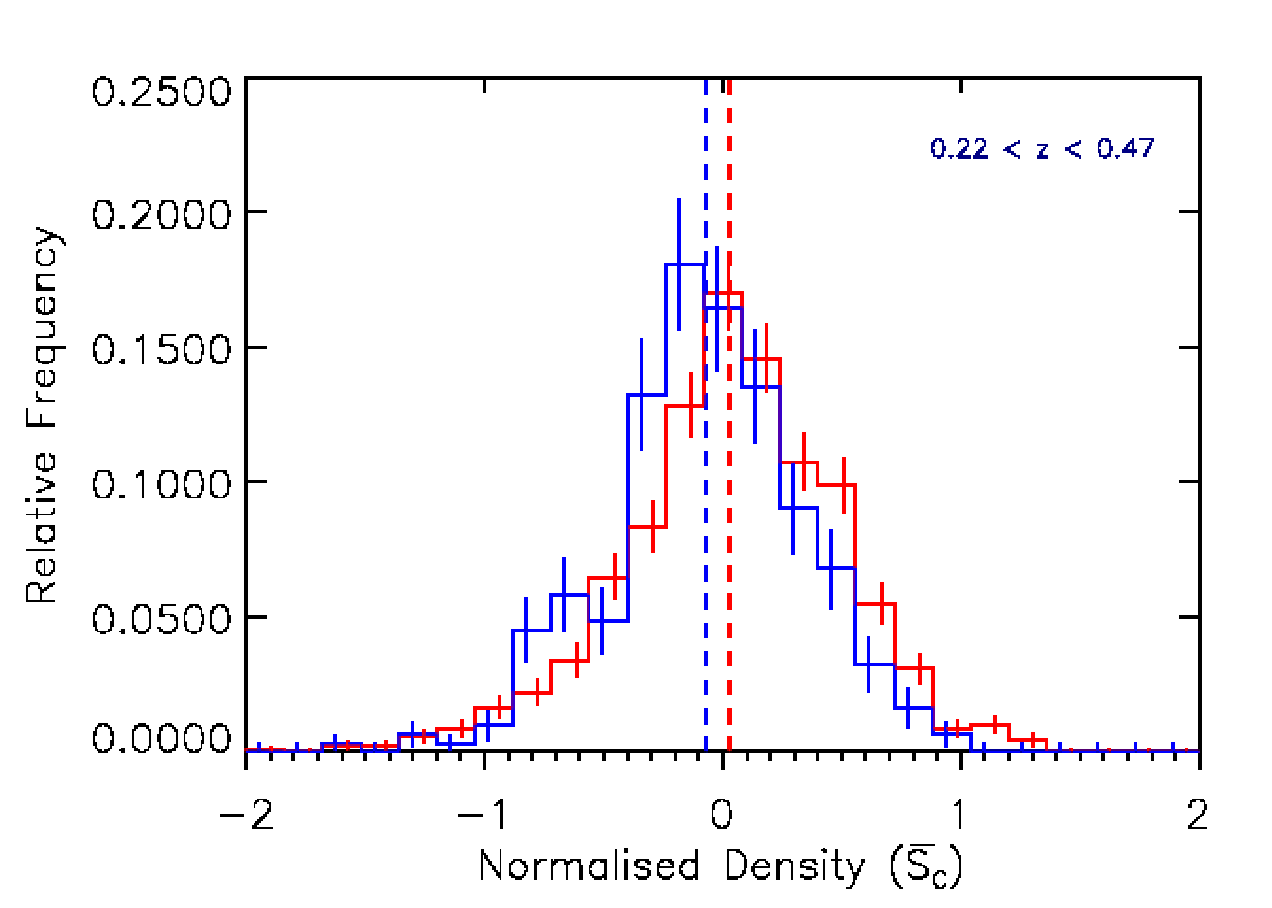
Clearly in any flux-density limited sample there is a bias in the sense that the higher-redshift sources are more luminous than those at lower redshift. Therefore, to further examine the difference between the Optical and FIR environmental density distributions we split the two populations into two redshift slices of and . The bin contains objects from the Optical population with objects from the FIR population and the bin contains objects from the Optical population and objects from the FIR population. The results of the KS-tests comparing the density measurements within these bins are shown in Table 3; these show that the null hypothesis can be rejected and the two populations can be considered different in terms of their overall density distributions at the 2.2 level for the low-redshift bin and level for the high-redshift bin. The MWU test returns probabilities of and for the low- and high-redshift bins respectively, also indicating that the two distributions have significantly different median values. These binned distributions are shown in Figure 6. Consistent results are found when the NN method is used to calculate the environmental density, as shown in Section 4.6.
| Distributions Compared | KS Prob. (A) | MWU Prob. (A) | KS Prob. (B) | MWU Prob. (B) | KS Prob. (C) | MWU Prob. (C) |
|---|---|---|---|---|---|---|
| vs | 0.999 | 0.484 | 0.911 | 0.359 | 0.324 | 0.372 |
| vs | 0.834 | 0.357 | 0.964 | 0.420 | 0.997 | 0.420 |
| vs | 0.054 | 0.057 | 0.998 | 0.453 | 0.999 | 0.474 |
| vs | 0.994 | 0.410 | 0.994 | 0.368 | 0.630 | 0.310 |
| vs | 0.009 | 0.009 | 0.006 |
These results show that, as with the full redshift range, objects in both redshift bins are significantly different in terms of their overall density distributions and their median values. However, it is evident that these statistical differences are higher in the higher-redshift bin and that this bin contains a larger number of objects in both samples. We investigate the impact of this difference in number density with increasing redshift by matching the number of galaxies in the higher and lower bins and repeating the sample comparisons. First, by increasing the redshift boundary between the higher and lower bins (from to ) to achieve approximate matching in sample sizes above and below this redshift. Second, by reducing the number of objects within the higher redshift bin to match exactly with the lower bin samples. In both cases we find that the same trends are found and our results remain the same.
With fewer objects in the lower redshift bin, the signal to noise will be lower at these redshifts, flattening the density distributions and affecting the comparison. Furthermore, at higher redshifts, objects with lower IR luminosities are excluded by the flux-density limit of the H-ATLAS survey. Thus, the density distribution of the less luminous far-infrared galaxies may actually be similar to the Optical population. In contrast the higher redshift bins contain a much higher proportion galaxies with higher levels of star formation and therefore exhibit a stronger correlation with density. The consequence of this bias is that the statistical differences found between the total Optical and FIR distributions (shown in Table 2) may be being diluted by galaxies with low SFRs at low redshift. In order to examine the full impact of these objects, in Section 4.4, we apply SFR bins to the FIR catalogue and repeat the above analysis.
4.4 Star-formation rate vs environmental density
The SFR of a galaxy can be estimated using the relation given in Kennicutt (1998) as proportional to the total IR luminosity () over 8-1000, assuming a Salpeter IMF between (Salpeter, 1955), such that:
| (2) |
The thermal emission of far-IR galaxies can be represented by a modified black body emission spectrum from Blain et al. (2003):
| (3) |
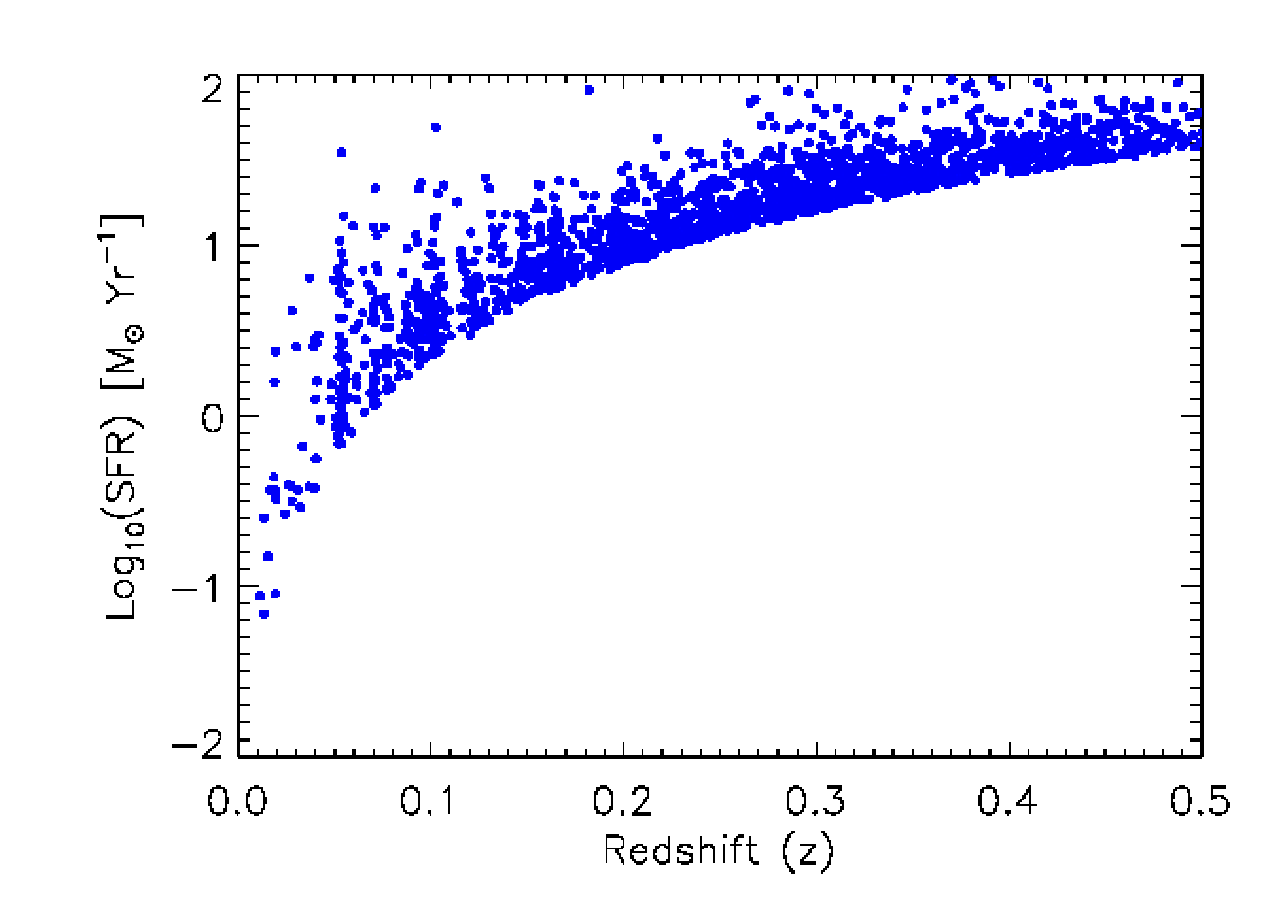
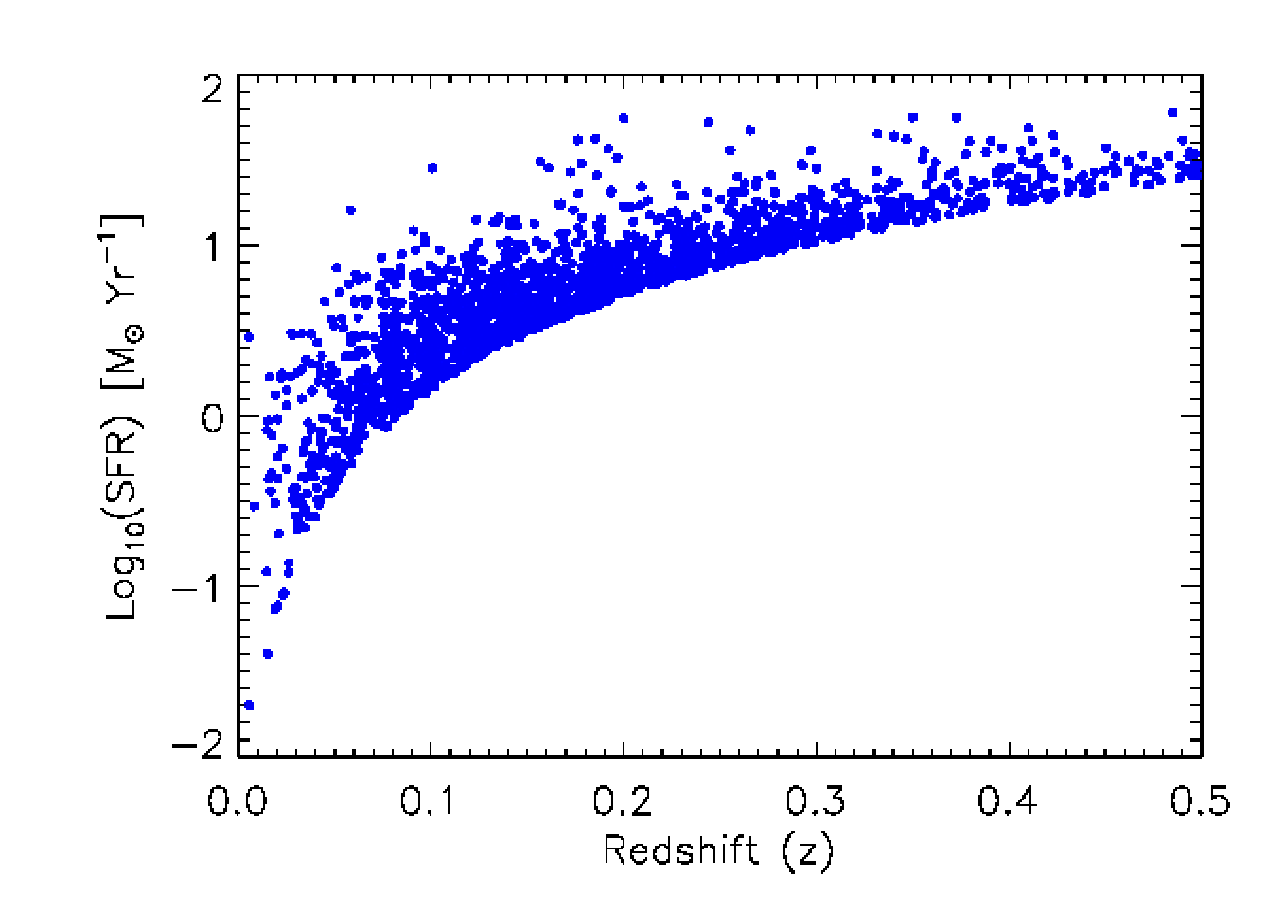
where is the Planck constant, is the Boltzmann constant, and represents the temperature. The emissivity index, modifies the Planck function by assuming that the dust emissivity varies as a power law with frequency, , where can be between 1-2 as described in Hildebrand (1983), depending on the frequency of the observations. We fix the dust emissivity index to with dust temperature () equal to 26 K as found by Dye et al. (2010) and Jarvis et al. (2010) and integrate the modified blackbody over the wavelength range m to obtain the far-infrared luminosity. We then use equation 2 to determine the SFR (in yr-1) for each galaxy (see Figure 7).
As a check of our values we compare the galaxies in our sample to the subset of objects with far-infrared luminosities determined from the full energy balance models of da Cunha et al. (2008) by Smith et al. (2012a). We find that our values are slightly underestimated, and a correction factor of is needed to produce a 1:1 correlation. This suggests that, as we are assuming a fixed dust temperature of 26 K, our estimate misses per cent of the total dust luminosity, and hence the SFRs are underestimated in our calculation. We therefore apply this correction factor to our values to account for this difference in our resultant SFRs. We note that this correction makes very little difference to our overall results on the relative environmental densities between different bins in SFR.
It is also worth noting that the SFRsestimated from FIR emission may be overestimates of the true SFR. We know that far-infrared emission is a tracer of star formation in an idealised case where young stars dominate the radiation field and dust opacity is high (Kennicutt et al. 2009). Multi-temperature dust distributions and emission from dust heated by older ISM stars (da Cunha et al., 2008; Smith et al., 2012a) are not be expected to be consistent with equation 2, and this also plays a part in our correction factor of 1.25. This must also be balanced against the fact that any unobscured component of star formation would not be detected in the FIR. Thus, although far-infrared emission is highly correlated with SFR we note that the absolute values of SFR should be used with caution.
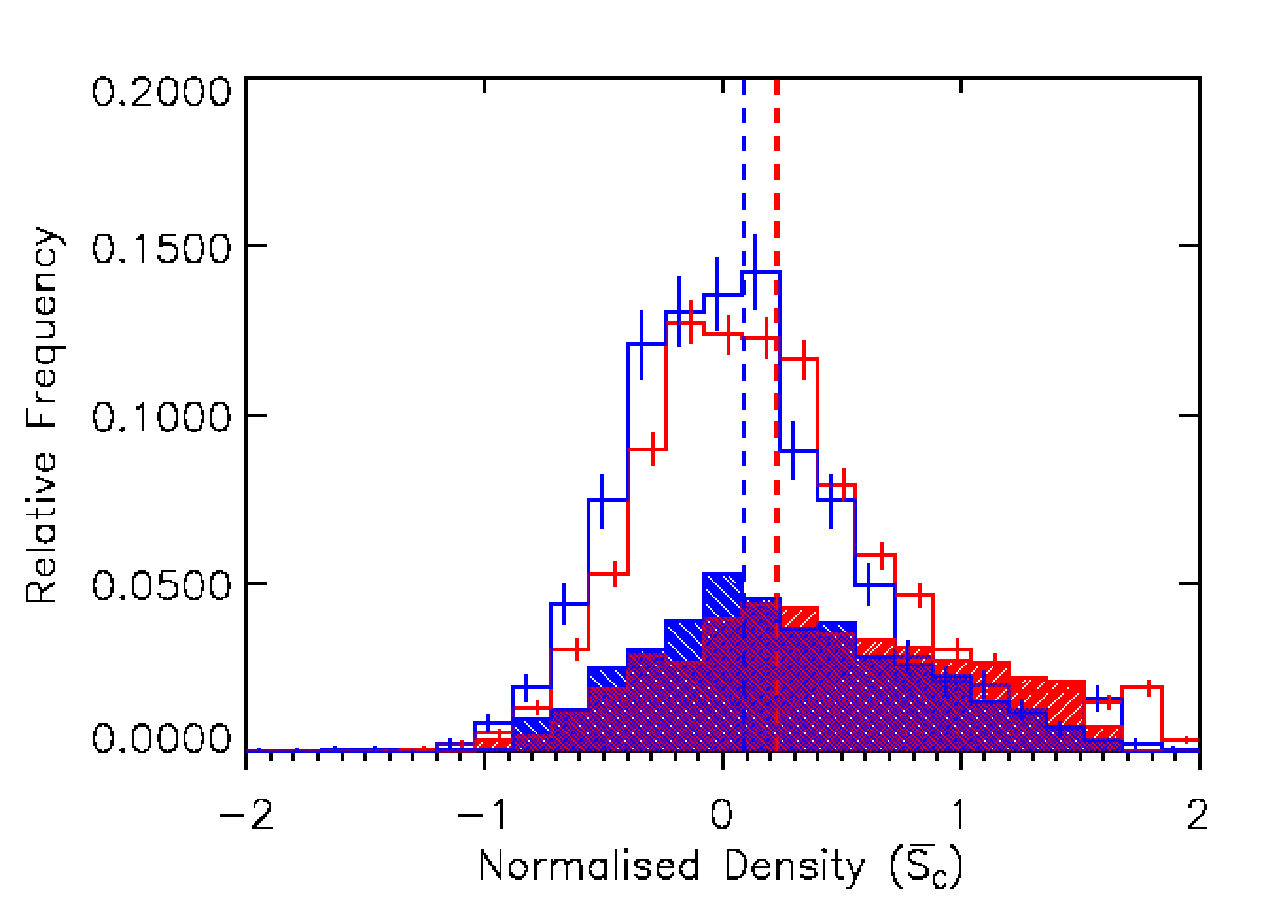
We bin the FIR objects in terms of their SFR in bins of , and yr-1 in order to compare the impact of different SFRs on our initial results. Again matching the control sample to the individual binned SFR samples we perform KS-tests and MWU-tests on all combinations. The results of these tests are shown in Table 4. From KS and MWU tests the density distributions for all our SFR bins are shown to be different; for SFR yr-1 the difference in environmental density is present at the 2.6 level for both the KS-test and the MWU test, for yr-1 the KS and MWU tests shows a difference at the 2.7 and 3.8 level, and for the SFR yr-1 the distributions are significantly different at the 3.3 and 4.8 levels, respectively.
This shows that the SFRs derived from the far-infrared emission of galaxies are strongly linked to the environmental density of the galaxy. Selecting only those galaxies with the highest SFRs results in an even more pronounced difference between the normalized density distributions of the Optical and FIR populations.
4.5 Dust reddening effects
| Distributions Compared | KS Prob. | MWU Prob. |
|---|---|---|
| vs | 0.996 | 0.489 |
| vs | 0.626 | 0.485 |
| vs | 0.136 | 0.137 |
| vs | ||
| vs | 0.493 | - |
| vs | 0.177 | - |
| vs | 0.313 | - |
| vs | - | |
| vs | - | |
| vs | - |
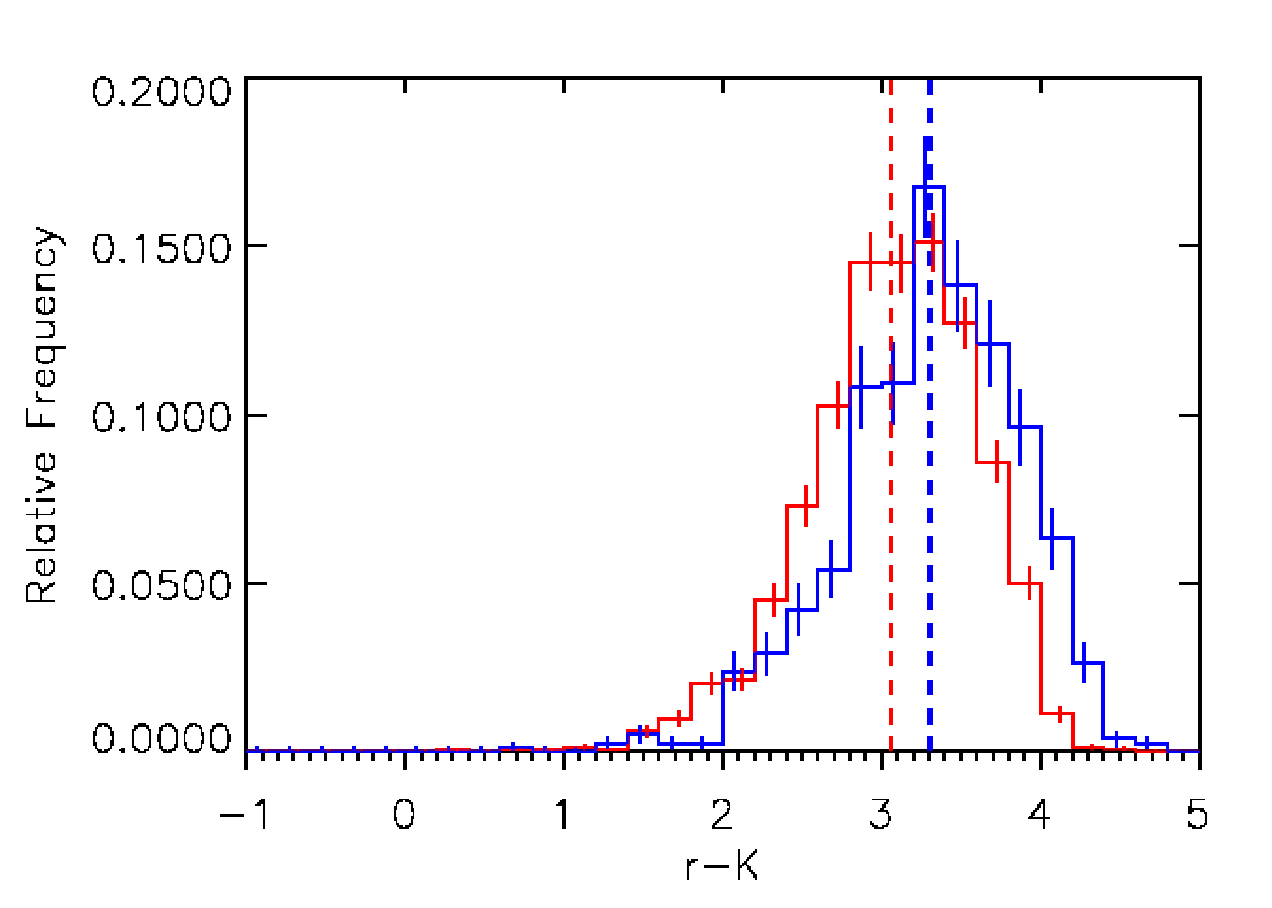
In our analysis we have only used the most sensitive optical bands to define our optical and far-infrared selected samples, due to the wealth of such data over the survey region used. However, we would expect that the galaxies which are detected in H-ATLAS to be subject to dust reddening effects, as we know that they must have significant amounts of dust in them to be detected in the first place. This could cause our Optical and FIR galaxies to be mismatched in terms of their intrinsic stellar colours and their stellar masses. To investigate this we include the band data from the UKIRT Infrared Sky Survey (Lawrence et al., 2007), which is available for many (but not all) of our sources. We did not use this initially as the number of galaxies with a band identification is less than the number which are identified in the , and bands. In Figure 8 we show a histogram of the colours of our matched sample of Optical (red) and FIR (blue) galaxies where, due to the smaller number of -band detections, the size of each sample is reduced to 2,139 and objects respectively. This shows that there is indeed a significant difference in the distributions between the Optical and FIR galaxies at a level, suggesting that dust reddening may well be biasing our results. However, this would only strengthen our results due to the fact that, as we cross-match in the band, the reddening we see in Figure 8 is caused by the FIR population having brighter band magnitudes than the Optical sample. Therefore, due to this reddening, we are likely to be overestimating the FIR band magnitudes and subsequently their masses. Given that we know more massive galaxies generally trace denser environments, correcting for this would lead to a larger difference between the Optical and FIR samples.
To test the rigour of our result we repeat our density analysis with Optical and FIR samples cross-matched in terms of , and parameter space. As this new cross-matching takes into consideration only three dimensions, the resultant number of objects considered matched in all three of these parameters is larger than in our initial four-dimensional cross-matching, with Optical and FIR objects. Applying KS and MWU tests to the data return probability values consistent with a significant difference between the environmental density distributions to the level, with the FIR population once more favouring underdense regions compared to the Optical sample with mean values of and respectively. Table 5 gives the results of the statistical comparison and the density distributions are plotted in Figure 9.
We do not extend on this analysis here as new data from the VISTA VIKING Survey (e.g. Findlay et al., 2012) over the full H-ATLAS fields will mean that the analysis presented here could be carried out with a band selected sample in the near future.
4.6 Comparison with nearest-neighbour
Applying the same KS and MWU statistical comparisons from Section 4.2 between our cross-matched FIR and Optical data sets, we find good agreement between the NN and the VT method; the two NN defined normalized density distributions () are significantly different, with a KS test probability of indicating a significant difference at the level. As with our VT method all other parameter comparisons show no significant difference as shown in Table 6. In further agreement with the results established using the VT method, the mean values of the two density distributions reveal that the cross-matched FIR catalogue contains objects with lower environmental densities than the Optical catalogue with mean values of and respectively. MWU tests reveal a significant difference between the median values at the 4.6 level. In addition, repeating the redshift binning from Section 4.3 returns consistent results such that differences are found in both bins increasing from 2 in the lowest bin to 3.3 in the higher bin.
| Distributions Compared | KS Prob. | MWU Prob. |
| vs | 0.999 | 0.403 |
| vs | 0.974 | 0.374 |
| vs | 0.395 | 0.239 |
| vs | 0.719 | 0.290 |
| vs | ||
| vs | 0.223 | - |
| vs | 0.956 | - |
| vs | 0.468 | - |
| vs | 0.755 | - |
| vs | 0.839 | - |
| vs | 0.339 | - |
| vs | 0.003 | - |
| vs | 0.003 | - |
| vs | 0.003 | - |
| vs | 0.004 | - |
5 Comparison With Semi-Analytic Models
In this section we use the semi-analytic models (SAMs) of Henriques et al. (2012), who construct pencil-beam synthetic light-cones for square areas (1.4 deg 1.4 deg) out to high redshift. These light-cones are based on the SAM of Guo et al. (2011) which itself is built upon previous SAMs, such as Croton et al. (2006), to take into account a full range of astrophysical processes; reionisation, cooling, disk size, star formation, supernovae feedback, satellites, gas stripping, mergers, bulge formation, black hole growth, feedback from active galactic nuclei (AGN), metal enrichment, dust extinction, stellar mass and the luminosity function. Each pencil-beam light-cone is constructed to account for the fact that each side of the co-moving Millennium Simulation box is equal to 500Mpc which is smaller than the co-moving distance of an object at . Therefore periodic replication of the simulation can lead to multiples of the same object being included due to discontinuities in large scale structure at the boundaries between replications (Kitzbichler & White, 2007).
5.1 SAM analysis
Here we apply our environmental density measurement to the mock catalogues of Henriques et al. (2012) in order to establish whether the same relationship between environmental density and SFR is found. Our results from Section 4 have shown there is a statistically significant difference between the density distributions of galaxies with and without obscured star formation (as traced by far-IR emission). This is such that galaxies with obscured star formation favour underdense regions while galaxies without star formation favour overdense regions.
We use all mock catalogues from Henriques et al. (2012), with additional data taken from the mock catalogue of Guo et al. (2011). The data are selected to span the same redshift range as our observed data (), however these catalogues do not initially contain any errors on their redshift values. Therefore in order to achieve similar redshift sampling as within our environmental density measurement in Section 3, it is necessary to apply a redshift error to each object based on matching the band magnitude () and photometric redshift () values to the observed data catalogue. This therefore establishes a likely value for the redshift error based on these parameters. This is achieved by cross-matching each Henriques & Guo (hereafter HG) object to the total Optical-9hr catalogue, locating all matches in band magnitude () and photometric redshift (). For each match, the photometric error from the Optical-9hr catalogue is applied as the redshift error to the HG object. Where a spectroscopic redshift is located, a standard error for a spectroscopic redshift () is applied, as in the initial analysis (Section 3). In addition, as with the observed data in Section 2.2, an apparent band magnitude cut was implemented removing all galaxies with magnitudes fainter than 21.5. The resultant number of objects across the HG catalogue totals objects. Applying our environmental density measure returns normalized environmental density values in comparison to a random field () for each object, as with our observed data in Section 3.2. However, due to the smaller field size (RA degrees and Dec degrees) the edge effect cuts imposed during the analysis have a greater impact on the number of sources cut from our HG catalogue, further reducing the catalogue to objects.
For our analysis it is first necessary to determine which galaxies in the simulated catalogue would have far-IR emission, and thus be detectable by the H-ATLAS survey. This is achieved by calculating the m flux for each object from the given SFR and redshift values given by the SAM. This is the direct reverse of the calculation in Section 4.4 where we calculate the SFR, assuming a temperature and emissivity index, from the m flux of each FIR galaxy. The average 5 m flux limit of the H-ATLAS observations ( mJy), taken from Rigby et al. (2011), provides an exact cut-off point for which a galaxy could be considered detectable in the survey. From here the HG catalogue could be split into IR and non-IR detected objects, equivalent to our FIR and Optical catalogues in our observed data analysis from Section 4.1. Objects with a m flux density greater than mJy are therefore considered detectable by H-ATLAS, hereafter called FIR-HG ( objects), and those with a m flux density less than mJy are not considered detectable by H-ATLAS and hereafter named Optical-HG ( objects).
As with our observed data in Section 4.1, a like with like cross-matching process is applied. We find objects from the Optical-HG population matched with objects from the FIR-HG population. Both of these cross-matched samples represent approximately the same percentage of their parent populations as found with our observed cross-matched samples from Section 4.1. This was such that the cross-matched Optical and Optical-HG samples represent per cent of their parent populations, with the FIR and FIR-HG samples representing and per cent respectively.
5.2 SAM statistical testing
We perform the same statistical analysis, as with our observed data in Section 4.2, i.e. applying one- and two-dimensional KS tests as well as MWU-tests to the two cross-matched populations, the results of which are given in Table 7. These values show, in agreement with our observed data in Section 4.2, that the null hypothesis can be rejected to at least the 4 level for the normalized environmental density () of the Optical-HG and FIR-HG populations. All other parameter comparisons cannot be considered significantly different at any reliable statistical level (e.g. ).
The two density distributions are shown in Figure 10 (left). As expected, it is the FIR-HG population (blue), with the mean of its distribution at (blue dashed line), that is biased towards underdense regions, while the Optical-HG population (red), with the mean of its distribution at (red dashed line), shows a bias towards overdense regions. Errors included on each bin are small and support the difference found between the distributions. It is worth noting that if we do not include simulated photometric errors and treat the SAM redshift values as precise, the resultant distributions exhibit a much larger spread in values. Inclusion of photometric errors evidently reduces this spread by essentially ‘washing out’ the density structure we are trying to recover. However, when precise redshifts values are used we find the same correlations are found between the Optical-HG and FIR-HG populations, despite the increased spread, with both populations exhibiting a significant difference.
| Distributions Compared | KS Prob. | MWU Prob. |
| vs | 0.658 | 0.318 |
| vs | 0.990 | 0.452 |
| vs | 0.198 | 0.172 |
| vs | 0.237 | 0.125 |
| vs | ||
| vs | 0.131 | - |
| vs | 0.751 | - |
| vs | 0.278 | - |
| vs | 0.081 | - |
| vs | 0.343 | - |
| vs | 0.090 | - |
| vs | - | |
| vs | - | |
| vs | 0.002 | - |
| vs | 0.001 | - |
| Redshift Slice | Optical | IR | KS Prob. | MWU Prob. |
|---|---|---|---|---|
| 1,273 | 418 | 0.020 | 0.003 | |
| 911 | 310 |
| Distributions Compared | KS Prob. (A) | MWU Prob. (A) | KS Prob. (B) | MWU Prob. (B) | KS Prob. (C) | MWU Prob. (C) |
|---|---|---|---|---|---|---|
| vs | 0.175 | 0.201 | 0.310 | 0.277 | 0.344 | 0.443 |
| vs | 0.947 | 0.328 | 0.965 | 0.423 | 0.770 | 0.322 |
| vs | 0.125 | 0.090 | 0.057 | 0.080 | 0.958 | 0.360 |
| vs | 0.065 | 0.134 | 0.909 | 0.301 | 0.216 | 0.089 |
| vs | 0.450 | 0.098 | 0.001 | 0.001 | 0.004 |
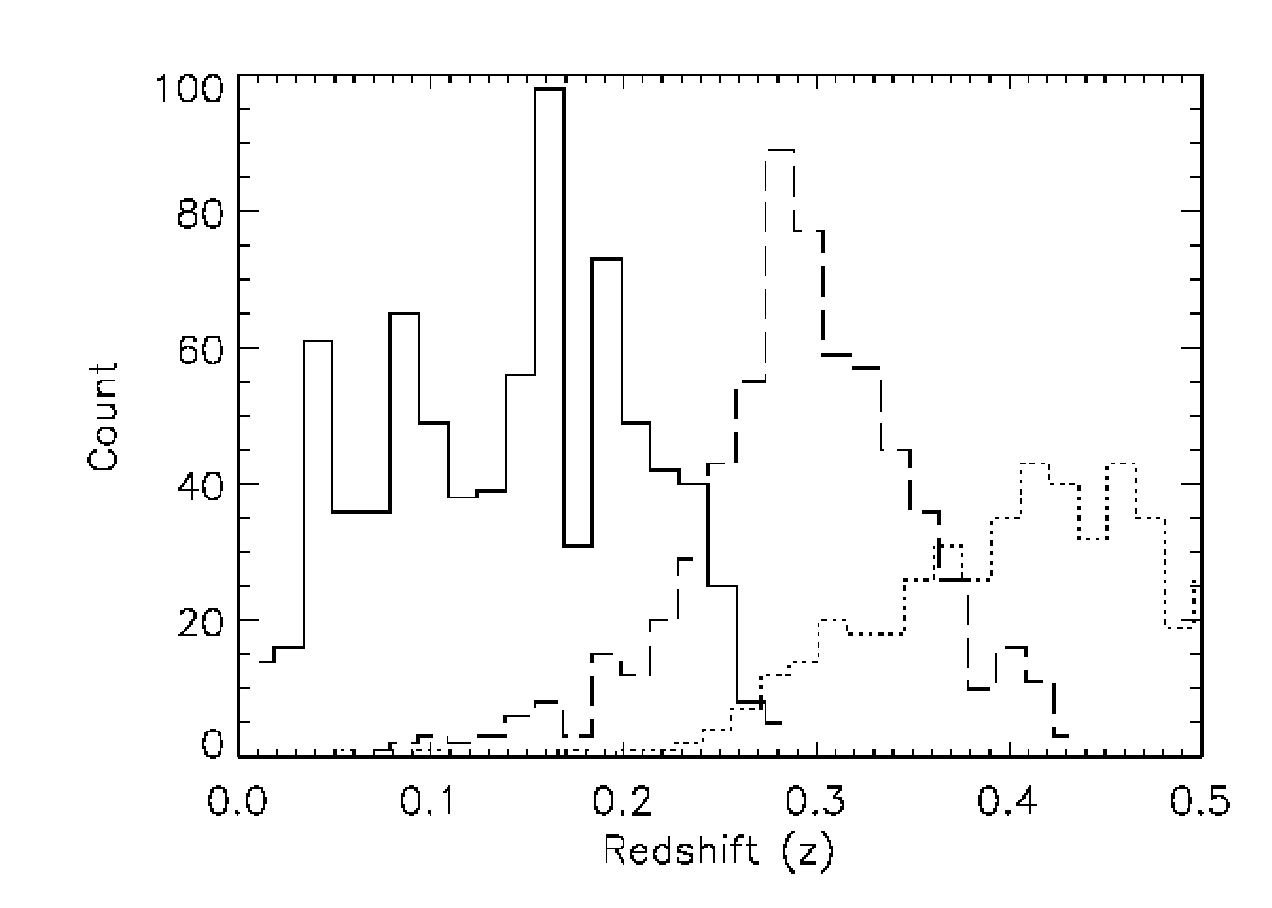
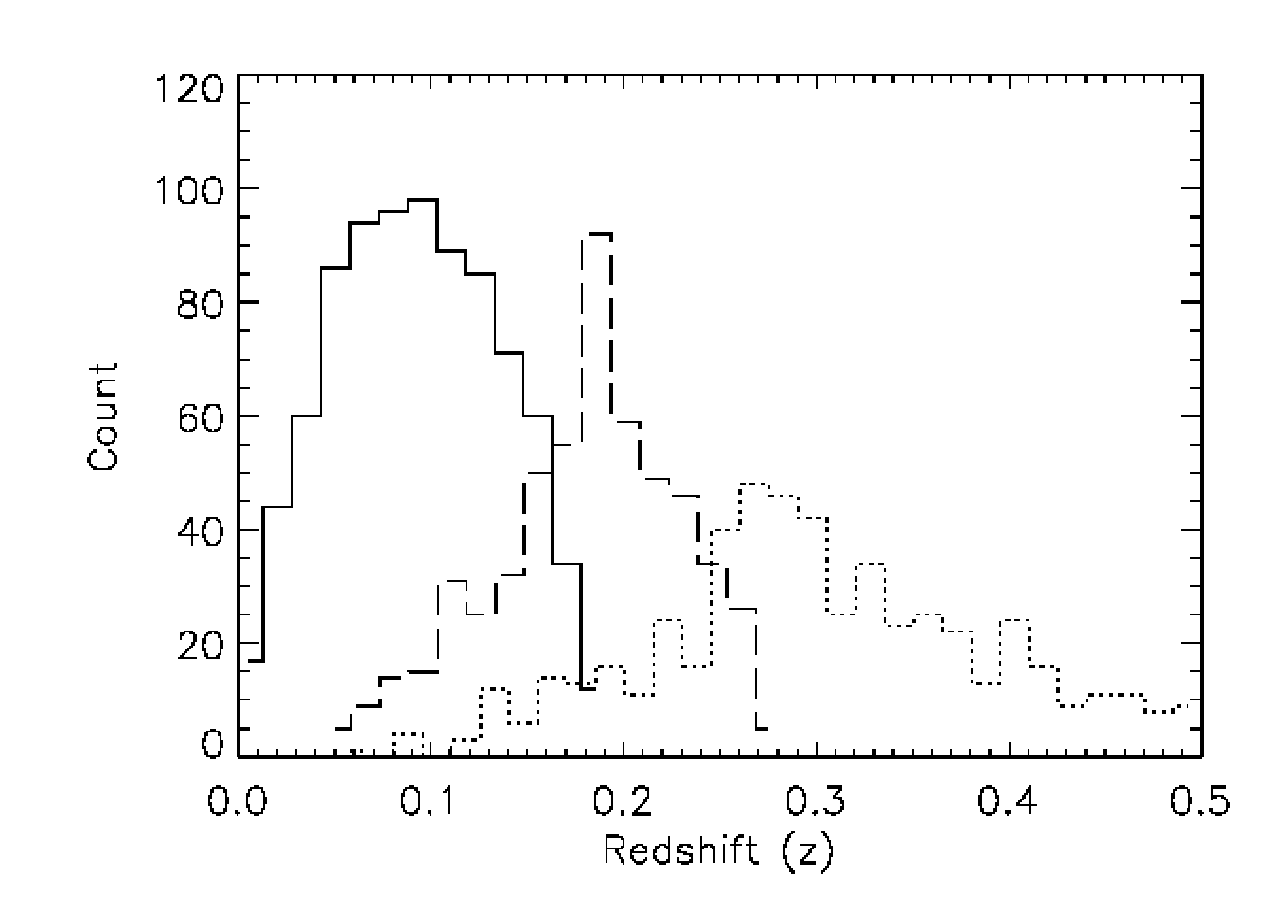
To further examine the difference found between the Optical-HG and FIR-HG populations we once more split the two populations into redshift bins, repeating the analysis from Section 4.3. Figure 11 shows the redshift distributions of both the FIR (dashed line) and FIR-HG (solid line) data. It is immediately clear that the FIR-HG population is primarily weighted towards lower redshifts with a mean value of () . Its number density falls off beyond reaching a maximum redshift of , short of the full redshift range of the FIR sample. In comparison the FIR population retains an approximately consistent number density across its entire redshift range with a mean value of () . Therefore it is necessary to adjust the redshift binning from that applied to the FIR data in Section 4.3 to account for this difference. Reducing the boundary between our higher and lower redshift bins from to , we bin the Optical-HG and FIR-HG populations, re-plotting histograms to represent the data within these redshift bins and reapplying KS-tests and MWU tests to the data. The redshift bins are plotted into normalized histograms displayed in Figure 10 and the KS and MWU test results from this redshift binning are given in Table 8. These statistical tests confirm that the same SFR-density trend with redshift is found as with our observational data analysis in Section 4.3.
This trend is found despite the differences between the redshift distributions of both observed and simulated FIR data sets (Figure 11). We determine that a galaxy constitutes part of the FIR-HG population by selecting objects based on their m flux, which is calculated from the individual SFR derived from the SAM of Guo et al. (2011). As noted in Section 4.4 our calculation of the SFR from the far-infrared luminosity is subject to a range of assumptions that may or may not be valid. Furthermore, the parameters used within the SAM to calculate SFR may also not accurately incorporate all of the physical processes that govern SFR. Detailed analyses of these effects are beyond the scope of this paper, therefore we adopt a conservative approach and consider that the results from the observations and the SAMs are in qualitative agreement.
5.3 Applying SFR limits to SAMs
Here we repeat the same SFR binning analysis from Section 4.4. Applying this stage of the analysis to the populations derived from SAMs allows us to further probe the differences between the simulated data and the data obtained observationally. The reduction in the number of FIR-HG objects between the low and high redshift bins is illustrated in Figure 12. This shows how the number density of the FIR-HG population falls off beyond , in comparison with our observed data in Figure 7. It is evident that the FIR-HG population has a higher fraction of sources at higher redshifts than FIR population. Due to the vast majority of the FIR-HG population residing below it is necessary to adjust the SFR binning parameters, from those applied to the FIR population, to narrower SFR ranges in order to achieve three comparative samples of this population. We therefore bin the FIR-HG objects in terms of their SFR in bins of , and yr-1. In agreement with our results in Section 4.4, we find that with higher levels of star formation, the statistical difference between the two populations from KS and MWU tests increases. Only in our lowest SFR bin ( yr-1) is no significant difference found between the Optical-HG and FIR-HG samples. These values are presented in Table 9.
Figure 12 shows how at higher SFRs the number density of objects reduces to such an extent that it makes further analysis unfeasible. Therefore it was not possible to introduce SFR bins at higher SFRs than 10 yr-1 to the analysis. Despite this, some key conclusions can be made with regards to the Optical-HG/ FIR-HG comparison based on the three SFR bins applied to the data. This analysis has shown that, for galaxies with SFRs higher than 5 yr-1, there is a statistically significant difference between both of the distributions and that this statistical difference becomes more pronounced in these higher SFR bins as a result of removing lower star-forming objects from the comparison. From finding no statistical difference between the density distributions of the Optical-HG and FIR-HG populations when SFRs are less than 5 yr-1 to finding a significant difference to at least the 3 level in higher SFR bins.
5.4 Application of NN to SAMs
We again test the th-nearest neighbour against our Voronoi Tessellation methods. We apply the NN method to our analysis of semi-analytic models. Following the same processes from Sections 5.1 and 5.2 we apply our algorithm, changed to incorporate the NN method, to the total HG catalogue, again dividing the output according to the H-ATLAS flux limit and cross-matching in , , and parameter space. This, once more, provides two catalogues representative of optical and far-infrared (Optical-HG and FIR-HG) that can be accurately compared to analyse differences in density.
We find that our results match those of Section 5.2, with KS and MWU test results finding a significant difference between the normalized densities of the Optical-HG and FIR-HG populations only (Table 10). With a KS-test and MWU-test probabilities of indicating a significant difference at the level in both cases. The mean values of each distribution lie at () for the Optical-HG and () for the FIR-HG indicating that the Optical-HG population occupy generally more overdense regions in agreement with our study using VT.
| Distributions Compared | KS Prob. | MWU Prob. |
| vs | 0.658 | 0.318 |
| vs | 0.990 | 0.452 |
| vs | 0.198 | 0.172 |
| vs | 0.237 | 0.125 |
| vs | ||
| vs | 0.131 | - |
| vs | 0.751 | - |
| vs | 0.278 | - |
| vs | 0.081 | - |
| vs | 0.343 | - |
| vs | 0.090 | - |
| vs | - | |
| vs | - | |
| vs | 0.001 | - |
| vs | - |
6 Discussion
The increased statistical separation between the Optical and FIR density distributions, found with both increasing redshift and increasing SFR, provides a clue to the role of environment in the evolution of galaxies over the redshift range (). We find a clear segregation in the galaxy environmental density between far–infrared-detected sources and those galaxies that are matched in terms of optical colour, magnitude and redshift but devoid of detectable far-infrared emission. Moreover, we find that this segregation becomes more pronounced at brighter far-infrared luminosity (or SFR) or at higher redshift. Unfortunately our data precludes us from distinguishing between an evolutionary effect and one associated with the level of star formation activity.
It is important to note that the reliability criterion (), that we employ from Smith et al. (2011) to select optical counterparts to the FIR data, does not present a bias in our results. This potential bias is such that in denser regions, with an increased number of potential optical counterparts to a FIR object, the reliability parameter for that FIR object, as defined in Smith et al. (2012a), would reduce. In other words, in denser regions it potentially becomes more difficult to reliably associate the FIR detection with a unique optical source. Therefore the FIR object may be excluded leaving only the FIR detections in relatively low-density environments. We tested this bias by making a more inclusive cut to the FIR sample based on the minimum likelihood-ratio (LR) rather than the reliability criterion (R). Our FIR sample was therefore increased to include these previously missing sources. Upon repeating the analysis we found that we still obtained similarly significant differences between the FIR and Optical samples.
These results support previous studies that also suggest that the presence of star formation in a galaxy is negatively correlated with the density of its environment (e.g., Dressler 1980; Postman & Geller 1984; Dressler et al. 1997; Domínguez et al. 2001; Goto et al. 2003; Kauffmann et al. 2004; O’Mill et al. 2008; Lee et al. 2010). Our analysis has shown that this correlation holds on individual galaxy scales, and thus the processes responsible for this correlation must have influence at this level as well as on larger scales. In addition, our use of far-infrared observations mean our results are not affected by uncertainties associated with extinction or H to SFR conversions.
However, the exact mechanism responsible for the observed reduction of SFR with increase in density remains uncertain. Recent studies by Deng et al. (2011) and Wijesinghe et al. (2012) suggest that there is no trend with environment when restricting the SFR-density comparison to purely star-forming objects. They conclude, therefore, that the observed SFR-density correlation is due to the increasing fraction of passive galaxies across the total galaxy sample since . Deng et al. (2011) go further and suggest that the SFR-density relation is strongly colour dependent, with blue galaxies exhibiting a very weak correlation between environment and SFR. In contrast, they find red galaxies to exhibit strong correlation between environmental density and SFR attributing this to the increasing presence of red late-type morphologies. As our analysis has focused on the direct comparison of star formation properties with the individual environmental densities of each object, we have shown that there is a clear difference between the star-forming and passive population in our colour-matched samples in agreement with earlier work by Gómez et al. (2003) and Welikala et al. (2008).
Furthermore, we have carried out the same analysis on SAMs where we obtain a similar result, i.e. the environmental density distributions from the total simulated Optical-HG and FIR-HG populations were found to be significantly different at the 4 level. Qualitative agreement is also found when we bin in terms of both redshift and SFR.
7 Summary & Conclusions
We have compared the environmental and star formation properties of two populations of galaxies out to . For this analysis we have used optical spectroscopy and photometry from the GAMA 9hr survey (DR1 data) and SDSS, with far-infrared observations from the H-ATLAS SDP. We use Voronoi Tessellations to analyse the environmental densities of these galaxies on individual scales normalized to account for differences in the population density and uniformity across the redshift range due to the flux limit of the survey and the increasing volume sampled with increasing redshift.
The environmental density of the Optical and far-IR catalogues were then compared by initially matching the catalogues in multi-dimensional colour, magnitude and redshift space (, , , ) selecting a matched population of the Optical sources numbering three times that of the far-IR distribution, in order to obtain a robust comparison over . Our key results are:
-
1.
Objects with far-IR detected emission, and levels of star formation yr-1, reside in less dense environments than galaxies not detected at far-infrared wavelengths.
-
2.
The environmental density difference between the two far-IR and non-far-IR luminous galaxies also increases with redshift, with a 2.2 difference in the lower bin () and a 3.3 difference in the higher bin (), with the far-infrared detected galaxies again residing in less dense environments. In relation to this, we find an increasing separation between the density distributions with increasing SFR from 2.6, 2.7 and 3.3 respectively, although we note that we cannot distinguish redshift effects from luminosity effects in our flux-density limited sample.
-
3.
We find substantial differences between redshift distributions of both our observed and SAM far-infrared samples. This provides interesting indications on how recipes for star formation need to be modified within SAMs to improve their ability to model the observed universe.
-
4.
We also note that VT are a reliable and accurate method of calculating the environmental densities for individual galaxies. Indeed, the use of VT for this purpose may surpass the NN technique, as their improved resolution is able to measure more detailed density structure.
8 Acknowledgements
The Herschel-ATLAS is a project with Herschel, which is an
ESA space observatory with science instruments provided by
European-led Principal Investigator consortia and with important
participation from NASA. The H-ATLAS website is:
http://www.h-atlas.org/
GAMA is a joint European-Australasian project based around a
spectroscopic campaign using the Anglo- Australian Telescope. The GAMA
input catalogue is based on data taken from the Sloan Digital Sky
Survey and the UKIRT Infrared Deep Sky Survey. Complementary imaging
of the GAMA regions is being obtained by a number of independent
survey programs including GALEX MIS, VST KIDS, VISTA VIKING, WISE,
Herschel-ATLAS, GMRT and ASKAP providing UV to radio coverage. GAMA is
funded by the STFC (UK), the ARC (Australia), the AAO, and the
participating institutions. The GAMA website is:
http://www.gama-survey.org/
References
- Adelberger & Steidel (2000) Adelberger, K. L. & Steidel, C. C. 2000, ApJ, 544, 218
- Baldry et al. (2010) Baldry, I. K., et al. 2010, MNRAS, 404, 86
- Balogh et al. (2004) Balogh, M., et al. 2004, MNRAS, 348, 1355
- Balogh et al. (1997) Balogh, M. L., Morris, S. L., Yee, H. K. C., Carlberg, R. G., & Ellingson, E. 1997, ApJL, 488, L75+
- Balogh et al. (1998) Balogh, M. L., Schade, D., Morris, S. L., Yee, H. K. C., Carlberg, R. G., & Ellingson, E. 1998, ApJL, 504, L75+
- Barnes & Hernquist (1992) Barnes, J. E. & Hernquist, L. 1992, ARA&A, 30, 705
- Bendo et al. (2012) Bendo, G. J., et al. 2012, MNRAS, 419, 1833
- Bendo et al. (2010) Bendo, G. J., et al. 2010, A&A, 518, L65
- Blain et al. (2003) Blain, A. W., Barnard, V. E., & Chapman, S. C. 2003, MNRAS, 338, 733
- Boselli & Gavazzi (2006) Boselli, A. & Gavazzi, G. 2006, PASP, 118, 517
- Bregman et al. (1998) Bregman, J. N., Snider, B. A., Grego, L., & Cox, C. V. 1998, ApJ, 499, 670
- Buat et al. (2010) Buat, V., et al. 2010, MNRAS, 409, L1
- Calzetti & Heckman (1999) Calzetti, D. & Heckman, T. M. 1999, ApJ, 519, 27
- Cooper et al. (2005) Cooper, M. C., Newman, J. A., Madgwick, D. S., Gerke, B. F., Yan, R., & Davis, M. 2005, ApJ, 634, 833
- Coppin et al. (2011) Coppin, K. E. K., et al. 2011, MNRAS, 416, 680
- Cortese et al. (2010a) Cortese, L., et al. 2010a, A&A, 518, L63
- Cortese et al. (2008) Cortese, L., Boselli, A., Franzetti, P., Decarli, R., Gavazzi, G., Boissier, S., & Buat, V. 2008, MNRAS, 386, 1157
- Cortese et al. (2010b) Cortese, L., et al. 2010b, A&A, 518, L49
- Croton et al. (2006) Croton, D. J., et al. 2006, MNRAS, 365, 11
- Cucciati et al. (2010) Cucciati, O., et al. 2010, A&A, 524, A2
- da Cunha et al. (2008) da Cunha, E., Charlot, S., & Elbaz, D. 2008, MNRAS, 388, 1595
- Dariush et al. (2011) Dariush, A., et al. 2011, MNRAS, 418, 64
- Davies et al. (2010) Davies, J. I., et al. 2010, A&A, 518, L48
- Davies et al. (2012) Davies, J. I., et al. 2012, MNRAS, 419, 3505
- Deng et al. (2011) Deng, X.-F., Chen, Y.-Q., & Jiang, P. 2011, MNRAS, 417, 453
- Diehl & Statler (2006) Diehl, S. & Statler, T. S. 2006, MNRAS, 368, 497
- Domínguez et al. (2001) Domínguez, M., Muriel, H., & Lambas, D. G. 2001, AJ, 121, 1266
- Dressler (1980) Dressler, A. 1980, ApJ, 236, 351
- Dressler et al. (1997) Dressler, A., et al. 1997, ApJ, 490, 577
- Driver et al. (2007) Driver, S. P., Allen, P. D., Liske, J., & Graham, A. W. 2007, ApJL, 657, L85
- Driver et al. (2011) Driver, S. P., et al. 2011, MNRAS, 413, 971
- Dunne et al. (2003) Dunne, L., Eales, S., Ivison, R., Morgan, H., & Edmunds, M. 2003, Nature, 424, 285
- Dunne et al. (2011) Dunne, L., et al. 2011, MNRAS, 417, 1510
- Dunne et al. (2009) Dunne, L., et al. 2009, MNRAS, 394, 1307
- Dye et al. (2010) Dye, S., et al. 2010, A&A, 518, L10
- Eales et al. (2010) Eales, S., et al. 2010, PASP, 122, 499
- Feruglio et al. (2010) Feruglio, C., et al. 2010, ApJ, 721, 607
- Findlay et al. (2012) Findlay, J. R., Sutherland, W. J., Venemans, B. P., Reylé, C., Robin, A. C., Bonfield, D. G., Bruce, V. A., & Jarvis, M. J. 2012, MNRAS, 419, 3354
- Finn et al. (2010) Finn, R. A., et al. 2010, ApJ, 720, 87
- Fixsen et al. (1998) Fixsen, D. J., Dwek, E., Mather, J. C., Bennett, C. L., & Shafer, R. A. 1998, ApJ, 508, 123
- Gay et al. (2010) Gay, C., Pichon, C., Le Borgne, D., Teyssier, R., Sousbie, T., & Devriendt, J. 2010, MNRAS, 404, 1801
- Geach et al. (2011a) Geach, J. E., Ellis, R. S., Smail, I., Rawle, T. D., & Moran, S. M. 2011a, MNRAS, 413, 177
- Geach et al. (2011b) Geach, J. E., Murphy, D. N. A., & Bower, R. G. 2011b, MNRAS, 413, 3059
- Gomez et al. (2012) Gomez, H. L., et al. 2012, ApJ, 760, 96
- Gómez et al. (2003) Gómez, P. L., et al. 2003, ApJ, 584, 210
- Goto (2005) Goto, T. 2005, MNRAS, 360, 322
- Goto et al. (2003) Goto, T., Yamauchi, C., Fujita, Y., Okamura, S., Sekiguchi, M., Smail, I., Bernardi, M., & Gomez, P. L. 2003, MNRAS, 346, 601
- Griffin et al. (2010) Griffin, M. J., et al. 2010, A&A, 518, L3+
- Groves et al. (2012) Groves, B., et al. 2012, MNRAS, 426, 892
- Guo et al. (2011) Guo, Q., et al. 2011, MNRAS, 413, 101
- Haynes et al. (1984) Haynes, M. P., Giovanelli, R., & Chincarini, G. L. 1984, ARA&A, 22, 445
- Henriques et al. (2012) Henriques, B. M. B., White, S. D. M., Lemson, G., Thomas, P. A., Guo, Q., Marleau, G.-D., & Overzier, R. A. 2012, MNRAS, 2442
- Hernández-Fernández et al. (2012) Hernández-Fernández, J. D., Iglesias-Páramo, J., & Vílchez, J. M. 2012, ApJS, 199, 22
- Hildebrand (1983) Hildebrand, R. H. 1983, QJRAS, 24, 267
- Hill et al. (2011) Hill, D. T., et al. 2011, MNRAS, 412, 765
- Hirashita et al. (2003) Hirashita, H., Buat, V., & Inoue, A. K. 2003, A&A, 410, 83
- Hwang et al. (2010) Hwang, H. S., Elbaz, D., Lee, J. C., Jeong, W.-S., Park, C., Lee, M. G., & Lee, H. M. 2010, A&A, 522, A33
- Ibar et al. (2010) Ibar, E., et al. 2010, MNRAS, 409, 38
- Icke & van de Weygaert (1987) Icke, V. & van de Weygaert, R. 1987, A&A, 184, 16
- Jarvis et al. (2010) Jarvis, M. J., et al. 2010, MNRAS, 409, 92
- Kauffmann et al. (2004) Kauffmann, G., White, S. D. M., Heckman, T. M., Ménard, B., Brinchmann, J., Charlot, S., Tremonti, C., & Brinkmann, J. 2004, MNRAS, 353, 713
- Kennicutt (1998) Kennicutt, Jr., R. C. 1998, ARA&A, 36, 189
- Kennicutt et al. (2009) Kennicutt, Jr., R. C., et al. 2009, ApJ, 703, 1672
- Kim et al. (2000) Kim, R., Strauss, M., Bahcall, N., Gunn, J. E., Lupton, R. H., Vogeley, M. S., Schlegel, D., & the SDSS Collaboration. 2000, in Astronomical Society of the Pacific Conference Series, Vol. 200, Clustering at High Redshift, ed. A. Mazure, O. Le Fèvre, & V. Le Brun, 422–+
- Kitzbichler & White (2007) Kitzbichler, M. G. & White, S. D. M. 2007, MNRAS, 376, 2
- Lawrence et al. (2007) Lawrence, A., et al. 2007, MNRAS, 379, 1599
- Le Floc’h et al. (2005) Le Floc’h, E., et al. 2005, ApJ, 632, 169
- Lee et al. (2010) Lee, J. H., Lee, M. G., Park, C., & Choi, Y.-Y. 2010, MNRAS, 403, 1930
- Lewis et al. (2002) Lewis, I., et al. 2002, MNRAS, 334, 673
- Mac Low & Ferrara (1999) Mac Low, M. & Ferrara, A. 1999, ApJ, 513, 142
- Martini et al. (2007) Martini, P., Mulchaey, J. S., & Kelson, D. D. 2007, ApJ, 664, 761
- Miller et al. (2003) Miller, C. J., Nichol, R. C., Gómez, P. L., Hopkins, A. M., & Bernardi, M. 2003, ApJ, 597, 142
- Muldrew et al. (2012) Muldrew, S. I., et al. 2012, MNRAS, 419, 2670
- Nardini et al. (2008) Nardini, E., Risaliti, G., Salvati, M., Sani, E., Imanishi, M., Marconi, A., & Maiolino, R. 2008, MNRAS, 385, L130
- Neugebauer et al. (1984) Neugebauer, G., et al. 1984, ApJL, 278, L1
- Nordon et al. (2010) Nordon, R., et al. 2010, A&A, 518, L24
- O’Mill et al. (2008) O’Mill, A. L., Padilla, N., & García Lambas, D. 2008, MNRAS, 389, 1763
- Pascale et al. (2011) Pascale, E., et al. 2011, MNRAS, 415, 911
- Patel et al. (2013) Patel, H., Clements, D. L., Vaccari, M., Mortlock, D. J., Rowan-Robinson, M., Pérez-Fournon, I., & Afonso-Luis, A. 2013, MNRAS, 428, 291
- Pilbratt et al. (2010) Pilbratt, G. L., et al. 2010, A&A, 518, L1
- Poggianti et al. (2006) Poggianti, B. M., et al. 2006, ApJ, 642, 188
- Poglitsch et al. (2010) Poglitsch, A., et al. 2010, A&A, 518, L2+
- Postman & Geller (1984) Postman, M. & Geller, M. J. 1984, ApJ, 281, 95
- Puget et al. (1996) Puget, J.-L., Abergel, A., Bernard, J.-P., Boulanger, F., Burton, W. B., Desert, F.-X., & Hartmann, D. 1996, A&A, 308, L5
- Ramella et al. (2001) Ramella, M., Boschin, W., Fadda, D., & Nonino, M. 2001, A&A, 368, 776
- Rieke et al. (2004) Rieke, G. H., et al. 2004, ApJS, 154, 25
- Rigby et al. (2011) Rigby, E. E., et al. 2011, MNRAS, 415, 2336
- Rowlands et al. (2012) Rowlands, K., et al. 2012, MNRAS, 419, 2545
- Salpeter (1955) Salpeter, E. E. 1955, ApJ, 121, 161
- Schmitt et al. (2006) Schmitt, H. R., Calzetti, D., Armus, L., Giavalisco, M., Heckman, T. M., Kennicutt, Jr., R. C., Leitherer, C., & Meurer, G. R. 2006, ApJ, 643, 173
- Scoville et al. (2007) Scoville, N., et al. 2007, ApJS, 172, 1
- Silverman et al. (2009) Silverman, J. D., et al. 2009, ApJ, 695, 171
- Smith et al. (2012a) Smith, D. J. B., et al. 2012a, MNRAS, 427, 703
- Smith et al. (2011) Smith, D. J. B., et al. 2011, MNRAS, 416, 857
- Smith et al. (2012b) Smith, M. W. L., et al. 2012b, ApJ, 756, 40
- Soares-Santos et al. (2011) Soares-Santos, M., et al. 2011, ApJ, 727, 45
- Sugerman et al. (2006) Sugerman, B. E. K., et al. 2006, Science, 313, 196
- Symeonidis et al. (2011) Symeonidis, M., Page, M. J., & Seymour, N. 2011, MNRAS, 411, 983
- Symeonidis et al. (2013) Symeonidis, M., et al. 2013, MNRAS
- Taylor et al. (2011) Taylor, E. N., et al. 2011, MNRAS, 418, 1587
- Tekola et al. (2012) Tekola, A. G., Väisänen, P., & Berlind, A. 2012, MNRAS, 419, 1176
- van Breukelen & Clewley (2009) van Breukelen, C. & Clewley, L. 2009, MNRAS, 395, 1845
- van Breukelen et al. (2006a) van Breukelen, C., Clewley, L., & Bonfield, D. 2006a, ArXiv Astrophysics e-prints
- van Breukelen et al. (2006b) van Breukelen, C., et al. 2006b, MNRAS, 373, L26
- van de Weygaert & Icke (1989) van de Weygaert, R. & Icke, V. 1989, A&A, 213, 1
- Welikala et al. (2008) Welikala, N., Connolly, A. J., Hopkins, A. M., Scranton, R., & Conti, A. 2008, ApJ, 677, 970
- Wijesinghe et al. (2012) Wijesinghe, D. B., et al. 2012, MNRAS, 3150
- Willmer et al. (2009) Willmer, C. N. A., Rieke, G. H., Le Floc’h, E., Hinz, J. L., Engelbracht, C. W., Marcillac, D., & Gordon, K. D. 2009, AJ, 138, 146
- York et al. (2000) York, D. G., et al. 2000, AJ, 120, 1579