Enabling Non-Parametric Strong Lensing Models to Derive Reliable Cluster Mass Distributions. WSLAP+
Abstract
In the strong lensing regime non-parametric lens models struggle to achieve sufficient angular resolution for a meaningful derivation of the central cluster mass distribution. The problem lies mainly with cluster members which perturb lensed images and generate additional images, requiring high resolution modelling, even though we mainly wish to understand the relatively smooth cluster component. In practice the required resolution for a fully non-parametric mass map is not achievable because the separation between lensed images is several times larger than the deflection angles by member galaxies, even for the most impressive data. Here we bypass this limitation by incorporating a simple physical prior for member galaxies, using their observed positions and their luminosity scaled masses. This high frequency contribution is added to a relatively coarse Gaussian pixel grid used to model the more smoothly varying cluster mass distribution, extending our established WSLAP code (Diego et al., 2007). We test this new code (WSLAP+) with an empirical simulation based on A1689, using all the pixels belonging to multiply-lensed images and the observed member galaxies. Dealing with the cluster members this way leads to stable convergent solutions, without resorting to regularization, reproducing well smooth input cluster distributions and substructures. We highlight the ability of this method to recover “dark” sub-components and other differences between the distributions of cluster mass and member galaxies. Such anomalies can provide clues to the nature of invisible dark matter, but are hard to discover using parametrized models where substructures are modelled on the basis of the visible data. With our increased resolution and stability we show, for the first time, that non-parametric models can be made sufficiently precise to locate multiply-lensed systems, thereby achieving fully self-consistent solutions without reliance on input systems from less objective means.
keywords:
galaxies:clusters:general; methods:data analysis; dark matter1 Introduction
The distribution of mass within clusters is sensitive to the nature of dark matter and to the evolution of structure in general. In successful hierarchical models based on nonrelativistic and collisionless Cold Dark Matter (CDM) (Peebles, 1984), clusters accumulate from material gravitating towards the intersections of a filamentary network of structure, continuously merging with each other and increasing in mass. In this context simulations have shown that individual cluster mass profiles are well characterised in CDM dominated N-body simulations by the logarithmically steepening Navarro-Frenk-White (NFW) profile (Navarro et al., 1997), and also show a tendency towards a lower level of concentration with increasing cluster mass, the c-m relation, (Bullock et al., 2001; Eke et al., 2001; Dolag et al., 2004; Macciò et al., 2008; Neto et al., 2007; Duffy & van Bibber, 2009; Zhao et al., 2009; Bhattacharya et al., 2011) reflecting the general later assembly of more massive structures, when the cosmic mean density is lower. Both of these predicted trends are now very well established by independent simulations, but with some interesting variations, mainly in the amplitude of the c-m relation (Bhattacharya et al., 2011) that may require further clarification.
Accurate and reliably constrained cluster mass profiles can now be measured by combining Strong (SL) and Weak Lensing (WL) information, providing full logarithmic radial coverage (Broadhurst et al., 2005; Umetsu & Broadhurst, 2008; Zitrin et al., 2009, 2010; Coe et al., 2011). Rigorous comparisons with standard particle-CDM reveals that the shape of the profile follows closely the standard NFW profile for particle-CDM mass advocated to describe all halos formed in simulations of standard particle-CDM (Broadhurst et al., 2005; Umetsu et al., 2010). Curiously, however, the mass concentrations seem to be systematically larger than expected for the most massive clusters formed in the standard CDM cosmological model, with approximately twice as much matter concentrated within the characteristic radius of the NFW profile (Broadhurst et al., 2005; Umetsu et al., 2010). This anomaly will be explored in a more statistical sample from the CLASH survey (combining strong and weak lensing for full logarithmic coverage of the mass profile with first for an x-ray selected sample of 20 relaxed clusters (Postman et al., 2011) for which the first results are quite intriguing (Zitrin et al., 2010; Coe et al., 2011).
Inherent triaxiality of dark matter halos can boost lensing based concentrations for clusters selected in the first place by their lensing strength (Oguri et al., 2005). By selecting according to other unrelated criteria this lensing bias may largely be avoided. The Hubble Treasury data for the CLASH program (Postman et al., 2011) aims to establish representative equilibrium mass profiles for clusters selected by their X-ray properties, to be relaxed in appearance. The measurements are also in very good agreement with the NFW dominated CDM prediction (Zitrin et al., 2010; Umetsu et al., 2011; Coe et al., 2011) but continue to lie tantalisingly above the concentration-mass relation predicted for halos formed late in the concordance CDM cosmology. This surprising tendency for higher concentrations is controversial, although indications from other unbiased cluster samples with WL measurements also indicate higher cluster concentrations on average (Oguri et al., 2009; Okabe & Umetsu, 2008), although these results are lacking the SL information for deriving the inner profile.
Other dark matter related anomalies may have been found during cluster collisions, including complex merging cluster A2744 (Merten et al., 2011), with evidence of anomalous density peaks of dark matter separated from galaxies and gas. Other such tentative claims have also been made in the case of merging cluster A520, where a central peak of dark matter is claimed without a corresponding enhancement in the number density of galaxies. In the case of the iconic Bullet-cluster, the large relative velocity inferred from the Mach cone of the bullet component, , (Markevitch et al., 2004) is claimed to be very unlikely in the context of CDM for which the maximum expected inferred initial impact velocity found in large simulations is around for pairs of halos exceeding (Mastropietro & Burkert, 2008; Thompson & Nagamine, 2012), Iliev et al. 2013 in preparation but see also (Springel & Farrar, 2007) for a possible explanation).
This investigation is motivated empirically in view of the above imperfect agreement on cluster scales claimed between CDM and the radial cluster mass profiles. We may seek variations on the standard CDM based cosmology. It may be argued that currently undetectable light axions or other low mass scalar field particles, are perhaps now better motivated as CDM candidates rather than the traditional super-symmetric CDM particle candidates that remain undiscovered to the highest energies reached to date. A characteristic feature of scalar fields is that the associated bosons can form a coherent BEC under suitable conditions of temperature and density, which can be initially met and maintained in the cosmological context (Boehmer & Harko, 2007; Sikivie & Yang, 2009). Due to the low velocity dispersion, the growth of condensed structure should be very similar to standard particle-CDM on large scales (Boehmer & Harko, 2007; Sikivie & Yang, 2009; Velten & Wamba, 2012) as desired, but the macroscopic quantum wavelike behaviour may appear on smaller scales (Choi, 2002; Woo & Chiueh, 2009; González & Guzmán, 2011), particularly when dark matter collides, with potentially interesting consequences for cluster lensing. In this context, the troublesome cores of dark matter dominated dwarf galaxies can be generated by setting the de Broglie wavelength to a scale of several , corresponding to a mass of , so the uncertainty principle means matter cannot be confined within this radius (Hu et al., 2000).
For this BEC form of CDM, full 3D simulations of the development of structure are computationally much more intensive than standard N-body simulations, but have recently begun, governed by a Schrödinger-Poisson equation (Woo & Chiueh, 2009) to describe the balance between quantum pressure arising from the uncertainty principle offsetting the gravitational potential of the dark matter and with the corresponding particle mass set to the preferred value from dwarf galaxies cores. This simulation shows that the filamentary pattern and distribution of clusters is indistinguishable from regular simulations of particle-CDM, as expected (Widrow & Kaiser, 1993), but low mass galaxy halos are suppressed and large scale macroscopic quantum interference patterns are visible (Woo & Chiueh, 2009) in the density distribution. Comparison of our detailed cluster lensing mass distribution with predictions from this wave-like form of CDM (Woo & Chiueh, 2009) will be exciting to pursue and with our new lensing technique and can then be sensitively contrasted with the standard N-body representation of more massive particle-dark matter for which coherent wavelike behaviour is absent.
We may now use gravitational lensing to search for dark matter anomalies with much increased precision as the data required to measure accurate mass distributions has leapt in quality over the past few years in both the strong and weak lensing regime. Many sets of multiple images are now very typically identified in deep multicolour Hubble data, where distinctive internal features can be recognised in the larger well resolved background galaxies (Broadhurst et al., 2005; Umetsu et al., 2012; Zitrin et al., 2013). To identify more typical, smaller and fainter multiply lensed sources it is necessary in practice to be guided by a lens model, as even for the best behaved clusters large perturbations from galaxy members locally distort one or more members of each set of multiple images so that the location of counter images cannot be guessed with any confidence and model inversion will fail. Without many complete sets of multiple-images spread over a range of redshift it is not possible to accurately constrain the inner mass profile of a cluster, sufficiently well to examine theoretical predictions.
To take full advantage of this increased quality of data, many new approaches have been suggested to recover the surface mass distribution in both the weak and strong lensing regime, (see for instance Kaiser & Squires (1993); Broadhurst et al. (1995); Kaiser (1995); Schneider (1994); Schneider & Seitz (1995); Seitz & Schneider (1995); Bartelmann et al. (1996); Taylor et al. (1998); Tyson et al. (1998); Bridle et al. (1998); Marshall et al. (2002). In the best known case of A1689, over 100 multiply lensed images are reliably identified (Broadhurst et al., 2005; Coe et al., 2010), and over 50 are known in similar quality data for Cl0024+1654 (Zitrin et al., 2009), A1703 (Limousin, M. et al., 2008), MACS0416-2403 (Zitrin et al., 2013), helped by the development of detailed parametric models, and in particular the simple method of (Broadhurst et al., 2005) where the cluster mass distribution is assumed to approximately trace the light, by first starting from the observed galaxy distribution and varying the coefficients of a low order 2D polynomial fit to the galaxy distribution to describe the general distribution of galaxy cluster mass, and in addition to this the member galaxy perturbations scaled by their luminosity, so that very few parameters are required to provide a fairly flexible model of the mass distribution, which can be used and refined in locating multiply lensed images.
This relatively flexible method, although capable of locating many reliable multiple-images, is not precise enough to provide an exhaustive identification of all counter-images, particularly the numerous blue galaxies which are too ambiguous both morphologically and in terms of their estimated redshifts, and fundamentally this method is limited to self-consistency checks of models where mass traces light, as with standard CDM. To examine the data in detail for anomalous density fluctuations such as those that may be generated by wave-like CDM, we need the full model-independence that non-parametric strong lensing methods may provide. The increased number of strong lensing constraints available in deep space images encourages the use of non-parametric methods that make no assumption about the matter distribution. In previous work, we developed a non-parametric code (WSLAP) and demonstrated its performance first with simulated data, and later with the real data of A1689 (Diego et al., 005a; Diego et al., 005b; Diego et al., 2007). Our results were compared with those obtained using parametric methods (Broadhurst et al., 2005) and found good agreement within the noise, in terms of the azimuthally averaged radial profile. However, the solution obtained from WSLAP lacked the resolution of parametric methods limiting its ability to predict new images that could be later confirmed with the data.
Here we aim to place strong lensing on a firmly objective basis with the development of a practical non-parametric method for inverting the strong lensing image information to extract reliable projected 2D surface mass distributions. With the dramatic improvement in strong lensing data we can now focus on extracting the important physical information with minimal assumptions, in the most model independent way, in particular to relax the conventional assumption that mass traces light, enabling us to derive the general matter distribution and its realistic uncertainties. These new images from Hubble, particularly from the dedicated CLASH program (Postman et al., 2011), provide typically over several tens of multiply lensed images per cluster and many long arcs, that should make this a manageable task. A non-parametric approach will provide an important consistency check of the findings of the parametric methods since concurring results would strengthen the validity of the parametric approach, whereas any significant differences would need to be addressed.
To date, non-parametric methods have been applied to only three well studied clusters, using a modification of the strong lensing package developed originally by (Diego et al., 005b), providing low resolution representations of the mass distributions and the very different non-linear approach of Liesenbourgs et al. (Liesenborgs et al., 2006), applied to the Hubble data of Cl0024 (Zitrin et al., 2009). These methods are able to provide the rough shape of the mass distributions, showing substructure that roughly coincides with clumps in the galaxy distribution, as well as reasonably accurate radial mass profiles that are consistent with our standard parametric modelling (Diego et al., 005a; Zitrin et al., 2009). It is also clear that this approach cannot help find new multiple images, because of its limited resolution, and relies on the input multiple images defined by parametric model of (Broadhurst et al., 2005; Zitrin et al., 2009) and needs reliable redshift information for these systems for a meaningful constraint on the gradient of the mass profile. Some degeneracies are also present, including possible spurious ring features, probably caused by over fitting the data (Ponente & Diego, 2011), and a tendency to asymptote to a flat outer profile beyond the boundary of the data, from the mass-sheet degeneracy (Jee et al., 2007).
The results obtained with parametric and non-parametric methods are not expected to agree in detail, as the premise on which the parametric models are built use optical based information rather than the invisible dark matter. Typically parametric models place halos of matter coincident with the location of a brightest cluster galaxy, with other sub halos added to help deal with any obvious substructure seen near the cluster center. For every halo added at least 6 parameters are required to describe the halo position, ellipticity position angle, scale length and profile slope. With additional parameters describing cluster member galaxies resulting typically in many parameters of uncertain validity, requiring many multiply lensed images to constrain. This is particularly the case for ongoing merging clusters.
In this paper we augment the earlier non-parametric code, WSLAP, by incorporating the lens deflection generated by observed member galaxy properties, which it transpires helps solve some of the issues of non-parametric methods and greatly improves the quality and robustness of the mass reconstruction. We do this by including a physical prior in the method that is well motivated by the observations. Our prior consist in the simple assumption that the galaxies that are in the cluster must have some mass themselves and that they are surrounded by their own halo of dark matter. In the Sec. 2 below we discuss the basis of the original code, WSLAP, and show how to include the above physical prior in the improved version of the code, WSLAP+. In Sec. 4 we give details of the simulations being used to demonstrate the capability of the new version of the code, WSLAP+, and finally we describe the results we obtain and our conclusions in Sec. 5 and 7.
2 The original code: WSLAP
We refer the reader to the original papers (Diego et al., 005a; Diego et al., 005b; Diego et al., 2007) for a detailed description of the original code and its performance. Here we will summarize the main ideas and those that are relevant to understand the new improvement to the original method (i.e the addition of a new physical prior).
Gravitational lensing is formally described by the lens equation:
| (1) |
In the context of the thin lens approximation, the above equation relates the observed lensed images, , in the image plane (and represented by pixels in the image data) with the corresponding original positions of the background galaxies, , in the source plane and the deflection due to the mass distribution, , in the lens plane. For a given mass distribution, , the net deflection angle due to this mass is the integral of the deflection field from the infinitesimal mass elements,
| (2) |
where , , and are the angular distances from the lens to the source, the observer to the lens and from the observer to the source respectively.
If the lens plane is discretized into a 2-dimensional grid with grid points, the above equation can be approximated as,
| (3) |
where are the masses from each grid point. As detailed in previous papers (Diego et al., 005a; Diego et al., 005b; Diego et al., 2007) the masses at the grid points are modelled as Gaussian with a full-with-half-maximum proportional to the mesh size of the grid.
It is important to emphasize that Eq. 3 represents an approximation of Eq. 2 and that as such we are introducing an error in the reconstruction. This intrinsic error is not always acknowledged in lensing reconstruction and can lead to erroneous conclusions as discussed in (Ponente & Diego, 2011).
A second approximation allows us to re-write the lens equation in a simpler algebraic form. Assuming that our data set consists of lensed pixels of background sources and that each of the is well approximated by a point source (with parameters and ), we can construct a system of (x and y) linear equations with variables.
| (4) |
Here and are two matrices containing the and lensing effect of the cell (which has been assigned a fixed mass) on the pixel , while and are dimensional matrices filled with 1’s and 0’s respectively.
The variables are the lens masses and the central galaxy positions (x and y). All these variables can be combined into a single vector, . In its compact form the above equation then reads;
| (5) |
where is a known dimensional matrix and is also known and given by the observed x and y positions of all the pixels in the lensed galaxies.
3 New implementation: WSLAP+
As mentioned earlier, non-parametric methods trade spatial resolution by robustness in the lensing reconstruction. On the other hand, parametric methods force matter to concentrate around the observed galaxies and usually complement this with a cluster halo described by several parameters. In our new implementation, we extend WSLAP by adding a very simple but robust constrain that combines the benefits of the robustness from non-parametric methods with the higher resolution of the parametric methods. The galaxies in the cluster must contain some matter and hence they must contribute to the deflection field. Due to the intrinsic non-linear nature of the lensing problem, the intrinsically smaller (compared with the cluster) deflection field from an individual galaxy in the cluster can make a big difference (sometimes drastic) in terms of lensing distortion when the angular distance to this galaxy is small enough. Hence it is important to take into account this small deflection angles into the lens reconstruction. We can take advantage of the well known correlation between the observed luminosity of a galaxy and its total mass and assign a mass to each galaxy in the cluster according to its luminosity. As an initial guess we consider a ratio between the luminosity and the mass . Given the mass of a galaxy we assign a NFW mass profile (Navarro et al., 1997) to each galaxy . We produce a mass map for the haloes around the galaxies in the cluster and from this construct a fiducial deflection field for the different redshifts of the background sources. The deflection field from these galaxies can be easily incorporated into the matrix, Eq. 5, by adding a column containing the fiducial deflection field at the positions of the arcs (lensed galaxies), . The new system of equations has the following form:
| (6) |
where is a new variable (scalar) in the solution vector that accounts for the re-scaling of the fiducial deflection field of the galaxies. This system can be also represented in the compact form given by Eq. 5 where now the solution vector is given by and it has dimension .
As mentioned earlier, Eq. 5 can be solved by different methods (see Diego et al. (005a); Diego et al. (005b); Diego et al. (2007) for a description of several of them). In our particular case, and in order to avoid solutions with negative values in and we use the quadratic programming algorithm (or QADP) described in (Diego et al., 005a) which imposes the physical constraint that the solution, , must be positive.
Although not discussed in detail in this work, the original code combines also weak lensing (when available) into a system of linear equations similar to Eq. 5. The new implementation discussed in the following section can be easily extended to weak lensing by inserting additional column(s) into the corresponding weak lensing matrix (see Diego et al. (2007) for details of this matrix).
4 Simulated data
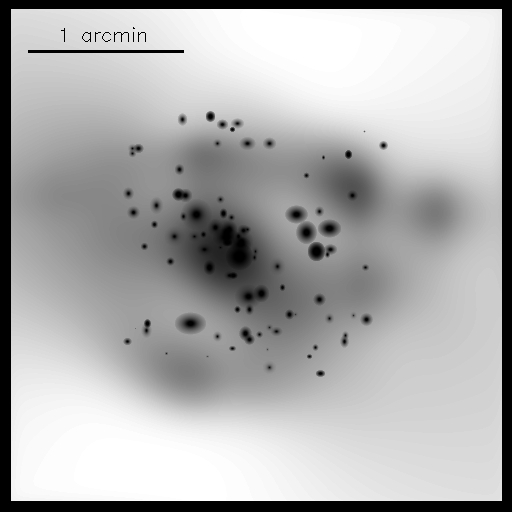
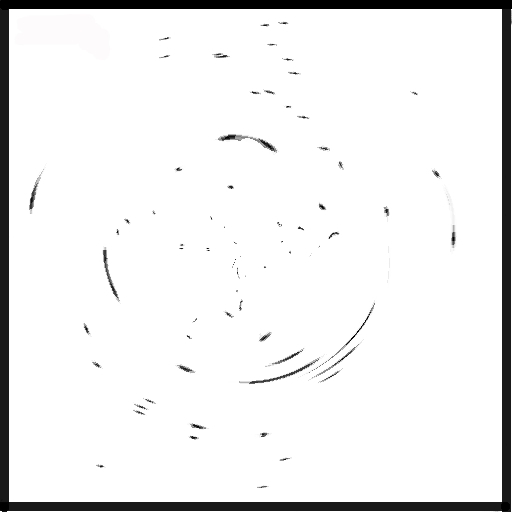
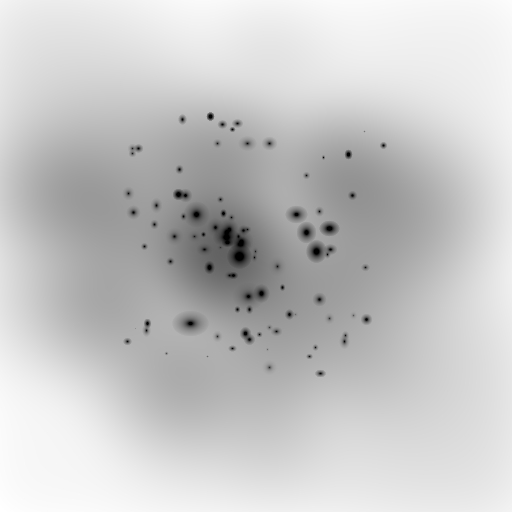
We test the performance of our new code with a set of simulated strong lensing data. Our simulated data set resembles the case of A1689, where tens of background sources are being lensed by the cluster. We adopt the redshift of the (30) background sources from the real data set of A1689 (Broadhurst et al., 2005). For the cluster, we place individual triaxial NFW halos at z=0.2 with a pattern similar to the distribution of the main halos in A1689 (94 NFW halos in total, Coe et al. (2010)). From now on, we refer to the mass distribution from these galaxies as galaxy-true. In addition to the masses from the galaxies, we add a cluster halo (also at z=0.2) with a mass distribution that resembles the galaxy distribution but with some significant deviations in order to test how well the method can reconstruct the dark matter that is not being traced by the galaxies. The mass ratio of the cluster halo to the combined mass of the galaxies is roughly 3 to 1. The resulting mass distribution of the simulated cluster is shown in Fig. 1. In the source plane, the background sources are placed in positions such that we reproduce both tangential and radial arcs like in A1689. The background sources are extracted from the Hubble Ultra Deep Field (Bouwens et al., 2003) and later re-scaled to match a specific angular scale at the corresponding redshift. The background simulated sources are lensed through the simulated cluster and we produce a set of strongly lensed galaxies that constitutes our simulated data set together with the redshifts of the corresponding sources (see Fig. 2). The field of view of this (and all other images unless mentioned otherwise) is arcminutes.
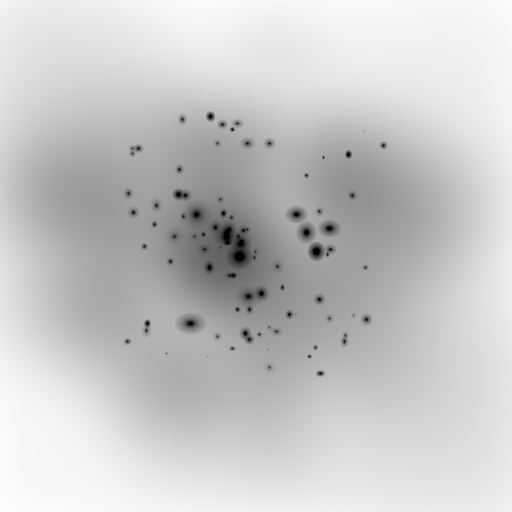
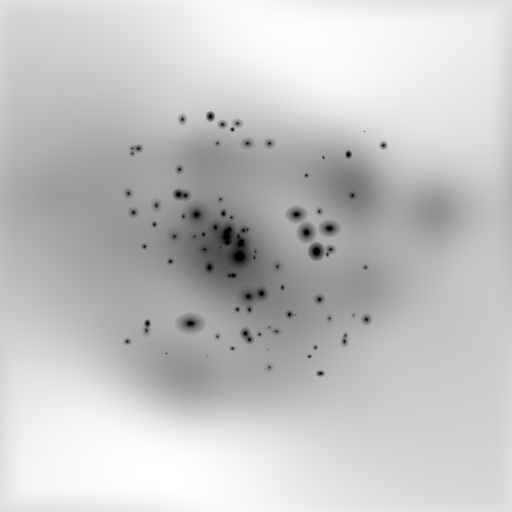
We also simulate a second mass distribution for the galaxies, that we refer from now on to as galaxy-model, where we use the same locations as above but we change the individual mass and scale radius of each galaxy. We take random values for both the mass and scale radius around the values in the galaxy-true case with typical deviations of around these values. The galaxy-model is later used to compute the fiducial deflection field in our lens reconstruction. By doing this, we adopt the realistic scenario where the positions of the galaxy members are known but the mass and profiles of these galaxies are unknown.
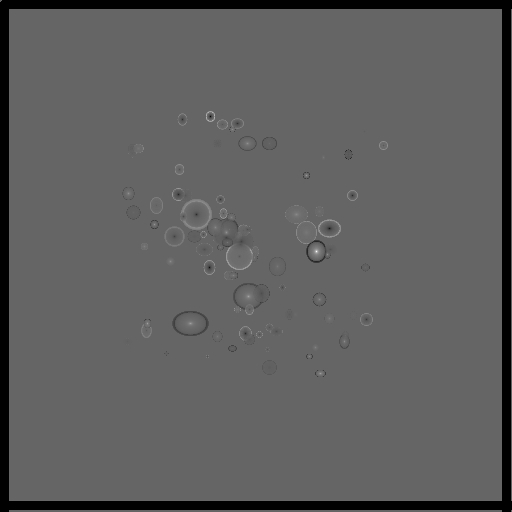
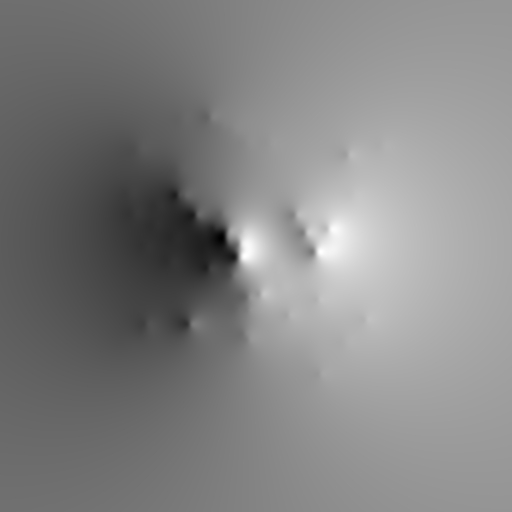
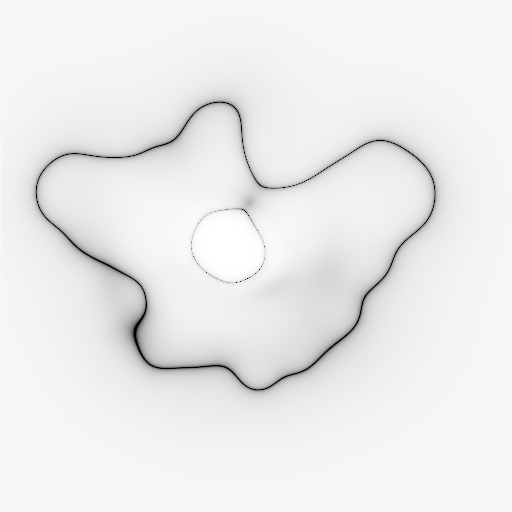
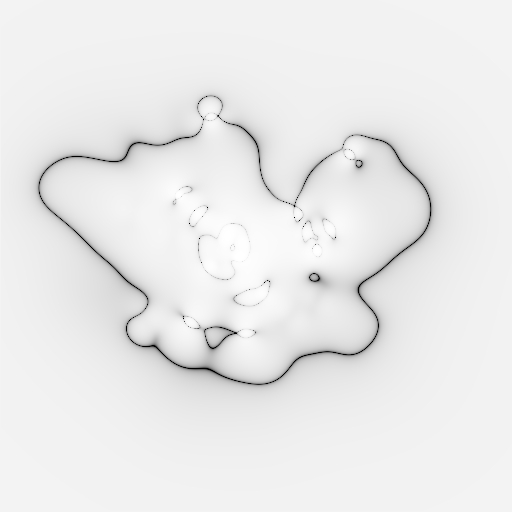
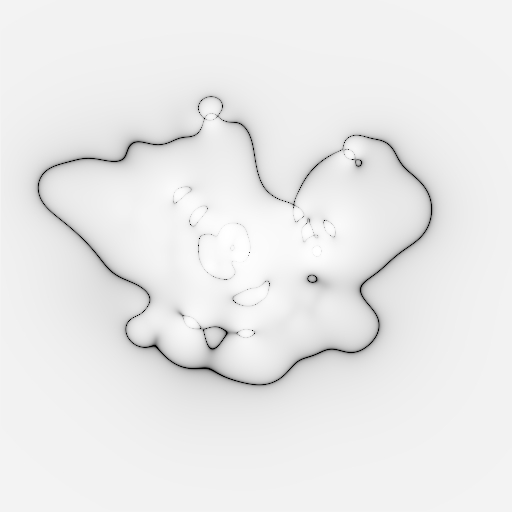
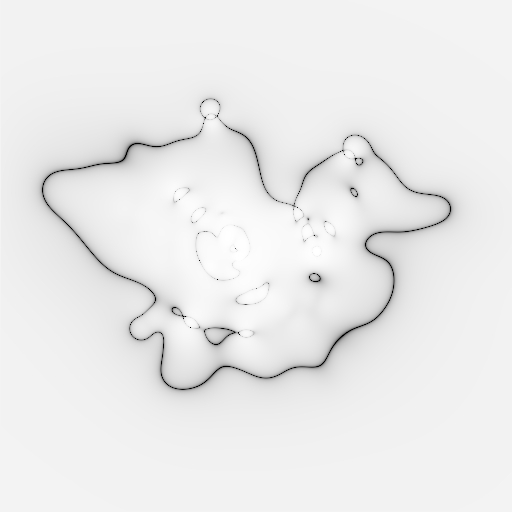
Fig. 3 shows the difference in the projected D surface mass density between the input model distribution of galaxies and the fiducial model used in the mass reconstruction. The corresponding deflections field are shown in Fig. 4.
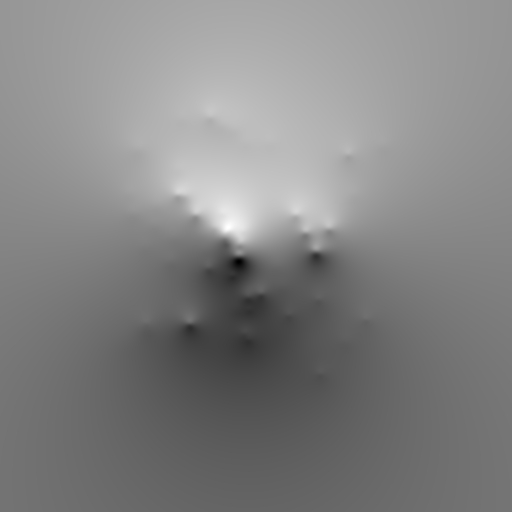
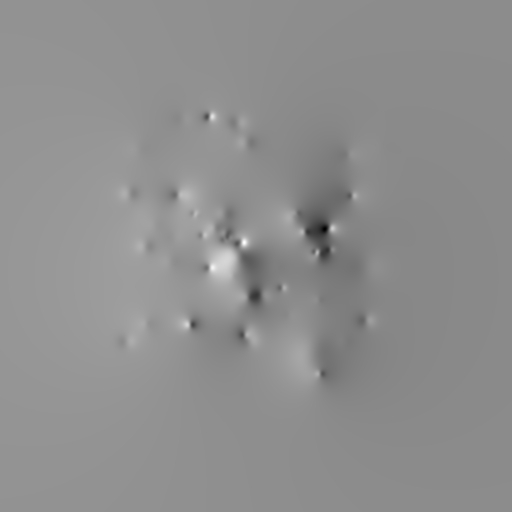
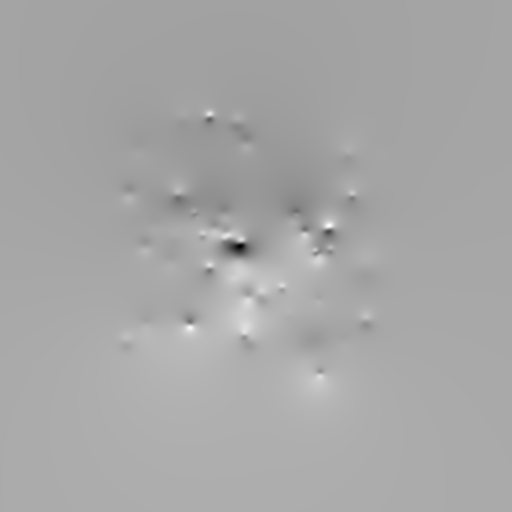
Once the fiducial deflection field for the model is computed, we build the matrix and reconstruct the solution using the QADP algorithm. For the matrix we found that using a regular grid (in our case of grid points) works better than a multi-resolution grid. The reason probably being the fact that the multi-resolution grid reduces the desired orthogonality of the base (i.e between the grid and the galaxies) describing the mass distribution. Also, the use of a multi-resolution grid can introduce an undesired prior in the reconstruction since the solution tends to artificially increase the reconstructed density in the smaller grid cells. On the other hand, the use of the regular grid is similar to using a flat prior for the mass distribution since it assigns to the different areas in the lens plane the same probability. In order to quantify the gain in the reconstruction by the new implementation, we reconstruct the solution in three different scenarios:
i) Assume that the galaxies in the cluster have zero mass (this would correspond to the result obtained with the
original WSLAP code and in general with a standard non-parametric code using a regular grid).
ii) Assume that the mass in the galaxies is given by the galaxy-model and build the fiducial deflection field from
that model (Figs.3 and 4). This would be the realistic case where
we make an assumption (biased) about the masses in the galaxies.
iii) Assume that the fiducial deflection field is given by the galaxy-true. This case is the best case scenario and
corresponds to the best possible reconstruction in the unlikely-lucky case that our assumption about the member
galaxies is completely right.
5 Results
As discussed later, we find that the best solutions are obtained after iterating the QADP for several thousand iterations. We find the solution in the 3 cases discussed at the end of the previous section after iterating the QADP algorithm for 8000 steps. Fig. 5 summarizes our main results. Each column corresponds to one of the cases described in the previous section. The top row shows the reconstructed mass distribution while the bottom row shows the critical curves overlaid the galaxies Case i) (left column) shows a decent reconstruction of the dark matter halo but as expected misses the details of the individual galaxies. This is made more evident when we compare the critical curves with the input model critical curves in the right column. The reconstructed critical curves have softer rounds, as a consequence of the poorer resolution of the reconstruction. In this case there is only one radial curve. In contrast with the other cases, where the solution is able to reconstruct better the critical curves (both radial and tangential). The cases ii) and iii) shown in the second and third columns show a significant improvement in the reconstruction of the mass and critical curves. Regarding the mass, it is interesting to see how the grid part of the solution is capable of reconstructing the cluster mass structures that where not correlated with the galaxies demonstrating the robustness of our new implementation. On the other hand, the addition of the fiducial deflection field from the galaxies helps improve significantly the recovery of the critical curves, in particular the radial critical curve where the effect of the individual galaxies is larger. Even the radial curves around the smaller sub-cluster seem to be reconstructed reasonably well.
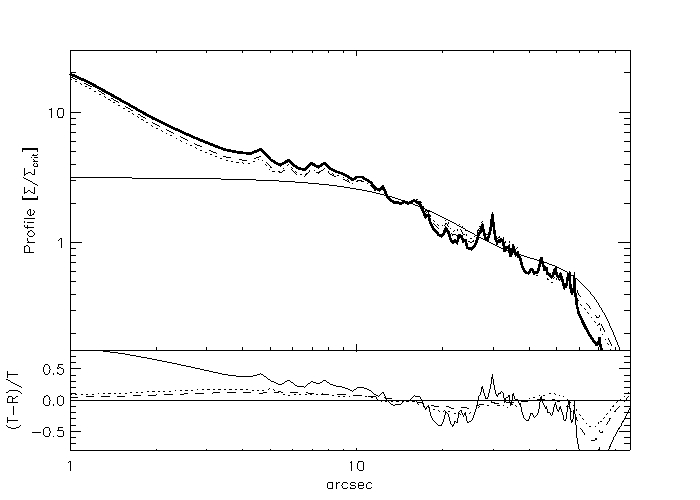
A more quantitative comparison of the quality of the reconstruction is shown in Fig. 6 where we compare the one-dimensional profiles (in units of the critical surface density, ) for the three cases and the input model profile. Again the new implementation is able to reconstruct significantly better the smaller details of the mass distribution.
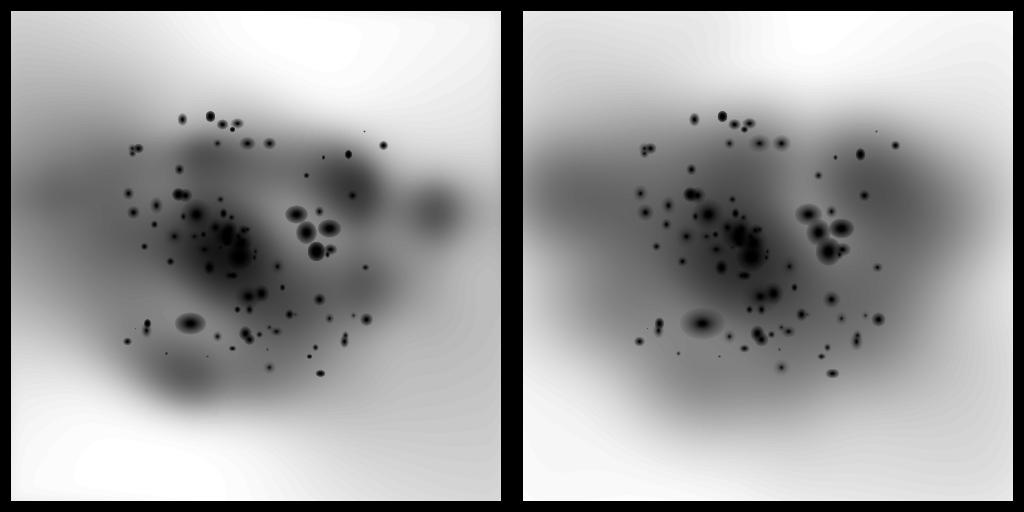
In order to show the capability of the method to reconstruct dark matter substructure not correlated with the galaxies, Fig. 7 compares the reconstructed solution with the input model but using a different color scale that enhances the details of the soft dark matter halo. In these figures it can be appreciated how the solution retains the main features of this halo although it misses some of the details specially near the edges where the lensing constraints are weaker.
6 Discussion
Aside from the improvement in the reconstruction of the solution (masses and source positions) shown by the reconstructed profiles and critical curves, the addition of the new parameter results in two major advantages for the new method. One of the pathological behaviours of the original code was that the algorithm can not be left converging indefinitely. After several thousand iterations, the lack of resolution of the gridded mass distribution is generally compensated by a extremely irregular mass distribution that manages to focus the observed arcs into very small compact regions in the source plane. In previous works (Diego et al., 005a; Diego et al., 005b; Diego et al., 2007; Ponente & Diego, 2011) this pathological solution is referred as to the point source solution. Adding the deflection field from the galaxies naturally incorporates the resolution that the grid is lacking so we should expect some improvement on the pathological behaviour of the solution when the number of iterations is too large. In order to check the convergence we iterate the QADP algorithm a sufficiently large number of iterations. Also, we explore the dependence of the solution on the initial guess, , for the minimization process.
In Fig. 8 we show the total recovered mass of the cluster and the new parameter, , as a function of the iteration number for three different choices of the initial condition . In the first reasonable case, (dotted line in the figure), the initial condition has very small values both for the grid masses and the parameter. In the second bad-choice case (dashed line) the initial condition is poorly chosen and both grid masses and are set to values that are too high. For comparison purposes, we show a third case (dot-dashed line) with the solution for the old WSLAP implementation (or equivalently the acse for )
Despite the choice for , after a few thousand iteration steps, the solution ( and ) converges towards constant values. Also, these constant values of convergence coincide with the total mass of the diffuse halo of the cluster and the input model mass of the galaxies. As a difference with the results from the original WSLAP code, this solution is not pathological but it is still a good physical solution to the problem. Some degree of over-fitting is still appreciated specially in the source plane (where the sources tend to concentrate more towards the center of the image) indicating that for this kind of setup (lens, number of arcs, mass distribution) 50000 iterations are too many (over-fitting regime) and the optimal range for the number of iterations is around a few thousand (see discussion below). The over-fitting regime is better shown in the bottom panel of Fig. 8 where we represent the error in the reconstructed positions of the sources. The error is defined as the absolute difference to the input model solution in terms of separations between the input model source positions and the predicted positions
| (7) |
Over-fitting usually occurs when the predicted positions of the sources converge towards the center of the source plane. This is normally accomplished by non-physical solutions that exhibit large fluctuations in the mass distribution. From Fig. 8, we can see that the optimal solutions are obtained in the range of a few thousand iterations. The dashed line corresponding to the bad-choice described above, fails to converge due to memory effects. This memory effect is the reason why the solution does not converge to the Soft value shown in Fig. 8. This is better shown in Fig. 9 where we compare the profiles of the input model mass with the reconstructed solutions in the cases given by the different initial conditions. The solution obtained in the bad-choice case is still a good one as demonstrated by the profile. This figure also shows how the solution maintain the high values (hence memory effect) of the initial condition in the outskirts of the image plane, where the lensing data can not constrain the solution. The other case seem to render very reasonable solutions even after 50000 iterations (overfitting regime). For comparison we also show the solution obtained by the original implementation of WSLAP (dot-dashed line) and with the same initial guess, , as the dotted line (reasonable case). Note how in Fig. 8 this case is indistinguishable from the Soft component of the reasonable choice for the initial guess, , for iterations below a thousand but beyond this point it departs from it in a way similar to the increase of the Galx component (bottom dotted line) indicating that the grid is trying to account for the small scale corrections due to the member galaxies. We can then conclude that choosing the optimal number of iterations is not as critical as in the original WSLAP code as the over-fitting solutions still are able to reproduce reasonable solutions. However, the best solutions are obtained when the number of iterations is in the range of a few thousand. A second lesson is learned about the choice of the initial condition. Although the solution is robust and converges towards good-quality solutions independently of the choice for , the best solutions are obtained when a sensible choice is made for the initial condition, in particular, selecting small values for both, the grid component and the initial strength of the deflection field of the galaxies, produce better final solutions than taking more unreasonable choices.
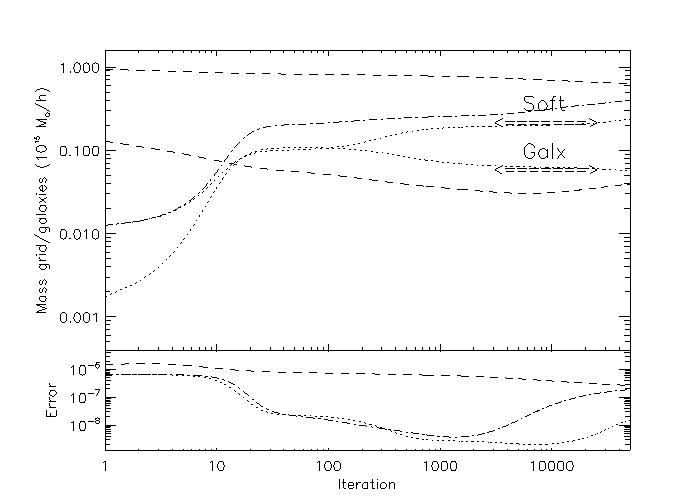
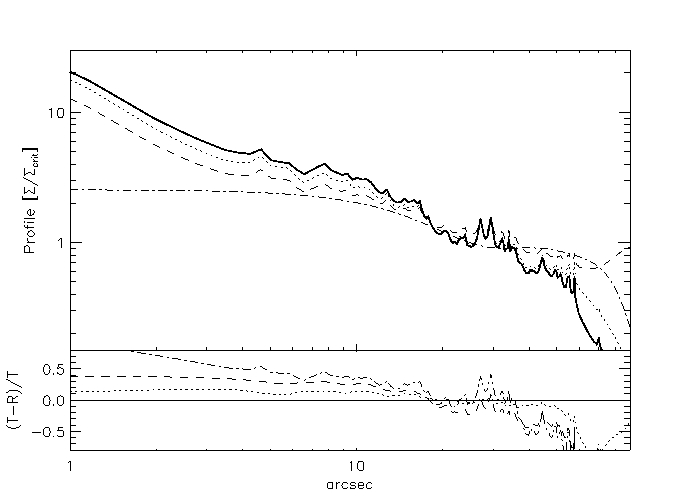
Figures 8 and 9 summarize some of the main improvements obtained as a result of our new implementation. Since the galaxies form on the peaks of the dark matter sub-halos, the galaxy component of the solution, , will capture the details of the small scale deflection field. The grid component, that normally accounts for most of the deflection field, does not need any more to force the mass distribution into non-physical solutions (like the dot-dashed line in Fig. 9 that exhibits a bump or ring of matter at around arcminute from the cluster centre.) to account for the second order corrections to the deflection field coming from the smaller halos. This is now naturally accounted for by the galaxy deflection field and hence the mass distribution converges to a much more physical (and stable) solution. This pathological behaviour is solved in other methods by adding regularization terms. In this sense we can say that our new method produces robust self-regularizing solutions where the small scale contributions to the deflection field are described by the galaxy component and the irregular (and harder to model) cluster mass distribution is described by the grid component.
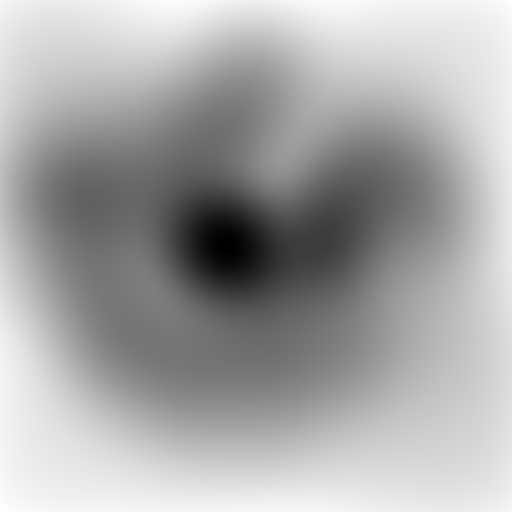
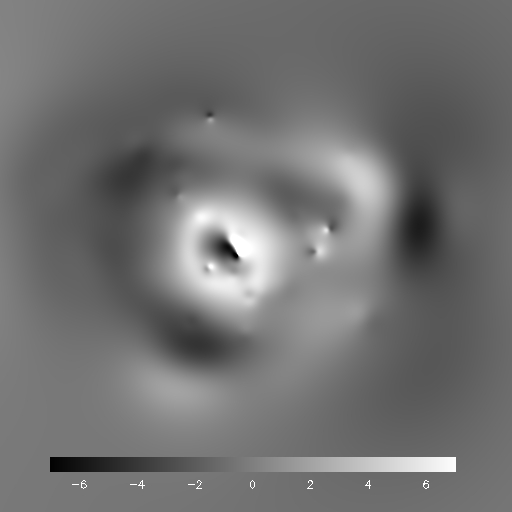
A second major bonus is also obtained by incorporating a deflection field for the galaxies with a new free parameter. One of the main limitations of the old non-parametric method was the lack of resolution in the reconstructed solution. This limitation of the solution made it very difficult to identify new pairs of arcs in the images as the error in the deflection field could be large specially around the cluster members. This error gets reduced with the new method making the new non-parametric method competitive with the parametric methods in terms of finding new arcs in the image. Fig. 10 shows the error in the deflection field obtained by comparing the input model deflection field of our simulated data with the deflection field of our solution after 8000 iterations. The typical error is about 3 arc-seconds which might be sufficient to identify new multiple image-pairs in the data. The largest error is found around the most massive central galaxy, probably as a consequence of the wrong assumption made to model the galaxies when computing the fiducial deflection field from the galaxies.
6.1 Extension to weak lensing analysis
In the present work we have applied the new improved code, WSLAP+, to simulated strong lensing data. The code is however prepared to combine weak and strong lensing as well as detailed in (Diego et al., 005b). The weak and strong lensing data are combined into the same system of linear equations. The same solution (mass distribution of the lens) that is able to reproduce the strongly lensed galaxies must predict the right shear distortions. The implementation of the weak lensing case in WSLAP+ is the same as the one described in Sec. 3 for the strong lensing. Now the column containing the deflections from the cluster members is extended to include the deflection at the positions where the shear is measured. With our new implementation, the small deflection field of a single cluster member (that is, in the outskirts of the cluster and can compete in magnitude with the weak lensing shear in the vicinity of that isolated cluster member) can be properly accounted for reducing the possible source of systematic error in the weak lensing reconstruction.
6.2 Adding more than one galaxy deflection field
This paper presents the most simple version of the new implementation where the deflection field from the galaxies are described by a model deflection field that is re-scaled by a single parameter, . It is however trivial to extend this idea to multiple deflection fields. For instance, one might want to consider the deflection field from the central galaxy independently. In this case, the matrix would have two additional columns (with respect to the WSLAP implementation) instead of one and the solution vector, , would have two additional free parameters (instead of one), . In a more extreme case, the dominant galaxies in the cluster could contribute each with one extra column in the matrix and their corresponding parameter in the vector . For the case of weak lensing in field areas, this flexibility on the number of parameters might be a necessity rather than a convenience since one would normally want to divide the data (lensing galaxies) in redshift bins and group the field galaxies into each redshift bin in order to construct a global deflection field for that particular redshift bin. This way the number of additional columns in the matrix (and the additional number of free parameters in the vector ) would be equal to the number of redshift bins that are being considered. Incorporating the individual deflection fields from observed galaxies might help improve significantly the lensing reconstruction with our new method as the bulk of the dark matter can be well described by the grid component but the smaller scale deflection fields around the lensing galaxies (that can not be well reconstructed by the grid) can now be constrained more accurately with the individual galaxies deflection field. These and other ideas will be tested in a future paper.
7 Conclusions
We have aimed here to cure the wide degeneracy of lensing solutions typical of non-parametric lensing solutions, stressing the improvements obtained by treating the cluster member contribution with a simple prior. Cluster members frustrate the process of converging to an accurate solution by their small scale perturbations to the deflection angle and the additional images they generate. In practise it is typically the case that at least one member of a multiply lensed source is affected locally in this way by the close proximity of a cluster member to the observed image position. We run into a limitation here in trying to recover the mass distributions of clusters that the effective resolution of the recovered mass maps are set by the numbers of lensed images found in the strong lensing region, and in practice this is too few to deal with the high frequency member galaxy component. In turn this means that non-parametric methods is the general inability to predict the locations of counter-images with sufficient precision to actually find sets of multiple images for adding to the model.
We have found here that this weakness can be largely overcomed by incorporating reasonable estimates of the member galaxy deflections using the member galaxy positions and luminosity scaled masses, so that it then becomes possible to derive the smooth cluster-wide component of the mass distribution, for which the variation varies only an a relatively large angular scale lying within the effective resolution set by the surface density of lensed images. We have simply assumed that these galaxies contribute with a mass proportional to a fiducial value related to their measured luminosities, with the proportionality constant subsequently inferred as part of the method. This helps take care of the difficult high spatial frequency component, so that the smoother remainder can be dealt with by the inherently low resolution non-parametric approach. This cluster-wide contribution is modelled with a Gaussian pixel grid, providing a compact orthogonal basis. The input data includes the multiple images identified by our standard flexible parametric model described above, and their redshifts defined from our multi-band photometry. By insisting that some mass must exist at the position of the observed galaxies we increase the detail of the overall reconstruction and also correct possible biases in the reconstructed solution as this new assumption can act as an overall re-normalization factor.
Our new method is parameter-free in terms of its description of the general cluster mass distribution, so that any interesting anomalous density peaks will not go unnoticed in this model-independent analysis. Previous work has relied on the assumption that light traces mass, and even though we have always tried to relax this assumption in our work, it cannot be said that our results in the strong lensing regime have much freedom to differ significantly from strict equality between mass and light. With our new method we may look for deviations between mass and light predicted in the very cold Bose-Einstein Condensate (BEC) dark matter, which in contrast to standard particle CDM fluctuates in density and may show solitonic behaviour and macroscopic interference effects. It is worth noting that interesting systematic shifts in position between model images and the data of several arc-seconds are quite typical (Broadhurst et al., 2005; Halkola et al., 2006) which remain intriguing. Observationally, we will search for the predicted wave-like effects from BEC simulations, and with application to the CLASH program.
We also examine the ability of this method to recover dark sub-components which do not follow the galaxy distribution, highlighting the potential of this method to uncover such anomalies, and for which parametrised models based on the galaxy distribution are insensitive.
Finally our new hybrid method has shown that we may be optimistic is achieving the precision required to locate multiple images ourselves without reliance on other methods to provide the input images. This is a major step forward and means that solutions we find by our non-parametric technique are self-consistent, in that the multiple image we input are derived by our method, and do not need to rely on uncertain “candidates” which may not be securely identified by more model-dependent means. Having derived objective lens models we may test the validity of multiply lensed candidates found by others and we may also constrain the geometric distances for such multiply-lensed sources, and their intrinsic properties, including luminosities and source plane reconstructions. This is of particular interest in relation to record breaking high-z galaxies routinely uncovered in deep cluster imaging, and of potentially great importance for the study of structure formation, for which good lens models with correspondingly reliable magnification estimates are essential.
Our first self-consistent application of this technique to the iconic cluster A1689 including the new deep IR imaging by Hubble will be presented shortly, demonstrating this breakthrough in precision by our new non-parametric method allowing new systems to be discovered and objective evaluation of the the previously claimed multiple images and also a model-independent derivation of lensing distances for construction of the distance-redshift relation at high redshift. We can anticipate that the most rewarding application will be to the newly approved deep “Frontier fields” clusters with Hubble111http://www.stsci.edu/hst/campaigns/frontier-fields/ for which the high surface density of multiply lensed images strongly motivates the objective non-parametric approach to fully explore the central surface mass distribution and to reliably estimate the magnification of a statistical sample of galaxies and beyond.
8 Acknowledgments
J.M.D., I.S. and R.L. acknowledge support of the Consolider project CSD2010-00064 funded by the Ministerio de Economia y Competitividad. I.S. and R.L. are also supported by the Basque Government through the special research action KATEA and ETORKOSMO, and by the University of the Basque Country UPV/EHU under program UFI 11/55. I.S. also holded a PhD FPI fellowship contract from the mentioned ministry at the beginning of this work. T.J.B. thanks Tzihong Chiueh for interesting discussions and J.M.D. and T.J.B. thank the ASIAA Institute for astronomy in Taipei for their generous hospitality.
References
- Bartelmann et al. (1996) Bartelmann M., Narayan R., Seitz S., Schneider P., 1996, Astrophys. J. Lett., 464, L115
- Bhattacharya et al. (2011) Bhattacharya S., Habib S., Heitmann K., Vikhlinin A., 2011, ArXiv e-prints
- Boehmer & Harko (2007) Boehmer C., Harko T., 2007, JCAP, 0706, 025
- Bouwens et al. (2003) Bouwens R., Illingworth G. D., Rosati P., Lidman C., Broadhurst T. J., et al., 2003, Astrophys.J., 595, 589
- Bridle et al. (1998) Bridle S. L., Hobson M. P., Lasenby A. N., Saunders R., 1998, Mon. Not. Roy. Astron. Soc., 299, 895
- Broadhurst et al. (2005) Broadhurst T. J., et al., 2005, Astrophys.J., 619, L143
- Broadhurst et al. (1995) Broadhurst T. J., Taylor A., Peacock J., 1995, Astrophys.J., 438, 49
- Bullock et al. (2001) Bullock J. S., Kolatt T. S., Sigad Y., Somerville R. S., Kravtsov A. V., et al., 2001, Mon.Not.Roy.Astron.Soc., 321, 559
- Choi (2002) Choi D.-I., 2002, Phys. Rev. A, 66, 063609
- Coe et al. (2010) Coe D., Benítez N., Broadhurst T., Moustakas L. A., 2010, The Astrophysical Journal, 723, 1678
- Coe et al. (2011) Coe D. A., et al., 2011, in A. Ast. Soc. Meeting Abstracts 217 Vol. 43, More Powerful than a Speeding ”Bullet”? New HST Images and Analysis of the Galaxy Cluster Merger Abell 2744
- Diego et al. (005a) Diego J. M., Protopapas P., Sandvik H., Tegmark M., 2005a, Mon. Not. Roy. Astron. Soc., 360, 477
- Diego et al. (005b) Diego J. M., Sandvik H., Protopapas P., Tegmark M., Benitez N., et al., 2005b, Mon. Not. Roy. Astron. Soc., 362, 1247
- Diego et al. (2007) Diego J. M., Tegmark M., Protopapas P., Sandvik H., 2007, Mon. Not. Roy. Astron. Soc., 375, 958
- Dolag et al. (2004) Dolag K., Bartelmann M., Perrotta F., Baccigalupi C., Moscardini L., et al., 2004, Astron.Astrophys., 416, 853
- Duffy & van Bibber (2009) Duffy L. D., van Bibber K., 2009, New Journal of Physics, 11, 105008
- Eke et al. (2001) Eke V. R., Navarro J., Steinmetz M., 2001, Astrophys.J., 554, 114
- González & Guzmán (2011) González J. A., Guzmán F. S., 2011, Phys. Rev. D, 83, 103513
- Halkola et al. (2006) Halkola A., Seitz S., Pannella M., 2006, Monthly Notices of the Royal Astronomical Society, 372, 1425
- Hu et al. (2000) Hu W., Barkana R., Gruzinov A., 2000, Phys.Rev.Lett., 85, 1158
- Jee et al. (2007) Jee M. J., et al., 2007, The Astrophysical Journal, 661, 728
- Kaiser (1995) Kaiser N., 1995, Astrophys.J. Lett., 439, L1
- Kaiser & Squires (1993) Kaiser N., Squires G., 1993, Astrophys.J., 404, 441
- Liesenborgs et al. (2006) Liesenborgs J., De Rijcke S., Dejonghe H., 2006, Monthly Notices of the Royal Astronomical Society, 367, 1209
- Limousin, M. et al. (2008) Limousin, M. Richard, J. Kneib, J.-P. Brink, H. Pelló, R. Jullo, E. Tu, H. Sommer-Larsen, J. Egami, E. Michalowski, M. J. Cabanac, R. Stark, D. P. 2008, A&A, 489, 23
- Macciò et al. (2008) Macciò A. V., Dutton A. A., Van Den Bosch F. C., 2008, Mon. Not. Roy. Astron. Soc., 391, 1940
- Markevitch et al. (2004) Markevitch M., Gonzalez A. H., Clowe D., Vikhlinin A., Forman W., Jones C., Murray S., Tucker W., 2004, The Astrophysical Journal, 606, 819
- Marshall et al. (2002) Marshall P. J., Hobson M. P., Gull S. F., Bridle S. L., 2002, Astrophys. J. Supplement Series, 335, 1037
- Mastropietro & Burkert (2008) Mastropietro C., Burkert A., 2008, Mon. Not. Roy. Astron. Soc., 389, 967
- Merten et al. (2011) Merten J., et al., 2011, Mon. Not. Roy. Astron. Soc., 417, 333
- Navarro et al. (1997) Navarro J. F., Frenk C. S., White S. D., 1997, Astrophys.J., 490, 493
- Neto et al. (2007) Neto A. F., Gao L., Bett P., Cole S., Navarro J. F., et al., 2007, Mon.Not.Roy.Astron.Soc., 381, 1450
- Oguri et al. (2009) Oguri M., Hennawi J. F., Gladders M. D., Dahle H., Natarajan P., et al., 2009, Astrophys.J., 699, 1038
- Oguri et al. (2005) Oguri M., Takada M., Umetsu K., Broadhurst T., 2005, Astrophys. J., 632, 841
- Okabe & Umetsu (2008) Okabe N., Umetsu K., 2008, PASJ, 60, 345
- Peebles (1984) Peebles P., 1984, Astrophys.J., 277, 470
- Ponente & Diego (2011) Ponente P., Diego J., 2011, A&A, 535, A119
- Postman et al. (2011) Postman M., Coe D., Benitez N., Bradley L., Broadhurst T., et al., 2011, A. Astro. Soc.
- Schneider (1994) Schneider P., 1994, Astron. & Astrophys., 302, 639
- Schneider & Seitz (1995) Schneider P., Seitz C., 1995, Astron. & Astrophys., 294, 411
- Seitz & Schneider (1995) Seitz C., Schneider P., 1995, Astron. & Astrophys., 297, 287
- Sikivie & Yang (2009) Sikivie P., Yang Q., 2009, Physical Review Letters, 103, 111301
- Springel & Farrar (2007) Springel V., Farrar G. R., 2007, Mon. Not. Roy. Astron. Soc., 380, 911
- Taylor et al. (1998) Taylor A. N., Dye S., Broadhurst T. J., Benítez N., van Kampen E., 1998, Astrophy. J., 501, 539
- Thompson & Nagamine (2012) Thompson R., Nagamine K., 2012, Mon. Not. Roy. Astron. Soc., 419, 3560
- Tyson et al. (1998) Tyson J. A., Kochanski G. P., Dell’Antonio I. P., 1998, Astrophy. J. Lett., 498, L107
- Umetsu & Broadhurst (2008) Umetsu K., Broadhurst T., 2008, The Astrophysical Journal, 684, 177
- Umetsu et al. (2011) Umetsu K., Broadhurst T., Zitrin A., Medezinski E., Coe D., Postman M., 2011, Astrophys. J., 738, 41
- Umetsu et al. (2010) Umetsu K., Medezinski E., Broadhurst T., Zitrin A., Okabe N., Hsieh B.-C., Molnar S. M., 2010, Astrophys. J., 714, 1470
- Umetsu et al. (2012) Umetsu K., Medezinski E., Nonino M., Merten J., Zitrin A., et al., 2012, Astrophys.J., 755, 56
- Velten & Wamba (2012) Velten H., Wamba E., 2012, Physics Letters B, 709, 1
- Widrow & Kaiser (1993) Widrow L. M., Kaiser N., 1993, Astrophys. J. Letters, 416, L71
- Woo & Chiueh (2009) Woo T.-P., Chiueh T., 2009, The Astrophysical Journal, 697, 850
- Zhao et al. (2009) Zhao D. H., Jing Y. P., Mo H. J., Börner G., 2009, The Astrophysical Journal, 707, 354
- Zitrin et al. (2009) Zitrin A., et al., 2009, Mon. Not. Roy. Astron. Soc., 396, 1985
- Zitrin et al. (2010) Zitrin A., et al., 2010, Mon. Not. Roy. Astron. Soc., 408, 1916
- Zitrin et al. (2013) Zitrin A., Meneghetti M., Umetsu K., Broadhurst T., Bartelmann M., et al., 2013, Astrophys.J., 762, L30