Planck 2013 results. VIII. HFI photometric calibration and mapmaking
This paper describes the methods used to produce photometrically calibrated maps from the Planck High Frequency Instrument (HFI) cleaned, time-ordered information. HFI observes the sky over a broad range of frequencies, from 100 to 857 GHz. To obtain the best calibration accuracy over such a large range, two different photometric calibration schemes have to be used. The 545 and 857 GHz data are calibrated by comparing flux-density measurements of Uranus and Neptune with models of their atmospheric emission. The lower frequencies (below 353 GHz) are calibrated using the Solar dipole. A component of this anisotropy is time-variable, owing to the orbital motion of the satellite in the Solar System. Photometric calibration is thus tightly linked to mapmaking, which also addresses low-frequency noise removal. By comparing observations taken more than one year apart in the same configuration, we have identified apparent gain variations with time. These variations are induced by non-linearities in the read-out electronics chain. We have developed an effective correction to limit their effect on calibration. We present several methods to estimate the precision of the photometric calibration. We distinguish relative uncertainties (between detectors, or between frequencies) and absolute uncertainties. Both these uncertainties lie in the range from 0.3% to 10% from 100 to 857 GHz. We describe the pipeline used to produce the maps from the HFI timelines, based on the photometric calibration parameters, and the scheme used to set the zero level of the maps a posteriori. We also discuss the cross-calibration between HFI and the SPIRE instrument on board Herschel. Finally we summarize the basic characteristics of the set of HFI maps included in the 2013 Planck data release.
Key Words.:
Cosmology: observations – Cosmic background radiation – Surveys – methods: data analysis1 Introduction
This paper, one of a set associated with the 2013 release of data from the Planck mission111Planck (http://www.esa.int/Planck) is a project of the European Space Agency (ESA) with instruments provided by two scientific consortia funded by ESA member states (in particular the lead countries France and Italy), with contributions from NASA USA) and telescope reflectors provided by a collaboration between ESA and a scientific consortium led and funded by Denmark. , describes the processing applied to Planck High Frequency Instrument (HFI) cleaned time-ordered information (TOI) to produce photometrically-calibrated sky maps.
CMB experiments can be calibrated using the dipole anisotropy induced by the motion of the instrument relative to the cosmological frame. This anisotropy is naturally separated into two components: we refer to the component generated by the motion of Planck around the sun as the orbital dipole, and that generated by the sun’s motion relative to the CMB as the solar dipole.
In principle, the orbital dipole is the most precise calibrator, as it depends on the very well known orbital parameters and the temperature of the CMB, measured precisely by the COBE-FIRAS experiment (Mather et al. 1999). However, calibration using the orbital dipole involves comparison of data taken at large time separation (typically 6 months), and the precision one can achieve using this calibrator is thus directly linked to that of the time stability of the data, and to the precision reached in addressing any time variable systematics. We have identified one such systematic, induced by non-linearities in the analogue-to-digital converters of the bolometers’ read-out electronic chain, and for the present release have chosen to use the solar dipole, based on the measurement of the solar dipole parameters from WMAP (Hinshaw et al. 2009), as the main calibrator for the 100 to 353 GHz channels. These parameters are summarized in Table 1.
At high frequency (500 GHz), the dipole becomes too faint with respect to the Galactic foregrounds to give an accurate calibration.
Although we used the Galactic emission as measured by FIRAS for the calibration of the Planck early papers (Planck HFI Core Team 2011a),
we have now obtained a better accuracy using planet measurements. Thus, the absolute calibration of the two high-frequency
channels is done using Uranus and Neptune.
At all frequencies, the zero levels of the maps are obtained by assuming
no Galactic emission at zero gas column density, and adding the Cosmic
Infrared Background (CIB) mean level.
The paper is organized as follows. We first summarize the mapmaking procedure (Sect. 2). We outline the calibration method used for the CMB-dominated channels (100 to 353 GHz) in Sect. 3. We discuss in this section unexpected response variations with time, and present an effective correction. We then detail the calibration for the 545 and 857 GHz channels (Sect. 4) and describe how the zero level of the maps can be fixed (Sect. 5). We finally quantify the accuracy of the photometric calibration, and give basic characteristics of the delivered maps in Sect. 6. Conclusion are given in Sect. 7.
| Amplitude [mK | ||
| Galactic longitude [∘] | ||
| Galactic latitude [∘] |
2 Pipeline for map production
The products of the HFI mapmaking pipeline are maps of , and , together with their covariances, pixelized according to the HEALPix scheme (Górski et al. 2005) with a resolution parameter . For a given channel, data sample may be described as
| (1) |
where denotes the sky pixel with Stokes parameters , and , is the noise realization, is the cross-polarization parameter (equal to 1 for an ideal spider-web bolometer and 0 for an ideal polarization sensitive bolometer), is the detector orientation on the sky, at sample , and is the detector’s gain. Given Planck’s scanning strategy, reconstructing , and requires combining measurements from several detectors for most pixels. According to bolometer models, and given the stability of the HFI operational conditions during the mission, is not expected to vary significantly,
In order to deal efficiently with the large HFI data set and the large number of maps to be produced, we use a two-step scheme to make maps from the HFI TOIs. The first step takes advantage of the redundancy of the observations on the sky. For each detector, we average the measurements in each HEALPix pixel visited during a stable pointing period (hereafter called ring), into an intermediate product, called an HPR for HEALPix Pixels Ring. Subsequent calibration and mapmaking operations use the HPR as input. As we produce HEALPix maps with the resolution parameter set to 2048 we use the same internal resolution for building the HPR.
The in-flight noise of the HFI detectors, after TOI processing, is mostly white at high frequency, with a “” increase at low frequency (Planck HFI Core Team 2011a). In such a case, a destriping approach is well suited for the mapmaking (Ashdown et al. 2009). In this approach, the noise in a ring is represented by an offset, denoted by , and a white noise part , which is uncorrelated with the low-frequency noise. We may then reformulate Eq. 1 as
| (2) |
where represents the sky (which may be a 3-vector if polarization is accounted for) in pixel , is the pointing matrix (which makes the link between data samples and their positions on the sky) and is the matrix folding the ring onto samples. From the above equation, are derived through maximum likelihood. As there is a degeneracy between the average of the offsets and the zero level of the maps, we impose the constraint . Tristram et al. (2011) have shown that with scanning and noise like those of HFI, an accurate reconstruction of the offsets requires a precise measurement of for each channel.
In addition, some signal components vary with time, adding more complexity to Eq. 2. Such components include the zodiacal light emission, the CMB dipole anisotropy component induced by the motion of the satellite with respect to the Solar System, and the far sidelobe (FSL) pick-up signal. Time variability of the former comes from the variation of the observation angle of the Solar System region emitting this radiation, due to the ellipticity and cycloid modulation of the satellite’s orbit. The FSL are discussed in Planck Collaboration VII (2014) and Planck Collaboration XIV (2014). Accounting for these components in the mapmaking process requires an accurate calibration. Moreover, we need to take into account the low-frequency noise in the calibration process, so both operations (mapmaking and calibration) are interleaved.
For the production of the maps of the 2013 HFI data release, we followed a four-step process.
-
1.
We first build the HPR for all detectors, for three data sets: all the data for each ring, and (for null tests) the data from just the first or just the second half of each ring.
-
2.
We then apply the following calibration operations to the HPR:
-
•
solar dipole calibration, which sets the overall calibration factors for the 100–353 GHz detectors,
-
•
planet calibration (Uranus and Neptune), which is used to get the calibration factors for the 545–857 GHz detectors,
-
•
determine the relative gain variations over time of the 100–217 GHz detectors, using the bogopix tool (see Sect. 3.3).
-
•
-
3.
For each data set we then do the destriping and projections, using the polkapix tool that was thoroughly validated in Tristram et al. (2011). We compute one set of offsets using the whole mission data set, and then use these offsets to compute the maps for the whole mission, as well as for restricted time intervals (corresponding to each individual survey, and to the nominal mission). Maps are built by simple co-addition in each pixel of the destriped, calibrated, and time varying component-subtracted signal. We subtract the WMAP measured CMB dipole from all our maps, using the non-relativistic approximation.
-
4.
The zero-levels for the maps are set a posteriori.
We have produced single-detector temperature maps, as well as temperature and polarization maps using all the detectors of a single frequency and some detector subsets. We have also produced hit-count maps and variance maps for the , and values computed in each pixel. Overall, a total of about sky maps have been produced. We used this data set to evaluate the performance of the photometric calibration. Note that the HFI pipeline we have described is quite similar to that used for the Low Frequency Instrument (LFI) (Planck Collaboration II 2014).
In order to take into account the Galactic signal integrated in the FSL and zodiacal light (hereafter called zodi) components, which vary in time, we have constructed templates for the combination of these components at frequencies where Galactic emission in the FSL matters, i.e., 545 and 857 GHz, and of zodi only at lower frequencies, as described in Planck Collaboration XIV (2014). These templates are used to build HPRs. We provide two sets of maps. The first set is built without removing these spurious components, while the second set is the differences between maps from the previous set and maps from which the zodi and FSL have been removed. The difference maps might be can be used to correct the HFI maps for specific applications.
In the following sections we will describe the calibration procedures and then assess their performance, and present some characteristics of the resulting maps.
3 Photometric calibration of the low-frequency channels: dipole-based calibration
3.1 ADC non-linearities and calibration
With a larger data set than that analyzed in Planck HFI Core Team (2011b), we could ideally use an orbital-dipole-based calibration, as described in Tristram et al. (2011). However, the additional redundancies revealed new systematic effects, ADC non-linearities and very long time constants (of the order of a few seconds) with very low energy content in the system’s response. The former induce apparent gain variations with time. The latter shifts the CMB dipole a few arcmin in the scan direction, and hence creates leaks from the Solar dipole into the orbital dipole signal. These systematic effects prevented us from using the orbital dipole calibration. The very long time constants were identified after correcting for the ADC non-linearities, and have not yet been fully characterized yet. Both corrections will be implemented in the Planck 2014 data release.
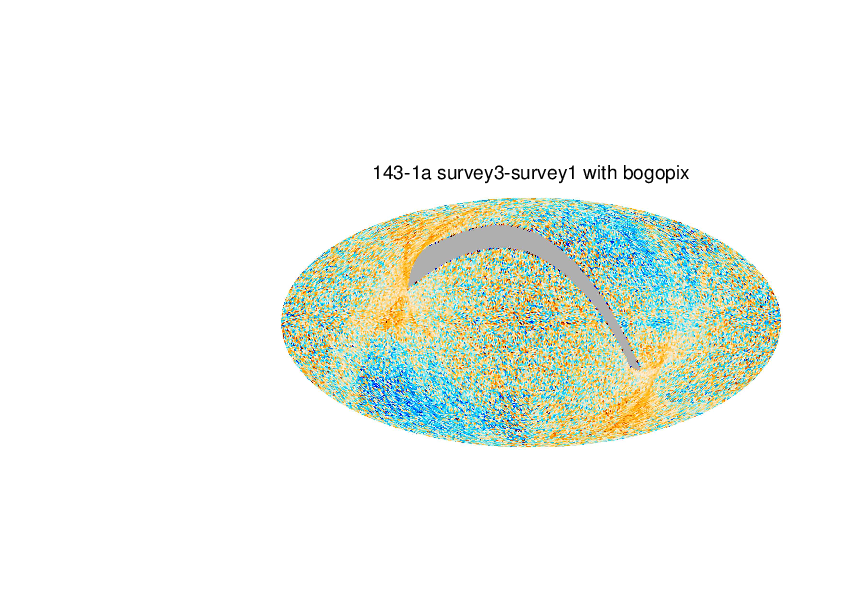
Effects of such ADC-induced gain variations are clearly visible when comparing Survey 3 with Survey 1 or Survey 2 with Survey 4. As an example, in Fig. 1 we show survey difference maps for one 143 GHz detector, built using the calibration and mapmaking scheme presented in Planck HFI Core Team (2011b). Large-scale dipolar features, aligned with the solar dipole, are prominent in these maps. This shows that the constant gain assumption used to build these maps is incorrect.
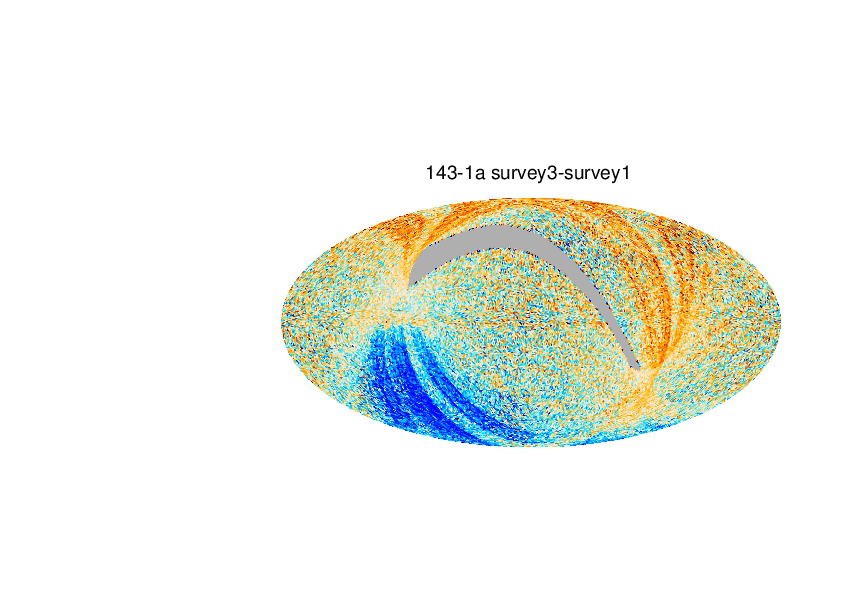
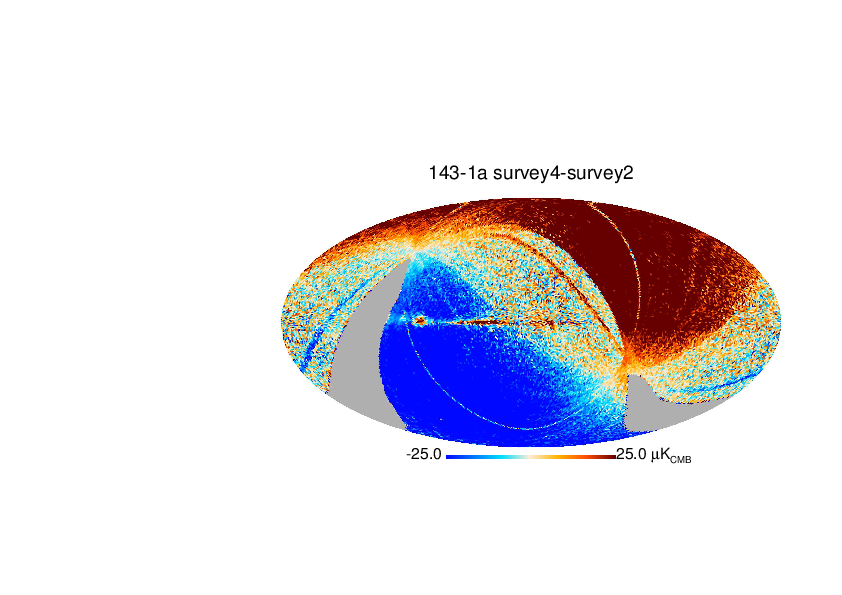
Intrinsic bolometer sensitivity variations cannot explain such gain variations. The HFI bolometers have been precisely characterized in flight using a dedicated sequence of measurements, during the post-launch verification phase and end-of-life periods. The static bolometer models predict that changes of their background during the observations could not explain response variations larger than 0.1 %. In addition, such variations are corrected for within the HFI DPC pipeline. In our present understanding, these apparent response variations are the result of imperfections in the linearity of the analogue-to-digital converters (ADC) used in the bolometer read-out units. The variation of the bolometer background with time and the unevenness in the ADC quantization steps leads, at first order, to an apparent gain variation in the electronic chain. These non-linearities may also affect signals differently depending on their amplitude, for example the solar and orbital dipoles.
Figure 2 shows the errors on the transition code positions measured on a spare ADC chip around the mid-scale, which is the most populated area. These “integrated non-linearities” (INL) present a prominent feature in all channels: the central step is always too narrow. In addition to this, the 64-code, nearly periodic patterns contribute to the apparent gain variations, making it difficult to predict the consequence of such errors on the reconstructed, demodulated bolometer signal. Such an INL effect has however been included in full mission simulations, and it reproduces qualitatively the gain variation features observed in real flight data, with an amplitude of about . This is larger than the required calibration precision of the 100 to 217 GHz channels.

In order to precisely correct all the data for this effect, we need accurate measurements of all the ADC INLs, together with a good model for the bolometer raw signal (including systematics). Mapping the ADC response required more data than were acquired before the end of the HFI cold lifetime, so a dedicated campaign has been conducted over several months, at a focal plane temperature of about K, to obtain a clean ADC characterization on Gaussian noise. Correcting this effect needs to be carried out prior to the TOI processing steps, and will require thorough checks of any products. At the time of writing, correction procedures are being intensively tested but they have not been included in the 2013 Planck data release.
In the absence of a full correction procedure, we had to develop an effective method to address the apparent bolometer gain variations that arise from the ADC non-linearities. In this method, the absolute scale is fixed by the solar dipole, to ensure a better robustness against higher-order non-linearities, as described in Sect. 3.2. Relative gains are determined using the scanning redundancies, as explained in Sect. 3.3.
3.2 Solar dipole calibration
The photometric calibration of the 100–353 GHz bolometers is based on the CMB dipole.
We estimate one value of the detector gain for each ring through a template fit of the HPR data. We fit the coefficients of a linear combination of dipole, Galactic signal, and noise, neglecting the CMB and the polarization:
| (3) |
Here represents the HPR samples from ring , is the value of the total (Solar and orbital) kinematic dipole, is a model for the Galactic emission, and is the white component of the noise. For simplicity, we used a non-relativistic approximation, as explained in Appendix A.2. We do not take into account the smearing of the dipole by the instrumental beam in our procedure, as justified in Appendix A.3. We simultaneously fit three parameters: , the gain of the kinematic dipole; , the gain of the Galactic model; and , a constant accounting for the low-frequency noise.
As the satellite scans circles on the sky, the ratio of the dipole and Galactic signal amplitudes varies. We use a Galactic model to obtain a measurement of the dipole gain, even in rings where the dipole amplitude is low. However, imperfection of that model may lead to bias in the dipole gain. To reduce this bias, we exclude pixels with a Galactic latitude lower than 9∘. Because we calibrate on the kinematic dipole, we do not use the gain in what follows. Pixels contaminated by point sources listed in the Planck Catalogue of Compact Sources (Planck Collaboration XXVIII 2014) are also excluded. The best model we have for the sky emission at the HFI frequencies being HFI measurements themselves, we use HFI sky maps at the detector frequency as a Galactic model, as shown in Appendix B.
Results of the gain estimation for each ring are shown in Fig. 3 for one detector (143-1a) . We can see that the gain estimate is less accurate on some ring intervals. This is due to the Planck scanning strategy: these intervals correspond to epochs when the Planck spin axis is orthogonal to the dipole direction. We can also see the apparent ring-by-ring gain variations, of the order of , explained in Sect.3.1. To show this more clearly, the figure compares the ring-by-ring variations reconstructed in Surveys 1 and 2 with those from Surveys 3 and 4.
The final gain value for each detector, hereafter denoted by , is defined as the average of these estimates between rings 2000 and 6000, between which the individual measurements for each ring have a dispersion of less than .

3.3 Effective correction and characterization
In order to handle time variation of the bolometer gains, we set up an effective correction tool, called bogopix (Perdereau 2006). We start from Eq. 2, but take explicitly into account the orbital dipole , which is time-variable, and also fit the gains for each bolometer independently. The problem finally reads
| (4) |
where is the ring number. The unknowns are the offsets , the sky signal represented by , and the gains , sampled using one value per ring. Since the orbital dipole is an absolute calibrator, the solution for should also fix the absolute photometric calibration.
We take advantage of the low amplitude of the observed gain variations to linearize this nonlinear problem, following an iterative approach. Starting from an approximate solution for the gains and sky maps , we determine the variations with respect to these, and , by solving :
| (5) | |||||
| (6) |
The linearized Eq. 6 may then be solved for , and by a conjugate-gradient method. Using and , the gains and sky maps can be updated. This process is iterated until a satisfactory solution is reached. To initialize the iterations, we start from the constant gain solution. We stop when the relative change in the derived from Eq. 4 is low enough ( in practice, when the change is less than ). This approach is similar to the one used for the LFI calibration (Planck Collaboration V 2014). It was successfully tested using the data set of Tristram et al. (2011), derived from simulated timelines with a Planck-like scanning strategy, realistic noise (both for the white and components), Gaussian beams, and delta-function bandpasses, for four 143 GHz polarization-sensitive bolometers over about 12000 rings. Figure 4 presents gains reconstructed with bogopix on simulated data, and compares them with the constant input gain values. From these results, we see that the precision of the gain value reconstructed for a single ring is about (which is comparable with the global precision of for a constant gain for 12000 rings found in Tristram et al. 2011).

We computed the gain variations using single-detector data, thus neglecting polarization. As in destriping (Tristram et al. 2011), gradients within the sky pixels used for will limit the accuracy of the gain determination. These gradients increase with frequency. Moreover, the ADC non-linearity will induce biases in the signal used for the gain determination. As this signal’s dynamic range increases with frequency, we expect this bias also to increase with frequency. For these reasons, we used bogopix to determine an effective correction for the apparent gain variations only for frequencies GHz. To avoid the central part of the Galactic plane and point sources, we used the mask used for destriping in the Planck Early Results paper (Planck HFI Core Team 2011b, Figure 32).
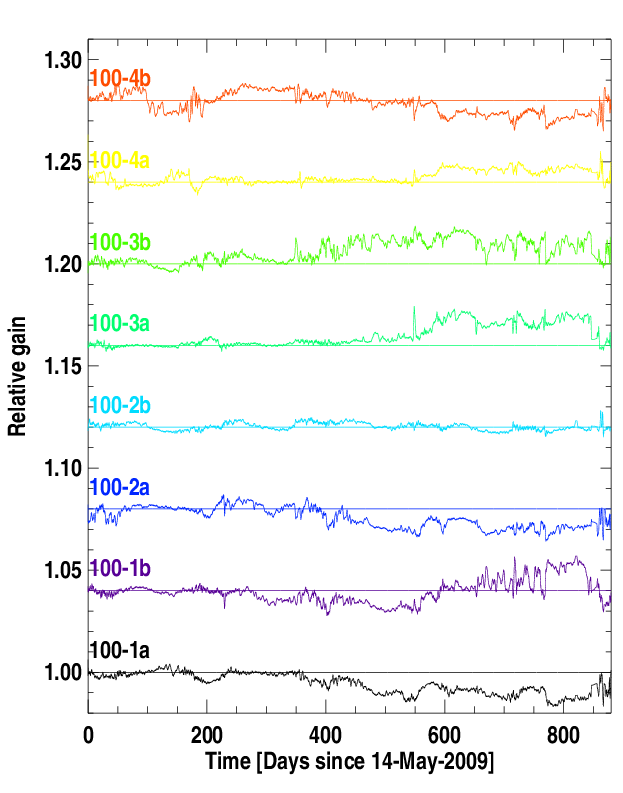
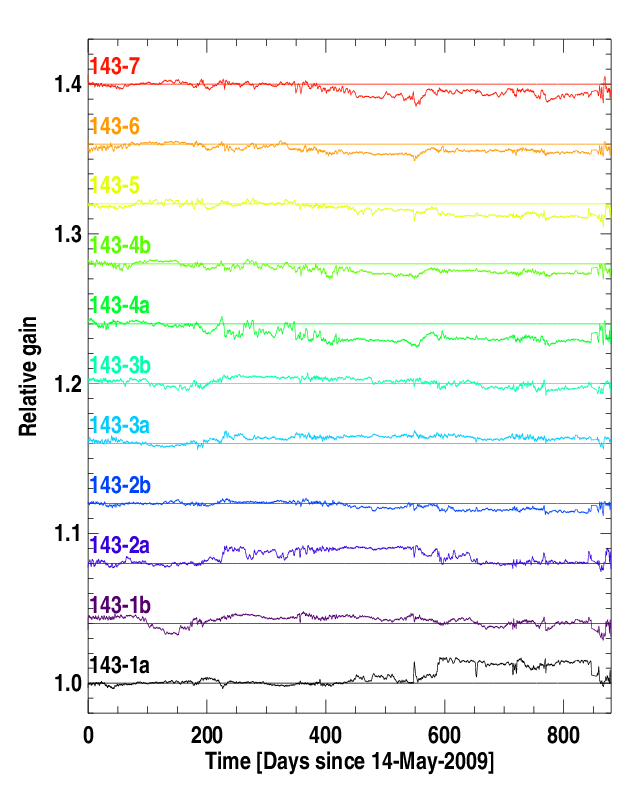
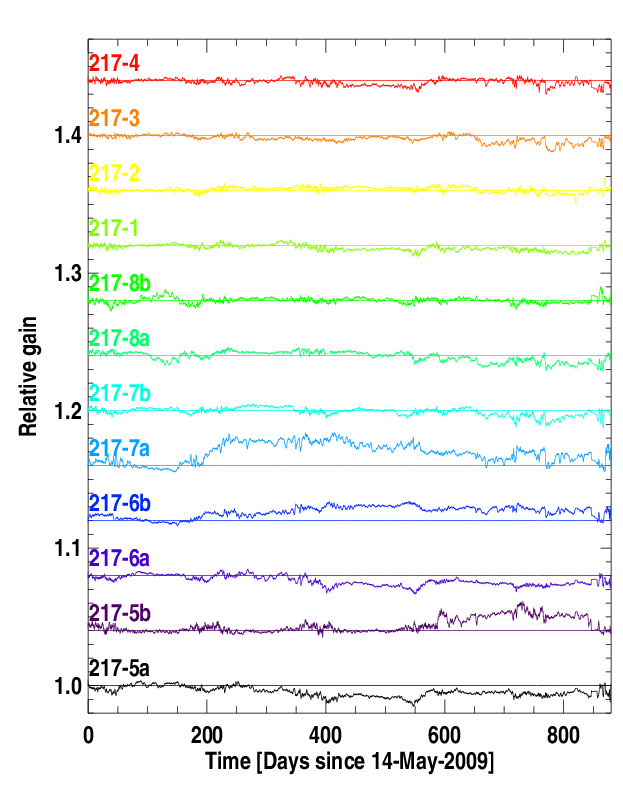
As shown in Fig. 5, the variations of the gains found with bogopix follow nicely those from the solar dipole calibration () in the regions where this signal is large. The lower level of fast variations from bogopix in the time intervals where the scan lies close to the Solar dipole equator and at the same time close to the Galactic plane, indicates that the bogopix results are less biased for these rings. We observe apparent gain variations on time scales of a few hour as well as months, with amplitudes of 1 to 2 % maximum, largely uncorrelated from one detector to another.


The averaged gain level determined by the two methods are, however, different by 0.5 to 1 %, and the difference varies from one detector to another. We believe this is due to the different scales of the calibrating signals in the two methods: the absolute scale of bogopix results is set by that of the orbital dipole, a factor of 5 to 10 lower in amplitude that the solar dipole used in the other method. These signals are thus affected to different degrees by the ADC non-linearities. In the simplest case, the effect of the non-uniformity of the ADC digitization steps is a fixed offset (positive or negative) added on top of the signal, when this signal oversteps a given level, so the resulting calibration bias will be lower for the largest calibration signal.

We study the difference between the averaged solar dipole gain, , and the average of the bogopix results, , in the same ring interval, denoted by . We introduce another calibration process, based on the orbital dipole as described in Tristram et al. (2011), together with bogopix gains, renormalized so that they average to 1 between rings 2000 and 6000 (corresponding to days 60 and 190 approximately), to correct for the apparent relative gain variations. This produces another estimate of the absolute gain, . The relative differences, , are shown in Fig. 6 for each 143 GHz detector. Both methods agree with each other within 0.05 to 0.1 %. We conclude that the difference between and is genuine and it seems to be due to the use of the orbital dipole as the calibrator.
 |
 |
 |
We showed in Tristram et al. (2011) that calibration errors induce large-scale features in the and Stokes parameter maps. When using the orbital-dipole-based calibration factors to build these maps, we indeed observe such large-scale patterns, which is further evidence that the latter factors are biased. We also observed a noticeable residual dipole in the reconstructed detector maps, after subtraction of the WMAP measured dipole, for the detectors where the difference between the solar and orbital dipole calibration was larger. We therefore conclude that, in the absence of an accurate correction for the ADC non-linearities, the orbital-dipole calibration scheme cannot be used to calibrate the HFI data.
3.4 Dipole calibration pipeline
We used the bogopix results only as to measure the relative gain variations, by normalizing to 1 on average between rings 2000 and 6000 (where the solar dipole calibration is computed). We show as an example a compilation of the relative gains reconstructed for the 100, 143, and 217 GHz detectors in Fig. 7. The absolute calibration scale of the CMB channels (100–353 GHz) is set by the solar dipole calibration, as in the HFI early data release (Planck HFI Core Team 2011a), which relied on WMAP solar dipole measurements (Hinshaw et al. 2009).
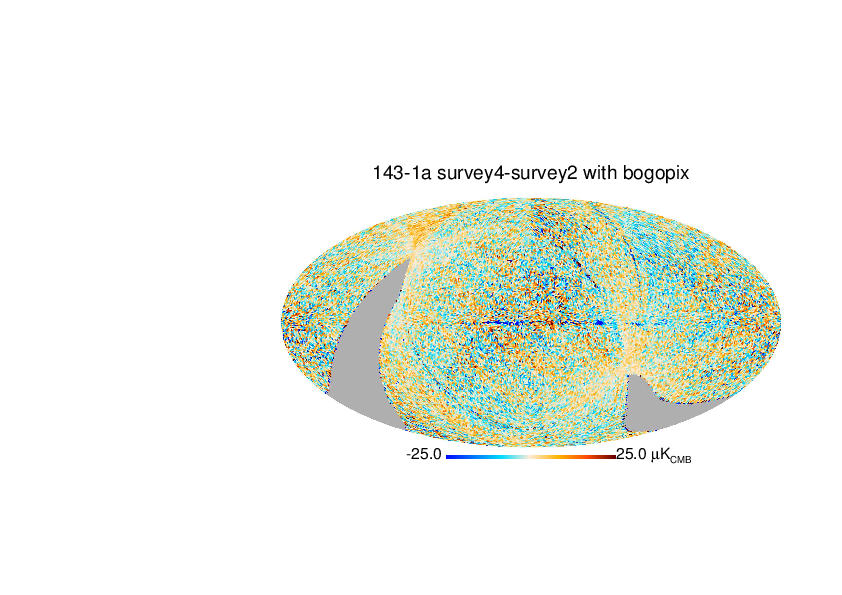
As a first example of the improvements that bogopix provides, we show in Fig. 8 the survey-difference maps (Survey 3 minus Survey 1, and Survey 4 minus Survey 2), for the detector used for Fig. 1. The differences obtained using bogopix are lower than KCMB outside the Galactic plane. The remaining residuals in that region, in particular in the Survey3Survey1 difference, can be attributed to the nonlinear nature of the systematic error, only the first-order linear part of which is handled by bogopix.
For frequencies GHz, bogopix results are not reliable, mainly because of the large spatial variation of the sky emission inside a pixel (we have used 1.72′ pixels here). Therefore, we do not correct the highest-frequency channels for any gain variations. This leads to calibration uncertainties of about 1% between maps from individual surveys.
| Frequency | Statistical error | Systematic | Systematic |
|---|---|---|---|
| GHz | [%] | (worst case) [%] | [%] |
| 100 | 0.004 | 0.64 | 0.37 |
| 143 | 0.002 | 0.53 | 0.29 |
| 217 | 0.002 | 0.69 | 0.41 |
| 353 | 0.010 | 2.53 | 1.81 |
3.5 Dipole calibration uncertainties for single detector
For the dipole calibration scheme, the statistical uncertainties are estimated by propagating the TOI sample variances (NET) to the ring-by-ring gain estimation on the solar dipole, averaged between rings 2000 and 6000, for each detector. These uncertainties are much lower than the systematic uncertainties that dominate our calibration measurement. We estimate the size of these systematic uncertainties on the calibration of individual detectors by measuring the dispersion of these ring-by-ring gains. Both uncertainties are listed in Table 2, which gives their average at each frequency. The WMAP solar dipole amplitude uncertainty (0.24%, Hinshaw et al. 2009) is not included. The systematic errors given here should be considered as upper limits on the real systematics, as they have been derived from solar dipole ring-by-ring gains prior to the bogopix correction. We indicate the effect of the choice of a Galactic template by indicating a “worst case” scenario (second column of Table 2) in which a non-optimal template was used (see Appendix B for details). When combining different detectors, some of these systematic errors should partially average out for temperature. The gain variation part, for example, is independent from one detector to another. To get a more precise estimation of the calibration accuracy for the frequency maps of this release, we have performed more elaborate tests, which are presented in Sect. 6.
4 Photometric calibration of the high-frequency channels
4.1 From FIRAS-based to planet-based absolute calibration
Since the early days of the Planck data, it has been apparent that the ratio between HFI and FIRAS is not constant across the sky: we observe spatial gain variations, i.e., variation of the calibration coefficient , and thus variation of the offset (see Eq. 17), that mimic a decrease of with brightness222These should not be confused with the apparent gain variation with time, discussed in Sect. 3.1.. Comparison with the dipole calibration at 353 GHz showed that the high-latitude gradients () give a better agreement. This was thus adopted for the calibration of the Planck early results (Planck HFI Core Team 2011b). We studied this unresolved discrepancy with the FIRAS maps further while preparing the first major release of Planck data. As detailed in Appendix C, numerous tests and checks have been conducted. However, we could not find any remaining HFI systematics, or any bias in our method of comparison of the two data sets, that could explain such a discrepancy. The only possibility comes from a systematic bias in the FIRAS “pass4” interstellar dust spectra. Indeed, Liang et al. (2012) propose significant revisions to the FIRAS dust spectra that that would reduce the discrepancy with HFI (see their figure 1).
In parallel, indications have come to light of an overestimate of the HFI brightness at high frequencies, when calibrating using FIRAS (see Sect. C.5). These have led us to adopt a new photometric calibration scheme for the sub-millimetre channels. We now compare planet flux-density measurements at 545 and 857 GHz with models in order to set the absolute calibration. The ultimate scheme would be to intercalibrate the 545 and 857 GHz channels with the lower-frequency channels, using the planet models as relative calibrators. Indeed, for the Neptune and Uranus planet models used for the calibration, the absolute scale of the model is known to about 5 %, whereas the relative inter-frequency uncertainty is expected to be of order of 2 % (Moreno 2010). In this section we present our calibration procedure for the 2013 data release.
4.2 Planet flux densities: measurements and comparison with the models
Planck observes the five outer planets: Mars, Jupiter, Saturn, Uranus, and Neptune. The 21 planet observations made by Planck-HFI have been analyzed. For calibration purposes, only Neptune and Uranus are used because
- (i)
-
Jupiter data lie partly in the nonlinear regime of the HFI read-out system,
- (ii)
-
Jupiter and Saturn have strong absorption features that make comparison with the broad-band measurements difficult,
- (iii)
-
Mars’s flux varies strongly from season to season.
Even if this last issue can be handled precisely by the models, it complicates the analysis, so we defer the use of Mars to future work. For the present data release we applied correction factors to the FIRAS-based calibration coefficients to match the Uranus and Neptune flux densities given by the Moreno (2010) model.
4.2.1 HFI beams and solid angles
The HFI beam solid angles used in this analysis are those derived from Mars observations. We do not use solid angles from the beams that are averaged over the scanning history (the so-called effective beams, Planck Collaboration VII 2014), because we consider each observation of Uranus and Neptune for each bolometer separately, and therefore we do not need to compute an average point spread function. We correct for the small response at large scales (more than 40′ from the beam centroid) that is due to incomplete deconvolution of the bolometer/readout electronics time response, as measured on Jupiter. Details of the beam solid angle measurements are given in Planck Collaboration VII (2014).
The beam solid angle is frequency-dependent and its measured value thus depends on the SED of the source. The solid angle for a planet (with an SED roughly proportional to ) is different from that for the photometric convention . Maffei et al. (2010) and Tauber et al. (2010) investigated the variation of the beam size across the passband using a pre-launch telescope model. For the lowest frequency HFI bands 100, 143, and 217 GHz, the beam size reaches a minimum near the centre of the band, making the solid angle a weak function of the source’s SED. The beam colour corrections for these bands are expected to be less than 0.3 %. At 353 GHz the solid angle increases with frequency across the band, but the beam colour corrections are expected to be less than 1 %. The multi-moded horns at 545 and 857 GHz are more difficult to model because of uncertainty in the relative phase and amplitudes of the modes propagating through each horn. The models of Murphy et al. (2010) give upper limits on the beam colour correction to the solid angles of 2 % at 545 GHz and 1 % at 857 GHz.
The FWHM of the beam on the sky is defined by the energy distribution at the entrance of the horn, which – owing to the optical design of the Planck telescope – does not depend much on the frequency within the band. The throats of the horns are positioned very close to the focal plane of the telescope, with a deviation varying from horn to horn. If the deviation is small, the variation of the beam solid angle on the sky will be symmetric around the centre of the band, and the combined correction will be small. On the other hand, if the horn is significantly offset, the variation will not be symmetric, and the correction will be larger. An estimate of the correction is presented in Planck Collaboration VII (2014).
The variation of the solid angle inside the band is negligible compared to the error we have on the photometry, and for now the beam solid angle variation for the high-frequency channels has not been taken into account in the calibration. The low variation of resolution across the passband is unusual for a sub-millimetre experiment. By way of comparison, in SPIRE on Herschel the FWHM varies by 17%. The SPIRE beam solid angles have been measured on Neptune; using the photometric convention , the corrections to the beam solid angles are about 3.3 % at 350 m and and 5.9% 500 m (Griffin & al. 2013).
4.2.2 Uranus and Neptune flux measurements and model comparison
Our calibration procedure follows the following steps:
-
•
A first photometric calibration was set using FIRAS at 545 and 857 GHz.
-
•
We created maps with a 2′ pixel size around the planet positions by projecting the destriped and calibrated timelines, using the nearest grid point algorithm, from timelines scanning each planet.
-
•
We built maps of the same sky area, using observations taken at different epochs (when the planet was at a different position) to estimate the sky background, and subtracted them from the planet maps. At GHz, the background is negligible. At 857 GHz, the astrophysical background is a few percent of the peak signal of Neptune.
-
•
We measured the planet flux densities using aperture photometry on the background-subtracted maps. We integrated the flux up to 3 FWHM. We corrected for the beam solid-angle difference between this scale and the full solid angle. This correction amounts to 0.8 % at 545 GHz and 1.5 % at 857 GHz.
-
•
At 545 and 857 GHz, we applied a correction factor to the FIRAS calibration to match the Uranus and Neptune flux densities given by the models. The factors were the same for all bolometers within a frequency channel, namely 1.07 at 857 GHz and 1.15 at 545 GHz.
The measurements are colour-corrected (using Eqs. 10 and 11) and the flux densities are quoted for the two planet spectra. Colour corrections vary from about 0.92 (at 353 GHz) to 1.05 (at 143 GHz). In the sub-millimetre channels they are ¡ 2 % at 857 GHz and about 5 % at 545 GHz. Errors on the colour corrections are estimated to be 0.25, 0.06, 0.01, 0.006, 0.003 and 0.002 % from 100 to 857 GHz (Planck Collaboration IX 2014).
From the flux densities and the planet solid angles estimated for HFI at the date of the observations, we can compute the brightness temperatures . They are given in Table 3, where we averaged the flux densities computed for all detectors in a channel, and all observations’ epochs (four), prior to the computation of . The quoted error on comes from the standard deviation of the flux-density measurements.
| Frequencies | Uranus | Neptune | ||||||||||||||||||||||||||||||
|---|---|---|---|---|---|---|---|---|---|---|---|---|---|---|---|---|---|---|---|---|---|---|---|---|---|---|---|---|---|---|---|---|
| GHz | K | K | ||||||||||||||||||||||||||||||
|
|
|
We use the models called ESA2 for Uranus and ESA3 for Neptune developed by R. Moreno for the Herschel-SPIRE absolute photometric calibration (Moreno 2010). The millimetre and sub-millimetre spectra of Uranus and Neptune were modelled with a line-by-line radiative transfer code accounting for the spherical geometry of their planetary atmospheres, like that described for Titan by Moreno et al. (2011). Atmospheric opacity due to the minor species CO (for Neptune only), and NH3 far wings, as well as collision-induced opacities of the main species (, , ) were included. The thermal profiles in the troposphere, which is the atmospheric region probed between 90 and 900 GHz, were taken from Lindal (1992). The uncertainty of the computed brightness temperature is mainly linked to the uncertainty on the thermal profile with an absolute uncertainty value of 5 %. The relative calibration (between frequencies) is expected to be of the order of 2 %.
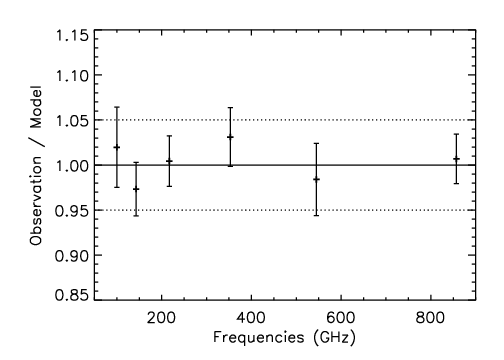
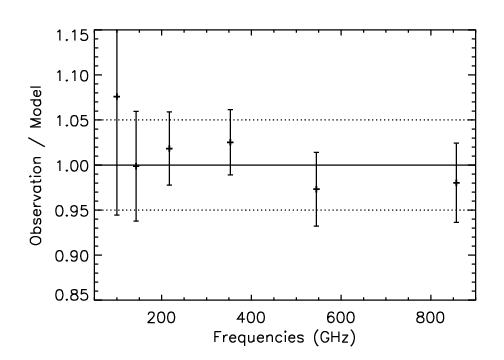
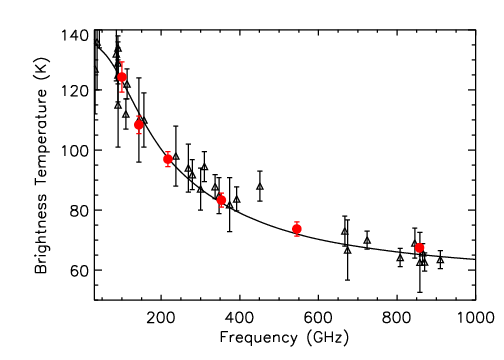
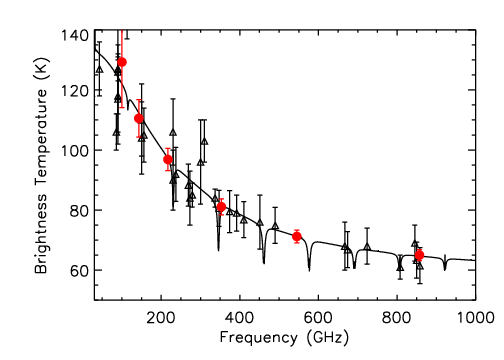
We compute the flux densities using the brightness temperatures from the model and the planet solid angles estimated for HFI at the date of the observations. The model spectra (in Jy) are interpolated onto our bandpass frequencies, and convolved by our bandpass filters to obtain the flux densities as measured by HFI. In Fig. 9 we compare the flux measurements with the models. Error bars on the HFI data points correspond to the standard deviation of the measurements (for all bolometers and all epochs). For the two high frequencies (857 and 545 GHz), the agreement with the model has been forced by our calibration procedure. For the lower frequencies, calibrated using the dipole, we have an overall very good agreement with the model, the two being compatible within the error bars. Fig. 10 shows the same comparison, but on spectra plotted in brightness temperature, and with other measurements from the literature. Notice the high accuracy of the HFI measurements over a wide range of frequencies.
4.3 Planet calibration uncertainties
At high frequencies, we estimate the error on the absolute calibration of the frequency maps to be 10 % (for both the 545 and 857 GHz channels). This uncertainty combines the statistical uncertainty in the flux-density measurements (5 %) with the systematic uncertainty in the Neptune and Uranus models, taken to be 5 %. Note that the latter is probably overestimated as we have a very good relative calibration between the low-frequency channels (143, 217, 353 GHz), which have a much more accurate absolute calibration, and the high-frequency ones.
5 Setting the zero levels in the maps
At this stage the zero levels of the maps are arbitrary. Planck cannot fix them internally and we need to rely on the use of external data sets. The zero level comprises two parts.
-
1.
A Galactic zero level: we estimate the brightness in the Planck-HFI maps that corresponds to zero gas column density (zero gas column density means zero Galactic dust emission). As a gas tracer, we use the Hi column density (from 21 cm emission), assumed to be a reliable tracer of the Galactic gas column density in very diffuse areas (column density lower than to avoid any contamination by molecular gas).
-
2.
An extragalactic zero level: the cosmic infrared background monopole.
The sum of the two offsets is appropriate for total emission analysis. For Galactic studies, only the Galactic zero level has to be set.
5.1 The Galactic zero level
Two methods have been combined to obtain reliable numbers. The first one uses the correlation of the Planck maps with Hi column density (following Planck Collaboration XXIV 2011, Planck Collaboration XVIII 2011, and Planck Collaboration XXX 2014). The basic idea is to estimate the brightness in the Planck maps that corresponds to zero column density by correlating with Hi, which is assumed here to be a reliable tracer of the Galactic gas column density in diffuse areas (it thus neglects any dust associated with the diffuse Hii gas that is not spatially correlated with the Hi). The model is simply
| (7) |
The correlation with Hi allows us to estimate independently for each frequency, but it relies on the assumption of a tight gas-to-dust correlation over relatively large areas of the sky.
The second method is based on the inter-frequency correlation of Planck maps, for which the model is
| (8) |
with being one the Planck maps. Here the offsets are all relative to the offset of that needs to be determined otherwise (by the first method for instance). The advantage of the second method is that no assumption is made on the phase in which the gas resides (we correlate dust emission with dust emission) and a larger area of the sky can be used to perform the correlation. All the data were smoothed to a common angular resolution of 1∘. CMB anisotropies, as extracted in Planck Collaboration XII (2014), were also removed from the data prior to the correlation.
For the correlation with Hi, we used the 21-cm all-sky data from the LAB survey (Kalberla et al. 2005). The LAB data are a collection of close to 200 000 spectra that were processed individually. The map of Hi column density used here is summed over velocities. The zero level of the LAB data (and of 21 cm observations in general) depends mostly on the baseline subtraction at the spectrum level. At 1420 MHz, the spectroscopic observation is the sum of the 21 cm line, the synchrotron and free-free emissions (which are well approximated by a power law at this frequency), and instrumental baseline variations due to various effects, including ground radio interference and system temperature variations. The 21 cm emission is usually extracted by removing a baseline using a polynomial fit constrained with velocity channels away from the Hi Galactic emission. The two radiotelescopes used to build the LAB data have a large velocity range coverage (from to 400 km s-1) allowing for a good estimate of the baseline. In addition many sky positions were observed several times, allowing improvement on the baseline correction. Because the baseline correction is applied on each individual spectrum, the noise on the zero level will be at the pixel size on the final map and no bias at large angular scales should be expected. Larger-scale zero-level variations could come from stray (far sidelobe) radiation. However, the LAB data were constructed with the most precise stray-radiation correction to date, leaving very faint residual emission, at a level of 2% (considering Galactic line emission). For the gain calibration, strong radio sources are used (see Kalberla et al. 2005). The calibration is performed regularly during observations to monitor any gain drift. The precision of the gain of the LAB data has no impact on the determination of the HFI zero level, as it is obtained through a correlation.
The first method requires the use of a very strict mask, to include only regions where the gas is mostly in the neutral atomic form (no significant dark gas for example) and avoiding lines of sight with significant emission from clouds in the Galactic halo (intermediate velocity clouds and high velocity clouds), as they have slightly different dust emission properties. We select pixels where the local velocity cloud Hi column density is less than cm-2 and where no significant IVC emission is detected. This very strict mask includes 11.5 % of the sky. For inter-frequency correlations (Eq. 8), a second mask was built by including pixels where the local velocity cloud Hi column density is less than cm-2 (and no restriction on IVCs), increasing the sky fraction to 28 %.
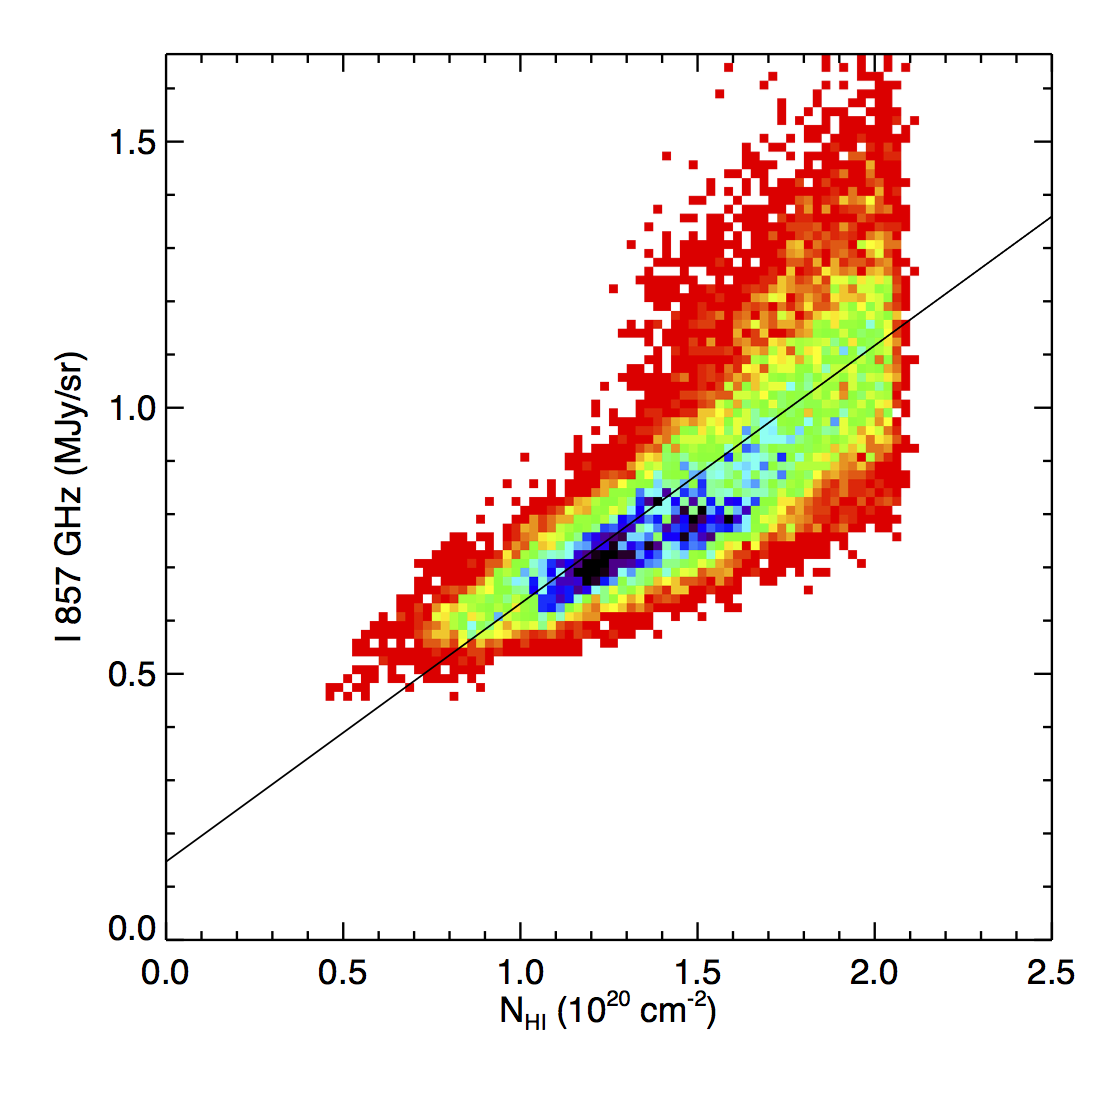
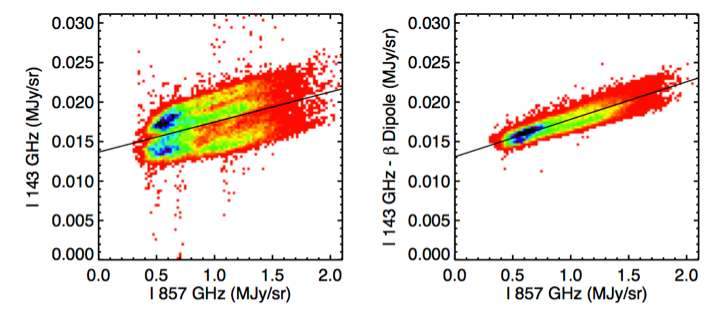
To minimize the effect of the imperfect dust-to-Hi correlation and to obtain the highest possible signal-to-noise ratio, the Galactic zero levels were computed using Eq. 7 at 857 GHz and using Eq. 8 at the other frequencies, thus taking . In Fig 11 we show the 857 GHz-Hi correlation. We observe a significant dispersion in this correlation, possibly due to variations of the dust-to-gas ratio or variations of the dust properties, or due to the fact that Hi is not a perfect tracer of column density (e.g., presence of dust in the warm ionized medium). Figure 12 shows an example of inter-frequency correlation, at 143 GHz. Their correlation plots are clearly split in two, revealing an effect unaccounted for in our model (Eq. 8). Once projected onto the sky, the residual shows that the north and south parts of the mask have different offset values. This bi-modal structure is minimized once a residual solar dipole is removed from the data. To set the Galactic zero level, we therefore also fit for the amplitude of an additional residual solar dipole term in Eq. 8. The amplitude of this residual dipole pattern is in accordance with the actual accuracy of the absolute calibration (discussed in Sect 3.5). Indeed, with a given accuracy on the absolute calibration, a dipole with an amplitude of at least the given accuracy can be left in the map. There is no contradiction between the amplitude of the dipole left in the maps and the current absolute calibration uncertainties, listed in Table 11. More precisely, we found residual dipole amplitudes compatible with a calibration error for 100–217 GHz and for 353 GHz.
5.2 The cosmic infrared background monopole
The (isotropic) mean value of the CIB is computed using the Béthermin et al. (2012) model. This is an empirical model based on the current understanding of the evolution of main-sequence and starburst galaxies. It reproduces the mid-infrared to radio galaxy counts very well. The values of the CIB (which is the integral of the emission from galaxies) have been computed using the HFI bandpass filters. They have then been converted into the convention using the CIB SED fit of Gispert et al. (2000). The values are given in Table 4. They are consistent with those extracted from FIRAS data (see Table 13). Errors are on the order of 20 %. The CIB has to be added to the maps for total emission analysis.
| Frequencies | CIB |
|---|---|
| GHz | MJy sr () |
| 100 | 3.010-3 |
| 143 | 7.910-3 |
| 217 | 3.310-2 |
| 353 | 1.310-1 |
| 545 | 3.510-1 |
| 857 | 6.410-1 |
5.3 Set the appropriate zero levels of HFI maps
For Galactic analysis, the Galactic zero levels, given in Table 5, have to be removed from the frequency maps in the 2013 data release . For total emission analysis, the CIB monopole, given in Table 4, has furthermore to be added. As stated previously, for the CIB we estimate the error to be of the order of 20 %. For the Galactic zero level, errors are given in Table 5. The uncertainty on the 857 GHz Galactic offset is dominated by systematics. At lower frequencies, the uncertainties take into account the impact of the CMB removal, the statistical uncertainty of the fit, and the error on the 857 GHz offset.
| Frequencies | Total maps | Zodi-removed maps |
|---|---|---|
| GHz | MJy sr | MJy sr |
| () | () | |
| 100 | 0.00470.0008 | 0.00440.0009 |
| 143 | 0.01360.0010 | 0.01390.0010 |
| 217 | 0.03840.0024 | 0.03920.0023 |
| 353 | 0.08850.0067 | 0.08510.0058 |
| 545 | 0.10650.0165 | 0.09470.0140 |
| 857 | 0.14700.0147 | 0.09290.0093 |
6 Characterization and checks of calibration
In this section we present the various tests that have been carried out to assess the precision and stability of the calibration of the HFI data.
6.1 Time stability of the calibration


To evaluate the accuracy of the apparent gain variation correction coming from bogopix we compute, for each detector, the residual difference between the HPR data and a model including the destriping offsets , the HFI , and maps, the dipoles (orbital and solar) and the calibration parameters (relative ring-by-ring gains from bogopix, overall gain based on the solar dipole, and zero point derived as described above). This corresponds, for each HPR sample of each ring , and pixel to:
| (9) |
We display these residuals as a function of the rotation phase, i.e., the angle between the direction of the pixel in the HPR and the satellite velocity, in Fig. 13. In this representation, the orbital dipole extrema will be found at fixed phases 0 and . The solar dipole will present a modulated pattern, also illustrated in Fig. 13. As the solar dipole is the brightest component of the sky emission, its pattern in the residuals is a good indication of inaccuracy of the gain variation correction. This may also capture additional time variable signals that would not be accounted for in our processing, for example the primary spillover pick-up. The areas where the Galactic emissions dominate show up as outliers in these residuals, for several reasons. First, they correspond to regions were intra-pixel gradients are large, and will leave some imprint due to the individual scanning trajectories of each detector. More importantly, they present emission spectra different from that of the CMB, on which we calibrate. Integrated over each detector’s bandpass, this will translate into an apparent brightness difference. At this stage, we do not apply colour corrections to get rid of such effects, considering that they can be minimized by a proper selection of the sky area (i.e., avoiding the Galactic plane). Finally, imperfections in the time response of the detectors and in the pointing reconstruction will also induce larger residuals in the Galactic plane. Masking these regions, using a 40 % Galactic mask, we checked that, for all the 100–217 GHz detectors, the maximum level of the residuals we observe would correspond to a remaining gain variation lower than 0.3 % (i.e., residuals lower than ).
 |
 |
6.2 Intra-frequency calibration checks
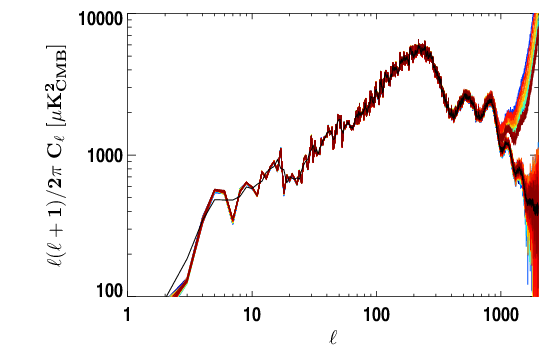
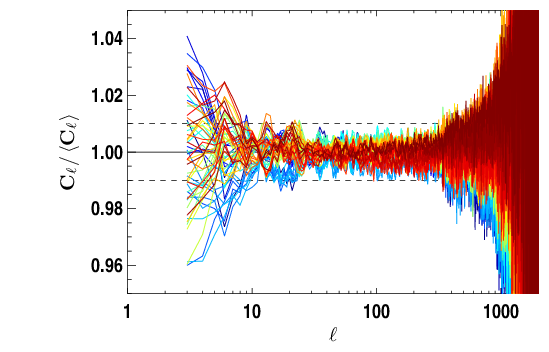
We have checked the relative calibration of the detectors within a given frequency channel using pseudo-cross-power spectra. We start from the single-detector temperature maps, neglecting polarization. We mask sky areas where the Galactic emissions are large, keeping 40 % of the sky for frequencies lower than 300 GHz and 30 % above. We build the pseudo-cross spectra of this set of maps, using Xspect (Tristram et al. 2005). We correct each pseudo-spectrum for its beam window function (Planck Collaboration VII 2014). We then focus on the location of the first acoustic peak, so that results are not biased by beam uncertainties. For example, the set of spectra we obtain for the 143 GHz HFI detectors is shown in Fig. 14. Finally, we fit the recalibration coefficients that minimize the differences between these spectra, for in the range [25, 300]. For 545 and 857 GHz we apply a colour correction for the band-pass mismatch between detectors, assuming the IRAS spectral convention. The relative calibration coefficients found with this method should be considered as upper limits on the relative calibration precision of HFI, as we neglect polarization in this analysis. They are given for all frequencies in Table 6. For frequencies below 217 GHz the relative calibration accuracy is better than 0.4 %. These relative accuracies are consistent with the systematic uncertainties estimated in the previous section.
| Frequency GHz | 100 | 143 | 217 | 353 | 545 | 857 |
|---|---|---|---|---|---|---|
| Calibration [%] | 0.39 | 0.28 | 0.21 | 1.35 | 1.3 | 1.4 |
In Fig. 15, we compare the relative calibration coefficients derived from the pseudo-cross spectra, for all 100, 143 and 217 GHz detectors, with the relative differences between gains based on solar and orbital dipole calibration methods (see Sect. 3.3). Both orbital dipole methods are affected by the same systematics, namely the ADC non-linearities. CMB anisotropies are well intercalibrated between detectors, using solar dipole calibration. This reinforces the choice of the solar dipole calibration.
 |
 |
 |
6.3 Inter-frequency and absolute calibration checks for CMB-dominated channels
In this section, we describe the checks performed to study the calibration accuracy for CMB channels.
6.3.1 Pseudo-cross-power spectrum analysis
We applied a technique similar to that presented in Sect. 6.2 to assess the HFI inter-frequency relative calibration for combined maps, at frequencies where the CMB dominates at high Galactic latitudes. We built pseudo-power spectra from the temperature maps for 100, 143, and 217 GHz, applying the beam correction described in Planck Collaboration VII (2014). As above, we determined the cross-calibration coefficients that minimize the difference between the pseudo-cross-power spectra of the HFI maps for in the range [25, 300]. Results from this analysis are shown in Table 7. We see from these numbers that the internal relative calibration precision within HFI is better than .
| Frequency [GHz] | 100 | 143 | 217 |
|---|---|---|---|
| Calibration | 1.002 | 0.999 | 0.999 |
6.3.2 Solar-dipole parameter fits
We also studied the calibration accuracy using fits of the CMB dipole parameters on HFI maps. To perform this test, we used maps built without dipole subtraction. Such fits are likely to be biased in the presence of foregrounds, in particular due to the intrinsic dipole of the Galactic emissions. We therefore used a template fitting method to subtract dust emission; our dust template is based on IRAS data (Neugebauer et al. 1984). We masked 10% of the sky, based on Galactic dust and CO emission, as well as point sources, before fitting the amplitude and direction of the CMB dipole. We recover the WMAP dipole amplitude measurement at the level of 0.1 % or better in all cases (Table 8). The direction, perhaps more affected by foreground residuals, is reconstructed within about . These results are in agreement with the residual dipole measurements presented in Sect. 5.1, which might be more sensitive to foreground removal and masking.
| Frequency | Amplitude | Longitude | Latitude |
|---|---|---|---|
| GHz | [%] | [′] | [′] |
| 100 | 0.122 | 2.30 | 11.09 |
| 143 | 0.074 | 3.00 | 11.91 |
| 217 | 0.091 | 5.10 | 12.79 |
6.3.3 Calibration checks using component separation methods
Finally, calibration consistency checks have been performed using component separation tools. In particular, the SMICA component separation method (Cardoso et al. 2008) has been used to fit relative calibration coefficients for each frequency (including LFI data) on the CMB anisotropies (Planck Collaboration XII 2014). The foreground model is a non-parametric 4-dimensional model, meaning that the foregrounds are represented by four templates with arbitrary emission laws, arbitrary angular spectra, and arbitrary correlations (2- and 3-dimensional fits were also performed with compatible results). Relative-calibration coefficients between frequency power spectra obtained using this method are summarized in Table 9. They agree, within errors, with the results shown in Tables 7 and 8. It should be noted that for frequencies GHz, Rayleigh scattering, not included in such studies, will distort the CMB anisotropies used to derive such cross-calibrations, at the few percent level (Yu et al. 2001). Therefore cross-calibration coefficients found for 353 and 545 GHz, which are of the same order, should be considered as estimates of systematic cross-calibration uncertainties, rather than genuine corrections of our maps. Such studies are routinely incorporated in Planck likelihood minimizations(Planck Collaboration XV 2014), and more results are shown in Planck Collaboration XV (2014). Comparisons with LFI and WMAP are presented in Planck Collaboration XVI (2014).
| Frequency | Relative calibration | Fisher errors |
|---|---|---|
| GHz | – | [%] |
| 100 | 0.999 | 0.2 |
| 143 | 1 | 0.2 |
| 217 | 1.000 | 0.2 |
| 353 | 0.993 | 0.3 |
| 545 | 1.05 | 3.5 |
6.4 HFI/SPIRE cross-calibration on diffuse emission
At high frequency, uncertainties in the SEDs of the astrophysical components, together with their variation across the sky, make extensive calibration checks as performed in Sect. 6.1 and 6.3 more difficult. However, we can study the cross-calibration between HFI and other data sets, like Herschel-SPIRE (Griffin et al. 2010). HFI and SPIRE have two very close frequency channels: 857 GHz for Planck versus 350 m for SPIRE, and 545 GHz versus 500 m. To compare the HFI and SPIRE brightness, we used nine large SPIRE public Galactic fields (for a total of about 75 deg2), with mean brightness ranging from 1.8 to 285 MJy sr-1 at 857 GHz.
For each field we create SPIRE 350 and 500 m maps using the Herschel Interactive Processing Environment pipeline HIPE v9.1. We applied the relative gain correction for extended emission and used the destriper module. SPIRE data are calibrated using Neptune and are given in Jy beam-1 for the convention . To convert the point source calibration to an extended emission calibration, we use the SPIRE beam solid angles of 822 arcsec2 and 1768 arcsec2 at 350 and 500 m respectively.333https://nhscsci.ipac.caltech.edu/sc/index.php/Spire/PhotBeamProfileDataAndAnalysis These values are also derived using the convention. SPIRE maps are then convolved with the HFI beam window function.
To compute the colour corrections, we use the SPIRE Relative Spectral Response Functions (RSRFs).444https://nhscsci.ipac.caltech.edu/sc/index.php/Spire/PhotInstrumentDescription The SPIRE beam FWHM values vary as with frequency, where at both 350 and 500 m (Griffin & al. 2013). To take this effect into account, we multiply the SPIRE RSRFs by and renormalize them. Colour-correction factors, to convert SPIRE monochromatic flux densities into HFI-like monochromatic flux densities, are computed assuming the real source spectrum is a modified blackbody of a given temperature and emissivity index: . The temperature and emissivity index are taken from the full-sky and maps available in the Planck Legacy Archive.
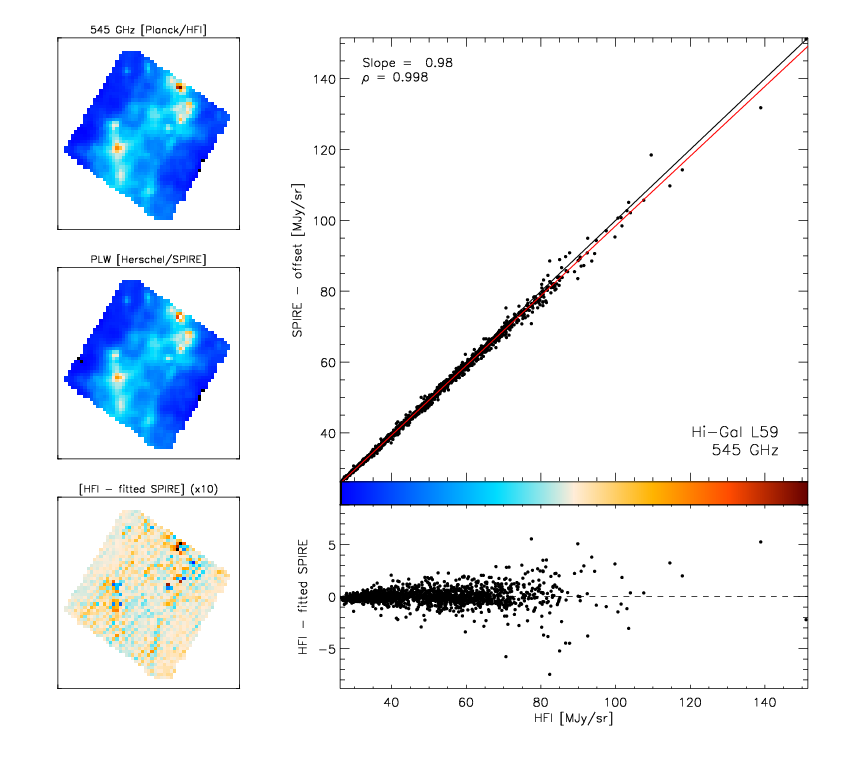
We estimate the agreement between the diffuse emission measurements from HFI and SPIRE by computing their correlation. An example of a scatter plot for one field and one frequency is shown in Fig 16. In all fields, HFI and SPIRE measurements correlate very well, with an average Pearson correlation coefficient of 0.998. The dispersion across the linear fit ranges from about to of the mean brightness of the field. The SPIRE/HFI gain ratios are at 545 and 0.936 at 857 GHz. At 545 GHz, the agreement between the HFI and SPIRE absolute calibration is very good. At 857 GHz, we observe a systematic trend, with SPIRE being lower than HFI by 6.4 %. This difference is just within the joint uncertainties of the absolute calibration of the two instruments, which are 5% for HFI (see Sect.4.3), and 2 % for SPIRE (see SPIRE observer manual555http://herschel.esac.esa.int/Docs/SPIRE/html/spire_om.html), putting aside the 5 % systematic uncertainty of the Planet’s models. We note however that the version of the SPIRE pipeline that was used for this comparison was based on the Neptune ESA2 model whereas HFI used the ESA3 model, which is of order 1.5 % higher over the frequency range of interest. Moreover, contrary to SPIRE, we also use Uranus to calibrate. Considering these additional sources of bias to the relative HFI-to-SPIRE calibration, we are not unduly worried about the current difference between HFI and SPIRE at 857 GHz.
6.5 Map noise level assessment
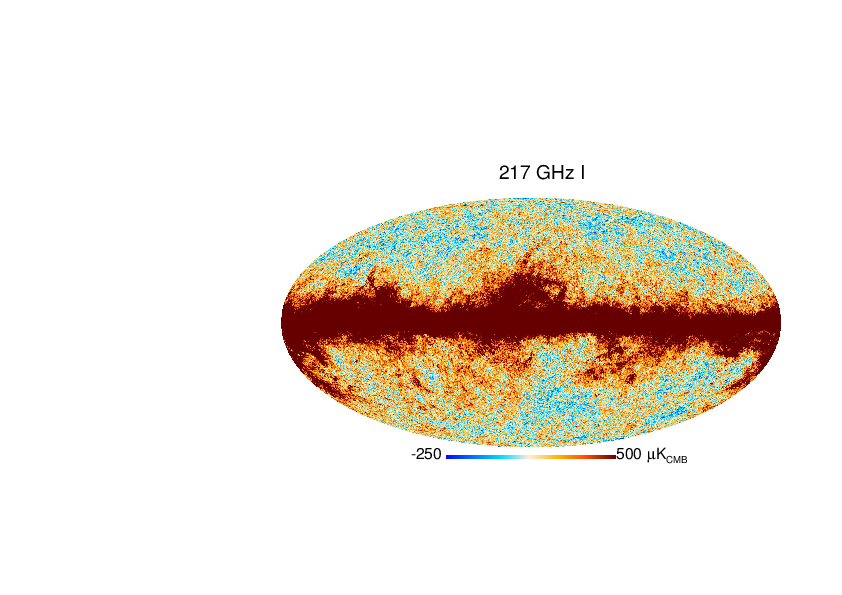
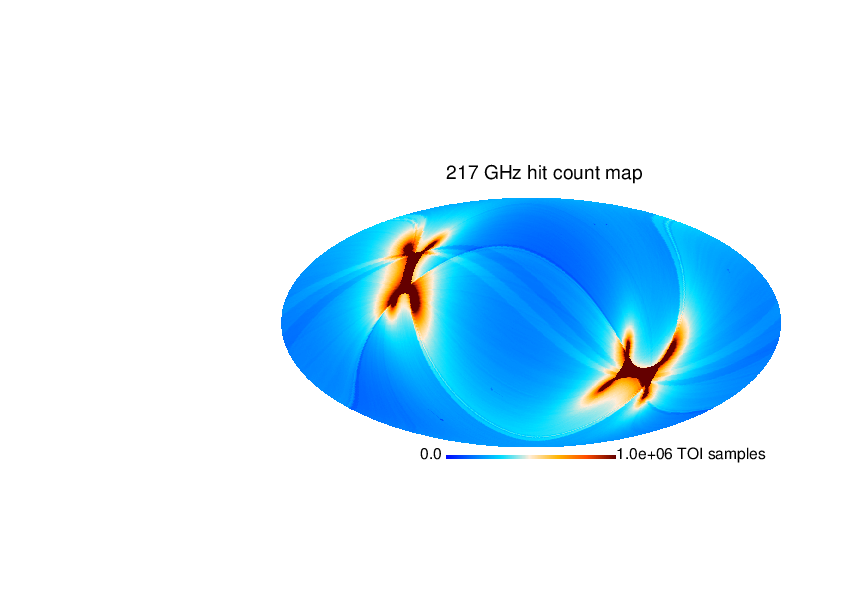
When combining detector data to build frequency maps, we apply an inverse noise weighting scheme. The weights we use are derived from the noise levels measured from clean TOIs together with the calibration coefficients. The resulting noise level in the combined maps is therefore a consistency check of the relative calibration between detectors, since a mis-calibration would result in additional noise, given the slightly different scanning path and redundancies of the detectors.
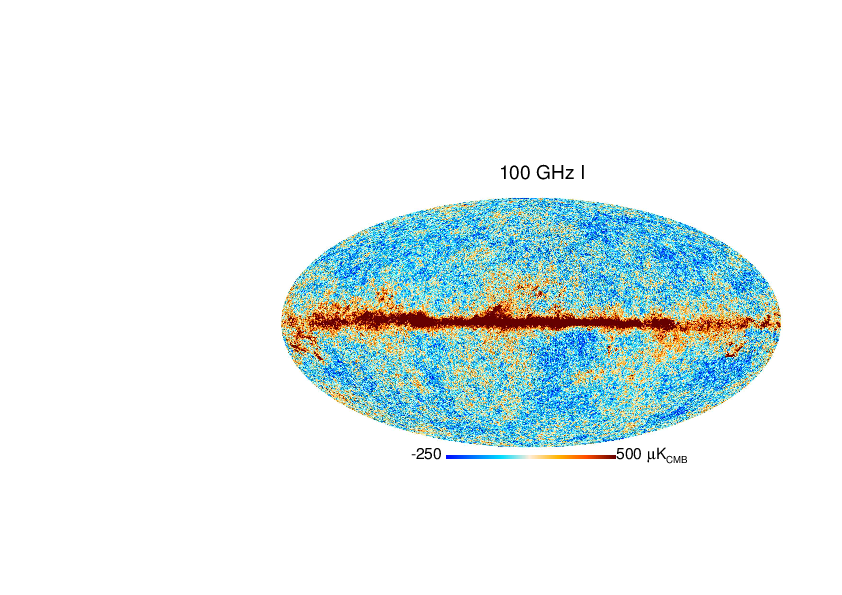
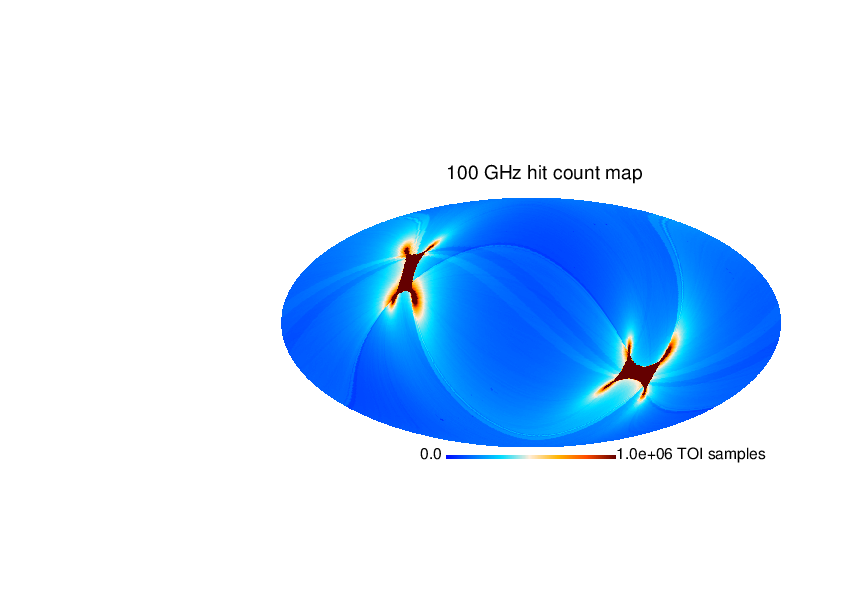
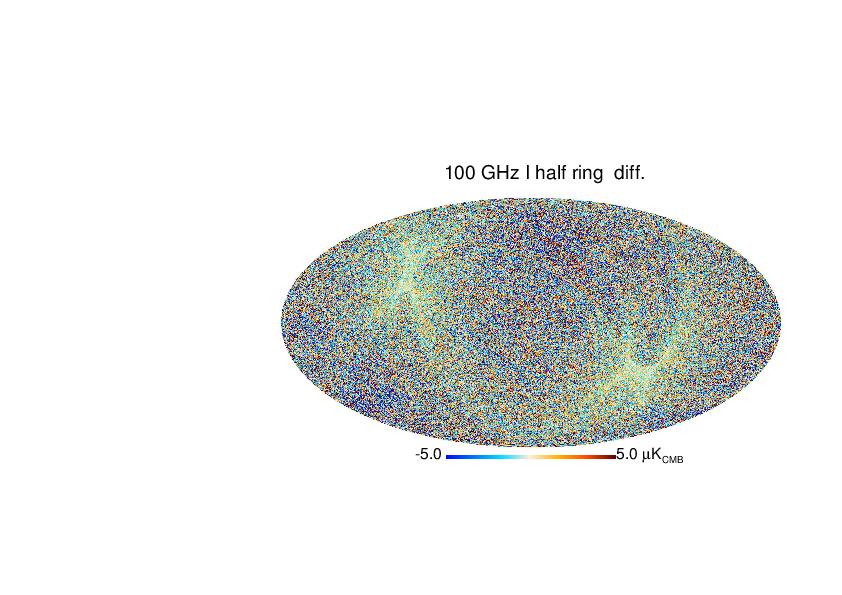
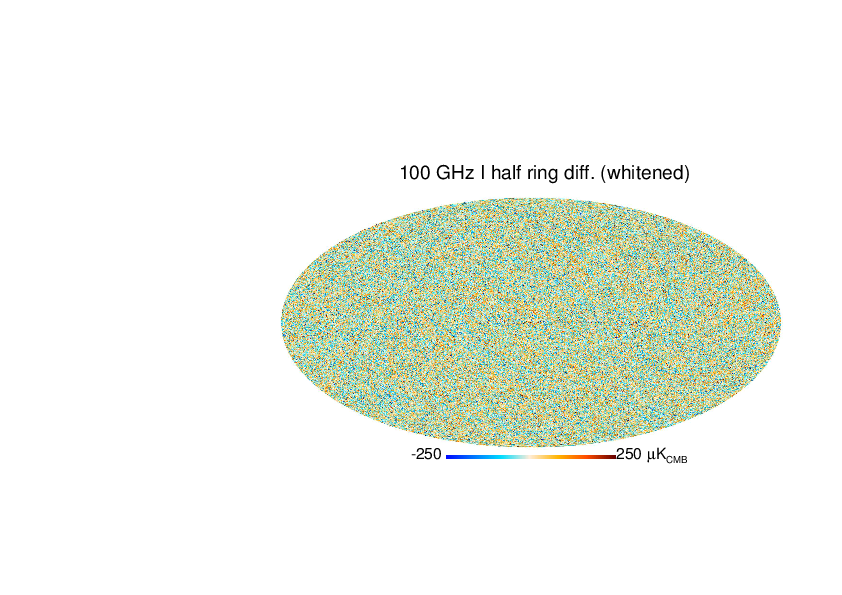
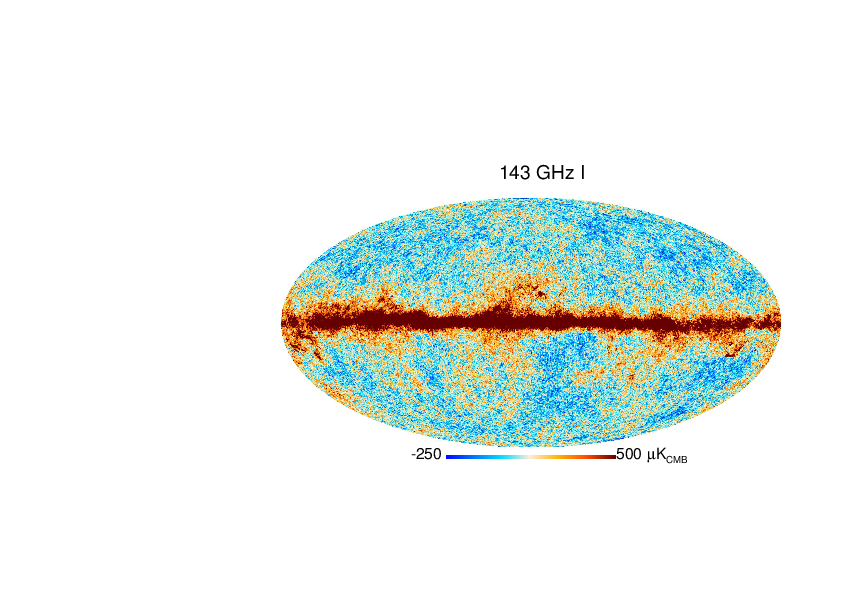
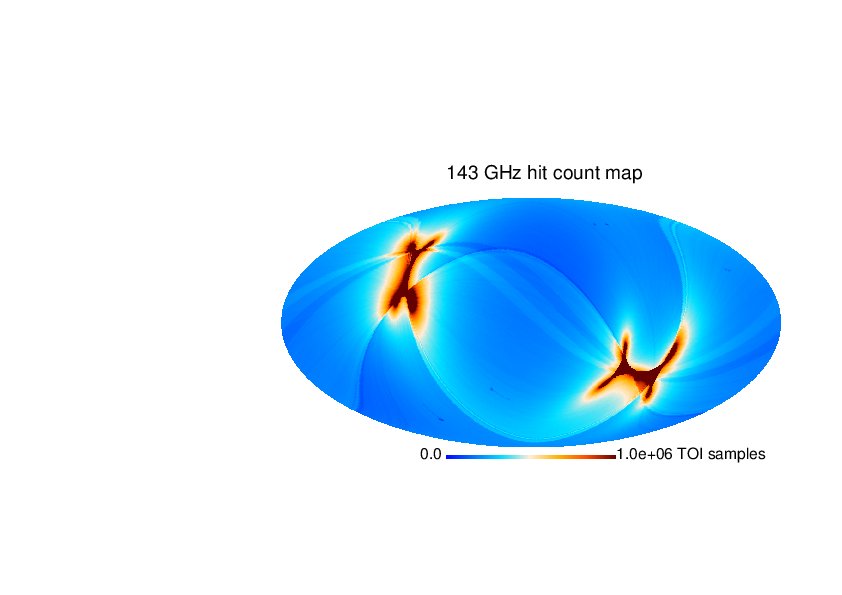
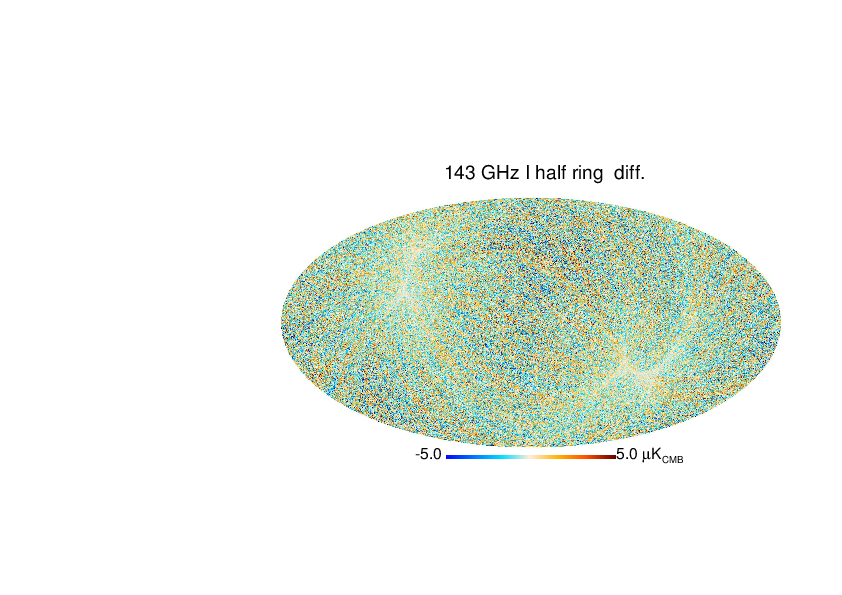
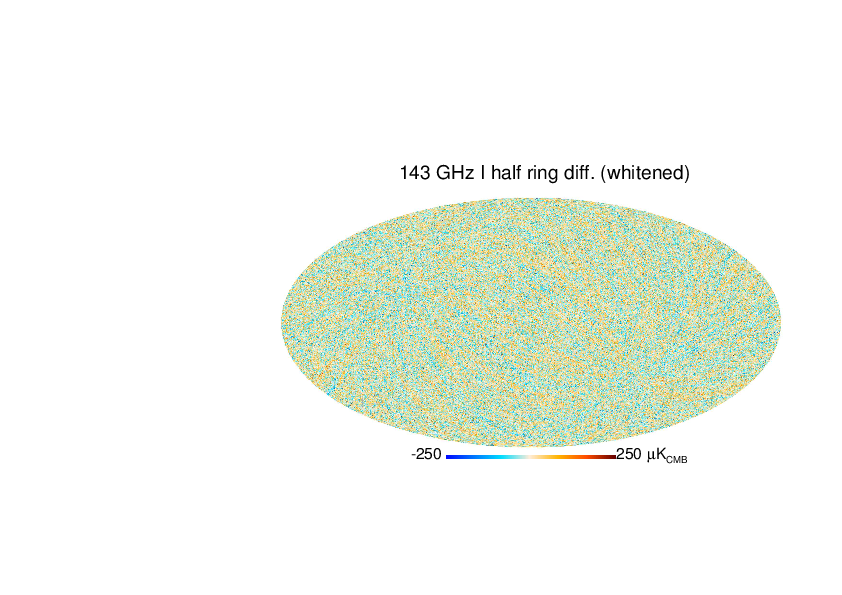
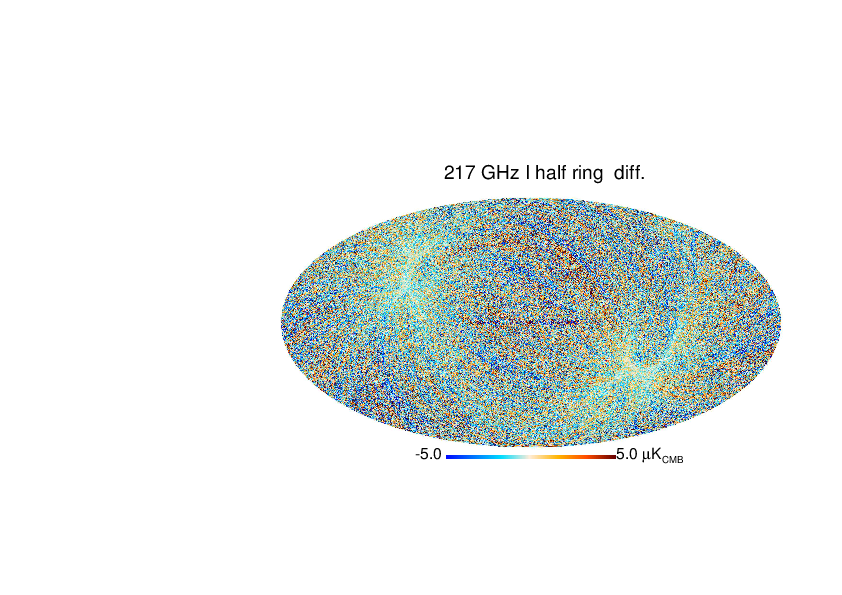
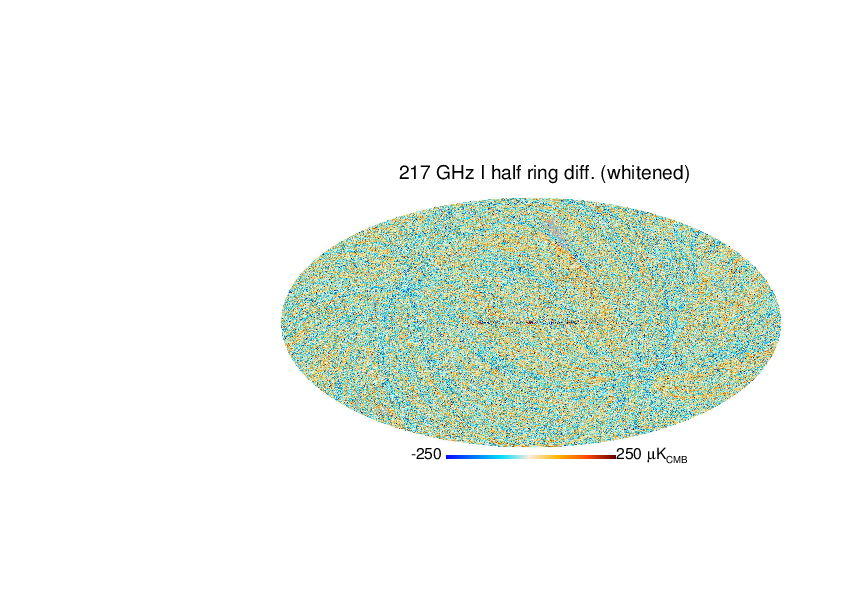
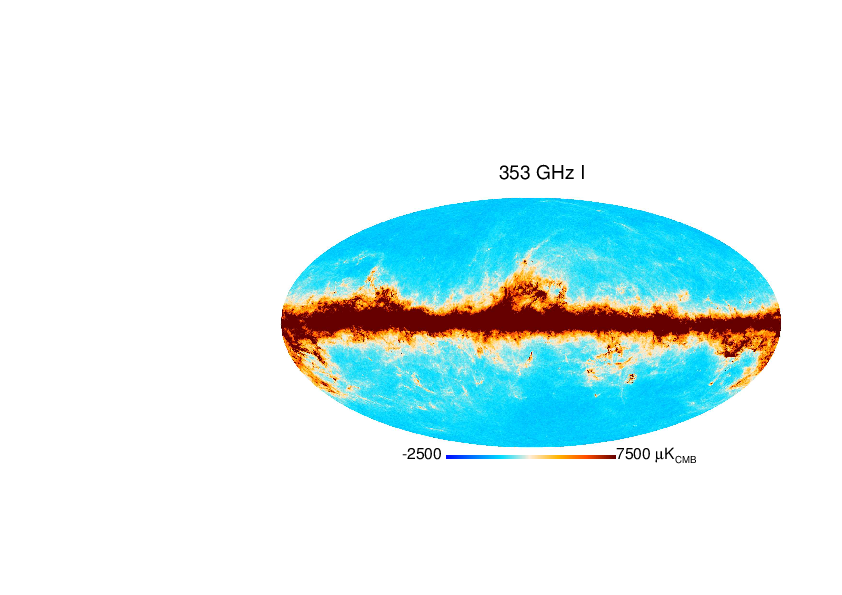
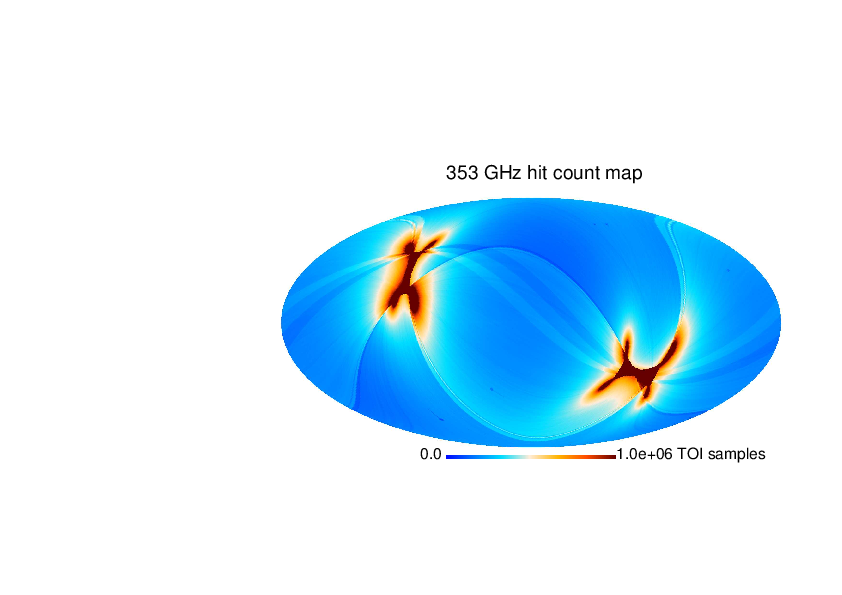
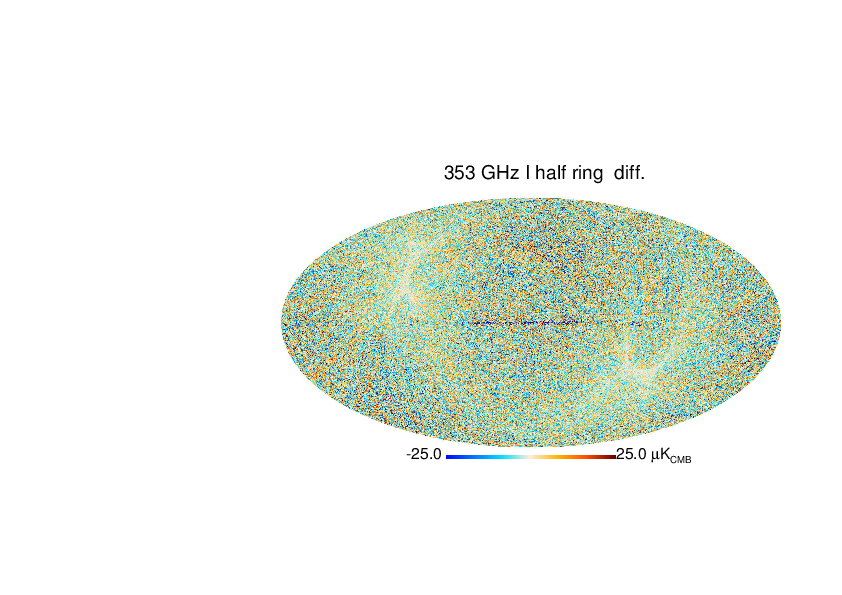
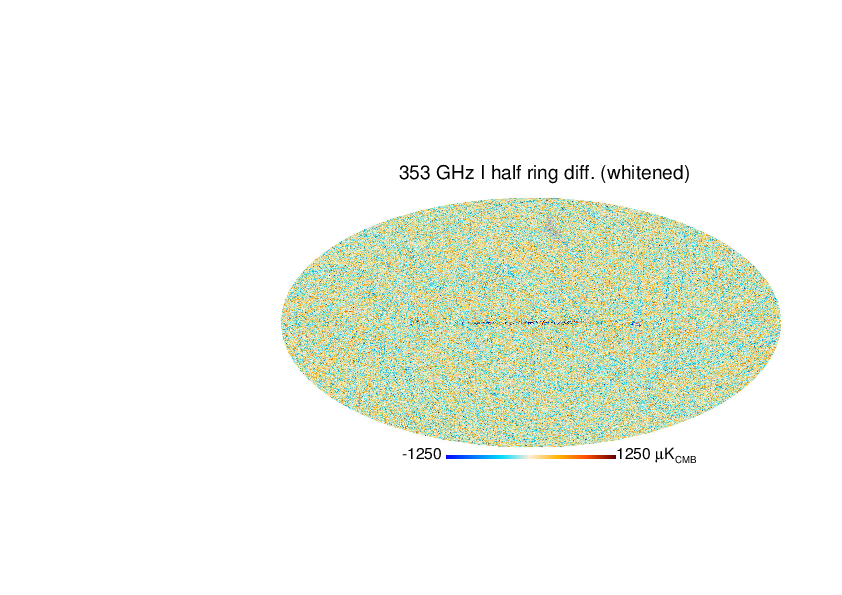
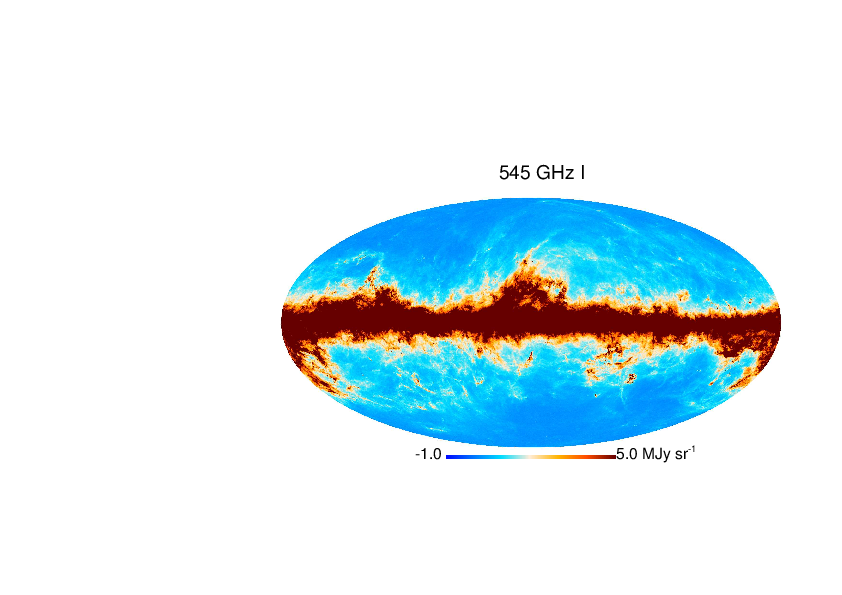
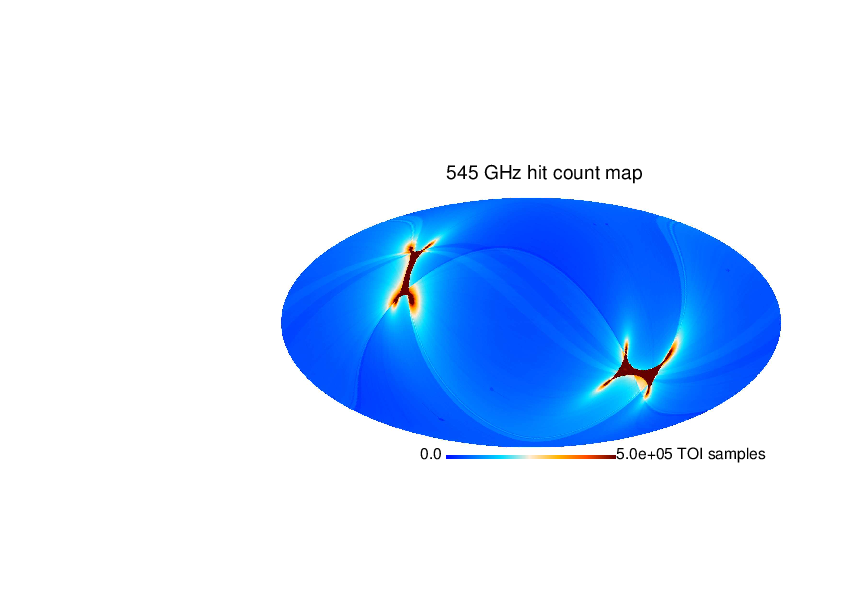
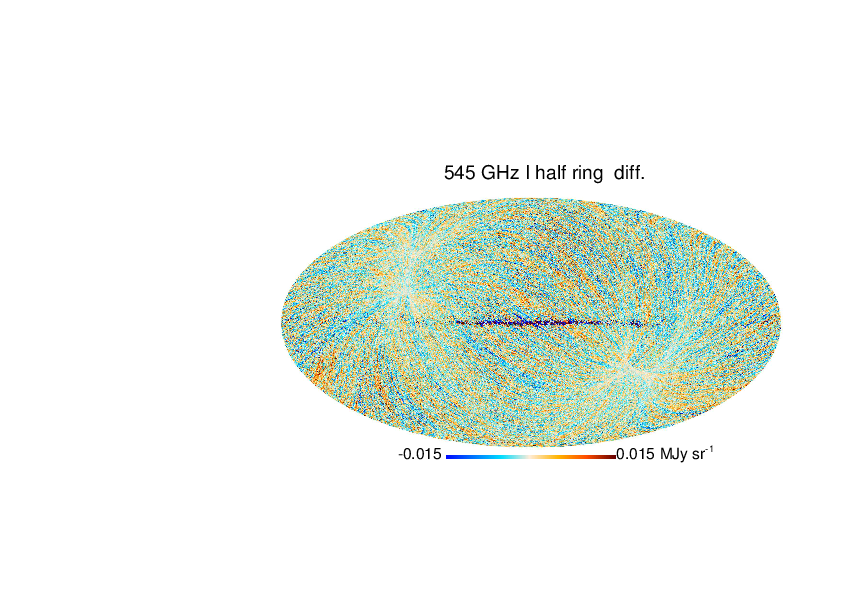
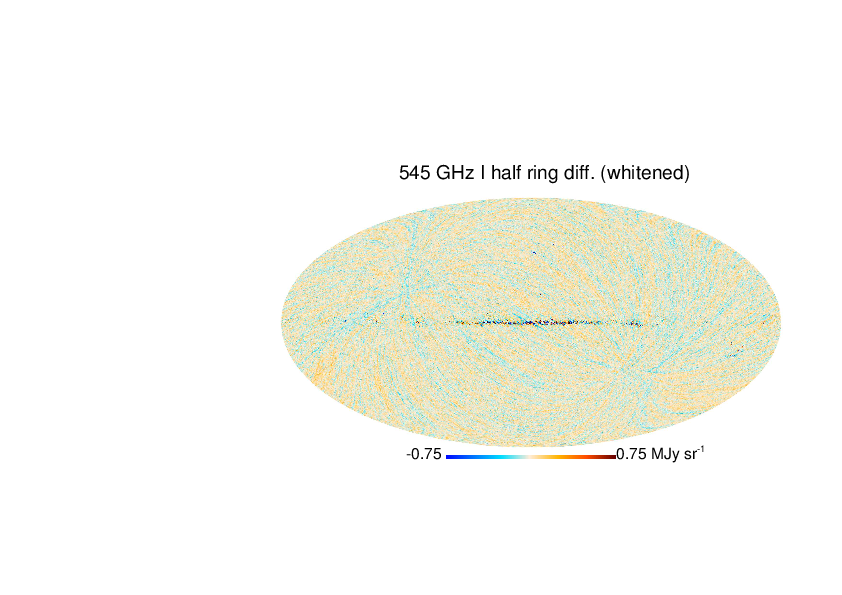
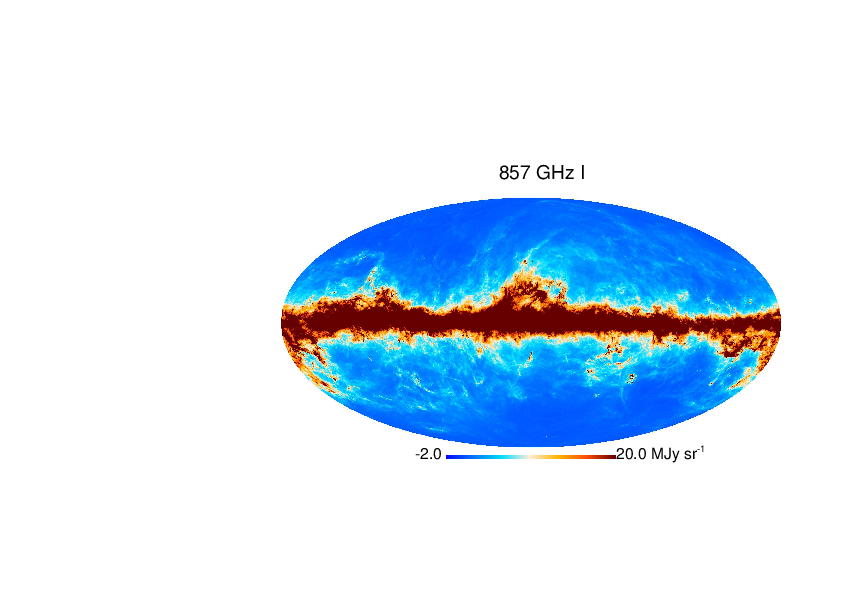
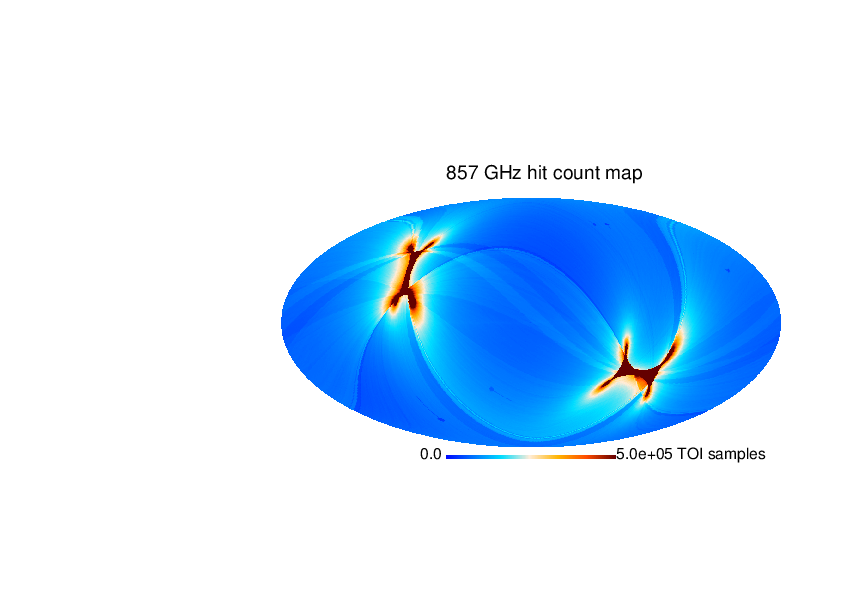
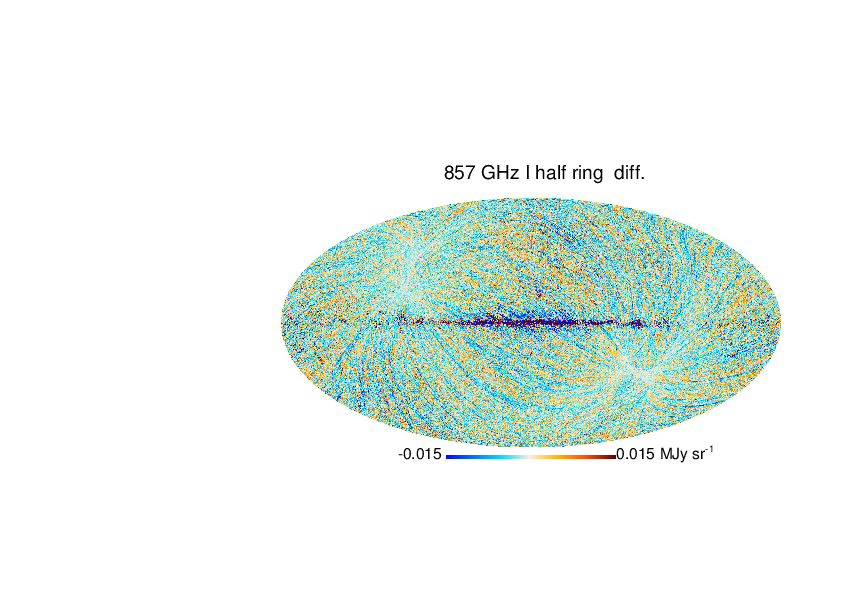
In Fig. 17 we show the intensity maps constructed for each of the HFI frequencies, together with the number of TOI samples per pixel; and difference-maps built with the first and second half of each rings, both as the raw differences, and as differences scaled by the square root of the number of TOI samples to pre-whiten them.
The detector noise estimate used for the detector’s data weighting is slightly different for the 2013 data release than for the previous release (Planck HFI Core Team 2011b). As a consequence, the pixel covariances we compute are now consistent with noise levels estimated from the difference maps built from the first and second half of the rings.
 |
 |
 |
 |
 |
 |
 |
 |
 |
 |
 |
 |
 |
 |
 |
 |
 |
 |
 |
 |
 |
 |
 |
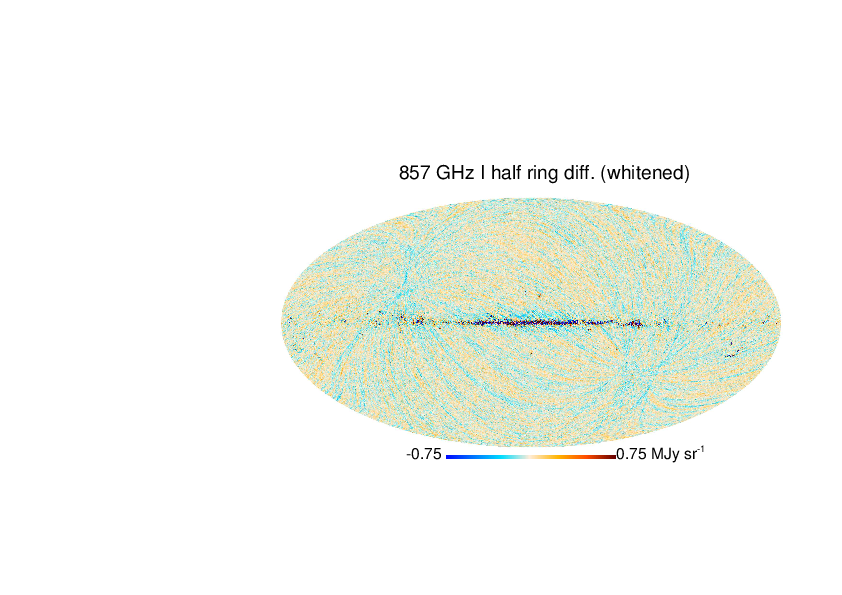 |
Figure 18 presents pseudo-spectra of the null test difference maps, computed with a 15 % Galactic mask for frequencies up to 353 GHz, or 40 % for the higher frequencies, combined with a point source mask derived from the Planck catalogue of compact sources (Planck Collaboration XXVIII 2014). We compare these spectra in Fig. 18 with those from the half-difference of the maps reconstructed from Surveys 1 and 2, properly normalized to compensate for the lower integration time. As illustrated previously, in Fig. 1, such differences are sensitive to, among other things, time variations in the gains. As they compare observations made with roughly opposite scan directions, they may also exhibit residuals in regions where the sky signal is intense, and large gradients due to imperfect deconvolution of time response (Planck Collaboration VI 2014). As a consequence, their spectra, shown as dashed lines in Fig. 18, are higher at low multipoles than those of the half-ring differences. The fact that both half-difference spectra are very close to each other at high multipoles for frequencies lower than 353 GHz is an indication that these differences provide an estimate of the high spatial-frequency part of the noise included in the HFI 2013 data release. For the sub-millimetre channels, both spectra present a significant variation, showing that they are contaminated by systematic residuals.
From these pseudo-spectra we estimate the noise level in the HFI maps by computing their average, after re-normalization by the sky coverage, in the range 100–6000. Using the averaged hit count per pixel, we convert these averages into an equivalent rms per TOI sample. We compare this estimate with two others: the rms of the half-ring map differences, properly whitened using the hit counts; and the averaged square-root of the variance computed in each pixel by the projection module, scaled to a dispersion per TOI sample using the averaged hit counts. These estimates are compared in Table 10. In general, they are in fair agreement for the three lowest frequencies, indicating that they are a good estimate of the noise level in the maps. At higher frequencies, however, signal residuals give a larger contributions. Therefore, such methods only provide an upper limit on the high-frequency noise in the maps.
| Frequency | Variance maps | Diff. maps | Pseudo spectra |
|---|---|---|---|
| GHz | (a) | (b) | (c) |
| 100 | 1569 | 1546 | 1554 |
| 143 | 777 | 775 | 826 |
| 217 | 1109 | 1105 | 1212 |
| 353 | 3671 | 3712 | 4101 |
| 545 | 0.604 | 0.976 | 0.817 |
| 857 | 0.695 | 2.58 | 0.920 |
 |
 |
7 Conclusions
In this paper we have presented the mapmaking and calibration procedures used for the Planck HFI data in the 2013 release. The calibrator for the CMB frequency data (100–353 GHz) is the solar dipole anisotropy as measured by WMAP (Hinshaw et al. 2009). This calibration is performed through a ring-by-ring template fit. Its limitations are largely a consequence of the non-ideal behaviour of the ADC from the bolometer read-out electronics. Tiny deviations from linearity in these devices cause apparent gain variation of the detector chain with time, which we have addressed using an effective gain correction, bogopix. We showed that this scheme was able to reduce the apparent gain variation in time from 1–2 % to lower than 0.3 %, by studying the residuals of the map built for different time. Higher-order signal distortions induced by this systematic effect prevent us from using the more precise, orbital dipole-based calibration scheme presented in Tristram et al. (2011).
Correction for the ADC non-linearities should be made prior to any data reduction step. It requires precise measurements of each ADC response, which is currently taking place using data from the warm (4K) instrument. First tests of corrective software are also under way, with promising results. The time transfer functions used to deconvolve the data are built using planets and galactic plane observations. These are not sensitive to time constant longer than one second. However, the thermal behaviour of the bolometers/bolometer plate system show longer time constants (Planck Collaboration II 2011) which have now been shown to shift significantly the dipoles axis and could thus affect the data at very low levels, below those of the ADC non-linearities correction, and contribute to the residual level of systematic inconsistencies in the calibration presented in this paper.
The calibration for the 545 and 857 GHz channels is performed by comparing Uranus and Neptune flux densities with models of their emissivities. We had to switch to this scheme owing to apparent systematic effects in the FIRAS spectra we used in the HFI Early Data release. At those frequencies, time variations of the gain are lower than other systematic calibration uncertainties.
We revised our zero level-setting method, which now relies on the CIB monopole and the zero of the Galactic emission, defined as zero dust emission for a null Hi column density.
At all frequencies, the statistical uncertainty of the calibration is negligible compared to the systematic uncertainty. The systematic uncertainty has been evaluated using several methods, presented in Sect. 6. We evaluated three types of systematic uncertainties:
-
(a) Residual apparent variations of gains with time. For the 100 to 217 GHz maps, we showed in Sect. 6.1 that, using bogopix, these variations were lower than 0.3 %, for each individual detector. As shown in Fig. 7 the gain variations appear to be independent from one detector to the other, so such uncertainties should average out in the combined maps from this release. This 0.3 % uncertainty is therefore a conservative upper limit on the level of residual gain variations in the frequency maps. At higher frequencies, no estimation, nor correction for the apparent gain variation, is available. We choose to quote the level of variations we observed in the single detector measurements of bogopix at lower frequencies, which is 1 %; this is again an upper limit for combined maps. Given Planck’s scanning strategy, such uncertainties might be relevant for point-like sources studies, as these are observed in general once per survey, or globally when comparing sky maps from individual surveys.
-
(b) Relative calibration uncertainties, which should be used when combining different frequency maps, e.g., when reconstructing the SED of an object. We presented in Sect. 6.3 several methods to evaluate such uncertainties for 100 to 217 GHz channels. Both a direct comparison of pseudo-power spectra outside the Galaxy and results from the component separation method SMICA show that the inter-calibration between the 100, 143, and 217 GHz channels is better than 0.2 % (we keep the more conservative estimate, using SMICA for the reported errors). We complement these results with the upper limits extracted from SMICA at 353 and 545 GHz, using the central value (1 and 5%, respectively) as an upper limit on the uncertainty. For the relative calibration of the 857 GHz maps, we quote the 5 % uncertainty on the photometry used in the planet calibration.
-
(c) Absolute calibration uncertainties that should be considered when comparing with other data sets. This involves comparing Planck data with an external calibrator. Below 353 GHz, such uncertainties have been evaluated by two complementary approaches: reconstructing the dipole and comparing it with the WMAP measurements (Sect. 6.3); and evaluating the amplitude of residual dipoles in our maps, after foreground removal (Sect. 5.1). From 100 to 217 GHz, both methods show consistency with WMAP at better than 0.3 %. The second approach shows agreement at 1 % for 353 GHz. As the data are calibrated on the WMAP dipole measurement, an additional uncertainty of has to be combined with the HFI intrinsic uncertainties. Due to the nature of the calibrator, the absolute accuracies stated here only apply at very low . When studying smaller angular scale anisotropies, transfer functions, including that resulting from the - yet unaccounted for - very long time constants (see Section 3.1), should be taken into account.
Indeed the comparison of HFI with WMAP measurements at the level of the first and second peak show a discrepancy of 2.4 % in spectra, thus a possible calibration discrepancy of 1.2% (Planck Collaboration XVI 2014). Considering the relative calibration accuracy discussed above this must come from a common systematic effect on either the HFI CMB channels or on the WMAP V and W data, affecting the dipole calibrations and/or the transfer functions.
For the two highest frequencies, the absolute scale is limited by the accuracy of the planetary atmosphere models (5 %), combined with systematic uncertainties in our flux measurements (5 %), which results in a total uncertainty of 10 %. Such uncertainties are relevant for comparing Planck data with other data sets. When comparing with data sets sharing the same calibrator as HFI, the WMAP dipole or the planet models of Moreno (2010), the uncertainty on these calibrators should therefore be omitted in the comparison.
We summarize the calibration uncertainties for the HFI frequency maps in Table 11.
| Frequency | Time stability | Relative | Absolute | Model |
|---|---|---|---|---|
| GHz | (a) [%] | (b) [%] | (c) [%] | [%] |
| 100 | 0.3 | 0.2 | 0.54 | 0.24 |
| 143 | 0.3 | 0.2 | 0.54 | 0.24 |
| 217 | 0.3 | 0.2 | 0.54 | 0.24 |
| 353 | 1.0 | 1.0 | 1.24 | 0.24 |
| 545 | 1.0 | 5.0 | 10.0 | 5.0 |
| 857 | 1.0 | 5.0 | 10.0 | 5.0 |
Acknowledgements.
The development of Planck has been supported by: ESA; CNES and CNRS/INSU-IN2P3-INP (France); ASI, CNR, and INAF (Italy); NASA and DoE (USA); STFC and UKSA (UK); CSIC, MICINN and JA (Spain); Tekes, AoF and CSC (Finland); DLR and MPG (Germany); CSA (Canada); DTU Space (Denmark); SER/SSO (Switzerland); RCN (Norway); SFI (Ireland); FCT/MCTES (Portugal); and PRACE (EU). A description of the Planck Collaboration and a list of its members with the technical or scientific activities they have been involved into, can be found at http://www.rssd.esa.int/index.php?project=PLANCK&page=PlanckCollaboration.References
- Ashdown et al. (2009) Ashdown, M. A. J., Baccigalupi, C., Bartlett, J. G., et al. 2009, A&A, 493, 753
- Béthermin et al. (2012) Béthermin, M., Daddi, E., Magdis, G., et al. 2012, ApJ, 757, L23
- Cardoso et al. (2008) Cardoso, J., Martin, M., Delabrouille, J., Betoule, M., & Patanchon, G. 2008, IEEE Journal of Selected Topics in Signal Processing, 2, 735, special issue on Signal Processing for Astronomical and Space Research Applications
- Dame et al. (1987) Dame, T. M., Ungerechts, H., Cohen, R. S., et al. 1987, ApJ, 322, 706
- Finkbeiner et al. (1999) Finkbeiner, D. P., Davis, M., & Schlegel, D. J. 1999, ApJ, 524, 867
- Fixsen et al. (1998) Fixsen, D. J., Dwek, E., Mather, J. C., Bennett, C. L., & Shafer, R. A. 1998, ApJ, 508, 123
- Fixsen et al. (1997) Fixsen, D. J., Weiland, J. L., Brodd, S., et al. 1997, ApJ, 490, 482
- Gispert et al. (2000) Gispert, R., Lagache, G., & Puget, J. L. 2000, A&A, 360, 1
- Górski et al. (2005) Górski, K. M., Hivon, E., Banday, A. J., et al. 2005, ApJ, 622, 759
- Griffin et al. (2010) Griffin, M. J., Abergel, A., Abreu, A., et al. 2010, A&A, 518, L3
- Griffin & al. (2013) Griffin, M. J. & al. 2013, in prep.
- Hinshaw et al. (2009) Hinshaw, G., Weiland, J. L., Hill, R. S., et al. 2009, ApJS, 180, 225
- Kalberla et al. (2005) Kalberla, P. M. W., Burton, W. B., Hartmann, D., et al. 2005, A&A, 440, 775
- Kamionkowski & Knox (2003) Kamionkowski, M. & Knox, L. 2003, Phys. Rev. D, 67, 063001
- Lagache et al. (1999) Lagache, G., Abergel, A., Boulanger, F., Désert, F. X., & Puget, J.-L. 1999, A&A, 344, 322
- Liang et al. (2012) Liang, Z., Fixsen, D. J., & Gold, B. 2012, arXiv:astro-ph/1201.0060
- Lindal (1992) Lindal, G. F. 1992, AJ, 103, 967
- Macías-Pérez et al. (2007) Macías-Pérez, J. F., Lagache, G., Maffei, B., et al. 2007, A&A, 467, 1313
- Maffei et al. (2010) Maffei, B., Noviello, F., Murphy, J. A., et al. 2010, A&A, 520, A12
- Mather et al. (1999) Mather, J. C., Fixsen, D. J., Shafer, R. A., Mosier, C., & Wilkinson, D. T. 1999, ApJ, 512, 511
- Molinari et al. (2010) Molinari, S., Swinyard, B., Bally, J., et al. 2010, PASP, 122, 314
- Moreno (2010) Moreno, R. 2010, Neptune and Uranus planetary brightness temperature tabulation. Tech. rep., ESA Herschel Science Center, available from ftp://ftp.sciops.esa.int/pub/hsc-calibration/PlanetaryModels/ESA2
- Moreno et al. (2011) Moreno, R., Lellouch, E., Lara, L. M., et al. 2011, A&A, 536, L12
- Murphy et al. (2010) Murphy, J. A., Peacocke, T., Maffei, B., et al. 2010, Journal of Instrumentation, 5, 4001
- Neugebauer et al. (1984) Neugebauer, G., Habing, H. J., van Duinen, R., et al. 1984, ApJ, 278, L1
- Peebles & Wilkinson (1968) Peebles, P. J. E. & Wilkinson, D. T. 1968, Phys. Rev., 174, 2168
- Perdereau (2006) Perdereau, O. 2006, in CMB and Physics of the Early Universe
- Planck HFI Core Team (2011a) Planck HFI Core Team. 2011a, A&A, 536, A4
- Planck HFI Core Team (2011b) Planck HFI Core Team. 2011b, A&A, 536, A6
- Planck Collaboration II (2011) Planck Collaboration II. 2011, A&A, 536, A2
- Planck Collaboration XVIII (2011) Planck Collaboration XVIII. 2011, A&A, 536, A18
- Planck Collaboration XIX (2011) Planck Collaboration XIX. 2011, A&A, 536, A19
- Planck Collaboration XXIV (2011) Planck Collaboration XXIV. 2011, A&A, 536, A24
- Planck Collaboration I (2014) Planck Collaboration I. 2014, A&A, in press, [arXiv:astro-ph/1303.5062]
- Planck Collaboration II (2014) Planck Collaboration II. 2014, A&A, in press, [arXiv:astro-ph/1303.5063]
- Planck Collaboration III (2014) Planck Collaboration III. 2014, A&A, in press, [arXiv:astro-ph/1303.5064]
- Planck Collaboration IV (2014) Planck Collaboration IV. 2014, A&A, in press, [arXiv:astro-ph/1303.5065]
- Planck Collaboration V (2014) Planck Collaboration V. 2014, A&A, in press, [arXiv:astro-ph/1303.5066]
- Planck Collaboration VI (2014) Planck Collaboration VI. 2014, A&A, in press, [arXiv:astro-ph/1303.5067]
- Planck Collaboration VII (2014) Planck Collaboration VII. 2014, A&A, in press, [arXiv:astro-ph/1303.5068]
- Planck Collaboration VIII (2014) Planck Collaboration VIII. 2014, A&A, in press, [arXiv:astro-ph/1303.5069]
- Planck Collaboration IX (2014) Planck Collaboration IX. 2014, A&A, in press, [arXiv:astro-ph/1303.5070]
- Planck Collaboration X (2014) Planck Collaboration X. 2014, A&A, in press, [arXiv:astro-ph/1303.5071]
- Planck Collaboration XI (2014) Planck Collaboration XI. 2014, A&A, in press, [arXiv:astro-ph/1312.1300]
- Planck Collaboration XII (2014) Planck Collaboration XII. 2014, A&A, in press, [arXiv:astro-ph/1303.5072]
- Planck Collaboration XIII (2014) Planck Collaboration XIII. 2014, A&A, in press, [arXiv:astro-ph/1303.5073]
- Planck Collaboration XIV (2014) Planck Collaboration XIV. 2014, A&A, in press, [arXiv:astro-ph/1303.5074]
- Planck Collaboration XV (2014) Planck Collaboration XV. 2014, A&A, in press, [arXiv:astro-ph/1303.5075]
- Planck Collaboration XVI (2014) Planck Collaboration XVI. 2014, A&A, in press, [arXiv:astro-ph/1303.5076]
- Planck Collaboration XVII (2014) Planck Collaboration XVII. 2014, A&A, in press, [arXiv:astro-ph/1303.5077]
- Planck Collaboration XVIII (2014) Planck Collaboration XVIII. 2014, A&A, in press, [arXiv:astro-ph/1303.5078]
- Planck Collaboration XIX (2014) Planck Collaboration XIX. 2014, A&A, in press, [arXiv:astro-ph/1303.5079]
- Planck Collaboration XX (2014) Planck Collaboration XX. 2014, A&A, in press, [arXiv:astro-ph/1303.5080]
- Planck Collaboration XXI (2014) Planck Collaboration XXI. 2014, A&A, in press, [arXiv:astro-ph/1303.5081]
- Planck Collaboration XXII (2014) Planck Collaboration XXII. 2014, A&A, in press, [arXiv:astro-ph/1303.5082]
- Planck Collaboration XXIII (2014) Planck Collaboration XXIII. 2014, A&A, in press, [arXiv:astro-ph/1303.5083]
- Planck Collaboration XXIV (2014) Planck Collaboration XXIV. 2014, A&A, in press, [arXiv:astro-ph/1303.5084]
- Planck Collaboration XXV (2014) Planck Collaboration XXV. 2014, A&A, in press, [arXiv:astro-ph/1303.5085]
- Planck Collaboration XXVI (2014) Planck Collaboration XXVI. 2014, A&A, in press, [arXiv:astro-ph/1303.5086]
- Planck Collaboration XXVII (2014) Planck Collaboration XXVII. 2014, A&A, in press, [arXiv:astro-ph/1303.5087]
- Planck Collaboration XXVIII (2014) Planck Collaboration XXVIII. 2014, A&A, in press, [arXiv:astro-ph/1303.5088]
- Planck Collaboration XXIX (2014) Planck Collaboration XXIX. 2014, A&A, in press, [arXiv:astro-ph/1303.5089]
- Planck Collaboration XXX (2014) Planck Collaboration XXX. 2014, A&A, in press, [arXiv:astro-ph/1309.0382]
- Planck Collaboration XXXI (2014) Planck Collaboration XXXI. 2014, In preparation
- Puget et al. (1996) Puget, J.-L., Abergel, A., Bernard, J.-P., et al. 1996, A&A, 308, L5
- Silverberg et al. (1993) Silverberg, R. F., Hauser, M. G., Boggess, N. W., et al. 1993, in Society of Photo-Optical Instrumentation Engineers (SPIE) Conference Series, Vol. 2019, Society of Photo-Optical Instrumentation Engineers (SPIE) Conference Series, ed. M. S. Scholl, 180–189
- Tauber et al. (2010) Tauber, J. A., Norgaard-Nielsen, H. U., Ade, P. A. R., et al. 2010, A&A, 520, A2
- Tristram et al. (2011) Tristram, M., Filliard, C., Perdereau, O., et al. 2011, A&A, 534, A88
- Tristram et al. (2005) Tristram, M., Macías-Pérez, J. F., Renault, C., & Santos, D. 2005, MNRAS, 358, 833
- Yu et al. (2001) Yu, Q., Spergel, D. N., & Ostriker, J. P. 2001, ApJ, 558, 23
Appendix A Calibration conventions
A.1 Colour corrections
Whatever the origin of the calibrator (on the sky or an internal blackbody), the calibration is performed with a source of known spectral energy distribution (SED). Except for CMB anisotropies, in general, the observed source will have a SED different from the calibration source. Although the simplest way to express the calibration is to give the response as a function of the power falling onto the detector, we usually use a secondary expression of the measurements as spectral densities. This allows us to compare the measurements with others and with models. Spectral densities are either an intensity (W m-2 sr-1 Hz-1) for brightness or flux densities (W m-2 Hz-1) for unresolved sources, expressed at a reference frequency such that the power integrated in the spectral bandpass is equal to the measured power. The intensity (or flux density) is thus always linked to the choice of both a reference frequency and an assumed SED.
CMB anisotropies are calibrated on the CMB dipoles (and inter-calibrated on higher-order CMB anisotropies). The CMB temperature gives a calibration only for the SED of the CMB anisotropies. CMB anisotropies are thus expressed as T in KCMB. For astrophysical components with a different SED, this calibration has to be re-expressed as intensity at the reference frequency, using an SED convention. Following the IRAS convention, the spectral intensity data , are often expressed at fixed nominal frequencies, assuming the source spectrum is constant (i.e., constant intensity per logarithmic frequency interval, labelled “ref”). The colour correction factor is defined such that:
| (10) |
where is the actual specific intensity of the sky at frequency , is the corresponding value given with the IRAS (Neugebauer et al. 1984) or DIRBE (Silverberg et al. 1993) convention666The DIRBE and IRAS data products give and is the frequency corresponding to the nominal wavelength of the band. With these definitions,
| (11) |
where is the actual specific intensity of the sky normalized to the intensity at frequency and is the spectral response (see Planck Collaboration IX 2014).
A.2 CMB dipole conventions
For HFI calibration at low frequency, unlike the LFI calibration (Planck Collaboration V 2014), we used the non-relativistic approximation of the dipole anisotropy:
| (12) |
where is the ratio between the observer velocity and the speed of light. For the CMB dipole, . The leading-order term of the relativistic corrections is (Peebles & Wilkinson (1968), Kamionkowski & Knox (2003), Planck Collaboration XXVII (2014)). The amplitude of this correction is of , so this quadrupole term has a relative amplitude of with respect to the non-relativistic term of Eq. 12. However, this quadrupole is only coupled to the dipole when masking part of the sky, which is small ( ) in our calibration scheme, so the real bias must be smaller. Indeed, when using the orbital dipole, which is a factor of about smaller than the solar dipole, as the calibrator, Tristram et al. (2011) showed that using the non-relativistic approximation leads to a relative bias as small as . Given the level of systematic uncertainties we estimate for our calibration, it is therefore legitimate, and much simpler, to use the non-relativist approximation of the solar dipole anisotropy.
A.3 Far sidelobes
The impact of the far sidelobes (FSL) on HFI data is discussed in detail in Planck Collaboration VII (2014). We present only a summary of their impact on calibration in this appendix.
FSL may affect the calibration determination in different ways. The power measured by our detectors may be schematically written as:
| (13) |
where denotes the sky signal coming through the main lobe and that coming through the far sidelobes. We also denote by the fraction of power going into the FSL. For the planet photometry, some level of knowledge of is needed to correctly compare the reconstructed flux with the planet brightness. However, the relative FSL power is lower than 0.3 % (Tauber et al. 2010) for all HFI frequencies, which is well below the systematic uncertainties in the planet emission models that we are using, which are about (see Sect. 4). Therefore FSL can safely be ignored in the 545 and 857 GHz calibration analyses.
For the diffuse emission calibration on the CMB dipole at low HFI frequencies, we use a fit of the observed data to the solar dipole as measured by the WMAP team (Hinshaw et al. 2009), as detailed in Sect. 3, without convolving it with a beam model. Note that this is different from the LFI calibration pipeline (Planck Collaboration V 2014). To clarify the consequences of this choice, we have to examine the FSL signal in detail. The FSL signal may be decomposed to first order into three main components, depending on their optical paths: the primary, named PR, and the secondary and baffle spillovers collectively named SR in Tauber et al. (2010). The primary spillover originates mainly from directions on the sky close to the spin axis, so is will be roughly constant for each fixed pointing period and will be removed by our destriping procedure. The baffle spillover corresponds to radiation reaching the detectors after reflection on material surrounding the mirrors, including the telescope’s baffles. Again, one may expect this component to be roughly constant over a ring, as a result of the averaging of many original directions. Finally, the secondary spillover is selected over a wide () area centered about away from the main beam (see Fig. 5 in Tauber et al. 2010) and is formed by radiation reaching the HFI horns without reflection on any telescope part. This will generate an image of the sky offset with respect to the main beam and integrated over a very broad area. In particular, it will contain a dipole component.
Table 2 in Tauber et al. (2010) gives the relative amplitudes of the different FSL components with respect to the main beam signal, combining secondary and baffle spillovers in the ’SR’ column. One may see that, in this framework, PR and SR have comparable amplitudes. At maximum, the SR relative amplitude amounts to 0.2% at 100 GHz and decreases fast for frequencies higher that 217 GHz. To clarify the importance of the baffle spillovers, we performed simulations with the actual Planck scanning strategy and FSL models similar to those of Tauber et al. (2010). This indicated that the SR FSL signal after destriping has an amplitude of about of the value listed in Table 2 of Tauber et al. (2010). This is confirmed by the estimate of the FSL amplitudes presented in Planck Collaboration XIV (2014), which gives confidence in the models used in Tauber et al. (2010). From this, as shown in Planck Collaboration VII (2014), we conclude that, at maximum, a spurious dipolar signal with a relative amplitude of could be present in our data. As the CMB is a Gaussian signal, neglecting the beam transfer function, i.e., at very low ( given the SR beam), one may then consider that
| (14) |
at ring level. Thus our calibration will determine an effective gain: . This will lead to a reconstructed sky signal approximately equal to . Therefore, at large angular scales, if we ignore the spurious SR signal remaining after destriping in the calibration process, this cancels to first order the effect of not accounting for it in further analysis (like power spectra). At smaller scales, however, the SR signal becomes negligible and this cancellation is not effective anymore. To summarize, the HFI dipole calibration as performed for the 2013 data release may result in an approximately overestimate of the band powers for above about . This calibration systematic effect (roughly ) is lower than other sources of systematic uncertainties evaluated in this paper.
Appendix B Choosing the sky template for the solar dipole calibration


To determine the solar dipole calibration factor, we have to take into account the Galactic foreground. This is done with a template (see Sect. 3.2). Fig. 19 shows the impact of the choice of Galactic template. We compare the ring-by-ring gains obtained with each of the HFI frequency maps. Using a Galactic template helps improves the estimation of the calibration factor for rings scanning regions close to the Galactic equator (e.g., around day 200). Unsurprisingly, the template producing the lowest apparent variations is that with the same frequency as the detector of interest. However, even in this case, apparent systematic gain variations are observed at the times when the dipole amplitude is low, In Fig. 20 we show results obtained taking into account the polarization (from the HFI and maps). The small difference this induces shows that polarization does not play a major role in the apparent ring-to-ring variations, even for rings where Galactic emission is larger.
Appendix C HFI and FIRAS data comparison
The procedure we used for comparing HFI and FIRAS data is very similar to that adopted by the ARCHEOPS collaboration (Macías-Pérez et al. 2007). It was summarized in Planck HFI Core Team (2011b); here we give full details.
C.1 FIRAS data: spectra and derived maps
FIRAS spectra
The FIRAS instrument, its operating modes, calibration, and the data products are described in the FIRAS Explanatory Supplement (FIRAS team, 1997, http://lambda.gsfc.nasa.gov/product/cobe/firas_exsupv4.cfm). FIRAS has a scanning, four-port (two inputs; two outputs) Michelson interferometer that uses polarizing grids as beamsplitters and creates an interferogram (i.e., the Fourier transform of the source spectrum) by scanning a movable mirror platform (the “Mirror Transport Mechanism”, or MTM). A dichroic splitter at each output port (designated “left” or “right”) further splits each beam into low (30–630 GHz) and high (600–2910 GHz) frequency bands. The MTM could be scanned at either of two speeds: “slow” or “fast”. Furthermore the MTM sweep could be set to one of two scan lengths, “long” or “short”, thus affecting the spectral resolution. Most research applications call for one or more high-level products, such as the dust spectrum maps that we are using here. In these high-level products, the different modes and detector signals were combined to form the HIGH and LOWF frequency data-sets. The two dust-spectrum maps (FIRASDUSTSPECTRUMHIGH.FITS and FIRASDUSTSPECTRUMLOWF.FITS) cover 98.7 % of the sky and give the residual sky spectrum, from about 2970 to 68 GHz, after modeled emission from the CMB, interplanetary dust, and interstellar lines have been subtracted. The remaining signal is thus dominated by thermal continuum emission from Galactic interstellar dust (and the cosmic IR background e.g., Puget et al. 1996, Fixsen et al. 1998 and Lagache et al. 1999).
Uncertainty estimates
Uncertainties in the FIRAS data come from several different sources and manifest themselves in several different ways. Fortunately, many of the uncertainties are well described by a few dominant terms that show the source of the uncertainty. All of them are fully detailed in the FIRAS explanatory supplement. The errors are divided into groups: the detector measurements; the calibration emissivities; the bolometer model parameters; the temperature measurements of all but XCAL (XCAL is the external Calibrator); and the temperature measurement of the XCAL. For our purposes, only the detector noise, the uncertainties in some parameters derived from the calibration, and the uncertainty in the absolute temperature scale of the external calibrator are of importance. The covariance matrix can be written as:
| (15) |
The term (called the C-matrix by the FIRAS team) is the detector noise. It includes off-diagonal terms due to frequency correlations introduced by the apodization of the coadded interferograms, before Fourier transformation into spectra. The term (called JCJ by the FIRAS team) corresponds to uncertainties linked to the bolometer model parameters (only the JCJ gain is important here). This error is regarded as a systematic error. The term (called PTP by the FIRAS team) is the absolute thermometry uncertainty; it is not a statistical uncertainty. This term is included in the error budget since it is the dominant error for the absolute temperature of the CMB. It is thus important for comparison of FIRAS measurements to other experiments (but only for frequencies smaller than about 430 GHz). The levels of these three uncertainties are shown in Fig. 21. For the detector noise, only the square root of the diagonal (the “C-vector”) is displayed. Fixsen et al. (1997) used a conservative estimate of the gain uncertainty of 2 % for the 600–2400 GHz FIRAS data.
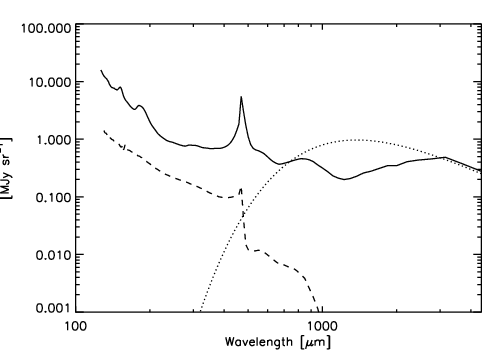
Building FIRAS maps
For individual pixels at high Galactic latitude, the S/N ratio of FIRAS spectra is about 1. Of course, this is not the case in the Galactic plane, where the S/N ratio is about 50 times higher (at high frequencies). The FIRAS map at a selected frequency can be obtained by convolving the FIRAS spectra with the Planck-HFI bandpass filters. However, this method gives very noisy FIRAS maps at high Galactic latitude (especially for GHz). Since we are interested in both the Galactic plane and its surroundings, we have chosen to derive the FIRAS maps together with their errors from fits of FIRAS spectra. Each individual FIRAS spectrum is fitted with a modified blackbody spectrum,
| (16) |
where is a measure of the relative dust column density for each pixel, is the spectral index, and is the Planck function. Since we are searching for the best representation of the data and not for physical dust parameters, we include the contribution of the cosmic infrared background in the fit. Moreover, we restrict the fit to the frequency range of interest – this avoids the need for a second dust component as in Finkbeiner et al. (1999).
For each frequency used for the calibration, we find the best values of , , and using a minimization method for each pixel. We include the correlations between FIRAS frequencies, and fit in frequency intervals related to the frequency of interest. We compute the error in each pixel by considering the deviation of the emissivity induced by all models (Eq. 16) allowed at 68 % confidence level by the FIRAS spectrum fit. Only the C-matrix was considered in the fit. The JCJ and PTP terms are added as a systematic error at the end of the process.
Ideally,the fits would be be performed on independent frequency intervals so that the maps derived for each of the Planck-HFI frequencies are independent. However reducing the frequency interval increases the noise, so it was necessary to use overlapping frequency intervals. Fortunately, the fitting results are not very sensitive to the choice of frequency interval; there are no systematic effects, and the values derived at the Planck-HFI wavelengths are consistent. This is not the case for the error bars, which can vary by factors of 2. Fits are performed for GHz, GHz, GHz, GHz and GHz for the 857, 545, 353, 217, and 143 GHz HFI frequencies, respectively. Typically, for Galactic latitudes , the 1 uncertainty is 1.0, 1.5, 4.2, 9.8, or 35.1 % at 857, 545, 353, 217 and 143 GHz, respectively. For , they reach 5.5, 11, 29, 54, and 158 %. Fig. 22 shows the results for three different pixels.
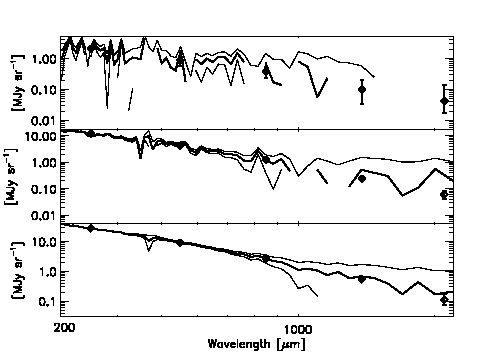
C.2 Planck-HFI data: towards the FIRAS resolution
We built uncalibrated Planck maps for each detector, and convolved them with the FIRAS beam.
FIRAS beam
The FIRAS beam has been measured using the Moon. Due to imperfections in the sky horn antenna, the effective beam shows both radial and azimuthal deviations from the nominal 7∘ top-hat beam profile (Fig. 23). Since COBE rotates about the optical axis of the FIRAS instrument, the average beam has circular symmetry; but a single interferogram is acquired in less than a rotation period and can have an asymmetric beam. Fixsen et al. (1997) estimate that the assumption of beam symmetry may produce residual beam shape errors of order of 5 %, and we take this into account in what follows.
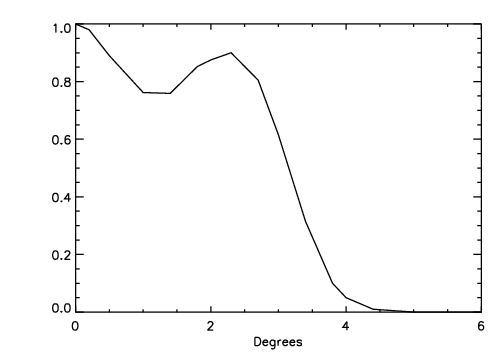
Convolution
We carry out the beam convolution in the HEALPix scheme. To simulate the movement during an integration of an interferogram, the DIRBE-format data were further convolved by a 2 .∘6 top-hat in the direction perpendicular to the ecliptic plane (which is roughly the FIRAS scanning direction).
C.3 FIRAS data: towards the HEALPix projection
The Planck maps are presented in the HEALPix format (Górski et al. 2005) with a resolution . For comparison with FIRAS, the convolved HFI maps are downgraded to . COBE data are presented in the COBE Quadrilateralized Spherical Cube projection (CSC), an approximately equal-area projection. For comparison with Planck, the FIRAS maps are regridded into the HEALPix format using a drizzling re-projection code.
C.4 Deriving the calibration gains and zero points
We fit for the calibration coefficients and following:
| (17) |
where is the FIRAS brightness at frequency , is the HFI signal in pW at , is the gain calibration factor (for a source spectrum with = constant), and is the colour correction given in Eq. 10. The calibration coefficients and are derived from a linear fit of the FIRAS and HFI cosecant variations, restricted to intermediate Galactic latitudes (). We avoid using the inner part of the Galactic plane, as in these areas the spectral characteristics, averaged out in the FIRAS measurements, may present angular scale variations that are not accurately accounted for in our processing of the HFI data (i.e., we evaluate and at 7∘ resolution, not 5′). More importantly, we avoid the inner part to minimize the effect of the FIRAS beam uncertainties. The Galactic polar caps are also not used, since the S/N ratio of the FIRAS data extrapolation is very low there. We also mask regions where CO emission lines (removed from FIRAS measured spectra) are bright in the Dame et al. (1987) map, and add a template of CMB anisotropies to the FIRAS data.
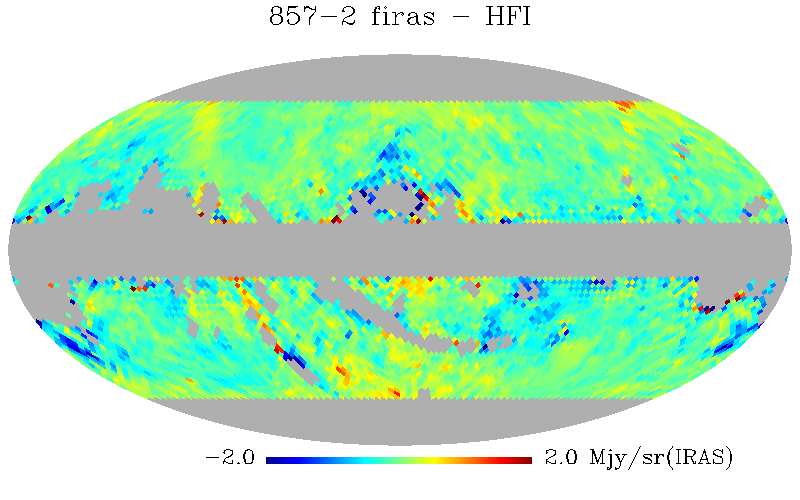
We use Eq. 17 to fit for both the gain and the offset for each HFI detector, and use the measured offset to compute the zero level. Statistical errors are dominated by the FIRAS errors (the HFI errors are negligible). The error on is dominated by the systematic effect observed on the gain (see next section). We use the dispersion of the fitted values in different parts of the sky to estimate the systematic error. This error is about 3 % at 857, 5 % at 545, 5 % at 353, and 10 % at 143 GHz. At 217 and 100 GHz, since we have no way to address the real variations without removing the CO contamination, we also take 10 % as the systematic error. For the total error on , we sum the statistical and systematic errors linearly. Errors for some individual bolometers are given in Table 12.
| Detector | Statistical | Systematic | Sum |
|---|---|---|---|
| 857-1 | 0.23 | 2.40 | 2.63 |
| 545-1 | 0.67 | 0.65 | 1.32 |
| 353-1 | 0.57 | 1.78 | 2.25 |
| 217-1 | 0.57 | 1.08 | 1.65 |
| 143-5 | 0.61 | 0.66 | 1.27 |
| 100-1a | 0.85 | 0.42 | 1.67 |
Using the frequency maps and the dedicated component separation in the CIB fields (Planck Collaboration XVIII 2011), we can compute the CIB mean value in those fields and compare them with the expected values (see Table 13). Although the error bars on the measured CIB at low frequencies are quite large, we see a systematic trend: the measured CIB is systematically lower than the expected CIB by factors of 2.4, 2, 1.4, and 1.5 at 857, 545, 353, and 217 GHz, respectively.
| Frequency | CIB from HFI | CIB measured from FIRAS | CIB from Béthermin et al. (2012) |
|---|---|---|---|
| GHz | MJy sr () | MJy sr () | MJy sr () |
| 857 | 0.29 | 0.710.23 | 0.64 |
| 545 | 0.18 | 0.370.12 | 0.35 |
| 353 | 0.09 | 0.130.04 | 0.13 |
| 217 | 2.210-2 | (3.41.1)10-2 | 3.310-2 |
An example of a residual map is shown in Fig. 24. We see that in the sky area used to compute the calibration coefficients the residual is close to zero, except for nearby bright regions (e.g., the Taurus cloud), where the FIRAS brightness is underestimated compared to HFI.
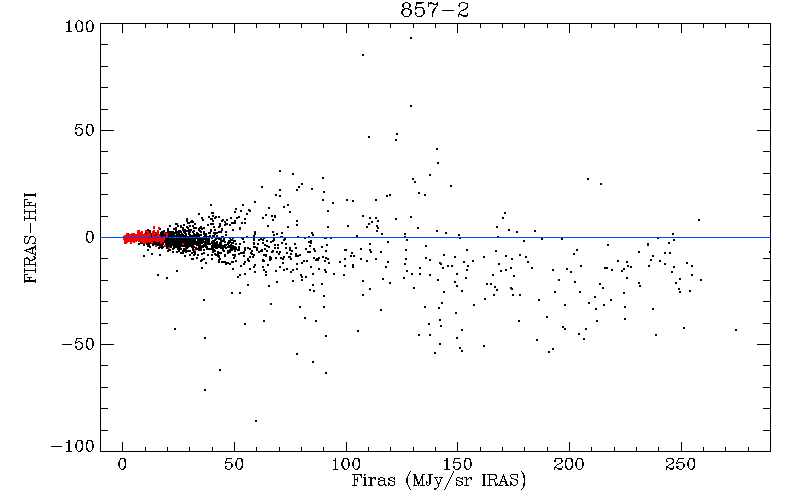
C.5 Systematic effects in the calibration coefficients
As already mentioned, we observe spatial variations of the FIRAS calibration gain (i.e., a variation of , and thus of ). Indeed, the calibration coefficients recovered from the narrow part of the Galactic plane and the intermediate Galactic latitude regions (with lower gradients) differ by 1015 % (see Fig. 25). To understand this unresolved discrepancy, we consulted the FIRAS team on: (1) the FIRAS beam knowledge and its potential changes with frequency, with the FIRAS beam to first order being independent of frequency (given by a geometrical optics dominated horn); and (2) non-linearity effects. None of these explain the discrepancy. We also investigated several other possibilities:
-
•
Pixelization: FIRAS data and errors are given in the quadrilateralized spherical cube projection777FIRAS data in HEALPix format are available in NASA’s Legacy Archive for Microwave Background Data (http://lambda.gsfc.nasa.gov) but the covariance matrix is not provided. In the nominal pipeline, we computed the calibration gain after reprojecting FIRAS data onto the HEALPix grid. We have also tried reprojecting the HFI data onto the cube (using several schemes for the pixel decimation) to compare the HFI and FIRAS data. We find no difference in the photometric calibration.
-
•
FIRAS beam: beam uncertainty could result in some variations of where the signal is rapidly varying on the sky (Galactic plane, molecular clouds, bright cirrus regions). In the HFI calibration, we do not account for FIRAS beam variations with frequency. But we tested several “beam configurations” to investigate their impact on the calibration. First, we measured the beam window function using full-sky FIRAS and HFI power spectra. A good fit is obtained for a Gaussian with a .. We used this beam in the convolution rather than the “‘nominal beam” to cross-calibrate the two data sets. We also used other FWHMs (4∘, 8∘, and 10∘). We could not find any beam that reconciles the FIRAS and HFI data.
-
•
Colour corrections: To compute we need to correct the data for the variation of the spectral energy distribution of dust emission across the sky. Working at and having the FIRAS dust spectrum for each pixel, it was easier to compute the colour correction at the FIRAS resolution (). However,
(18) so we checked (for several bolometers) whether the colour corrections could produce the observed spatial variations of . We used the DR2 all-sky temperature map (from Planck Collaboration XIX 2011) obtained by fitting HFI+IRIS data with a spectral index equal to 1.8, to compute a colour-correction map for each HFI pixel, and modified the calibration pipeline to use this . A strong variation of was still observed, comparable to the variation observed using . These refined colour corrections cannot explain the variation of across the sky. Note however, that using rather than significantly changes the calibration coefficient for the 545 GHz channels, by 6 % (although it does not change the 857 GHz coefficient).
-
•
Zodiacal light: The FIRAS data set we are using has the zodiacal emission removed using the COBE model. When comparing HFI and FIRAS data, zodiacal residuals are clearly visible in the difference map. We therefore redid the photometric calibration using the HFI data with the zodiacal light removed. The difference [] does not show any zodiacal residuals. Removing the zodiacal emission decreases the calibration coefficient by less than 2 % at 857 GHz. However, it does not decrease the observed spatial variations of .
-
•
Far sidelobes: we tested whether far sidelobes could have any impact on the photometric calibration, by looking at the detectors that have low far-sidelobe contamination (e.g., 857-2). We noticed that the spatial variation of is at the same order whatever the FSL contamination.
-
•
Time gain variations: we have searched, unsuccessfully, for any temporal gain variations using the individual calibration of the HFI all-sky survey maps.
We thus have no explanation for this effect other than a possible systematic bias in the FIRAS pass4 interstellar dust spectra.
If the HFI brightness is calibrated using FIRAS, several results suggest that the HFI brightness is overestimated at high frequencies:
-
•
The SEDs of sources and diffuse dust show an excess at 545 GHz over a smooth interpolation between higher and lower frequencies. A simple interpolation between 857 and 353 GHz shows the excess is about 11 %. Using a very simple dust model, a residual dipole is also present in the 545 GHz maps.
-
•
The CMB anisotropy power spectrum is detectable at 545 GHz and the SMICA component separation method shows a (20.34.7) % calibration discrepancy. The analysis of the FFP6 simulated data sets shows that the same method gives reliable results at all HFI frequencies.
-
•
The dipole calibration at 545 GHz, although quite uncertain, is also discrepant by about 20 % with the FIRAS calibration.
-
•
The measurements on planets (Mars, Jupiter, Saturn, Uranus, and Neptune) used for beam determination and pointing are higher than the models for the two sub-millimetre channels, at least for the deetctors that are not affected by non-linearity effects.
We therefore abandoned the FIRAS calibration and used the planet calibration instead.