Multi-Dimensional Double Detonation of Sub-Chandrasekhar Mass White Dwarfs
Abstract
Using 2D and 3D simulation, we study the “robustness” of the double detonation scenario for Type Ia supernovae, in which a detonation in the helium shell of a carbon-oxygen white dwarf induces a secondary detonation in the underlying core. We find that a helium detonation cannot easily descend into the core unless it commences (artificially) well above the hottest layer calculated for the helium shell in current presupernova models. Compressional waves induced by the sliding helium detonation, however, robustly generate hot spots which trigger a detonation in the core. Our simulations show that this is true even for non-axisymmetric initial conditions. If the helium is ignited at multiple points, the internal waves can pass through one another or be reflected, but this added complexity does not defeat the generation of the hot spot. The ignition of very low-mass helium shells depends on whether a thermonuclear runaway can simultaneously commence in a sufficiently large region.
Subject headings:
hydrodynamics – nuclear reactions, nucleosynthesis, abundances – shock waves – supernovae: general – white dwarfs1. Introduction
In the double detonation scenario, a carbon-oxygen (CO) white dwarf (WD) accumulates a layer of helium through accretion from a helium main sequence star. The accretion rate, typically on the order of (e.g., Taam, 1980; Woosley & Weaver, 1994), and the mass of the WD determine the critical thickness of the helium layer. Generally, a low accretion rate allows more helium to accumulate before a thermonuclear runaway commences near the base of the helium shell, the temperature of which is determined by gravitational compression, convection and eventually nuclear burning. It is often assumed that a detonation in the helium induces a secondary detonation in the CO core, thus producing a Type Ia supernova.
If and how a secondary core detonation develops is ambiguous, however. One possibility is that the core is ignited directly at the core-shell interface when hit by the helium detonation front. This is sometimes called “direct drive”, “edge-lit scenario” or “prompt detonation”. It has long been realized that this does not always work and that its realization depends on the altitude at which the helium detonation starts (e.g., Livne & Glasner, 1990; Benz, 1997; García-Senz et al., 1999). A helium detonation directly at the interface almost certainly fails to start a detonation in the core, but evolution models of accreting WDs suggest that the most probable place for a detonation to start could be higher up (Woosley & Kasen, 2011). One of the aims of the present work is to determine whether a helium detonation ignited at a point in the hottest helium layer would lead to core detonation by direct drive.
If direct drive fails, the core may still ignite, with considerable delay, after the detonation wave has consumed the entire helium layer, through compressional waves which focus inside the core. In the simplest (and most unrealistic) scenario, the star is spherically symmetric and the helium is ignited instantaneously in a spherical shell. This induces a radially inward propagating compressional wave that converges at the exact center of the star, where, depending upon the resolution of the study, it always ignites the core (e.g., Livne, 1990).
Since convective mixing is not able to keep the temperature at a given radius constant before the runaway, it is more likely that helium ignition starts in one or more isolated regions with sizes of perhaps a pressure scale height (Woosley & Kasen, 2011). If the detonation starts at a single point, the sliding helium detonation creates an oblique (with respect to the core-shell interface) shock wave that converges inside the core at the axis of symmetry and potentially triggers an off-center core detonation (Dgani & Livio, 1990; Livne & Glasner, 1990, 1991; Livne & Arnett, 1995). In their simulations of double-detonation supernovae, Fink et al. (2007) considered a variety of 1D and 2D helium ignition scenarios, confirming the high ignition potential of the inward propagating shock wave. They showed that core detonation resulting from the detonation of the helium in a single spot is very likely even for low mass helium shells, for instance in combination with a core (Fink et al., 2010), and for core masses as low as (Sim et al., 2012).
In a scenario with less or no symmetry, if helium detonations commence at multiple points, for example, the secondary detonation of the core is less certain. In their SPH simulations, García-Senz et al. (1999) first explored, using coarse resolution, the possibility of starting detonations at multiple points in the helium layer. In particular, they studied a case with asynchronous ignition at five points, finding that core detonation could still result from the collision of the various helium detonations.
If the core does not ignite, the helium explosion alone could produce a sub-luminous, “point Ia”, supernova (Bildsten et al., 2007). This raises the question as to how robust the triggering of the secondary core detonation is. If it is robust, a detonation of the helium shell alone might be very rare or even impossible in the case of CO cores (the less common oxygen-neon cores are in general much harder to ignite with converging shocks, see Shen & Bildsten 2013).
We here revisit the double detonation scenario using some of the WD models generated with KEPLER and presented in Woosley & Kasen (2011). Following a description of the numerical methods in §2, we first discuss the results of simulations that test the viability of direct drive in §3.1. We then (§3.2) study sliding helium detonations that lead to a hot spot inside the core, with the helium detonation started at one, two or three points. The initiation of detonations in lightweight helium shells is investigated in §3.2.6. In §3.4, we present nucleosynthesis yields from runs following the complete detonation of WDs. We end with a discussion and summary in §4.
2. Numerical Methods
| modelaaThe model identifiers in Woosley & Kasen (2011) are written in parentheses | bbApproximate helium shell thickness, with the outer boundary defined where the density is of the value at the core-shell interface | ||||||||
|---|---|---|---|---|---|---|---|---|---|
| [] | [] | [km] | [km] | [km] | [] | [] | [] | [] | |
| A (8B) | 0.801 | 0.143 | 4081 | 2080 | 4267 | 2.06 | 1.19 | 1.66 | 2.21 |
| B (10B) | 1.000 | 0.082 | 3616 | 1370 | 3765 | 2.42 | 1.30 | 1.93 | 5.67 |
| C (10C) | 1.000 | 0.091 | 3518 | 1380 | 3624 | 2.31 | 1.63 | 2.18 | 6.02 |
| D (10HC) | 1.002 | 0.045 | 4161 | 1260 | 4187 | 2.80 | 0.717 | 0.932 | 4.24 |
| E (10HD) | 1.001 | 0.078 | 3696 | 1350 | 3724 | 2.36 | 1.50 | 1.77 | 5.33 |
2.1. Hydrodynamics
For our multi-dimensional studies we use the Eulerian hydrodynamics code CASTRO (Almgren et al., 2010; Zhang et al., 2011) to solve the equations for compressible fluid dynamics in combination with a nuclear reaction network. We employ an equation of state based on the Helmholtz free energy (Timmes & Arnett, 1999; Timmes & Swesty, 2000) and a 19-isotope network to compute energy generation and nucleosynthesis (the same as in KEPLER, see §2.2 for details). Gravitational forces are calculated with a monopole approximation, taking into account the mass enclosed within a given distance from the center of the star at any given time. In many simulations, we make use of CASTRO’s capabilities for adaptive mesh refinement (AMR). The initial models for the multi-D CASTRO simulations presented here were constructed with the implicit Lagrangian hydrodynamics code KEPLER in 1D (Weaver et al., 1978; Woosley et al., 2002). The evolution of several helium-accreting WDs was followed with a model for convection based on mixing-length theory, see Woosley & Kasen (2011). The CASTRO simulations start from KEPLER snapshots taken before a thermonuclear runaway sets in. Their key properties are listed in Table 1.
In Eulerian simulations, adding a relatively small amount of hot gas to a cold zone can raise the average temperature above the threshold for ignition, thus igniting the whole zone. Without any correction, the speed with which a “detonation front” propagates would thus be dependent on the size of the zones and driven entirely by artificial advection. To simulate detonation more realistically, we introduce a delay timer that suppresses the burning in a particular zone for half a sound crossing time. If, at any time, the necessary conditions for nuclear burning are not satisfied, the timer is set to zero. If they are satisfied, the timer starts counting and when half a sound crossing time (Courant time) has passed, nuclear burning processes are switched on in this particular zone.
In simulations of the whole star, the density of the artificial external medium is set to and given the same temperature as the outer edge of the helium shell. This means that as the shock of the helium detonation breaks out of the star, it is accelerated by a very steep pressure gradient. As the time step of our simulations is limited by the largest fluid velocities or sound speeds in the entire domain, the calculations become very expensive. To contain the detrimental effect on the time step, we apply a velocity cap of in the ambient medium. To distinguish the ambient from stellar material at all times of the simulation, we give it a unique composition of 100% .
We used no velocity cap and lower ambient densities in runs where the expansion of the ejecta was followed (§3.4). Whenever the ejecta reached the boundaries of the current computational domain, the solution was embedded into a new, larger domain (twice as large in each dimension, but with the same resolution at the coarsest level). The embedded solution was initially kept at a higher mesh refinement level (such that it expands into the coarser grid, rather than being mapped into it). This step was repeated several times until homologous expansion was reached. The final domain had an extent of in cylindrical radius and twice that value in the -direction. During the remaps into larger domains, the densities of the ambient media were lowered by factors of 10 from (in the original domain) to . While ambient material piles up at the explosion front, the total mass of this material is low, on the order of , and we do not expect it to have significant influence on either the ejecta structure or the velocities.
We generally make use of symmetries to reduce the computational load. With only one detonator, the problem is axisymmetric and its solution can be computed in 2D. For a simulation with two synchronous spherical detonators it is sufficient to do a 3D calculation of only a quarter of the star, with mirror symmetry at two boundaries (the and boundaries in our simulations). Two asynchronous detonators require a half-star simulation with mirror symmetry at one boundary (the boundary in our simulations).
2.2. Nuclear Energy Generation and Nucleosynthesis

Energy generation and approximate nucleosynthesis were calculated in all cases using a 19-isotope network with constituent species as defined by Weaver et al. (1978) and nuclear reaction rates updated to current values (Woosley & Heger, 2007). Screening corrections were implemented for all rates. This network includes an “alpha-chain” (, ) of nuclei from through , plus the species n, p, , , and . Simulated steady state links (i.e., within a time step) also approximate the presence of the odd isotopes from through (i.e., isotopes with , ). For this study, the photodisintegration of to was not allowed which meant that electron capture and were essentially omitted from the network. Furthermore , , , n, and p never achieved any significant abundances, so the effective network really just contained the 13 alpha-chain isotopes. Past studies (Timmes et al., 2000) have shown that such a limited network gives good agreement with the results of much larger networks provided one is interested only in bulk nucleosynthesis and energy generation.
The network itself was employed in all carbon-rich zones always and, in most cases, for the helium shell. In some cases, however, it was computationally expedient to use a table that was prepared off-line using the network. Those cases included studies of helium shell detonation where the whole star was carried (§3.2), up until the generation of a hot spot in the core. The simulations for which detailed yields are given (§3.4) make use of the full network from beginning to end, as do the local simulations of direct drive (§3.1).
The use of a table here was novel and warrants some discussion. Unlike isobaric burning in e.g. carbon deflagration supernovae, the table here has to work reliably in dynamic situations where both the temperature and density are rapidly varying and where the outcome is sensitive to the time history of both. Using the network, a large table was generated using the results of many off-line studies of helium burning at constant temperature and density. Values of temperature in the range () and density in the range () were included. Results of the burning—the composition, average binding energy per nucleon, and time derivative of the helium mass fraction—were sampled for 50 values of helium mass fraction ranging from 0.02 to 1.0 in steps of 0.02. To preserve accuracy, the rate equation for the helium mass fraction was divided by the leading order term in the reaction rate, i.e.,
| (1) |
This resulted in a slowly varying function of , , and in the table.
When using the table in a multi-dimensional simulation, triple variable interpolation in , , and gave the current composition and . The current time step and gave a new helium abundance at the end of the step. Another call to the table using the new helium abundance gave a revised composition for the other species, and the change in composition gave a change in nuclear binding energy, hence an energy generation, and the process continued.
The shortcoming of this approach is that the entries in the table were generated at constant temperature. This neglects additional variables because a given temperature, density, and helium abundance can be reached by a variety of histories and the instantaneous abundances of the other nuclei are sensitive to which history was followed. Some additional rules are imposed to avoid unphysical and poorly behaved solutions. The helium abundance was only allowed to decrease, i.e., had to be negative, or no composition change or energy generation is allowed. Further, no modification of the composition occurred unless both the abundance of and the nuclear binding energy increased during a time step. When these conditions were met, a change in composition was allowed, but the new composition was not just taken from the table. Instead a fraction of the new composition at the given temperature and density was added to the old one with that fraction determined by the change of the helium abundance during the step. Essentially this procedure partitions the nuclear evolution for an arbitrarily varying temperature and density history into a series of small steps taken at constant temperature and density. For the conditions of the problem, the requirement that the time step be a small fraction of the Courant time proved adequate to preserve accuracy.
To demonstrate the validity of the procedure, a series of simulated explosive helium burning studies were carried out off line using both the network and the table. Starting with a composition of pure helium, matter was expanded from a peak temperature and a corresponding peak density
| (2) |
along paths given by
| (3) | ||||
| (4) |
with being the time scale for the explosion. The final composition was examined when the temperature had declined below . The results are shown in Figure 1. In general the agreement between the network results and those obtained using the table is quite good. Using the table gives a smaller final abundance for helium because burning at a constant low temperature gives a smaller mean nuclear mass and charge than explosive burning cooling from a higher temperature to the same helium mass fraction, density and temperature. Lighter nuclei have larger cross sections for -capture. One could improve the fit by adding a fourth independent variable, the mean nuclear charge (excluding helium itself), but the present approach was deemed adequate for this study. Some test runs at constant temperature and density using the table and the network gave near perfect agreement showing that the table had been correctly implemented.
We further tested the tables by calculating the yields of 2D helium detonations in model 1, with a setup similar to run 4 presented in §3, but using closed boundaries at all sides to prevent hot ash from leaving the computational domain (which we wanted to keep small for this test). The detonation wave converges after on the other side of the star. Compared to the calculation with the table, the detonation with the network is only slightly faster (the detonation front is ahead by about as measured from the center at , with about half of the discrepancy being due to a slower start of the artificial detonator with the table). We measured the yields at , at which time the helium burning has ceased (we suppressed the burning of carbon). With the network, we thus get a yield of , burning of . With the table, the numbers are and . The energy produced is with the network, and with the table. This is adequate for our purposes.
3. Results
3.1. Direct Drive
Here we consider the possibility of a helium detonation wave that traverses the core-shell interface beneath its origin, directly igniting the core at the outer edge. In the first two sections, we present several simulations calculated in 2D using CASTRO. Pursuing the hypothesis that direct drive is related to a critical mass, we then discuss the results of idealized 1D simulations using the KEPLER code in §3.1.3.
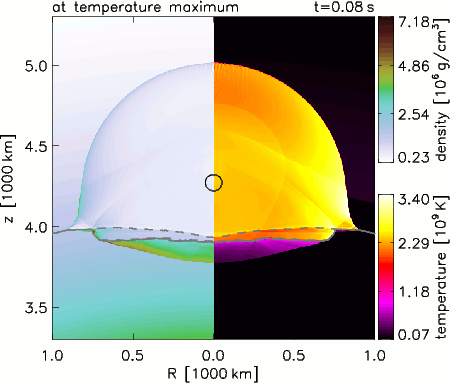
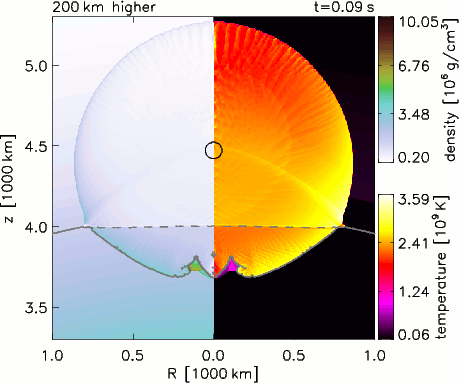
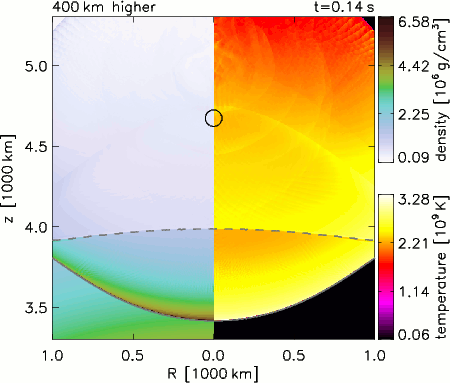
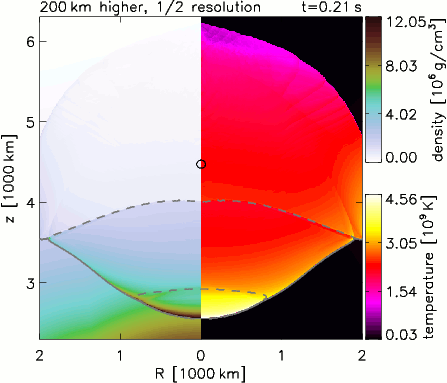
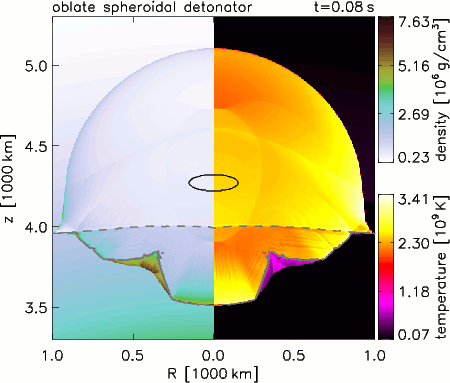
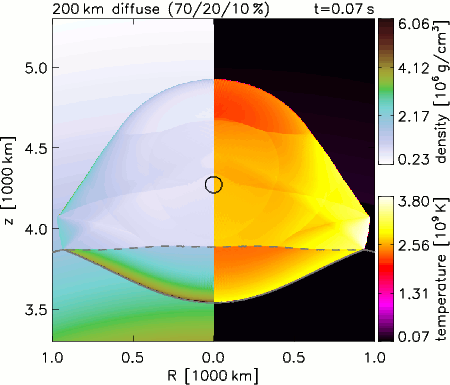
| (a) | (b) | (c) | (d) |
 |
 |
 |
 |
| (e) | (f) | (g) | (h) |
 |
 |
 |
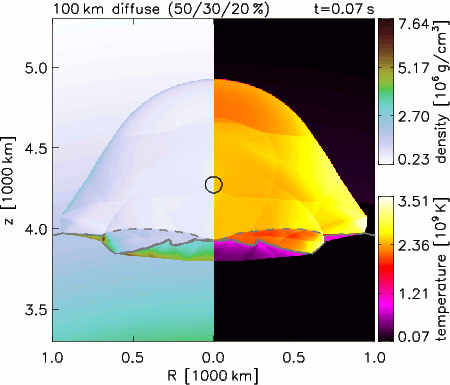 |
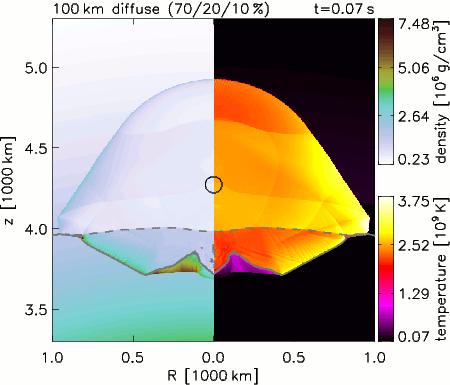
| runaaLabels as in Figure 2; “–” denotes runs mentioned in the text only | altitudebbDistance to the hottest helium layer | specialtycc“mixed” stands for a mixed layer of helium and core material above and below (“a&b”) or only below the original core-shell interface | works/fails | |
|---|---|---|---|---|
| [km] | [km] | |||
| a | 0.977 | 0 | — | fails |
| b | 0.977 | 200 | — | fails |
| c | 0.977 | 400 | — | works |
| d | 1.953 | 200 | — | works |
| e | 0.977 | 0 | 3:1 spheroidal detonator | fails |
| – | 0.977 | 0 | 4:1 spheroidal detonator | fails |
| f | 0.977 | 0 | mixed (70% ) a&b | works |
| g | 0.977 | 0 | mixed (70% ) | fails |
| – | 1.953 | 0 | mixed (70% ) | fails |
| h | 0.977 | 0 | mixed (50% ) | fails |
| – | 0.977 | 0 | mixed (80% ) | fails |
| model | aaDistance from the core-shell interface to the detonator center | bbDefined as twice the mass of the helium contained in the half-sphere of radius below | works/fails | |
|---|---|---|---|---|
| [km] | [km] | [g] | ||
| 1 | 4270 | 189 | fails | |
| 1 | 4470 | 389 | fails | |
| 1 | 4670 | 589 | works | |
| 1 | 3765 | 149 | fails | |
| 1 | 3815 | 199 | fails | |
| 1 | 3865 | 249 | works | |
| 1 | 3624 | 106 | fails | |
| 1 | 3636 | 118 | fails | |
| 1 | 3649 | 131 | works | |
| 1 | 3674 | 156 | works | |
| 1 | 3724 | 206 | works |
3.1.1 Altitude, Shape and Interface Composition
Taking the WD model 1 as initial condition, we did a series of 2D simulations that cover a local region including the core-shell interface. The domain range in most cases is and in cylindrical coordinates , the core-shell interface being at the spherical radius . The grid resolution in most cases is (no AMR). The gravitational field is taken to be static and the boundary conditions are usually reflecting on all sides (as the detonation proceeds supersonically, the choice of boundary conditions is not critical). All simulations employed a full 19-isotope network which covers helium, carbon and oxygen burning. The detonation spots used to start the detonation had a radius of , a temperature of at the center and at the outer edge (linearly decreasing), a radial velocity of at the outer edge (increasing linearly from zero) and twice the ambient density.
Table 2 contains a list of setups and results, and Figure 2 depicts snapshots of several cases. In the standard case (a), the helium detonator is centered at the radius at which the temperature is maximal, above the core-shell interface. While the detonation creates an indentation in the interface, and some of the carbon at the outer edge of the core burns as a result of the entering shock, the burning does not support a detonation in the core. Direct drive clearly fails in this case.
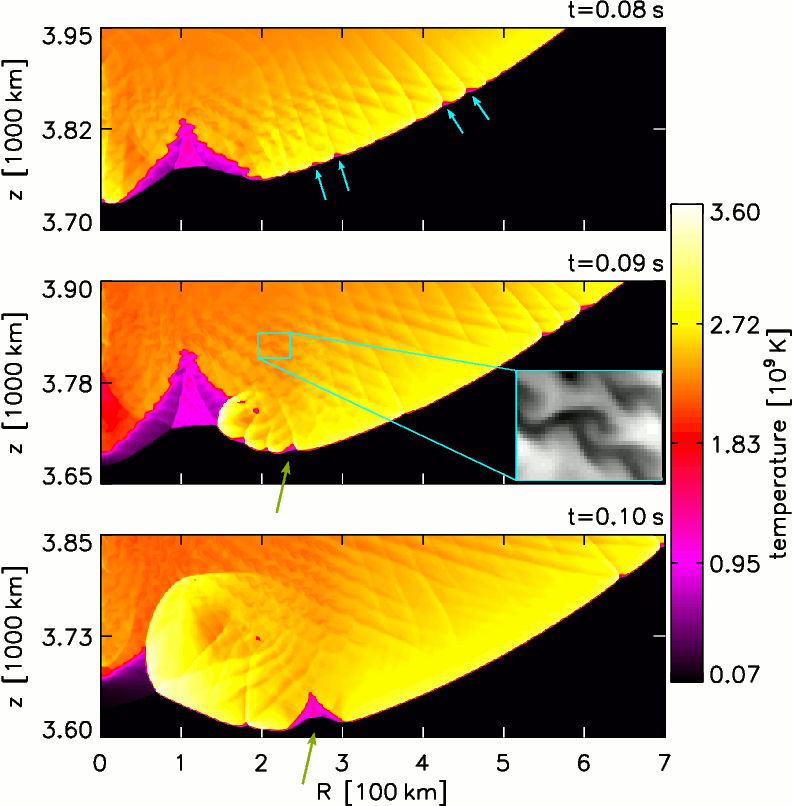
With the helium detonation initiated higher, case (b), the detonation penetrates into the core. The front is unstable though, developing dents filled with compressed material that fails to ignite. The formation of these instabilities appears to be the result of complex ineractions of reflecting shock waves. Figure 3 shows snapshots of the temperature in the detonation front in case (b). There are small indentations in the front, seemingly related to waves in the post-detonation region (top panel, indicated by cyan arrows). A few hundred kilometers below the core-shell interface, a big dent forms (at in the plots). While it is later on consumed by a secondary detonation front, a new dent forms (middle and bottom panels, olive-green arrows). The vortical structures visible in the plots on a high zoom level are indicative of Richtmyer-Meshkov instabilities (RMI, e.g., Brouillette, 2002). The presence of RMI is supported by the fact that the pressure gradient behind the detonation is normal to the front, whereas the density gradient across the interface is radial with respect to the center of the star, i.e., the pressure and density gradients are misaligned, as is typical for RMI. It is possible, however, that RMI here emerge as a secondary phenomenon. Global simulations, presumably in 3D, would be needed to determine whether such an unstable detonation eventually blows out or consumes the core, but they are too expensive at this resolution. Recognizing that these are marginal cases, we opted not to follow such pathological detonations in this study and dismissed them as failures.
With the helium detonation initiated above the temperature maximum, case (c), the detonation stably penetrates the core. This strengthens our assumption that the instabilities described above are indicative of marginal cases. To make sure that the detonation stays stable, we followed it in a global simulation that encompasses half of the star, with the same resolution () as in the local simulation in a region that extends from the detonation spot to the center of the star ( and ). This detonation stably proceeds all the way to the center. Oxygen burning starts below the interface (at 80% of the core radius).
In a simulation similar to case (b) with half resolution (), case (d), the front is stable. The formation of indentations in the front is completely suppressed. We followed this detonation until a depth of beneath the core-shell interface. Oxygen starts to burn below the interface (at 72% of the core radius, see the lower dashed line in panel d), where the density exceeds .
The fronts of detonations started at different altitude have different curvatures when they hit upon the core-shell interface. This raises the question as to whether the curvature of the detonation front plays a key role. Apart from altitude, the curvature is determined by the shape of the detonation spot, provided the spot is sufficiently close to the interface (for isotropic expansion velocities, any explosion eventually becomes spherical). A detonator in the form of an oblate spheroid fares better than a spherical one, compare panels (e) and (a). However, the detonation front also starts out considerably hotter than in the spherical case ( instead of at ), indicating that part of the observed difference is possibly related to the details of how the detonation was started, rather than curvature alone111 The spheroidal detonation spot was constructed using the same temperature and velocity profiles with respect to the distance of the surface of the spot as for spherical detonators. However, this means that the energy contents (kinetic and thermal) are different. The distance to the core-shell interface may not be large enough for the detonation wave to lose all information of its (artificial) initiation besides curvature. This complicates the comparison. However, as the explosions induced by the spheroidal detonators are in general stronger (consistent with a higher energy content), we can still draw conclusions about the non-importance of curvature if direct drive with such a detonator fails. . The detonation spot in case (e) is stretched by a factor 3 in radial direction, its extent in the vertical direction being the same as that of the spherical spots. Shortly before it reaches the core-shell interface, the curvature of the underside of the oblate detonation front roughly corresponds to a sphere centered above the hottest layer, i.e., it is comparable to the detonation in case (b). A simulation with a detonator stretched by a factor 4 (i.e., even more oblate) gives a very similar result (not shown in Figure 2). The curvature in this case corresponds to a sphere centered more than above the hottest layer, i.e., one would expect from case (c) that the detonation should enter the core without problems, yet it does not. We therefore surmise that curvature is not as important as altitude.
We also considered the possibility of a layer where helium mixes with core material. In case (f), we start with a mixture of 70/20/10% // in the region , i.e., above and below the original core-shell interface. The detonation stably transcends into the core in this case. We surmise that a mixed layer on both sides of the interface effectively increases the distance from the detonator to the core, thus facilitating direct drive.
In cases (g) and (h), we start with a mixture of 70/20/10% // and 50/30/20% //, respectively, in a wide region above the original interface only. Although the detonation changes when it enters the mixed region, becoming hotter and faster, it fails to penetrate the core and stay intact in both cases. Even with half resolution, the detonation in case (g) shows the same instability (unlike case d, for which the coarser resolution helped to suppress instabilities in the detonation front). A mixture of 80/20% / in a wide region also leads to failure (not shown in Figure 2).
3.1.2 Heavy White Dwarfs
The above discussion shows that direct drive is not likely for model 1 if the helium detonation starts where the gas is hottest, i.e., the most natural location for a detonator. Models 1 and 1 both have a denser 1.0 core which in principle should detonate more easily than the core of model 1. Model 1 is slightly more compact than model 1.
Following a similar procedure, we tested for the possibility of direct ignition with detonators at different altitudes for these models. The radius of the detonation “hot spots” was and the distance between the core-shell interface and the temperature maximum was and in models 1 and 1, respectively. In both cases, direct ignition failed if the detonation was started at this altitude.
If we started the helium detonation above the hottest layer of model 1 however, the detonation front smoothly transcended into the core. If ignited above the hot layer, the detonation fragmented and died upon passing into the core. In model 1, the direct drive worked with detonators at altitudes of , and even above the hottest layer. At , however, it failed222Given that this displacement is becoming comparable to the size of the detonator itself, it is questionable whether direct drive will or will not work for the most massive models. Also the exact location of of the hot layer is probably not known to this precision due to the one-dimensional mixing length approximation used to treat convection. Multi-dimensional simulation of the convection during the pre-explosive runaway might provide additional insight.. These results for direct drive with detonators at different altitudes are summarized in Table 3.
3.1.3 The Critical Altitude for Direct Drive
To explore the relevant physics underlying the existence of a critical altitude for directly driving a detonation into the carbon-oxygen core beneath the ignition point in the helium layer, a series of idealized calculations were carried out using the KEPLER code. The hypothesis to be explored was that successful propagation requires a critical amount of momentum in the downwardly moving shock wave. That momentum should be greater than or equal to that of a “critical mass” (Niemeyer & Woosley, 1997; Röpke et al., 2007; Seitenzahl et al., 2009) of carbon and oxygen at the same density as exists at the helium-carbon interface. In addition, that momentum should be focused into an area comparable to the geometrical size of the critical mass. Stated another way, the altitude of the initial helium detonation should exceed the radius of the critical mass required for initiating a successful carbon detonation evaluated at a density equal to that at the helium-carbon interface.
Of course this is quite approximate. The density and pressure are not constant in either the helium layer or the carbon underneath, and the energy yield from helium detonation is different from that of carbon detonation. We do not know if the helium detonation ignites at a point, which implies spherical propagation, or in an extended region which might have a more planar geometry. These complexities can be partly compensated for, however. The effective radius of the helium is one that encloses a critical mass (evaluated at the density of the interface), even though the density within that sphere varies. The detonation can be studied in a two phase medium with a helium detonator surrounded by a thick shell of carbon and oxygen. The detonation should occur in spherical geometry so long as the size of the region in the helium layer that intially runs away is small compared with its altitude above the interface. We note that if, pending further study, the latter assumption were violated, the required altitude would be reduced (compare Tables 1 and 4 in Seitenzahl et al. (2009)).
In the first study, spheres of 50% carbon, 50% oxygen were prepared with a constant density of , as appropriate to the interface in model 1. In a one-dimensional spherical region of variable radius, the temperature was given a constant gradient (with respect to radius, not mass, even though the code is Lagrangian) with values ranging from at the center to at the edge. This 200 zone region was surrounded by 300 zones of carbon and oxygen at . All zones had the same radial thickness. The radius of the region with the temperature gradient was varied and its ability to generate a self-sustaining detonation determined. The central value of was sufficiently high to guarantee that carbon burning propagated with a phase velocity that was initially supersonic. This procedure is very similar to the one previously followed by Niemeyer & Woosley (1997) and Röpke et al. (2007).
For a “detonator” radius of 150 km, an initially strong detonation decayed away after traversing an additional 70 km of “cold” carbon and oxygen. For a radius of 200 km however, the detonation propagated successfully to the edge of the grid at 500 km. This is sufficiently far, considering that in the real star the density would have become higher and the detonation more robust. These detonators enclosed masses of () and () respectively.
A more precise descriptor of the critical detonation size may be the temperature gradient rather than the critical mass. For the two runs described here, the temperature gradients are (failed detonation) and (successful) respectively. Seitenzahl et al. (2009) studied the initiation of carbon detonation in spherical geometry and found a critical gradient of at a density of (their Table 4). Our value is consistent with an admittedly uncertain extrapolation of their Figure 9 to .
More realistically though, the detonator consists of helium, not carbon and oxygen, and the initial background is better approximated as isobaric rather assuming than constant density. An initial temperature of in the carbon also implies an unrealistically high energy density, not likely to be achieved at these low densities. A pure helium sphere with variable radius was surrounded by a thick shell of 50% and 50% again at with a temperature of . The helium core was comprised of 200 Lagrangian mass shells of equal mass with a central temperature of only and a temperature at the edge of and a constant gradient (with respect to radius) in between. As with the carbon detonator, the large value of central temperature assured a phase velocity for the helium burning that was initially supersonic and the well zoned gradient implied the existence of a region where it was sonic. The density within the helium core was varied so as to provide a constant pressure equal to the pressure in the cold carbon-oxygen layer. Thus pressure on the entire grid was initially . Gravity was neglected and the pressure was initially held constant by applying a boundary pressure equal to the pressure on the grid. If the radius of the helium sphere was enclosing , the detonation successfully propagated into the surrounding carbon. Another run with a helium sphere radius of () failed to detonate the carbon shell however.
The energy yield from carbon detonation at this density, taken from the calculation, is . Oxygen does not burn here, but carbon and neon do, to magnesium and silicon. The yield from helium detonation, on the other hand, is only because only about one-third of the helium burns to immediately behind the shock (the helium burning reaction rate saturates at high temperature). Some helium continues to burn well after the shock has passed, eventually raising the energy yield to , but this energy is not so important for sustaining the shock wave. The critical radius is also the cube root of the critical mass. This explains the similarity between the runs using a carbon-oxygen detonator and helium detonator at this density.
These results agree qualitatively with those obtained using a 2D representation of the full star in the CASTRO code (Table 3). They also agree reasonably well with the pure carbon-oxygen study at constant density described above. Apparently the critical altitude (or detonator radius) is not very sensitive to the different energy yields of carbon and helium burning. This is somewhat surprising, but confirms the hypothesis that the critical altitude in the helium layer is one that would enclose the critical mass of carbon required for detonation at the interface density.
3.2. Shock Collisions and Hot Spots
| run | model | aaAngular separation(s) of the detonators in cases with multiple detonators | bbDelay of the second (and third) detonator | ccGrid resolution at the highest AMR level that includes the hot spot | ddCadence of the considered snapshots | eeDistance from the center (spherical radius) | typeffType of listed hot spot: (p) where primary waves converge, (r) where reflected waves collide, (t) where a wave passes through others and converges or (b) near the core boundary, where primary waves first collide | ||||
|---|---|---|---|---|---|---|---|---|---|---|---|
| [s] | [km] | [s] | [s] | [] | [] | [] | [] | ||||
| 1 | 1 | — | — | 6.51 | 0.05 | 1.50 | 1.90 | 5.25 | 6.21 | p | |
| 2 | 1 | 180∘ | — | 6.51 | 0.05 | 1.40 | 1.45 | 1.93 | 3.55 | r | |
| 3 | 1 | 180∘ | 0.30 | 6.51 | 0.05 | 1.45 | 1.72 | 3.34 | 4.00 | r | |
| 4 | 1 | — | — | 14.6 | 0.02 | 1.48 | 1.87 | 8.09 | 2.68 | p | |
| 3.66ggRestarted with finer zoning in the region where the internal wave converges | 0.02 | 1.48 | 1.92 | 9.61 | 2.54 | p | |||||
| 5 | 1 | — | — | 25.0 | 0.05 | 1.55 | 1.96 | 3.09 | 4.29 | p | |
| 25.0 | 0.005 | 1.515 | 1.91 | 5.51 | 20.9 | p | |||||
| 6 | 1 | — | 25.0 | 0.05 | 1.40 | 1.77 | 2.81 | 5.66 | p | ||
| 7 | 1 | 0.15 | 25.0 | 0.05 | 1.45 | 1.80 | 3.67 | 9.51 | p | ||
| 8 | 1 | — | 25.0 | 0.05 | 1.40 | 1.54 | 2.17 | 5.04 | t | ||
| 9 | 1 | 0.30 | 25.0 | 0.05 | 1.50 | 1.96 | 2.86 | 3.59 | t | ||
| 10 | 1 | , , | 0.30, 0.20 | 25.0 | 0.05 | 1.45 | 1.65 | 2.19 | 5.27 | t | |
| 11hhDespite this being a 2D problem, this run was done in 3D | 1 | — | — | 52.1 | 0.05 | 1.55 | 1.95 | 2.96 | 7.56 | p | |
| 12 | 1 | — | 52.1 | 0.05 | 1.45 | 1.74 | 2.19 | 4.93 | p | ||
| 13 | 1 | — | 52.1 | 0.05 | 1.45 | 1.81 | 2.00 | 4.24 | p | ||
| 14 | 1 | — | — | 6.51 | 0.05 | 1.40 | 1.40 | 3.52 | 4.54 | p | |
| 15 | 1 | — | 6.51 | 0.05 | 0.60 | 0 | 3.48 | 3.48 | 0.60 | b | |
| 16 | 1 | — | — | 6.51 | 0.05 | 1.80 | 2.13 | 2.44 | 3.31 | p | |
| 17 | 1 | — | 6.51 | 0.05 | — | — | — | — | — | — |
| (a) run 4, one detonator | (b) run 4, two detonators, | (c) run 4, two detonators, |
|---|---|---|
 |
 |
 |
 |
 |
 |
|
 |
 |
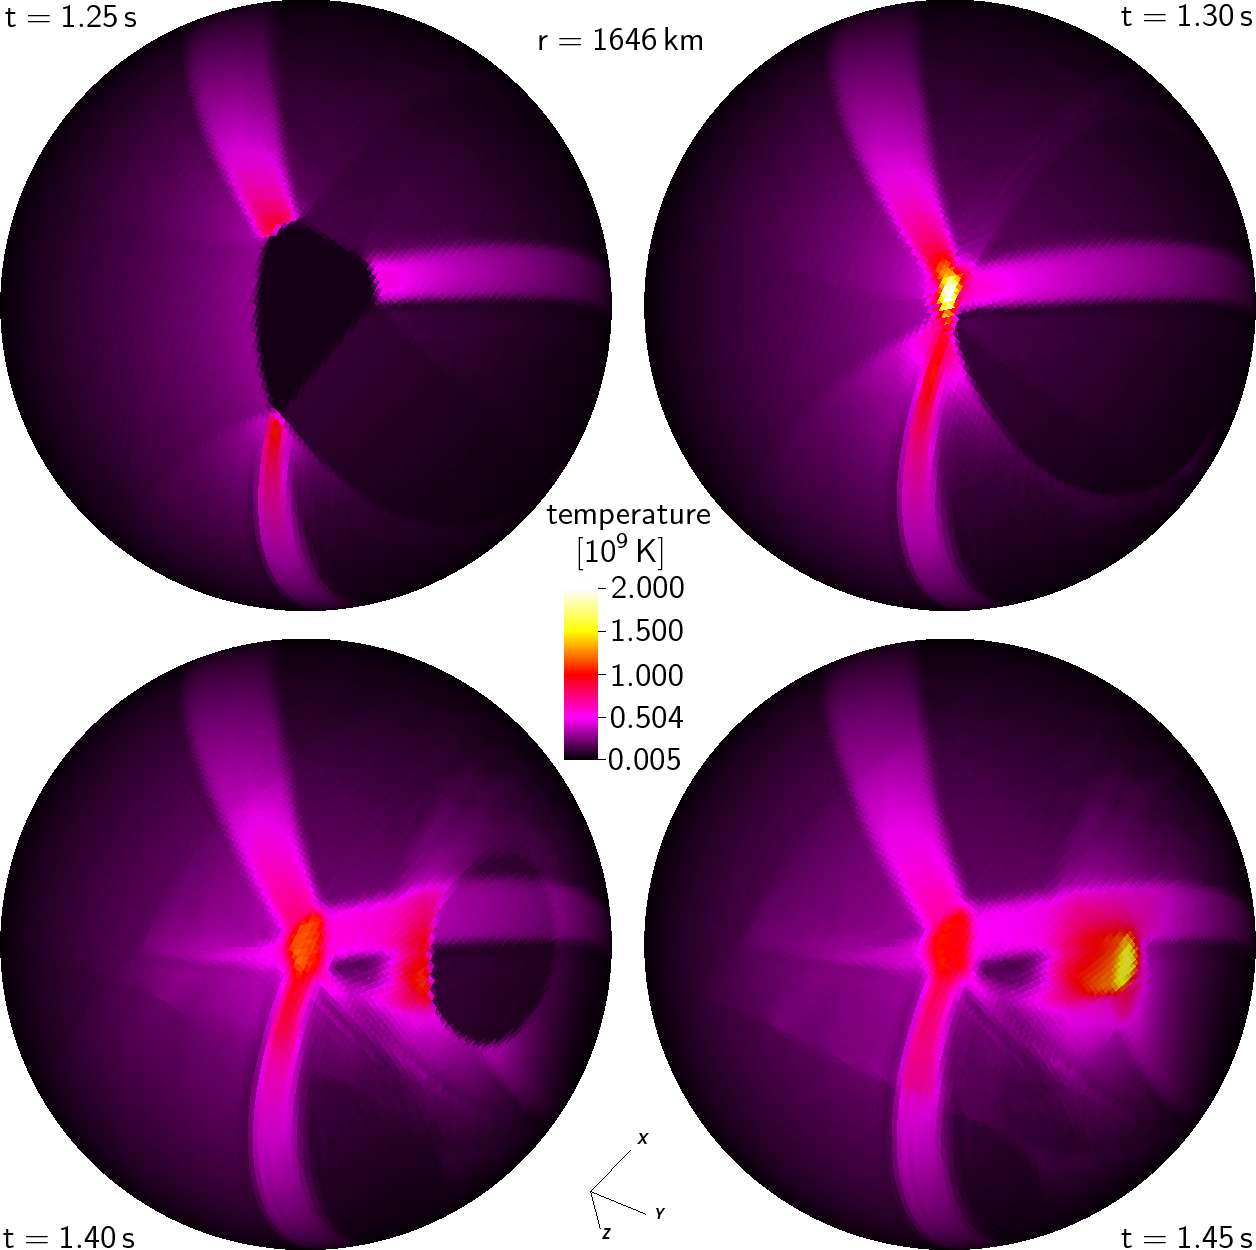
To study the sliding helium detonation and the internal compressional wave which potentially produces the seed for a core detonation, we suppress nuclear burning in zones with more than . This is to prevent spurious carbon burning at the core-shell boundary due to the mixing of hot helium with cold carbon in a zone, and to prevent core detonation before the waves in the core have fully converged and produced the highest possible temperatures and densities (which we want to determine). For the sake of comparability, we here focus on the model 1 for the most part. The detonation of WDs with cores and lightweight helium shells is discussed in §3.2.6.
3.2.1 One Detonator
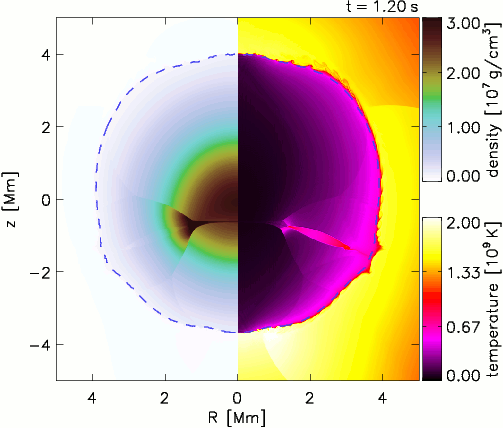
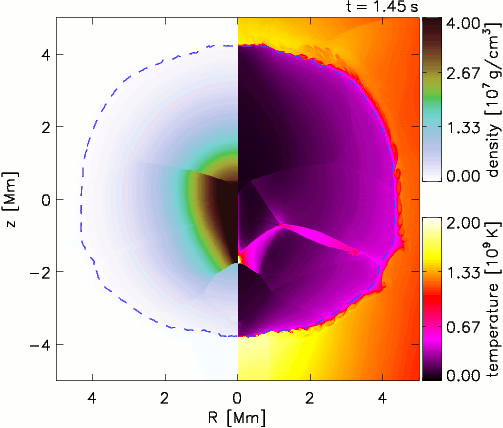
We here consider the case of a single, spherical detonation spot setting off a helium detonation where the hottest layer (at ) intersects with the positive -axis in our coordinate system. This axisymmetric problem was investigated with different resolutions in three 2D runs (4, 4, and 4), and one 3D run (4) in a quarter-star sized domain and mirror symmetries at the inner boundaries.
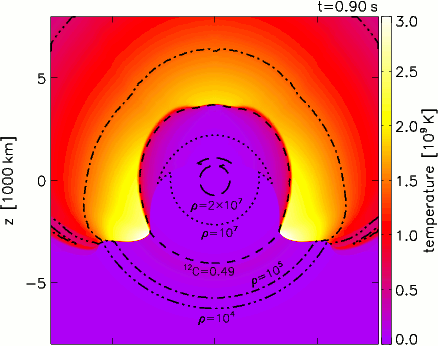
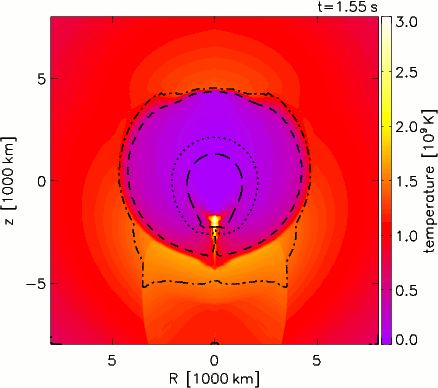
The helium detonation wave wraps around the star (see Figure 4a) and reaches the antipode of the detonator after about . For comparison, a sound wave in the helium shell would need about to reach the other side of the star. This corresponds to a front velocity of . The polar (latitudinal) velocity of the ash directly behind the front and the sound speed in the ash both are roughly . Their sum is larger than the actual front velocity, consistent with incomplete burning rather than a Chapman–Jouguet detonation (cf. Sim et al., 2012). The fraction far () behind the detonation front is about 70%.
The sliding detonation induces an internal compressional wave which converges off-center inside the core on the -axis (in general: the axis of symmetry in the problem). The average velocity with which the perturbation propagates in negative -direction from the helium ignition point to the final convergence point is , a little larger than the mean sound speed inside the core ().
The temperatures and densities in some zones of run 4 are high enough to potentially333Whether a spontaneous detonation initiates depends not only on the density, the peak temperature and the size of the region (or, equivalently, its mass), but also on the shape of the temperature profile (as emphasized by Seitenzahl et al. 2009). The conditions in the hottest zone are listed in Table 4. Since the grid zones in our simulations are usually larger than the critical masses for detonation, it is not possible to predict with certainty whether the conditions in one or a few zones lead to detonation. trigger a core detonation where the internal wave finally converges (Niemeyer & Woosley, 1997; Röpke et al., 2007; Seitenzahl et al., 2009). However, it is likely that the core ignites earlier, at larger distance from the center and close to the core-shell interface on the -axis, where the internal wave front converges in the polar direction (but not in radial direction), and the converging helium detonation drives a hot, thin inflow of in positive -direction. As a numerical experiment, we restarted run 4 without suppressing the burning of carbon-rich zones at times (when the helium detonation converges), , , and (when the internal wave converges). In all of these cases, a detonation wave in the core forms immediately.
The values of the density and temperature in the hot spot are dependent on the spatial resolution of the grid as well as on the temporal separation of the considered snapshots (for practical reasons, we do not edit and analyze the results at every time step), cf. the values of temperature and density in the hot spots of runs 4, 4, 4 and 4 listed in Table 4. However, all results unequivocally indicate that the core would detonate. We expect that a higher resolution would only increase the likelihood for detonation.
3.2.2 Opposite Detonators
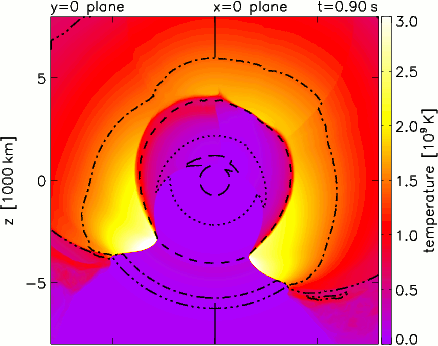
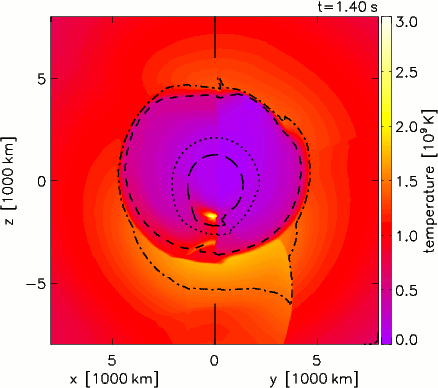
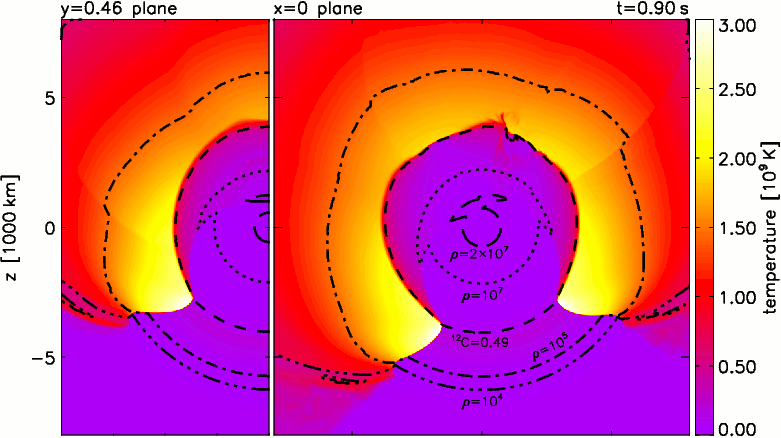
As a limiting case of multi-point ignition, we at first consider two detonators at opposite points in the helium shell (run 4). While it is unlikely for such detonators to be synchronous, this poses a computationally cheap 2D problem which can be regarded as a numerical experiment. The internal waves in this case collide on the plane (the detonators being centered on the -axis at ), beginning at the outer edge of the core at and reaching the center at . The final wave collision in the central part of the star takes place on a wide disk without generating a discernible hot spot. However, temperatures occur on the collision plane at large radii (). While the material is not compressed there, we observe a radially inward moving core detonation in a run where the burning of carbon is allowed for . If carbon burning is suppressed, the original core waves are reflected at the plane. The reflected waves collide on the -axis (symmetrically on both sides of the plane), creating dense hot spots at that would very likely have ignited the core if ignition had failed earlier.
When one of the detonators (in our case the one on the negative side of the -axis) is delayed by , the two helium detonation fronts collide at at an angle of with respect to the positive -axis, see Figure 5. As in the synchronous case, the collision of the primary internal waves, which here happens on a slightly curved disk at , does not generate a hot spot. However, a wave reflected toward the negative -axis produces a hot spot that is sufficiently dense to trigger core detonation.
3.2.3 Two Synchronous Detonators
Before discussing 3D cases of two-point ignition in the helium, it is worth noting that a single, small aspherical detonator is virtually equivalent to a spherical one, regardless of how strongly deformed it is (as long as it sets off a detonation). As the detonation expands with constant velocity in every direction, the original asphericity is quickly lost. To assess the effects of non-axisymmetry on the focusing of the internal waves, we therefore consider cases with two detonators at varying but significant separation from one another. For two synchronous detonators, it suffices to do a 3D simulation of a quarter of the star, with mirror symmetry at the inner boundaries.
In cases with two moderately separated, synchronous detonators (we consider angular separations of , and ), the initially separate helium detonation fronts collide halfway between the two spots on the geodesic connecting them on the core surface, in our case the positive -axis. While the detonations merge, the combined front proceeds toward the antipode of this collision point. The front initially has a head start on the plane that connects the two spots with the center of the star (the plane in our simulations), but the deficit becomes smaller as the detonations continue to merge444For comparison, consider two merging detonations in a plane, starting from the -axis at . With being the radius of an individual detonation, the height of the combined detonation on the -axis is , asymptotically approaching (and not ) at large radii. That is, the two initially separate detonations become indistinguishable when their size is much larger than the initial separation.. As it approaches the antipode, the detonation front has the shape of a pointed ellipse. This shape can easily be understood considering the combined detonation as a superposition of two detonations: the pointed ellipse is the intersection between two circles (or, more precisely, lines of constant latitude, if the ignition points are regarded as poles) whose centers are the respective antipodes of the ignition points. In a simulation, the detonation finally converges when the width of the pointed ellipse approaches the size of a grid zone. Theoretically, the ratio of the length of the ellipse compared to its width increases indefinitely, i.e., the wave always converges in a line rather than a point and the difference between having one and two detonators should become larger with increasing grid resolution or diffusion length.
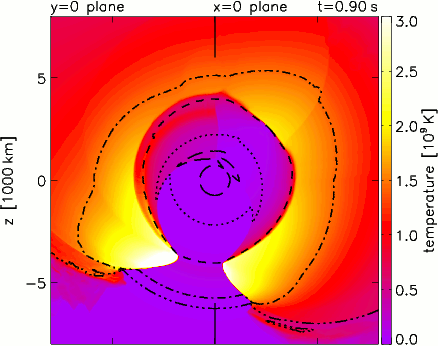
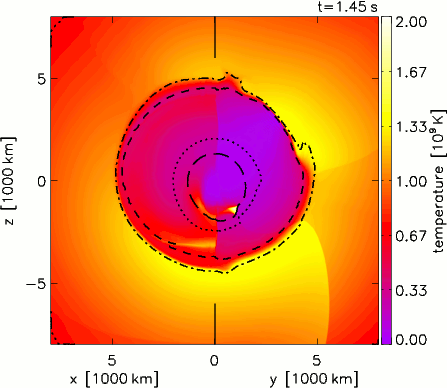
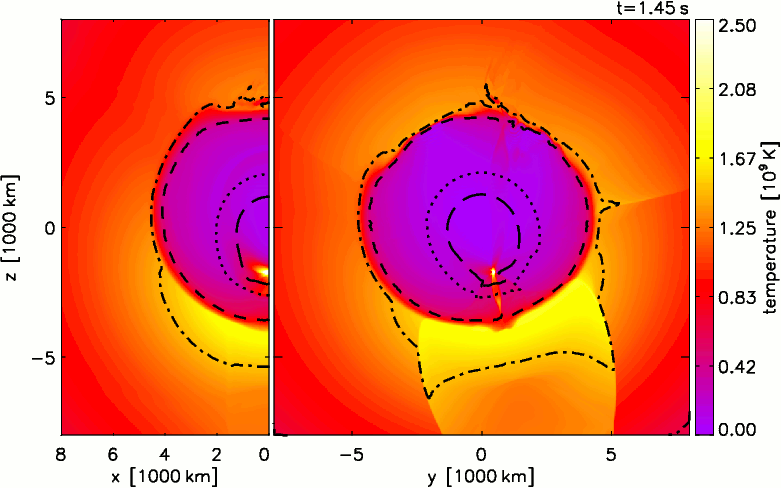
In cases with and detonator separation, the region in which the internal waves converge becomes sufficiently hot and dense to trigger a core detonation, see Table 4 and Figure 4b. We explicitly confirmed this for run 4 by switching on carbon burning for . When two synchronous detonators are apart (run 4), there is no hot spot at the site where the two primary waves converge at the -axis (in general: the intersection of the two planes of symmetry in this problem). However, the waves induced by the two detonators pass through one another and form two hot spots at considerable distance () from the -axis, see Figure 4c.
3.2.4 Two Asynchronous Detonators
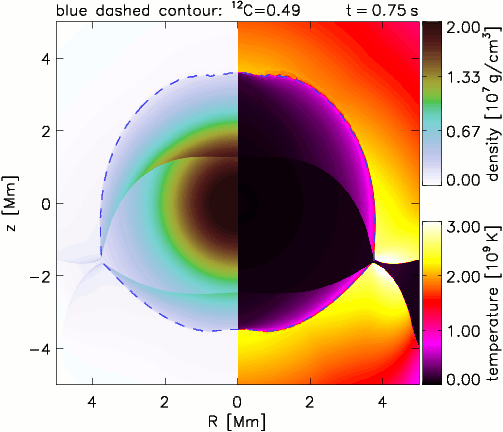
We next consider a case of two asynchronous detonators with an angular separation of , run 4. Note that this scenario is less symmetric than the case of two synchronous detonators, there being only one mirror symmetry in the problem, across the plane which intersects both detonators. We therefore use a 3D domain that comprises half of the star and assume mirror symmetry at the inner boundary. One of the detonators—the one on the side in our simulations—is set off (roughly half the time needed for the first detonation to reach the second detonator) after the first one555We implemented this in the code by suppressing the time-step update of the zones comprising the detonation spot for said time.. Shortly before converging, the helium detonation front assumes the shape defined by the intersection of two circles with different radii, see Figure 6. The same shape can be seen in the internal wave front on concentric spherical surfaces. Just like in the synchronous case (run 4), a dense hot spot forms when the internal wave fronts converge, see Figure 7 and the rightmost snapshot in Figure 6.
With separation and a delay of , run 4, there is no hot spot where the internal waves from the two detonators converge. As in the case with synchronous detonators at discussed above, the waves from the two detonators pass through one another. The wave from the first detonator is the first to converge and trigger a core detonation.
3.2.5 Three Asynchronous Detonators
Unlike the above cases, a setup with three or more detonators is in general free of symmetries and requires a 3D simulation of the full star. In run 4, we again consider two detonators (A,B) with a separation of , one of which (B) is delayed by , exactly as in run 4. In addition, a third detonator C, delayed by , is placed from detonator A and from detonator B on the positive side. In this case, when the helium detonation converges toward the last patch of unburnt helium, it roughly has a triangular shape. The same shape is present in the internal wave on concentric spherical surfaces. There is a distinct hot spot when the internal waves converge. Shortly after, a secondary hot spot arises as the wave induced by the first detonator converges again with itself. Figure 8 shows snapshots of both hot spots (right hand panels) and the converging wave fronts from which they originate (left hand panels).
3.2.6 Light Helium Shells


| altitudeaaRadial distance from the hottest helium layer to the center of the cap | arc length | rim density | rim velocity | detonates |
|---|---|---|---|---|
| [km] | [km] | [] | ||
| 0 | 141 | 2 ambient | 8 | yes |
| 0 | 96 | 2 ambient | 8 | no |
| 0 | 233 | ambient | 8 | yes |
| 0 | 141 | ambient | 8 | yesbbDetonation moves only inward at first and is then reflected back |
| 0 | 96 | ambient | 8 | no |
| 0 | 415 | ambient | 1 | yes |
| 0 | 233 | ambient | 1 | no |
| 0 | 415 | ambient | 0.5 | no |
| 0 | 781 | ambient | 0.5 | yesbbDetonation moves only inward at first and is then reflected back |
| 25 | 785 | ambient | 1 | yes |
| 25 | 418 | ambient | 1 | no |
We here consider axisymmetric detonations (one detonator or two opposite detonators) for progenitor models other than 1. A detonation in a helium shell on top of a solar mass core (model 1, run 4) is set off by a spherical detonator centered on the hottest helium layer. The sliding helium detonation yields a distinct hot spot where the internal wave converges at . With carbon burning turned on from the time when the helium detonation converges (), the core immediately detonates near its surface. This detonation is triggered by a thin, hot radial inflow of . As shown in the upper panel of Figure 9, temperatures of and densities on the order of are generated along this jet. In a simulation with two synchronous, opposite detonators, run 4, temperatures are generated neither when the wave fronts converge at the center, nor along the -axis when the reflected waves collide (in contrast with model 1, run 4). The only region hot enough to light the core in this case is located at the equatorial plane near the core’s surface, where the collision of the internal waves begins. Although there is no hot inflow comparable to the case with one detonator (note that a radial inflow in this case is not a jet), see lower panel in Figure 9, the core there ignites in the simulation.
It is difficult to set off a detonation in a helium shell sorrounding a one solar mass core (model 1). We did not succeed with a spherical detonator centered on the hottest helium layer, whose density is . A detonation does not start even with a (perhaps unrealistically) strong initial detonator: a central temperature of , linearly decreasing to at the outer edge, a density three times that of the ambient medium and a radius of (ending above the core-shell interface). Large shock velocities (we tried instead of our usual ) at the outer edge of the detonation spot did not help either.
A detonation in the shell of model 1 can be set off, however, by a large spherical detonator of radius (which is about twice the distance between the core-shell interface and the hottest helium layer) centered above the hottest helium layer. The resulting detonation front is more feeble than in all cases with heavier helium shells, blowing out at too coarse a resolution ( works, does not), and requiring the use of AMR in our simulated helium shell. But once started, the detonation propagates around the star and converges after (run 4). The corresponding front velocity is 4.3 times the sound speed in the hottest helium layer. When the internal wave induced by the helium detonation converges later, it forms a distinct hot spot. Without suppression of the carbon burning, the core detonates immediately after the convergence of the helium detonation, starting at the -axis near the core-shell boundary. In a simulation with two synchronous, opposite detonators, run 4, no hot spot is formed in the core. With carbon burning turned on, the core does not detonate in the simulation.
3.3. Ignition in an Extended Region
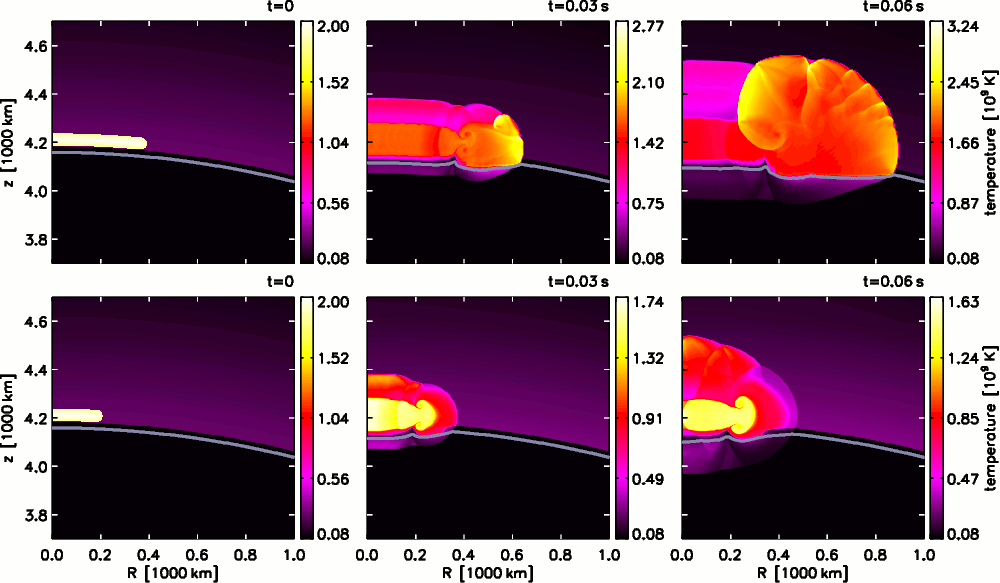
As stated in the above paragraph, a spherical detonator in model 1 needs to be fairly large to set off a helium detonation. This, however, is not compatible with a runaway starting at the hottest layer in the helium shell. As an alternative, we here consider the possibility of a thermonuclear runaway starting in a (curved) sheet on an equipotential, instead of a single point. The size of convective cells in the helium shell is expected to be on the order of the pressure scale height, which is at the hottest helium layer in model 1. The size of the region where the runaway starts could be a substantial fraction of this, but is probably not larger. As a toy model, we consider detonation spots in the form of spherical caps with a thickness of . Selected runs are listed in Table 5 and examples for a successful and an unsuccessful detonation are shown in Figure 10. As in most of our detonators, the temperature decreases linearly from at the center to at the outer edge (on all sides of the cap). The outer rims of the caps are half tori, imposed with a velocity that increases linearly from the torus center to the outer edge. An arc length of constitutes a limiting case in which the cap degenerates into a sphere with the same properties as our spherical detonators.
The cap detonator is more powerful than a spherical one with the same radial (with respect to the center of the star) extent. Detonations can be initiated at ambient density with subsonic starter velocities. Smaller sizes require harsher starting conditions. Below a size of (roughly 1/3 pressure scale height), the initiation of a detonation appears impossible. For the given density of near the temperature maximum of model 1, this limit is in approximate agreement with the recent findings of Holcomb et al. (2013), who determined the critical sizes of helium detonation for a wide range of densities in a series of 1D simulations.
3.4. Complete Detonations
Table 6 lists the yields from helium shell detonations in different models, measured at the time when the helium detonation converges opposite the detonator (we only consider single detonators here, not expecting the yields from detonations started at multiple points to be much different). The lightweight helium shell in model 1 produces little , only about 5% of what the heavier shell in model 1 produces, but the yields of isotopes with mass numbers between and is in total about twice as high as in model 1.
We followed the detonation of the core and the expansion of the ejecta to scales of (about 200 times the size of the initial WD), at which time the expansion is homologous. The total nickel yields in models 1, 1 and 1 is , and , respectively. Mass fractions of selected isotopes in models 1 and 1 are plotted in Figure 11. The inner parts of the core turn into almost pure in both cases, whereas the outer parts yield mainly and . The lighter helium shell produces large fractions of , , and instead of , which is the dominant product of the heavier shell.
4. Summary and Discussion
We studied the double detonation scenario for Type Ia supernovae by means of 2D and 3D simulations. Starting from the results of 1D stellar evolution simulations, we find that the helium detonation wave is halted at the core-shell interface if the detonation starts in the hottest layer, which in general is located at some altitude above the interface. If the detonation commences at higher altitude, the detonation may transcend into the core. For direct drive to be successful, the helium detonation must involve a critical mass which is sensitive to the density at the core-shell interface. A layer of mixed core-shell material does not facilitate the direct drive. In marginal cases, the detonation transcends the core-shell interface but then fragments, opening up the possibility of incomplete core detonations.
We confirm that the sliding helium detonation induces a mildly supersonic compressional wave inside the core which, if the detonation is set off at a single point in the helium shell, converges to produce an off-center spot that is sufficiently hot and dense to light the core as well. We tested the robustness of this model for non-symmetric initial conditions, considering a series of scenarios in which the helium detonation is started at two points and one scenario in which it is started at three points. We find that the secondary core detonation is quite robust, despite the lack of symmetry. In cases where detonators are widely separated (), the hot spot is produced by reflected waves or waves that have passed through other waves before converging with themselves, rather than the converging primary waves. Only in one extreme case—two antipolar, synchronous detonators in the helium shell of a WD—we find no hot spot and no core ignition.
The generation of a detonation-inducing hot spot is robust even in a completely non-symmetric setup with three asynchronous detonators. Geometric arguments suggest that it is even more robust than a setup with two detonators, where the helium detonation and the core waves converge in an elongated region. As the elongation increases with the smallest possible separation of the detonation fronts, the difference of having one, two or three detonators might be larger at higher resolution. Although we have not run cases with more than three detonators, we expect that the core ignition would not be thwarted by additional detonators. A case with numerous detonators may be similar to a detonation in a spherical shell.
After the helium detonation has converged, the internal waves converge in polar (latitudinal) direction at ever decreasing radii, beginning right beneath the core-shell interface. In addition, the collision of the helium detonation front can drive a jet of hot ash into the core. In any case, this region has high ignition potential. That is, the core may ignite at large radii before the “proper” hot spot forms deeper inside as the wave fronts converge also in the radial direction. The complete convergence of internal waves may only happen in cores that are difficult to ignite.
Our simulations suggest that it is very hard, perhaps impossible under realistic assumptions, to initiate a helium detonation at densities (as observed in plane-parallel geometry by Townsley et al. 2012). On the other hand, the yields from WDs with thin helium shells are most compatible with observed Type Ia supernovae. Detonations in the helium are more easily started in an extended sheet rather than a point. Our simulations indicate that the size of such a sheet would have to be at least on the order of the size of a convective cell in the helium shell of a quasi-stationary WD. Whether detonation seeds of this kind are realistic can ultimately be answered only by suitable 3D convection simulations. Alternatively, a sufficiently large region may reach the conditions for helium detonations in the context of double-degenerate mergers (which are not directly considered in this work), by the interaction of an accretion stream with previously accreted helium (Guillochon et al., 2010) or during the merger itself (Raskin et al., 2012).
References
- Almgren et al. (2010) Almgren, A. S., Beckner, V. E., Bell, J. B., Day, M. S., Howell, L. H., Joggerst, C. C., Lijewski, M. J., Nonaka, A., Singer, M., & Zingale, M. 2010, ApJ, 715, 1221
- Benz (1997) Benz, W. 1997, in NATO ASIC Proc. 486: Thermonuclear Supernovae, ed. P. Ruiz-Lapuente, R. Canal, & J. Isern, 457
- Bildsten et al. (2007) Bildsten, L., Shen, K. J., Weinberg, N. N., & Nelemans, G. 2007, ApJ, 662, L95
- Brouillette (2002) Brouillette, M. 2002, Annual Review of Fluid Mechanics, 34, 445
- Dgani & Livio (1990) Dgani, R. & Livio, M. 1990, ApJ, 361, 540
- Fink et al. (2007) Fink, M., Hillebrandt, W., & Röpke, F. K. 2007, A&A, 476, 1133
- Fink et al. (2010) Fink, M., Röpke, F. K., Hillebrandt, W., Seitenzahl, I. R., Sim, S. A., & Kromer, M. 2010, A&A, 514, A53
- García-Senz et al. (1999) García-Senz, D., Bravo, E., & Woosley, S. E. 1999, A&A, 349, 177
- Guillochon et al. (2010) Guillochon, J., Dan, M., Ramirez-Ruiz, E., & Rosswog, S. 2010, ApJ, 709, L64
- Holcomb et al. (2013) Holcomb, C., Guillochon, J., De Colle, F., & Ramirez-Ruiz, E. 2013, arXiv:1302.6235 [astro-ph.HE]
- Livne (1990) Livne, E. 1990, ApJ, 354, L53
- Livne & Arnett (1995) Livne, E. & Arnett, D. 1995, ApJ, 452, 62
- Livne & Glasner (1990) Livne, E. & Glasner, A. S. 1990, ApJ, 361, 244
- Livne & Glasner (1991) —. 1991, ApJ, 370, 272
- Niemeyer & Woosley (1997) Niemeyer, J. C. & Woosley, S. E. 1997, ApJ, 475, 740
- Raskin et al. (2012) Raskin, C., Scannapieco, E., Fryer, C., Rockefeller, G., & Timmes, F. X. 2012, ApJ, 746, 62
- Röpke et al. (2007) Röpke, F. K., Woosley, S. E., & Hillebrandt, W. 2007, ApJ, 660, 1344
- Seitenzahl et al. (2009) Seitenzahl, I. R., Meakin, C. A., Townsley, D. M., Lamb, D. Q., & Truran, J. W. 2009, ApJ, 696, 515
- Shen & Bildsten (2013) Shen, K. J. & Bildsten, L. 2013, arXiv:1305.6925 [astro-ph.HE]
- Sim et al. (2012) Sim, S. A., Fink, M., Kromer, M., Röpke, F. K., Ruiter, A. J., & Hillebrandt, W. 2012, MNRAS, 420, 3003
- Taam (1980) Taam, R. E. 1980, ApJ, 237, 142
- Timmes & Arnett (1999) Timmes, F. X. & Arnett, D. 1999, ApJS, 125, 277
- Timmes et al. (2000) Timmes, F. X., Hoffman, R. D., & Woosley, S. E. 2000, ApJS, 129, 377
- Timmes & Swesty (2000) Timmes, F. X. & Swesty, F. D. 2000, ApJS, 126, 501
- Townsley et al. (2012) Townsley, D. M., Moore, K., & Bildsten, L. 2012, arXiv:1205.6517v1 [astro-ph.SR]
- Weaver et al. (1978) Weaver, T. A., Zimmerman, G. B., & Woosley, S. E. 1978, ApJ, 225, 1021
- Woosley & Heger (2007) Woosley, S. E. & Heger, A. 2007, Phys. Rep., 442, 269
- Woosley et al. (2002) Woosley, S. E., Heger, A., & Weaver, T. A. 2002, Reviews of Modern Physics, 74, 1015
- Woosley & Kasen (2011) Woosley, S. E. & Kasen, D. 2011, ApJ, 734, 38
- Woosley & Weaver (1994) Woosley, S. E. & Weaver, T. A. 1994, ApJ, 423, 371
- Zhang et al. (2011) Zhang, W., Howell, L., Almgren, A., Burrows, A., & Bell, J. 2011, ApJS, 196, 20

