Vorticity moments in four numerical simulations
of the Navier-Stokes equations
D. Donzis
1Department of Aerospace Engineering, Texas A&M University,College Station, Texas, TX 77840, USA
J. D. Gibbon
Department of Mathematics, Imperial College London, London SW7 2AZ, UK
A. Gupta
Department of Physics, Indian Institute of Science, Bangalore 560 012, India
R. M. Kerr
Department of Mathematics, University of Warwick, Coventry CV4 7AL, UK
R. Pandit
Department of Physics, Indian Institute of Science, Bangalore 560 012, India
and
Jawaharlal Nehru Centre for Advanced Scientific Research, Bangalore, India
D. Vincenzi
CNRS, Laboratoire Jean-Alexandre Dieudonné,
Université de Nice Sophia Antipolis, Nice 06050, France
Abstract
The issue of intermittency in numerical solutions of the Navier-Stokes equations on a periodic box is addressed through four sets of numerical simulations that calculate a new set of variables defined by for where and with . All four simulations unexpectedly show that the are ordered for such that . Moreover, the squeeze together such that as increases. The first simulation is of very anisotropic decaying turbulence ; the second and third are of decaying isotropic turbulence from random initial conditions and forced isotropic turbulence at constant Grashof number respectively ; the fourth is of very high Reynolds number forced, stationary, isotropic turbulence at up to resolutions of .
I Introduction
I.1 Background
Intermittency in both the vorticity and strain fields is a dominant feature of developing and developed turbulence. It has been studied extensively both experimentally (Sreenivasan 1985, Meneveau and Sreenivasan 1991) and numerically (Kerr 1985, Jimenez, Wray, Saffman and Rogallo 1993, Donzis, Yeung and Sreenivasan 2008, Ishihara, Gotoh and Kaneda 2009, Donzis and Yeung 2010, Donzis, Sreenivasan and Yeung 2012, Yeung, Donzis and Sreenivasan 2012). Statistical physicists generally use velocity structure functions to study this phenomenon and have diagnosed the degree of intermittency by how much the velocity structure function exponents differ from linear when (Frisch 1995, Schumacher, Yakhot and Sreenivasan 2007, Boffetta, Mazzino and Vulpiani 2008, Pandit, Perlekar and Ray 2009). The standard way to quantify equal-time, multi-scaling exponents is a challenging numerical task (Arneodo et al. 2008, Ray, Mitra and Pandit 2008, Ray, Mitra, Perlekar and Pandit 2011). The multi-scaling approach is even more challenging for the 3D Navier-Stokes equations
| (1) |
because the velocity field and pressure evolve in time, so, in general, time-dependent structure functions must be used to study dynamic multi-scaling (Ray, Mitra and Pandit 2008, Ray, Mitra, Perlekar and Pandit 2011). This paper will introduce an analysis of some new and existing numerical computations that gives new insights into and provides a new method for distinguishing alternative regimes of behaviour in the vorticity field. To explain the nature of these regimes, let us consider the vorticity field on a finite periodic domain within the setting of the volume integrals which define a set of frequencies
| (2) |
Some recent work has centred around a dimensionless re-scaling of the such that (Gibbon 2010, 2011, 2012a,b)
| (3) |
where is a fixed frequency defined by . The origin of this re-scaling, valid for both the Navier-Stokes and Euler equations, has been explained elsewhere (Gibbon 2011, 2012a,b) where it has been shown that, with additive -forcing, weak solutions obey the time average up to time
| (4) |
The first in the hierarchy, , is proportional to the global enstrophy and may be insensitive to deep fine-scale fluctuations. The higher may be more sensitive so their measurement over a wide range of could be a useful diagnostic of intermittency. However, the end of the sequence, , is hard to measure numerically, especially in highly intermittent flows. While Hölder’s inequality enforces a natural ordering on the frequencies such that for , no such natural ordering is enforced on the because the decrease with . Thus there are two possible regimes :
| (5) |
The issues to be addressed in this paper in our four numerical simulations of the Navier-Stokes equations are :
-
1.
Which of these regimes is favoured or is there an oscillation between them? If one regime is favoured, are the well separated? What is the role of the enstrophy ?
-
2.
Are these processes -dependent?
-
3.
Are they -dependent?
-
4.
Are they dependent upon initial conditions?
I.2 Simulations used for tests
An important point with respect to numerical simulations of the scaled higher order moments is that their ratios might converge better than their actual values. This is consistent with the results reported in Yeung et al. (2012) and Donzis et al. (2012) where convergence for the ratios of higher-order vorticity and dissipation (strain) moments were obtained, even when the statistics of the individual moments showed no evidence of convergence (Kerr 2012a). This answered a problem first raised in Kerr (1985) where it was noted that in forced simulations at modestly high Reynolds numbers, the averages of the vorticity and strain moments above 6-th order did not converge. The determination of the in simulations is not difficult whereas, in contrast, traditional numerical tools such as higher-order structure functions require a combination of larger domains and finer resolution than is currently feasible. This paper will calculate and compare the from four data sets : two where the average kinetic energy decays in time, and two where is held approximately constant by forcing at the low wavenumbers. The first is a unique data set from a computation in which fully-developed turbulence forms from the interaction of two anti-parallel vortices and whose kinetic energy decays strongly after the first peak in the normalised enstrophy production . Because this calculation has not been fully described before, some introductory discussion is provided at the start of that section (§II). The other three data sets represent more traditional decaying and forced homogeneous, isotropic numerical turbulence. In the decaying calculations in §II and the decaying and forced calculations in §III the moments have been determined relatively continuously in time which makes a helpful comparison with the results of §I. For the fourth data () set of §IV (Yeung et al. 2012, Donzis et al. 2012), a similar conclusion is reached by studying the dependence of the average value of on the Reynolds number.
An advantage of the first data set described in §II is that the predicted convergence properties of ratios of the can be tested for a calculation with huge fluctuations in the production of enstrophy, and therefore in the higher . That the calculation eventually exhibits traditional turbulent statistics and spectra is a bonus in justifying its use. However, this new initial condition is very specialized and any trends need to be confirmed using a more traditional decaying homogeneous, isotropic data set, which is the purpose of the second calculation discussed in §III. §III also contains forced simulations of homogeneous and isotropic turbulence at constant Grashof number. Finally, the fourth calculation in §IV provides validation from a forced, massively parallel, pseudo-spectral calculation ( with ) calculation to show that these trends are not restricted to low or moderate Reynolds numbers. Assessing the scaling of moments of intermittent quantities such as vorticity, strain rates or velocity gradients has been a critical component of characterizing and understanding intermittency. Of particular interest is how these moments scale with the Reynolds number, which is typically high in applications. At the same time, different orders provide information about fluctuations of different intensities. Low and high-order moments, for example, are associated with weak and strong fluctuations. Thus, the understanding of the scaling of the moments , especially at high , can also shed light on the nature of intermittency and the most extreme events in turbulence.
I.3 A summary of results
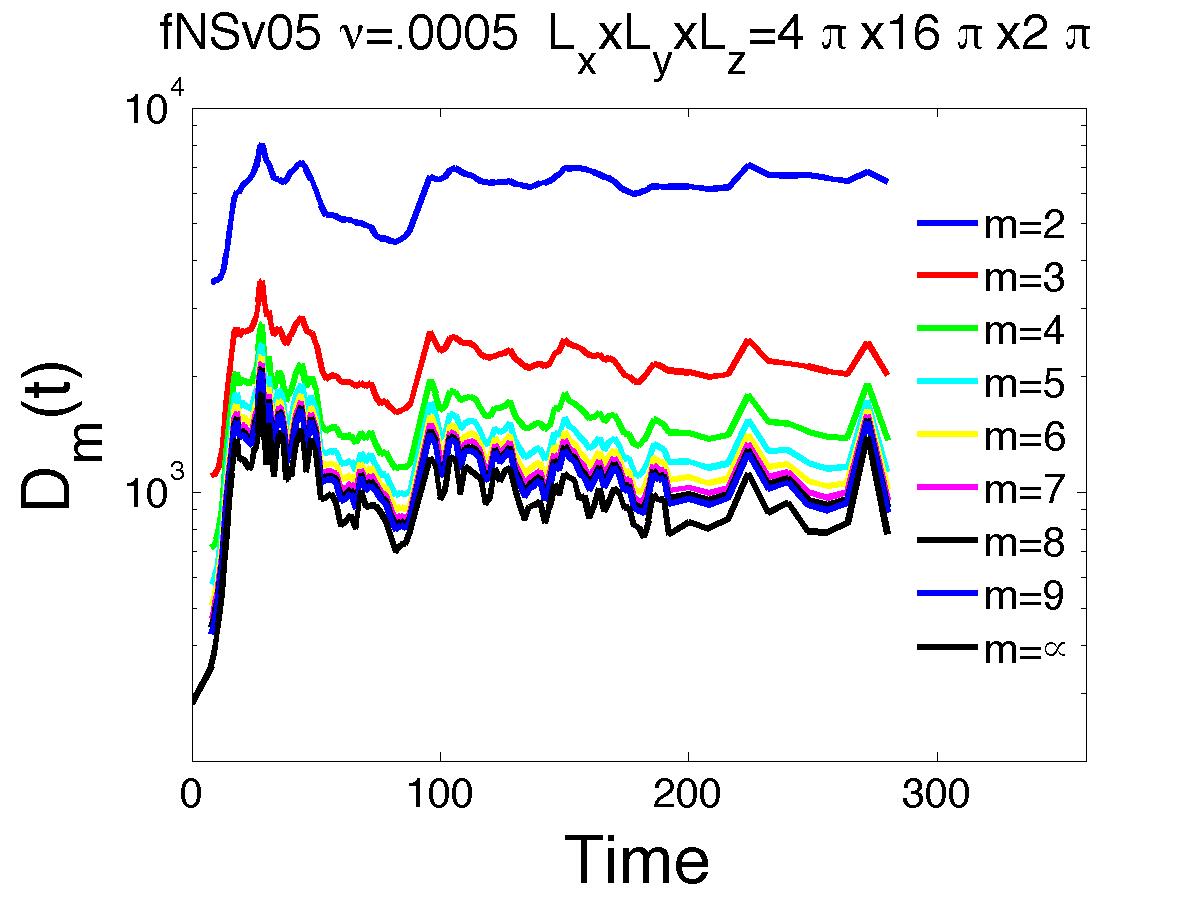
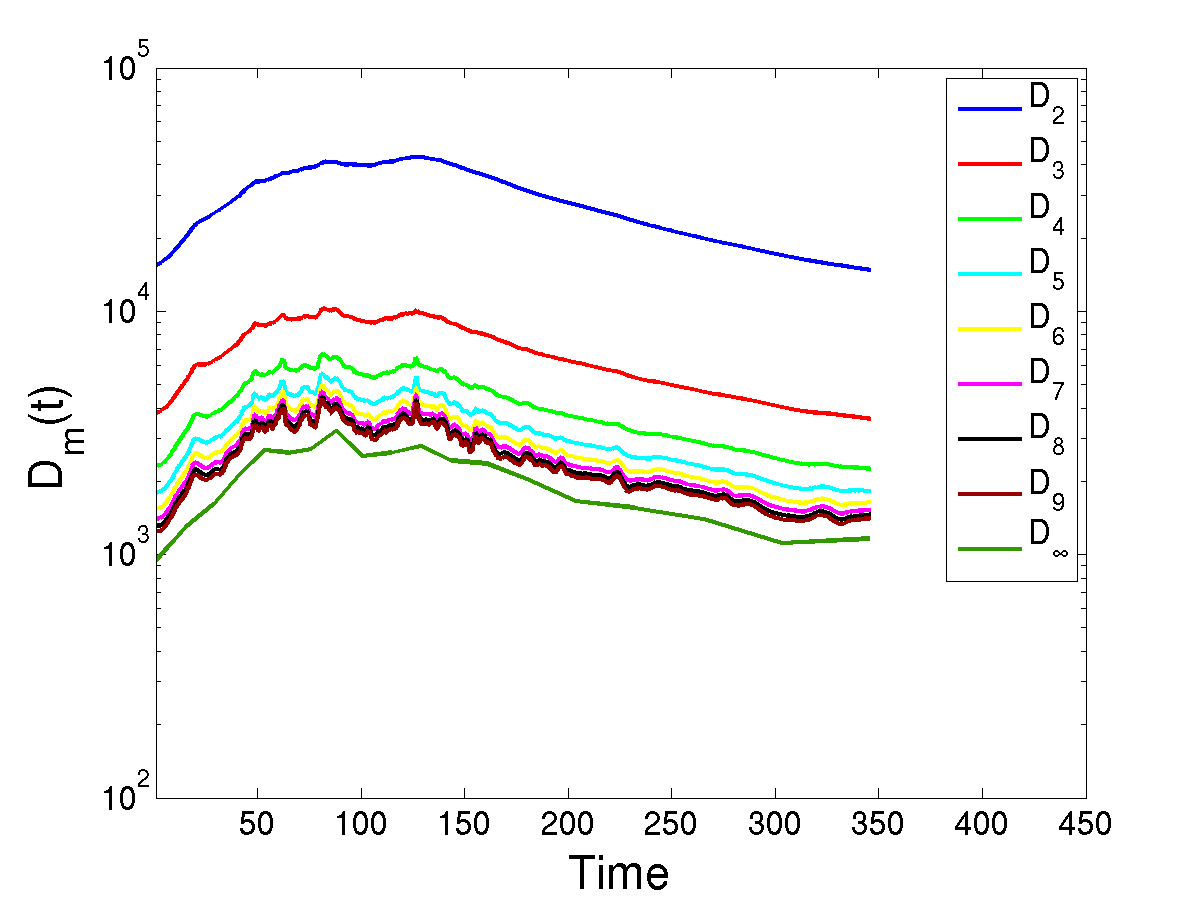
The simulations described in §II, §III and §IV, and illustrated in Figs. 1, 2 and 5, each observe that a strict ordering of the occurs, as in regime I ; namely (on log-linear plots). To assess the significance of this, we write down the relation in terms of and use Hölder’s inequality on the extreme left hand side
| (6) |
As , , and so (6) shows that . Thus, in regime I the must be squeezed together for high . In terms of the (6) is written as
| (7) |
While respecting the ordering , is squeezed up close to as
| (8) |
This squeezing phemonenon is observed in all four data sets where the -curves lie very close for as in Figs. 1, 2 and 5. Moreover, the values of in all four simulations lie far above the rest of the giving rise to a suggestion, explored in §V, that a depletion of nonlinearity is occurring which could be the cause of Navier-Stokes regularity. The most extreme intermittent events are represented by moments at increasingly large . Our results suggest the saturation of these high order moments. This is significant as it constrains the shape of the tails of the PDF of vorticity which has been the focus of intense investigations (Kerr 1985, Jimenez et al. 1993, Donzis et al. 2008, Ishihara et al. 2009, Donzis and Yeung 2010, Yeung et al. 2012, Donzis et al. 2012). The fourth data set (forced, stationary, isotropic turbulence), the results of which are displayed in §IV, furnishes us with the opportunity to compare these results with other results on intermittency available in the literature. For example, within the multifractal model, Nelkin (1990) found that normalized moments of velocity gradients scale as
| (9) |
where is obtained from the multifractal spectrum and is the usual notation for the statistical average. Using the well-known result due to the dissipative anomaly, it is readily shown that . Our interest lies in the limit where it can be shown that . The constant is given by with representing the limit of the generalized dimensions (Nelkin 1990, Hentschel and Procaccia 1983). Clearly moments of the form saturate at high , consistent with (8). While experimentally it is difficult to measure reliably, its value appears to be smaller than 1.0 (Meneveau and Sreenivasan 1991). The ratio of successive orders is
| (10) |
The limiting behavior of shows that , and therefore the ratio on the left hand side of (10) tends to a constant independent of and . This is consistent with the squeezing together of the and .
II The first set of simulations
The new vortex reconnection calculation displayed in this section addresses the following long-standing numerical question : Can an initial condition with only a few vortices generate and sustain fully-developed turbulence through reconnection events in a manner similar to how turbulence forms in aircraft wakes or when anti-parallel quantum vortex lines reconnect numerically (Kerr 2011)? Because this initial condition has not been fully explained before, some of its unique features are now described. The three directions in the flow are : (i) each initial vortex primarily points in the -direction ; (ii) separation between the vortices lies in the -direction ; (iii) they propagate in the -direction. Due to the anisotropy of the flow, an anisotropic mesh and domain are used with a domain and a mesh, plus symmetries used in the and directions.
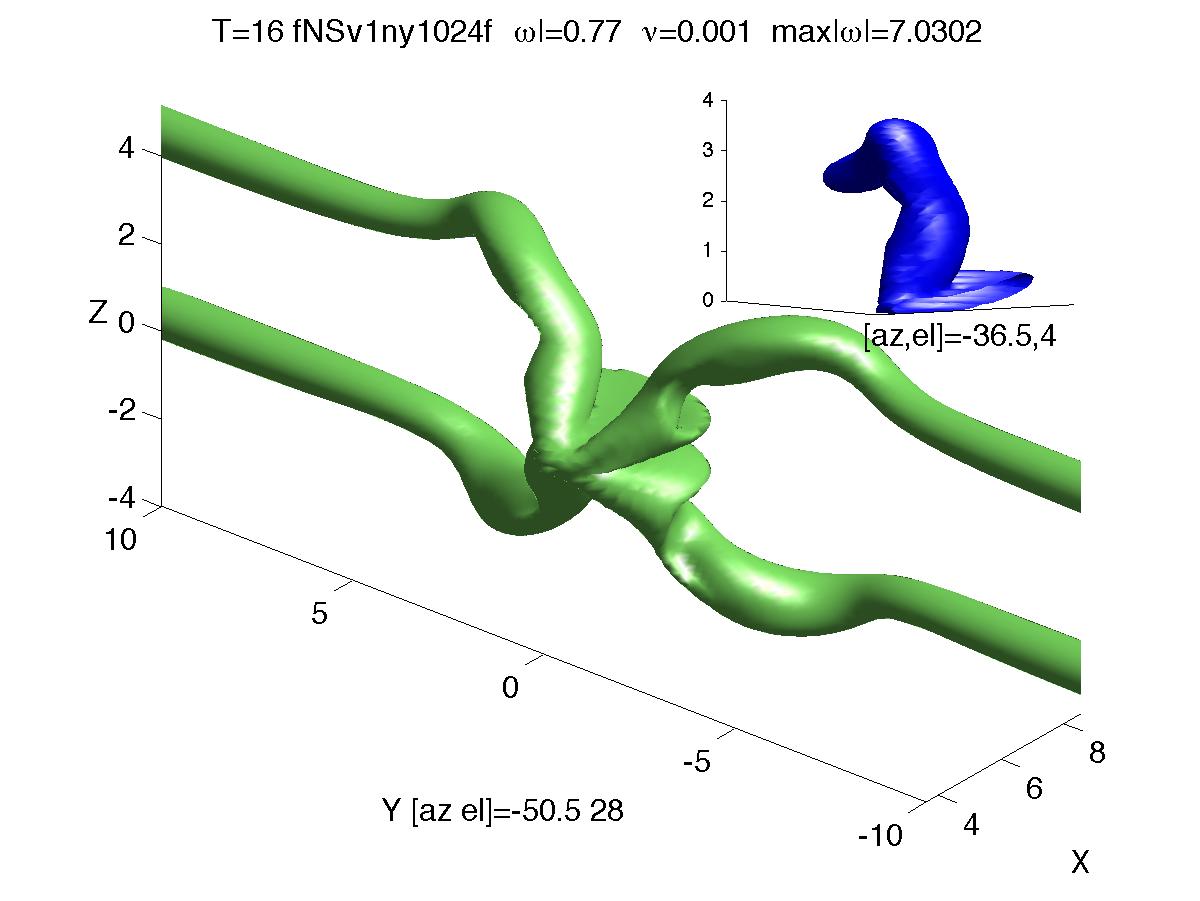
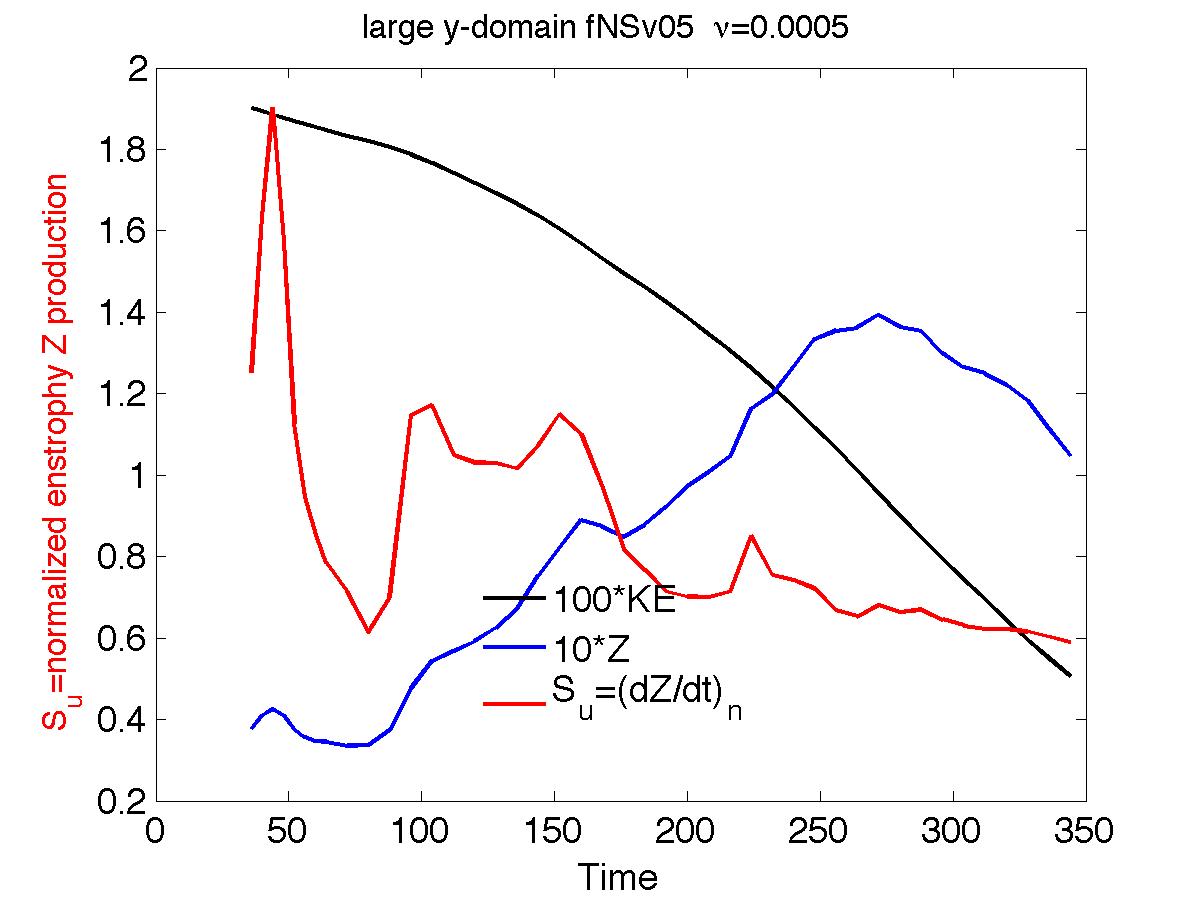
The quantum vortex work in Kerr (2011) has shown that the two most important properties are that their initial perturbations need to be localized far from the periodic boundaries and their initial profile and direction should be balanced so that they are neither internally unstable nor prone to the shedding of waves or vortex sheets. The method grew from addressing calculations identified by Bustamante and Kerr (2008), where a single sign of the initial local vorticity had not been imposed rigorously. To accomplish these goals, the following four changes have been made to the initial condition in Bustamante and Kerr (2008) : i) The perturbation is strongly localised near the symmetry plane using the trajectory given in Kerr (2011) ; ii) The initial vorticity profile uses the solution of a two-dimensional vortex with a smoothed core ; iii) The direction of vorticity chosen at grid points follows the path of the nearest point in space on the prescribed trajectory of the central vortex line ; iv) The vortices need to be twice as long as in any previous anti-parallel study. Fig. 1 (left) shows the vorticity as the initial instability saturates. By using these choices, regions of negative vorticity and vortex sheets on the plane, as described by Bustamante and Kerr (2008), are eliminated.
The ultimate goal is to generate turbulence with a persistent -5/3 energy spectrum and additional turbulent statistics, including the experimental velocity derivative skewness , which is equivalent to the numerical normalized enstrophy production. The latest infinite -estimates of from forced turbulence calculations (Ishihara et al. 2009) find , consistent with experimental values of . Early numerical calculations showed that the tended to overshoot the early experimental values of before settling to the expected value (Orszag and Patterson 1972). The second panel of Fig. 1 confirms this trend for the anti-parallel calculation with first rising to at , then falling abruptly to at , continuing to fluctuate strongly between 0.6 and 1.2 for , and finally decaying to . The full details, plus the relationship between the variations in in Fig. 1 and the development of swirling, turbulent vortex rings, is the topic of another paper (Kerr 2012b).
In Fig. 1, note that for all times, all of the lower order () bound each higher-order (on a log-scale) which can be expressed as , thus favouring regime I as in (5). The enstrophy lies far above all of the other curves and has been omitted. Next note a strong increase in the growth of each of the , including , up until . This is the period when this calculation has nearly Euler dynamics, where the effects of viscosity compared to nonlinear growth are minimal. The growth of the in true Euler dynamics is the topic of another paper (Kerr 2012c).
III The second and third set of simulations : DNS results for homogeneous, isotropic turbulence
Data from two direct numerical simulations (DNSs) of homogeneous, isotropic 3D Navier-Stokes turbulence is now presented. Both of these simulations use a pseudospectral method, a -rule for de-aliasing, and collocation points on a domain.
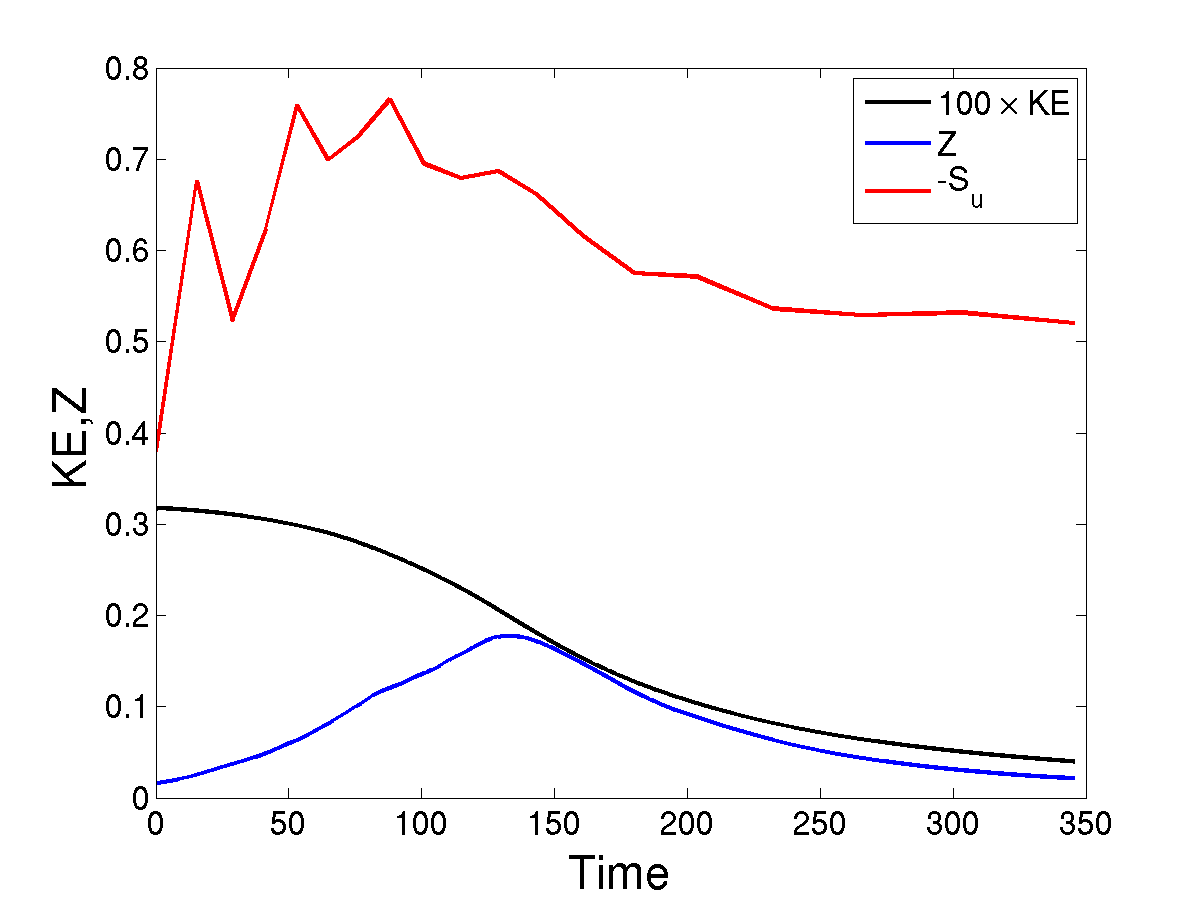
The first DNS is of decaying turbulence which reaches a Taylor-microscale Reynolds number at the main peak of the enstrophy associated with the formation of the inertial sub-range. The Taylor-microscale is defined in the usual way in terms of the energy spectrum . The initial Fourier components of the velocity for the wave-vector are generated by applying random phases to the energy spectrum . The second DNS is a study of statistically steady turbulence which attains ; the forcing term is specified most simply in terms of whose spatial Fourier components are :
| (11) |
where is the Heaviside function and is the wave number above which Fourier modes are not forced. This forcing term maintains a constant Grashof number : for a similar forcing term that holds the energy injection fixed see Sahoo, Perlekar and Pandit (2011).
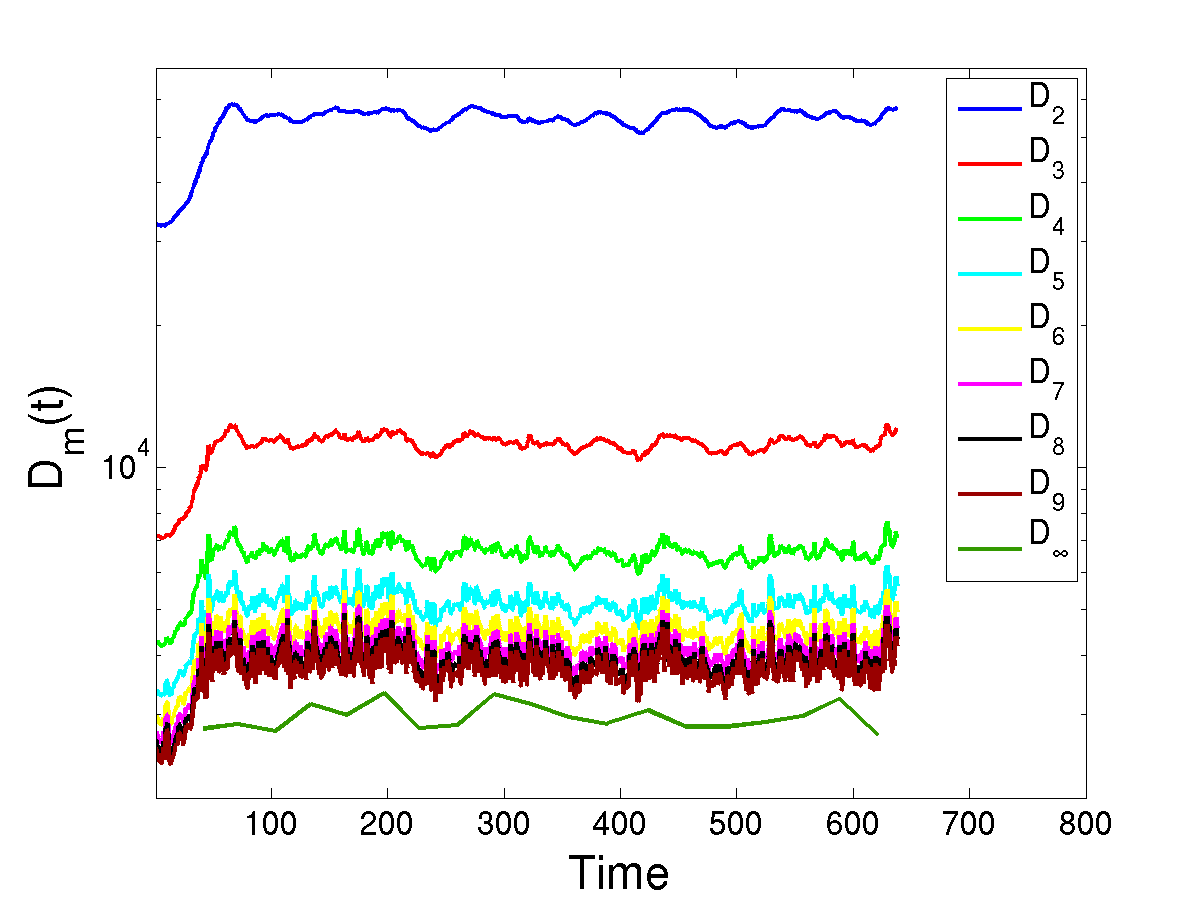
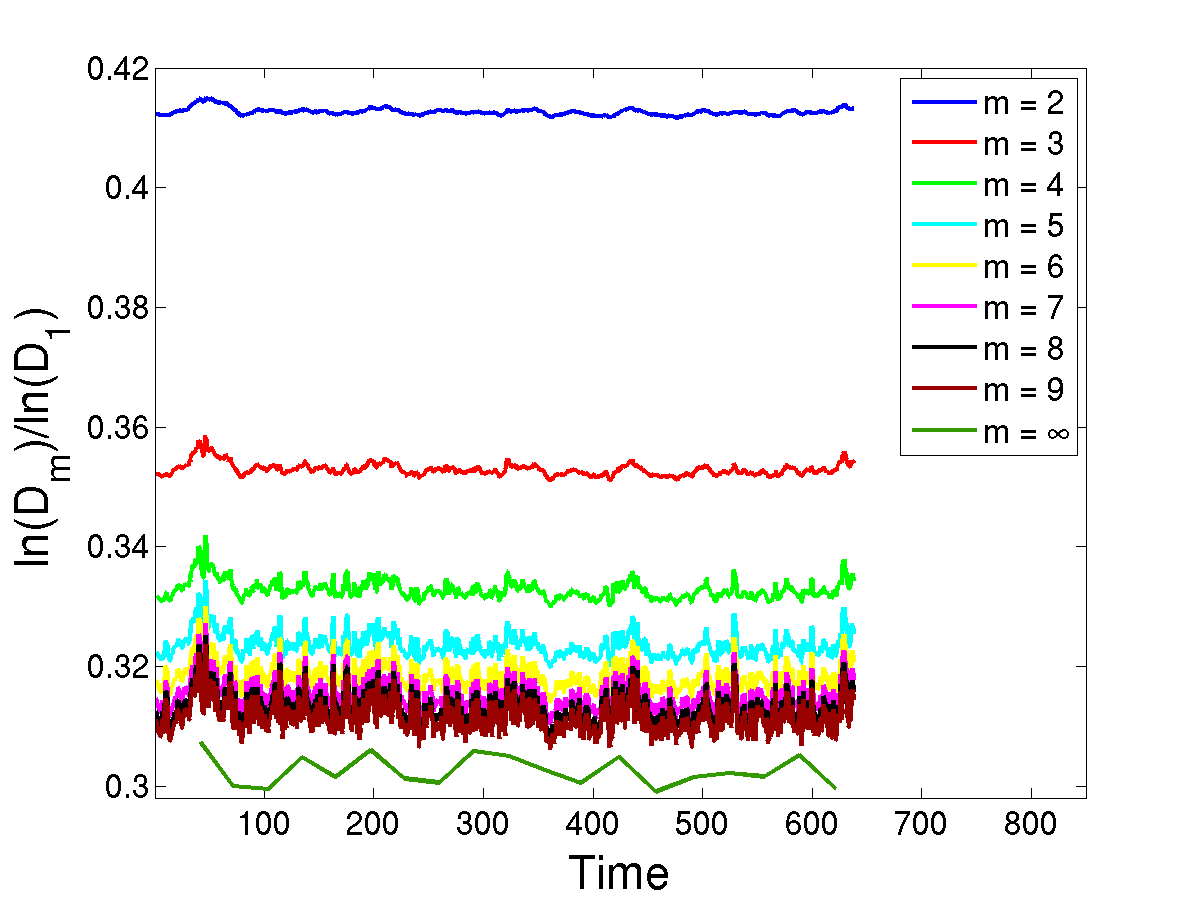
For the decaying DNS, a small inertial subrange forms at when the enstrophy reaches its main peak. Assuming , the pre-factor is roughly 1.5 for about half a decade of wavenumbers. Similar to Fig. 1 (second panel), Fig. 2 (first panel) shows the time-dependence of the kinetic energy , enstrophy and its skewness . The second and third panels in Fig. 2 show versus time for and with for both the decaying and forced DNS calculations respectively. The second and third panels also show that and thus demonstrate the generality of Fig. 1 of §II.
IV The fourth set of simulations : forced stationary isotropic turbulence
The DNS data in this fourth set of simulations were obtained using a massively parallel pseudo-spectral code which achieves excellent performance on processors. The basic numerical scheme is that of Rogallo (1981). The time stepping is second-order Runge-Kutta and the viscous term is exactly treated via an integrating factor. Aliasing errors are carefully controlled by a combination of truncation and phase shifting techniques. The database includes simulations with resolutions up to and Taylor-Reynolds number up to (Donzis et al. 2012, Yeung et al. 2012). In order to maintain a stationary state, turbulence is forced numerically at the large scales. Since our objective is to assess the generality of the ordering of the moments , here, we show results using the stochastic forcing of Eswaran and Pope (1988) – denoted as EP – as well as a deterministic scheme described in Donzis and Yeung (2010) – denoted as FEK. In essence, this keeps the energy in the lowest wavenumbers fixed. For these two forcing schemes, the wavenumbers affected by forcing are confined to within a sphere , where is of order 2 or 3. In order to capture intense events, which are the main contributors to high-order moments, resolution issues have to be properly addressed. Motivated by the theoretical work of Yakhot and Sreenivasan (2004), resolution effects have been studied in Donzis (2012), and Yeung et al. (2012) with the conclusion that although high-order moments may be under-predicted using the standard resolution criterion – typically in simulations aimed at pushing up the Reynolds number – ratios of high-order moments are weakly affected by resolution issues. Small-scale resolution for a spectral simulation is typically quantified with the paramater where is the highest resolvable wavenumber in a domain of size with grid points. While the standard resolution is takes values between 1 and 2, results are presented from to , when available, which allows us to assess the effect of insufficient resolution. The Table in Fig. 4 summarizes those parameters of the DNS databased that have been used.
| Forcing | |||
|---|---|---|---|
| 256 | 140 | 1.4 | EP |
| 256 | 140 | 1.4 | FEK |
| 512 | 140 | 2.7 | FEK |
| 2048 | 140 | 11.2 | FEK |
| 512 | 240 | 1.4 | FEK |
| 2048 | 240 | 5.1 | FEK |
| 1024 | 400 | 1.4 | FEK |
| 2048 | 400 | 2.8 | EP |
| 2048 | 650 | 1.4 | EP |
| 4096 | 650 | 2.7 | FEK |
| 4096 | 1000 | 1.3 | FEK |

IV.1 The –moments in forced stationary isotropic turbulence


Even moments of vorticity are shown in Fig. 4. As assured by Hölder’s inequality it can be seen that at all Reynolds numbers. The figure also shows the line (dashed), which is the result of the dissipative anomaly. This is easily obtained from the kinematic relation associated with isotropic turbulence and the well-known scaling . It can then be shown that , where the well-known result has been used. The DNS data in Fig. 4 agree with this scaling. As mentioned above, some resolution effects can be expected especially for high orders. Where data at nominally the same Reynolds number but different resolution is available, moments tend to be higher for higher values of (Donzis et al. 2008). This is clearer at higher Reynolds number ( where two resolutions are available). Ratios of moments, however, are only weakly affected by resolution, which is also consistent with more recent results (Donzis et al. 2012, Yeung et al. 2012). In Fig. 5 the moments are shown as a function of . For , one can again resort to using the dissipative anomaly with the definition . The result is
| (12) |
which is seen in Fig. 5 (first panel). To see further details of higher order moments the second panel in Fig. 5 does not include . As in §II and §III, the data clearly shows the ordering . The insensitive nature of moments to the type of forcing and the much weaker effect of resolution compared with in Fig. 4 is also noted. The data also suggest that the ratio between successive moments decreases with , which is consistent with the asymptotic behaviour of equation (8). This is more clearly seen in Fig. 5 (third panel) where the ratio of successive moments is plotted for different values of . Consistent with an ordering , the ratio is always less than unity. As increases, however, this ratio becomes increasingly closer to unity in agreement with Eq. 8. It is also interesting that these ratios appear to be independent of Reynolds numbers which suggest a regime I ordering with clustering of moments at high also in the high- limit. Resolution effects, while weak, can still be seen upon careful examination of the data, especially at high orders. However, for a given simulation, the ordering of regime I is unchanged with resolution.
V Concluding remarks : the depletion of nonlinearity
The recent introduction of the -vorticity-moment-scaling (Gibbon 2011, 2012a,b), motivated by the time average (4), has suggested that they should be calculated through different numerical simulations. All four dats sets unexpectedly show that the obey the ordering of regime I, namely . This leads to the squeezing effect of (8) taking place such that and as increases, which has an effect on the shapes of the PDF-tails, as remarked in §I.3. The ordering in the is strict although for the plots almost touch and replicate each other in shape as in Figs. 1, 2 and 5 even during intense events. It might be asked whether this is a viscous effect, or a strictly nonlinear effect, or the result of some surprising symbiosis between the two? Using a variation of the anti-parallel initial condition used in §II, new Euler calculations have repeated this observed ordering (Kerr 2012c), which implicates the nonlinear terms as the source. However, there is no evidence from Navier-Stokes analysis that such an ordering should hold, although no results exist that suggest it cannot. It is, of course, possible that a cross-over could occur between regimes I and II at Reynolds numbers higher than have been achieved in this work.
Significantly sits well above the other and does not appear to converge with them during the most intense periods : in Figs. 1, 2 and 5 lies on a log-scale with omitted. We are therefore justified in writing
| (13) |
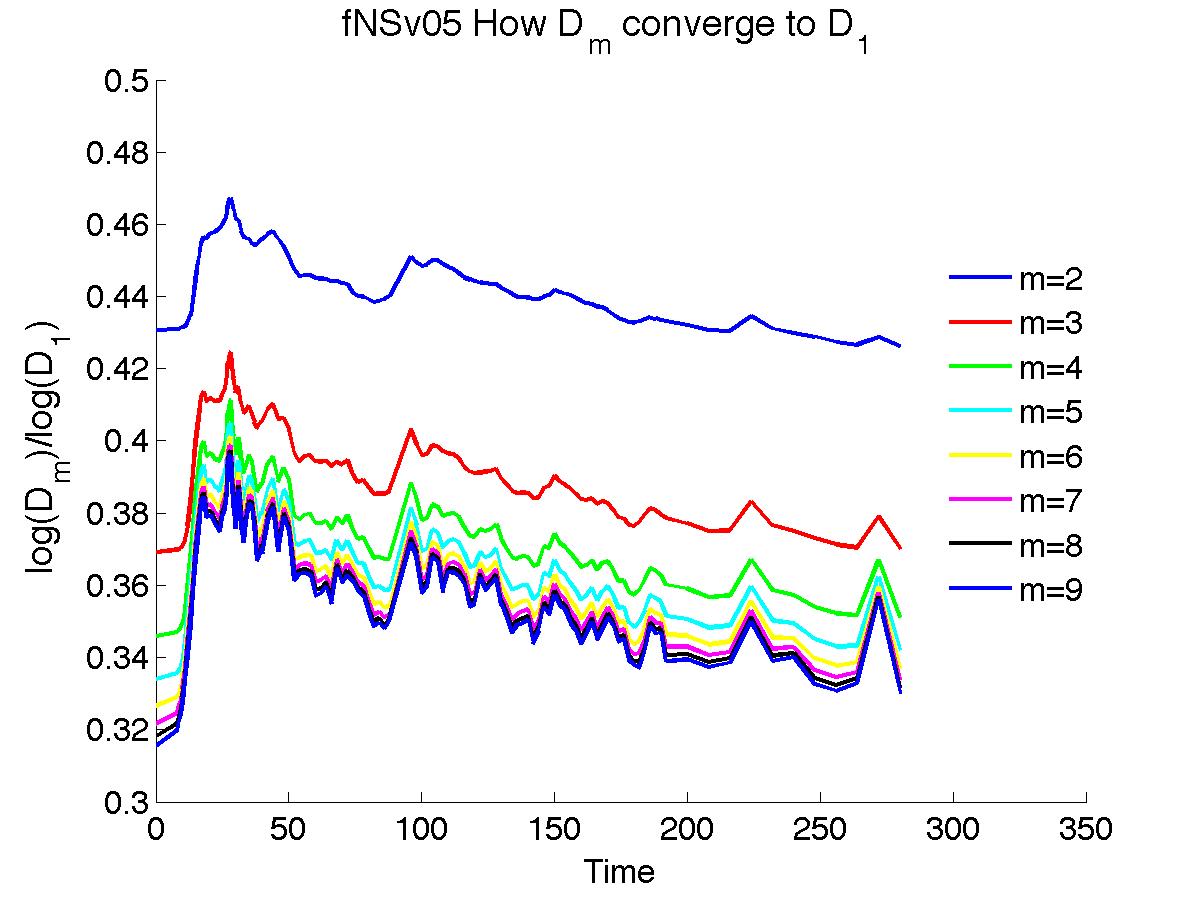
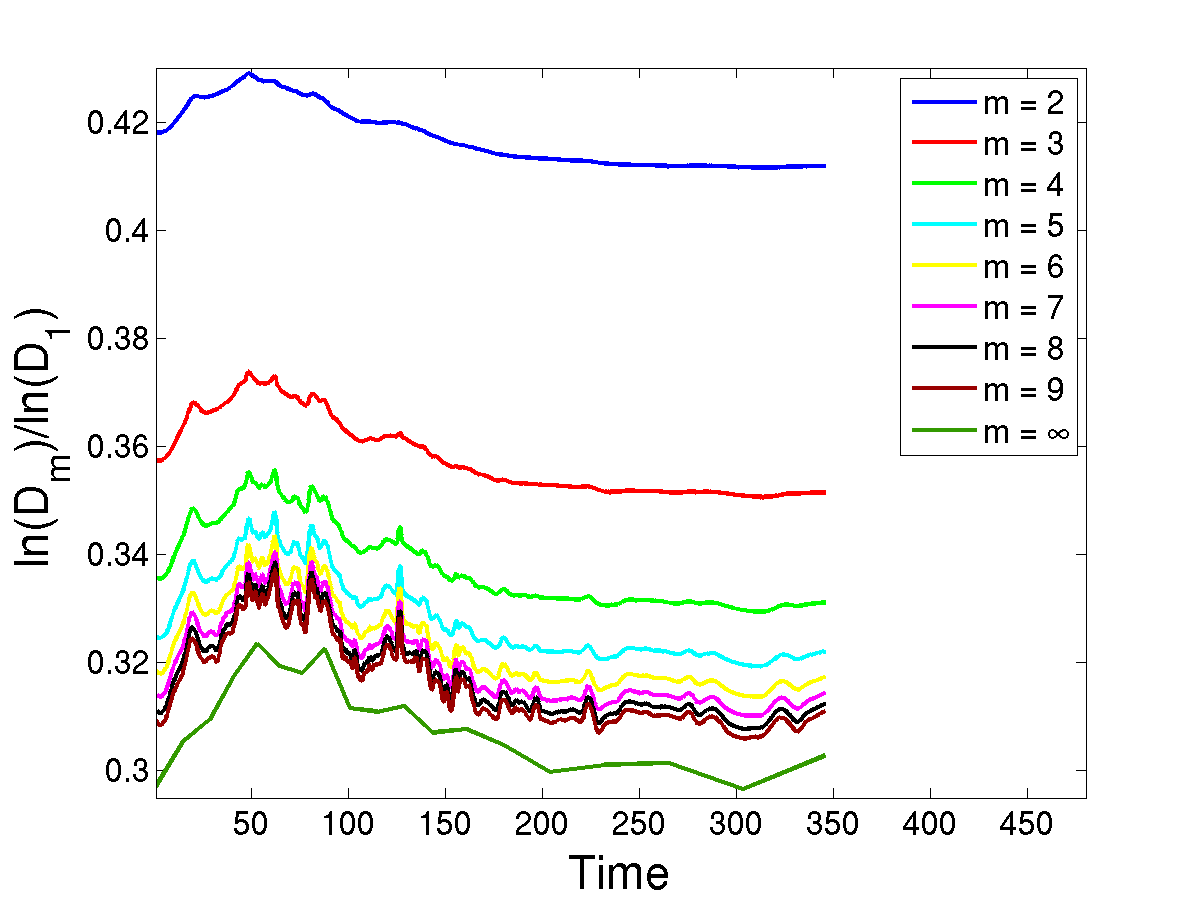
Plots of for the first and second pair of simulations are shown in Fig. 6. Assuming a solution exists, the have been shown to obey (see Gibbon 2012a)
| (14) |
where the within and are algebraically increasing with . By dropping the negative term on the right hand side of (14), and replacing the -term with justified by (13), a time integration produces
| (15) |
Fig. 6 shows that while there is a weak dependence of on both and , it nevertheless satisfies in all cases. Because Leray’s energy inequality insists that it is clear that the right hand side of (15) is finite : any finite is sufficient for Navier-Stokes regularity. This regularization can thus be traced to the depletion of nonlinearity in (13) in regime I. Although regime II has not been observed, (14) shows that it is associated with time-decay of the . Specifically, if then where for large .
Acknowledgements : DD acknowledges the computing resources provided by the NSF-supported XSEDE and DOE INCITE programs under whose auspices some of these calculations were performed. RP and DV are members of the International Collaboration for Turbulence Research (ICTR). They acknowledge support from the “Indo-French Center for Applied Mathematics”, UMI IFCAM – Bangalore and, with RMK, the EU COST Action program MP0806 “Particles in Turbulence”. AG and RP thank DST, CSIR and UGC (India) and the SERC (IISC) for computational resources. JDG and RMK thank the Isaac Newton Institute, Cambridge, on whose programme Topological dynamics in the Physical and Biological sciences (2012) part of this work was carried out.
References
- (1) Arneodo, A., Benzi, R., Berg, J., Biferale, L., Bodenschatz, E., Busse, A., Calzavarini, E., Castaing, B., Cencini, M., Chevillard, L., Fisher, R. T., Grauer, R., Homann, H., Lamb, D., Lanotte, A. S., Leveque, E., Luethi, B., Mann, J., Mordant, N., Mueller, W.-C., Ott, S., Ouellette, N. T., Pinton, J.-F., Pope, S. B. Roux, S. G. Toschi, F. Xu, H. and Yeung, P.K. 2008 Universal Intermittent Properties of Particle Trajectories in Highly Turbulent Flows. Phys. Rev. Lett. 100, 254504.
- (2) Betchov, R. 1956 An inequality concerning the production of vorticity in isotropic turbulence. J. Fluid Mech. 1, 497–504.
- (3) Boffetta, G., Mazzino, A. and Vulpiani, A. 2008 Twenty-five years of multifractals in fully developed turbulence : a tribute to Giovanni Paladin. J. Phys. A: Math. Theor. 41, 363001.
- (4) Bustamante, M. D. and Kerr, R. M. 2008 3D Euler about a 2D symmetry plane. Physica D 237, 1912–1920.
- (5) Donzis, D., Yeung, P. K. and Sreenivasan, K. 2008 Dissipation and enstrophy in isotropic turbulence : scaling and resolution effects in direct numerical simulations. Phys. Fluids 20, 045108.
- (6) Donzis, D. and Yeung, P. K. 2010 Resolution effects and scaling in numerical simulations of passive scalar mixing in turbulence. Physica D 239, 1278–1287.
- (7) Donzis, D., Sreenivasan, K. and Yeung, P. K. 2012 Some results on the Reynolds number scaling of pressure statistics in isotropic turbulence. Physica D 241, 164–168.
- (8) Eswaran, V. and Pope, S. B. 1988 An examination of forcing in direct numerical simulations of turbulence. Comput. Fluids 16, 257–278.
- (9) Frisch, U. 1995 Turbulence : the legacy of A. N. Kolmogorov, Cambridge University Press, Cambridge.
- (10) Gibbon, J. D. 2010 Regularity and singularity in solutions of the three-dimensional Navier-Stokes equations Proc. Royal Soc A 466 2587–2604.
- (11) Gibbon, J. D. 20011 A hierarchy of length scales for weak solutions of the three-dimensional Navier-Stokes equations. Comm Math. Sci. 10, 131–136.
- (12) Gibbon, J. D. 2012a Conditional regularity of solutions of the three dimensional Navier-Stokes equations and implications for intermittency. J. Math. Phys. 53, 115608.
- (13) Gibbon, J. D. 2012b Dynamics of scaled vorticity norms for the three-dimensional Navier-Stokes and Euler equations. arXiv:1212.0684. To appear in Procedia IUTAM : Proceedings of IUTAM Symposium Topological Fluid Dynamics II Cambridge.
- (14) Hentschel, H. G. E. Procaccia, I. 1983 The infinite number of generalized dimensions of fractals and strange attractors. Physica D 8, 435–444.
- (15) Holm, D. D. and R. M. Kerr, R. M. 2007 Helicity in the formation of turbulence. Phys. Fluids 19, 025101.
- (16) Ishihara, T., Gotoh T., and Kaneda, Y. 2009 Study of high-Reynolds number isotropic turbulence by direct numerical simulation. Annu. Rev. Fluid Mech. 41, 16–180.
- (17) Jimenez, J., Wray, A., Saffman, P. G. and Rogallo, R. S. 1993 The structure of intense vorticity in isotropic turbulence. J. Fluid Mech. 255, 65–90.
- (18) Kerr, R. M. 1985 Higher-order derivative correlations and the alignment of small-scale structures in isotropic numerical turbulence. J. Fluid Mech. 153, 31–58.
- (19) Kerr, R. M. 1993 Evidence for a singularity of the three-dimensional incompressible Euler equations. Phys. Fluids A 5, 1725–1746.
- (20) Kerr, R. M. 2011 Vortex stretching as a mechanism for quantum kinetic energy decay. Phys. Rev. Lett. 106, 224501.
- (21) Kerr, R. M. 2012a Dissipation and enstrophy statistics in turbulence : Are the simulations and mathematics converging? J. Fluid Mech. 700, 1–4.
- (22) Kerr, R. M. 2012b Incompressible hydrodynamic turbulence from a chain reaction of vortex reconnection events. arXiv:1212:3829v1 submitted to Phys. Fluids as Swirling, turbulent vortex rings forming from a chain reaction of reconnection events.
- (23) Kerr, R. M. 2012c Bounds on a singular attractor in Euler using vorticity moments, http://arxiv.org/abs/1212.1106, to appear in Procedia IUTAM, Proceedings of IUTAM Symposium Topological Fluid Dynamics II Cambridge.
- (24) Meneveau, C. and Sreenivasan, K. R. 1991 The multifractal nature of turbulent energy dissipation. J. Fluid Mech. 224, 429–484.
- (25) Nelkin, M. 1990 Multifractal scaling of velocity derivatives in turbulence. Phys. Rev. A. 42, 7226–7229.
- (26) Orszag, S. A. and Patterson, G. S. 1972 Numerical simulation of three-dimensional homogeneous isotropic turbulence. Phys. Rev. Lett. 28, 76–79.
- (27) Pandit, R., Perlekar, P. and Ray, S. S. 2009 Statistical properties of turbulence : An overview, Pramana – Journal of Physics 73, 157–191.
- (28) Ray, S. S., Mitra, D. and Pandit, R. 2008 The universality of dynamic multiscaling in homogeneous, isotropic Navier-Stokes and passive-scalar turbulence. New J. Phys. 10, 033003.
- (29) Ray, S. S., Mitra, D., Perlekar, P. and Pandit, R. 2011 Dynamic Multiscaling in Two-Dimensional Fluid Turbulence. Phys. Rev. Lett. 107, 184503.
- (30) Rogallo, R. S.1981 Numerical experiments in homogeneous turbulence. Tech. Rep. 81835. NASA Tech. Mem.
- (31) Sahoo, G., Perlekar, P. and Pandit, R. 2011 Systematics of the magnetic-Prandtl-number dependence of homogeneous, isotropic magnetohydrodynamic turbulence. New J. Phys. 13, 013036.
- (32) Schumacher, J., Sreenivasan, K. R. and Yakhot, V. 2007 Asymptotic exponents from low-Reynolds-number flows. New J. Phys. 9, 89–107.
- (33) Sreenivasan, K. R. 1985 On the fine-scale intermittency of turbulence. J. Fluid Mech. 151, 81–103.
- (34) Yakhot, V. and Sreenivasan, K. R. 2004 Towards a dynamical theory of multifractals in turbulence. Physica A 343, 147–155.
- (35) Yeung, P. K., Donzis, D. and Sreenivasan, K. R. 2012 Dissipation, enstrophy and pressure statistics in turbulence simulations at high Reynolds numbers. J. Fluid Mech. 700, 5–15.