One-Dimensional Potential Model for Image States on Free-Standing Graphene.
Abstract
In the framework of the non-local dielectric theory the static non-local self-energy of an electron near an ultra-thin polarizable layer has been calculated and applied to study image-states near free-standing graphene. The corresponding series of eigenvalues and eigenfunctions have been obtained by solving numerically the one-dimensional Schrödinger equation. We compare with the Rydgberg’s series for a perfect metal and with experimental values measured on graphene layers grown on Ir and Ru surfaces. For free standing films, the appearance of states with binding energies in between the classical series is discussed.
pacs:
73.22.Pr,73.20.-r,79.20.Ws,79.60.Dp,78.47.JUltra thin stacks of graphene layers display a number of interesting properties and potential applications owing to the linear bands found near the K point in the Brillouin zone.Novoselov et al. (2004); Castro Neto et al. (2009) However, to extract its full potential, other regions in the Brillouin Zone need to be considered; in particular, unoccupied states in the vicinity of have also attracted attention due to their potential role in transport of currents and heat. Indeed, the dielectric response of very few layers of graphene is a key physical element to design devices based in graphene. The dielectric response is directly related, and therefore can be investigated, by looking at image states originated on the trapping of external electrons in the region of unoccupied states between the Fermi level and the vacuum level.Echenique and Pendry (1978) Therefore, the experimental,Armbrust et al. (2012); Niesner et al. (2012) and theoreticalSilkin et al. (2009) study of image states constitute an ideal probe to better understand the properties of ultra-thin graphene layers.
The image force is a non-local effect asymptotically dominated by correlation effects.Garcia-Moliner and Flores (1979) In order to study the infinite Rydberg series arising from the image potential one needs to compute an effective one-dimensional potential, V(z), representing the real part of the quasi-static self-energy for an external unit probe charge. This self-induced potential is a continuos function spanning from inside the material, where it represents the exchange and correlation energy, to the vacuum region, where it should have the correct hydrogenic-like asymptotic behavior, . Such a goal can only be obtained from a non-local spatial formalism, since a local approach results in a correlation potential decaying exponentially in the vacuum region, following the density behavior outside the solid.Lang and Kohn (1970) For a self-consistent first-principles theory such a non-local functional dependence can only be included by means of costly numerical calculations.Jung et al. (2007) Therefore, it is useful and natural to search for simpler ways to obtain such an effective potential, which is the basic ingredient needed to understand the physics of image states bound by an ultra-thin polarizable layer like a few-layers stack of graphene. The simplest of these alternatives is to introduce a set of fitting parameters to continuously join solutions valid either inside or outside the solid. This point of view has been taken, e.g., by Silkin et al. to study image states in free-standing graphene, joining a function with the correct asymptotic behavior to a local-density approximation (LDA) calculation for the potential inside an atom-thick graphene layer.Silkin et al. (2009) This approach makes possible to fit experimental data allowing its physical interpretation.Höfer (2012) Its main weakness is its dependence on a few adjustable parameters, e.g. the choosing of a matching point in the vicinity of the surface, which can influence results due to the fast rate of change of the classical image potential near its divergence at the origin (image plane), etc.
In this paper we analyze an alternative that is almost parameter-free and makes a simple, flexible and accurate basis for interpreting experimental results. We use well-known models for the reflection of electromagnetic waves at the surface (infinite barrier specular model,Ritchie and Marusak (1966)), and for the non-local static dielectric response (Fermi-Thomas and Random Phase ApproximationPines (1999)) so the desired self-energy can be obtained.de Andres et al. (1987) In this approach only two free parameters are neeed, i.e., the electronic medium polarizability which is determined by the electron density of the material, and a geometrical one give by the layer thickness. This approach leads in a natural way to a potential with proper physical features: it is continuous and finite over the full spatial domain and it has the right asymptotic behavior towards the vacuum region. Moreover, as for image states we are interested in regions in reciprocal space with near and energies between the vacuum level and the Fermi energy, it is well justified to model graphene as a polarizable electron gas with a quadratic energy dispersion, as seen from the relevant bands for graphene and graphite for these conditions. The static dielectric response, has been modeled by a Random Phase Approximation (RPA), and by its small expansion, the Fermi-Thomas Approximation (FT).Pines (1999) While the RPA yields a more accurate description of excitations in the material, introducing the FT allows to write the potentials as analytical expressions or quasi-analytical ones which merely depend on a final numerical step involving the simple integration of a function decaying quickly for large values of the argument. The single parameter in these static models is the screening constant, , that it is related to the density of states at the Fermi level, . This value fixes the scale for energies, and its associated wavelength, , the scale for lengths (atomic units are used throughout the paper, except where explicitly it is said otherwise). Taking graphite as a model (2 g/cm3, 2s2 2p2), typical values for graphene are (), although its precise value may depend on factors like doping, external potentials, etc; this is accommodated in our results through the scaling with . The other parameter needed to characterize a thin slab is its width, . For a single atom thick layer of graphene a reasonable value for , should be related to the spatial extension of carbon orbitals, .

Self-induced potential by an ultra-thin slab. For an external probe charge near a slab () we seek the potential acting on Q by the polarization charges induced in the medium by Q itself. This is obtained by computing the total potential, and subtracting the charge’s own naked potential. To ensure the proper boundary conditions, and according to the the specular reflection model at the surface, auxiliary pseudo-media are introduced for the polarizable slab and the vacuum that reduce the calculation to matching solutions obtained in different regions of space for homogeneous media everywhere.Garcia-Moliner and Flores (1979) Details for the thin slab, a vacuum gap between graphene and a metal, and the metallic surface itself, along with expressions, will be given in a forthcoming publication. Within the FT approximation, this potential can be written as an expression that only depends on a numerical integration ():
| (1) |
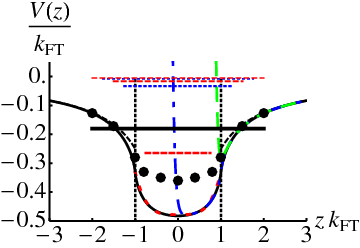
In Fig. 1 we show the potential for a slab occupying the region ; both in the FT approximation (black continuous line), and in the RPA one (black dots). In the all important region determining the Rydberg series (), both approaches yield similar values and agree with the correct asymptotic power-law. Near the center of the slab, FT overestimates the interaction over RPA by about 30-40%,
a difference that reflects mainly in the first few states with a significative weight at the center of the slab. In units of , we see that for , , and (the Coulomb holeHedin (1999)). Outside the slab, for , the potential is well approximated by a classical law, , corrected by an image plane, . The value of can be obtained by expanding the integrals for , giving the position of the image plane in this model: (dashed line). The potential inside the slab is in turn well approximated by a quadratic or quartic fit (dashed red line Fig. 1).
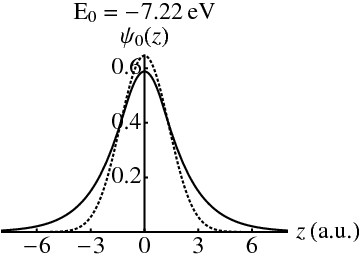
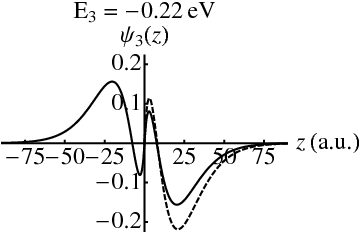
Eigenvalues and Eigenfunctions. We solve numerically the Schrödinger equationCrandall and Reno (1982); Koonin and Meredith (1998) to compute the eigenvalues and eigenfunctions corresponding to the Fermi-Thomas model potential described above. Quite generally, states can be labelled by the number of nodes (), with energies increasing as the number of nodes increases. Furthermore, since V(z) in Eq. 1 is symmetric, eigenfunctions have either even or odd parity, for even or odd . We show in Fig. 1 the first five eigenvalues for V(z): dashed and dotted horizontal lines for even and odd parities. It is worth noticing the structure of this series: there is an isolated eigenvalue (the lowest one), while the remaining states cluster near the vacuum level. For standard densities (e.g., ) this first level appears below eV; an estimate for the work function in graphene (thick line). Therefore, this eigenstate ( eV) does not fit in the standard definition for a Rydberg state, necessarily located between the vacuum and Fermi levels to be observable in a standard experiment. Furthermore, while wave-functions for Rydberg’s states are spatially located mostly in the vacuum region, is symmetric and peaks at the origin (Fig. 3, continuos line in upper-left panel), being alike to the ground state of a harmonic oscillator fitting the bottom of the well ( a.u., eV), but not to states in the one-dimensional hydrogen-like series for a semi-infinite metal, that go to zero at the image plane.
| l | 1 | 2 | 3 | |||||||
|---|---|---|---|---|---|---|---|---|---|---|
| Gr/IrNiesner et al. (2012) | -.83 | -.19 | -.09 | |||||||
| m+1 | 1 | 2 | 3 | 4 | 5 | |||||
| Echenique and Pendry (1978) | -.85 | -.21 | -.094 | -.053 | -.034 | |||||
| n | 0+ | 1- | 2+ | 3- | 4+ | 5- | 6+ | 7- | 8+ | 9- |
| Eq. (1) | -7.22 | -.90 | -.44 | -.22 | -.15 | -.096 | -.074 | -.054 | -.044 | -.034 |
| m+1 | 1 | 2 | 3 | 4 | 5 | |||||
| -.61 | -.17 | -.073 | -.037 | -.032 | ||||||
| -1.3 | -.28 | -.13 | -.083 | -.062 | ||||||
| l | 1’ | 1 | 2 | |||||||
| Gr/RuArmbrust et al. (2012) | -.80 | -.41 | -.18 | |||||||
| l | 1+ | 1- | 2+ | 2- | 3+ | 3- | ||||
| Silkin et al. (2009) | -1.47 | -.72 | -.25 | -.19 | -.11 | -.07 | ||||
| Silkin et al. (2009) | -1.29 | -.57 | -.24 | -.17 | -.11 | -.06 |
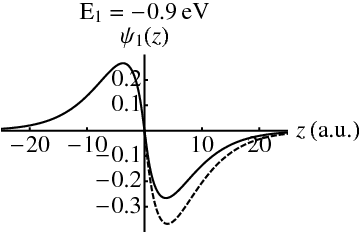
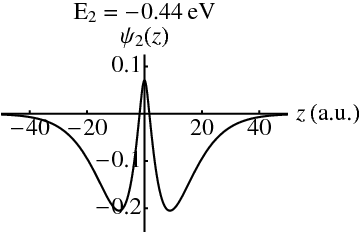
In Table I and Fig. 2 we compare eigenenergies calculated for the FT model with experimental values reported for Gr/Ru,Armbrust et al. (2012) Gr/Ir,Niesner et al. (2012) and with the limiting case of the Rydberg series for a perfect metal . where refers to the number of nodes for each state (notice that these wave-functions only extend to half-space, and that the zero at the origin is not counted as a node since it derives from the boundary conditions). These eigenvalues can be conveniently obtained from multiple-scattering techniques,Echenique and Pendry (1978) while wave functions are obtained as the solution to Schrödinger’s equation with (), that can be reduced to Whittaker’s differential equation.Andrews (1998) The similarity of values found for the antisymmetric () members of the series of states for V(z) and Rydberg’s series is striking. Such a similarity can be better understood by looking at the corresponding wave-functions (Fig. 3). Boundary conditions make all Whittaker’s wave-functions to go to zero at the origin, a condition that in the case of a symmetric well can only be fulfilled by odd wave functions. Moreover, if and give the number of nodes for odd wave-functions for the symmetric potential, and the Rydberg’s one respectively, we can make a one-to-one correspondence, , that simply tells us that both sets of wave-functions have the same number of nodes if is divided by two (only half-space) and the node at the origin is discounted. From a physical point of view, we can envisage two relevant limits: a free standing slab producing a symmetric potential with states labeled by the number of nodes and their parity, and a slab lying on a substrate where a particular surface gap may prevent penetration of wave-functions inside the material leaving only half the space accessible for image states. Therefore, it is reasonable to argue that, according to our analysis, for a free standing slab, or one interacting weakly with the substrate support, it should be possible to observe the even states as new energies located in between the usual hydrogenic ones. It is interesting to notice that one of these states may have been observed for Gr/Ru (),Armbrust et al. (2012) while none of these have been reported for Gr/Ir.Niesner et al. (2012) This fact must be related to the strength of the interaction between the supporting metal and the graphene layer, and the penetration of wave-functions in both metals in a way that goes beyond the scope of the current analysis.
| Whittaker’s | 0 | 1 | 2 | 3 | 4 | ||||
|---|---|---|---|---|---|---|---|---|---|
| 3 | 12 | 29 | 51 | 79 | |||||
| Eq. (1) | 1 | 2 | 3 | 4 | 5 | 6 | 7 | 8 | 9 |
| 3 | 6 | 12 | 18 | 28 | 34 | 48 | 58 | 78 |
To assess how sensitive are the eigenvalues to the details of the model potential we have added to a repulsive term modeled as an exponential wall: . On a metallic surface such a ”repulsive” term can originate because electronic gaps existing for particular surface orientations. The resulting potential for the repulsive barrier located near the slab surface (, green dashed line in Fig. 1) is similar to the classical series with an image plane to prevent the divergence at the origin () and can be understood by introducing a quantum defect in Rydberg’s series. The barrier, on the other hand, can be introduced below the surface (e.g., , blue dashed-dotted line in Fig. 1), and a numerical solution for Schrödinger’s equation can be obtained. Results in Table I show that, for large m, eigenvalues tend to the classical ones in accordance with the fact that the average position of the electron is far away from the surface, therefore mostly influenced by the asymptotic behavior. Table II gives the expectation mean values in Å, , for Whittaker’s wavefunctions compared with the ones corresponding to Eq. (1). These values compare well, which reflect the manifest similarity between wave functions commented on Fig. 3. The fact that for determines a spatial region where both FT and RPA dielectric functions lead to approximately the same potential, suggesting that higher k-corrections to the dielectric function arising from the random phase approximation are negligible, at least for states. Taking away the first level, largely affected by the details near the bottom of the potential, the rest of the series is only modified by a percentage comparable to differences found in Table I between similar entries. Therefore, we argue that our assignation of levels is sound and robust.
Conclusions. Using standard models for the dielectric response and the reflection of electromagnetic waves at a surface we have computed the static self-energy for an ultra-thin slab mimicking a graphene layer. The self-induced potential goes continuously from the exchange and correlation energy inside the material to the classical asymptotic image potential in the vacuum. Eigenvalues and eigenfunctions have been compared with Whittaker’s classical series and recent experiments on Gr/Ir and Gr/Ru. The odd members of the series for the slab show a remarkable resemblance to the solution of Schrödinger’s equation for the classical image potential (Whittaker’s wavefunctions). On the other hand, even wavefunctions arise as new states that differ from Whittaker’s in several key respects, e.g. their non-zero density probability at the origin. For the case of films weakly interacting with a support some new states may consequently appear in between the classical ones, that can be traced back to the even states in a free-standing slab. Such a case could have been observed in recently measured experimental values on Gr/Ru.
Acknowledgments. This work has been financed by the Governments of Spain (MAT2011-26534, and FIS2010-19609-C01-01), and the Basque Country (IT-756-13). Computing resources provided by the CTI-CSIC are gratefully acknowledged.
References
- Novoselov et al. (2004) K. S. Novoselov, A. K. Geim, S. V. Morozov, D. Jiang, Y. Zhang, S. V. Dubonos, I. V. Grigorieva, and A. A. Firsov, Science 306, 666 (2004), URL http://www.sciencemag.org/content/306/5696/666.abstract.
- Castro Neto et al. (2009) A. H. Castro Neto, F. Guinea, N. M. R. Peres, K. S. Novoselov, and A. K. Geim, Rev. Mod. Phys. 81, 109 (2009), URL http://link.aps.org/doi/10.1103/RevModPhys.81.109.
- Echenique and Pendry (1978) P. M. Echenique and J. B. Pendry, J. Phys. C: Solid State Phys. 11, 2065 (1978).
- Armbrust et al. (2012) N. Armbrust, J. Güdde, P. Jakob, and U. Höfer, Phys. Rev. Lett. 108, 056801 (2012), URL http://link.aps.org/doi/10.1103/PhysRevLett.108.056801.
- Niesner et al. (2012) D. Niesner, T. Fauster, J. I. Dadap, N. Zaki, K. R. Knox, P.-C. Yeh, R. Bhandari, R. M. Osgood, M. Petrovi, and M. Kralj, Phys. Rev. B 85, 081402 (2012), URL http://link.aps.org/doi/10.1103/PhysRevB.85.081402.
- Silkin et al. (2009) V. M. Silkin, J. Zhao, F. Guinea, E. V. Chulkov, P. M. Echenique, and H. Petek, Phys. Rev. B 80, 121408 (2009), URL http://link.aps.org/doi/10.1103/PhysRevB.80.121408.
- Garcia-Moliner and Flores (1979) F. Garcia-Moliner and F. Flores, Introduction to the Theory of Solid Surfaces (Cambridge University Press, 1979).
- Lang and Kohn (1970) N. D. Lang and W. Kohn, Phys. Rev. B 1, 4555 (1970), URL http://link.aps.org/doi/10.1103/PhysRevB.1.4555.
- Jung et al. (2007) J. Jung, J. E. Alvarellos, E. Chacon, and P. Garcia-Gonzalez, Journal of Physics: Condensed Matter 19, 266008 (2007), URL http://stacks.iop.org/0953-8984/19/i=26/a=266008.
- Höfer (2012) U. Höfer (2012), private communication.
- Ritchie and Marusak (1966) R. Ritchie and A. Marusak, Surface Science 4, 234 (1966), ISSN 0039-6028, URL http://www.sciencedirect.com/science/article/pii/003960286690%0033.
- Pines (1999) D. Pines, Elementary Excitations in Solids (Perseus, Reading MA, 1999).
- de Andres et al. (1987) P. L. de Andres, F. Flores, P. M. Echenique, and R. H. Ritchie, Europhys. Lett. 3, 101 (1987).
- Hedin (1999) L. Hedin, Journal of Physics: Condensed Matter 11, R489 (1999), URL http://stacks.iop.org/0953-8984/11/i=42/a=201.
- Crandall and Reno (1982) R. E. Crandall and M. H. Reno, J. Math. Phys. 23, 64 (1982), URL http://dx.doi.org/10.1063/1.525207.
- Koonin and Meredith (1998) S. Koonin and D. Meredith, Computational Physics (Westview Press, 1998), http://www.computationalphysics.info.
- Andrews (1998) L. C. Andrews, Special Functions of Mathematics for Engineers (Oxford University Press, 1998), eq. 10.64.