Super-Eddington accreting massive black holes as long-lived cosmological standards
Abstract
Super-Eddington accreting massive black holes (SEAMBHs) reach saturated luminosities above a certain accretion rate due to photon trapping and advection in slim accretion disks. We show that these SEAMBHs could provide a new tool for estimating cosmological distances if they are properly identified by hard X-ray observations, in particular by the slope of their 2–10 keV continuum. To verify this idea we obtained black hole mass estimates and X-ray data for a sample of 60 narrow line Seyfert 1 galaxies that we consider to be the most promising SEAMBH candidates. We demonstrate that the distances derived by the new method for the objects in the sample get closer to the standard luminosity distances as the hard X-ray continuum gets steeper. The results allow us to analyze the requirements for using the method in future samples of active black holes and to demonstrate that the expected uncertainty, given large enough samples, can make them into a useful, new cosmological ruler.
pacs:
98.80.Es, 98.54.Cm, 98.62.Js, 98.62.Mw, 95.36.+xThe discovery of the accelerating expansion of the Universe has now been established through observations of type Ia supernovae (SNe Ia) snia , and is likely to be confirmed further with new standard rulers provided by baryon acoustic oscillations, weak lensing and clusters of galaxies frieman08 . However, SNe Ia beyond are rare rubin12 as there is no time for their progenitors to evolve in substantial numbers given their lower metallicity kobayashi09 . To further probe the dynamics of the acceleration, new distance indicators are needed at and beyond these redshifts. Based on well-understood physics we show in this Letter that super-Eddington accreting massive black holes (hereafter SEAMBHs) in some active galactic nuclei (AGNs), that are characterized by a mass of , can provide a new tool to estimate cosmological distances at a wide range of redshifts, including the high redshift Universe.
Radiation pressure limits the spherical accretion rate onto black holes to , where is the Eddington luminosity for a pure hydrogen plasma, () is the mass to radiation conversion efficiency, is the Thomson cross section, is the proton mass, is the speed of light, is the gravitational constant and is the black hole mass. However, super-Eddington accretion onto black holes is feasible in slim disks where the radiation pressure-dominated regions (RPDR) are thermally stable due to the radial advection of the locally emitted radiation abramowicz88 . In such disks, the timescale of photon diffusion to the disk surface is longer than that of the radial motion of the accreting gas in the RPDR. The photons are trapped inside the accretion flows and are advected into the black holes. This advection dominates within the photon trapping radius, , where , , is the mass accretion rate and slim_adaf . Photon trapping affects the total emitted radiation and results in a saturated luminosity, , which is proportional (logarithmically, rather than linearly) to the accretion rate slim_adaf ; slim_sed ,
| (1) |
where , and slim_sed . For reference, at the saturated luminosity is . Thus, at a given black hole mass, SEAMBHs are radiating basically at a constant luminosity which, as shown below, can therefore be used to deduce cosmological distances.
In this Letter we address two important issues: how to identify SEAMBHs and how to test, observationally, Equation 1 and its uncertainties such that it can be used to derive reliable cosmological distances. While SEAMBHs are predicted to have unique optical-UV spectral characteristics abramowicz88 ; slim_adaf ; slim_sed , their use to identify such sources is hampered by the dilution of the disk emission by stellar radiation from the host galaxy at long wavelengths, and by the Galactic and inter-galactic absorption at short wavelengths. In fact, current observations cannot identify such systems using only their spectra in the optical-UV domain. Fortunately, X-ray spectroscopy allows such identifications for two reasons. First, there is a well-known positive correlation between the 2-10 keV X-ray photon spectral index () and the Eddington ratio () Gamma2-10 . In addition, higher sources emit a smaller fraction of their total radiation () at hard X-ray energies factor_X . These properties are easy to measure with modern X-ray observations and are similar to those observed in Galactic black holes in X-ray binaries remillard06 .
The general theory that links X-ray emission to the optical-UV spectrum of accretion disks is based on the assumption of a hot corona above the disk that is the source of the X-ray radiation. The X-ray emission efficiency of the processes in the corona depends on . In particular, the magneto-rotational instability is a key factor to produce the viscosity that helps transporting angular momentum outward balbus98 . The process takes place through magnetic buoyant transportation above the cold disk galeev79 which leads to a “corona-dominated” dissipation through hard X-ray emission. The increases of the accretion rates result in the weakening of the transportation of magnetic tubes because of the inflation of the disk by radiation pressure which yields a reduction of the buoyant velocity. The end result of these processes is the radial advection of the emitted photons and the suppression of the relative X-ray flux () of the system merloni03 .
The second effect of an increasing ratio is the steepening of the X-ray photon index . There have been various attempts at calculating in hot coronae from basic considerations of the conditions in accretion disks galeev79 . The 2-10 keV emission is mainly due to the Comptonization of photons from the cold disks (the X-ray reflection can be neglected in this band x-ray-reflection ). It has been shown that in the RPDR (see equation 13 for and Figure 1 in Ref. merloni03 ) and thus one expects that a luminosity is radiated by the coronae. Since Comptonization is the main cooling process, the balance between heating and cooling yields the density of hot electrons and .
Under the conditions discussed above, the X-ray photon index can be approximated by beloborodov99 , where is the Comptonization parameter, , is the electron temperature and is the Thomson scattering optical depth. It is expected that , where for unsaturated Comptonization () and for saturated Comptonization. This scenario is supported by the behaviors of black hole X-ray binaries in very high states remillard06 , showing that the 2-10 keV emission is at the level of low/hard states, but the photon indexes are typically . Considering that hard X-ray spectra have a cutoff of 50-100 keV () cutoff and applying the above coronal model to AGNs, we have . This prediction agrees with the observed correlation of AGNs hosting standard (optically thick and geometrically thin) accretion disks Gamma2-10 .
The simplest model for the slim disks of SEAMBHs assumes a spherical hot corona with a characteristic size . The Comptonization of photons from the slim disk surface produces a hard X-ray luminosity , giving rise to , where , and . The coronae having a Comptonization parameter of , the SEAMBHs are then characterized by , where . Obviously there are uncertainties in these parameters and the resulting theoretical relationships, however, we can use the observed to identify SEAMBHs in different types of active galactic nuclei.
The best group of AGNs where such processes have been studied are narrow line Seyfert 1 galaxies (NLS1s). These objects are separated from broad line Seyfert 1 galaxies (BLS1s) by having the following properties osterbrock85 ; boller96 : 1) the full-width-half-maximum (FWHM) of H profiles are narrower than ; 2) strong soft X-ray excess; 3) unusually strong (relative to H) optical iron emission lines; 4) weak [O iii] lines ([O iii]/H); 5) fast, large amplitude X-ray variations leighly99 . The typical black hole mass in NLS1s (see below) is considerably smaller than that in BLS1s of similar which implies that many of them may be accreting at super-Eddington rates.
To test observationally Equation 1 in NLS1s, we have to estimate . Black hole masses can be measured individually using the reverberation mapping (RM) technique, which invokes the response (time lag) of the broad emission lines with respect to changes in the continuum produced by the underlying disk kaspi00 ; pancoast11 . In its most detailed version, the velocity-resolved reverberation mapping (VRRM), one can derive the spatial distribution of the line emitting gas, and its velocity, at every location around the black hole. In principle, this phase-space mapping enables us to determine, accurately, the black hole mass (this is equivalent to dynamical methods which are used to measure the masses of black holes in normal nearby galaxies). Such two dimensional mappings are only available for a handful of sub-Eddington sources and many details of the technique need to be improved for accurate measurements (e.g. the case of the BLS1 Mrk 50 pancoast11 ).
Fortunately, we can use as a proxy the tight correlation between the size of the broad line regions (BLR) (the time lag times the speed of light) and the underlying continuum luminosity to obtain an empirical relationship, for a sample of about 35 AGNs, that can be combined with the observed line widths to estimate the black hole masses in a large sample of sources. The relationship is given by
| (2) |
where cm, , and is the AGN continuum luminosity ( at 5100 Å in units of ) kaspi00 ; bentz09 . We note that among the 35 AGNs used to derive this correlations, eight are NLS1s and follow the same trend as other sources bentz11 .
Equation 2 enables us to obtain the black hole masses by assuming a virialized (gravitationally bound) cloud system and combining all the unknown geometrical factors, such as the inclination to the line of sight, into a single constant . Using this constant we can now write an expression for the “reverberation mapping-based virial mass estimate” of super-massive black holes as
| (3) |
where is the FWHM of the broad emission line (e.g. H) that was used to derive the time lag in the RM measurement. The factor is calibrated by comparing the results of the RM experiments to direct black hole measurements based on the relation, where is the stellar velocity dispersion in the bulge of the host galaxy. Such a comparison is now available for about 30 out of the 35 AGNs in the RM sample. It shows that onken04 . Noting that , where is a bolometric correction factor, we obtain an expression of in terms of and . Since , where is the measured continuum flux in units of at 5100 Å and is the luminosity distance of the black hole, we obtain the expression
| (4) |
This expression still involves the unknown accretion rate which, as suggested earlier, can be estimated from the X-ray slope . However, the dependence for (which is the one we are interested here, see below) is weak enough that we can use the approximation and obtain from the other known observables and constants. Thus, having established that an object is a SEAMBH by measuring its index, we have a way to directly measure its distance.
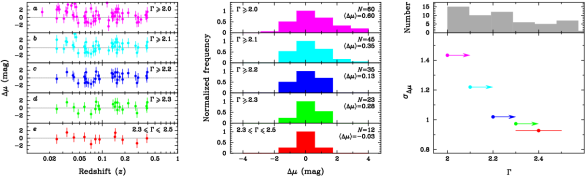
In the following we use the distance modulus, , and compare it with the one obtained from the standard luminosity distance in the Friedman-Lemaître-Robertson-Walker metric . The prediction is that comparing and we will get smaller residuals for larger , since large indices point to conditions closer to those predicted by the SEAMBH theory.
We now turn to the available samples of SEAMBH candidates. While the observed NLS1 properties may all be related to the large Eddington ratio pounds95 ; boller96 , not all NLS1s have super-Eddington accretion rates. It is thus necessary to use the hard X-ray spectra to identify SEAMBHs among NLS1s. We selected a large number of NLS1s from several heterogeneous samples boller96 ; samples with hard X-ray observations by ASCA, XMM-Newton, Chandra and Swift missions . All data and data reduction details are provided in the Supplementary Materials Online. In short, we use the observed flux and the estimated black hole mass to derive and hence for each source (see also a somewhat different approach but similar results in jin12 ; slim_sed ). The contaminations by the stellar light of the host galaxy were removed, prior to the estimate of , using the approximation described in Materials Online. We examined the distribution in our NLS1 sample and found that, indeed, many of them indicate super-Eddington ratios, up to 5 and even more. Thus, the selection of sources by is indeed a good way to identify such sources.
We calculate for all sources, bin them into various groups of different , and plot them in Figure 1. As shown by the standard deviation (), the scatter of systematically decreases as increases. From Equation 4), this behavior can be understood in terms of the scatter expressed by
| (5) |
where , , , , , , , , and . converges to as decreases with increasing .
To illustrate the typical uncertainty on individual points we assume that onken04 (from the scatter in the distribution), (from the known variations in the optical continuum and the uncertainty in the substraction of the stellar background), (from the uncertainty in fitting the emission line profiles and measuring ), and . The estimated uncertainty of is the largest and most problematic for several reasons. First, all our estimates of are derived from theoretical calculations of slim disk spectra slim_sed . These have not been verified observationally because of the lack of extreme UV observations, where most of the emitted luminosity in disks around small black holes ( ) is emitted. Moreover, a factor of 10 increase in black hole mass results in a factor of decrease in (from about 100 in to about 40 in black holes). The entire range of black hole masses in our sample suggests a very large . Fortunately, the individual masses are known and the uncertainty on massive black holes using the RM-based virial method is only a factor of about 3 vestergaard06 . This and the allowed range of spectral shapes and gives the quoted estimate on .
Combining all these uncertainties and assuming we obtain . This corresponds to mag since the first term in Equation 1 tends to vanish for large enough values of . This is not surprising given Equation 1 and the known uncertainties on measured by the RM-based virial method. This uncertainty is estimated to be 0.3–0.5 dex which would suggest a similar uncertainty on . Since , we get a similar uncertainty on individually measured points to the one obtained by the more detailed calculations. From Figure 1, we find mag, which clearly shows that the selected sample has a small scatter of related to this term.
The panels of Figure 1 illustrate both the convergence to and the reduced scatter when using increasinglt larger values of . The central panel shows that for a sufficiently steep X-ray continuum, a combination of a large number of SEAMBHs gives, indeed, the correct distance with a small scatter.
The systematic decrease of the dispersion in the subsamples with increasing , while keeping a median with little variation, cannot be accounted by statistical fluctuations in the subsamples. Considering that the subsamples are not independent, we assess the statistical significance using Monte Carlo simulations with Gaussian samples of size with the same mean and dispersion as the observed one. From them, we selected distinct (i.e., with no replacement) random sub-samples of the same size as the ones selected (Figure 1), and estimate the probabilities that the differences in the medians and the ratio of the dispersions correspond to the observed ones. We find that while the probability that the medians do not differ from the one of the underlying sample of is always very large (above ), the probability that the dispersions are as small as the observed one is always smaller than 3%. The observed trend cannot therefore be ascribed to random fluctuations of small samples extracted from the main sample. In the sample used here, there are only 12 sources with but future samples will be larger since such objects can be observed to high redshift. We point out that the and panels are statistically indistinguishable because of the poor quality of the sources with . There are 11 sources in total with listed in Table 1 in the Supplementary Material Online. Five of them with hard X-ray observations have large error bars (), making the binning less significant for these small samples. Five other objects are observed in the 0.5–8 keV band by Chandra (Williams et al. 2004 in samples , see notes in Table 1), but the data quality only allows us to approximate the 0.5–8 keV spectral indexes with the 2–8 keV proxy, and the error bars of these sources remain very large ( except one). The panel is shown for reference and future observations. Moreover, the accuracy of the measured can increase substantially if new, dedicated RM experiments are carried out on a large number of SEAMBH candidates. This can reduce the uncertainty on , , and and constrain to be the slope for this population only. As Figure 1 shows, it is reasonable to assume that for a large enough sample of SEAMBHs at a narrow redshift range, we could expect a scatter on the population that approaches 0.15 mag, similar to the current accuracy of SNe Ia method rubin12 .
SEAMBHs, as a new type of cosmological distance indicator, have a number of advantages over others grijs11 : (1) The saturated luminosities are well understood on physical grounds and have no potential cosmic evolution. (2) The objects can be efficiently selected by their X-ray or optical properties. (3) They can probe a large range of redshifts, as they follow the cosmic growth of massive black holes that are abundant at high- and are very luminous. (4) Unlike SNe Ia, repeated observations can be made to improve the observational accuracy.
Several observational issues require careful attention: (1) As mentioned before, the relation applied here is the one obtained for all AGNs. The re-calibration of this relationship in a dedicated NLS1s or SEAMBH sample, by obtaining better estimates of and in Equation 2, can reduce the scatter in the derived mass and hence . Obviously, the estimated involves the distance to the source which is the quantity we are attempting to measure. However, we do not expect large differences between and so this uncertainty, by itself, is very small. (2) The 2-10 keV luminosity and slope are both variable leighly99 which may lead to misidentification of SEAMBHs. Long-term averaged values can be used to improve the accuracy.
The prospects of building large samples of SEAMBHs to be used as tests of the current cosmological model are promising. We expect that roughly 20% of NLS1 with host SEAMBHs. As NLS1 constitute about 10% of all AGNs, there should be SEAMBHs among Seyfert 1 galaxies with huchra92 . SEAMBHs could be even more abundant at high- although the definition of NLS1 should be modified in such cases netzer07 . Here we require black hole mass estimates that are based on both the H and Mg ii 2798 Å lines. X-ray spectra can be obtained by Nustar, by the upcoming eRosita and HXMT missions erosita . Given accurate observations of SEAMBHs at high redshift we will have a unique chance to explore in-depth the dynamics of the accelerating Universe as well as the nature of dark energy.
Acknowledgements.
JMW thanks the hospitality of M. Ward and C. Done at Durham, where this work was initiated in early October 2011. L. C. Ho, Y.-Y. Zhou, Z.-W. Han, C. Jin, Y.-R. Li, S.-M. Jia, J.-M. Bai and J.-C. Wang are acknowledged for useful suggestions and discussions. The research is supported by 973 project (2009CB824800), NSFC-11173023, -11233003, and -11133006. DVG was supported in part by the CAS with a Visiting Professorship for senior international scientists.References
- (1) A. G. Riess, et al., Astron. J. 116, 1009 (1998); S. Perlmutter, et al., Astrophy. J. 517, 565 (1999)
- (2) A. Albrecht, et al., Report of the Dark Energy Task Force, astro-ph/0609591 (2006); J. A. Frieman, M. S. Turner & D. Huterer, Ann. Rev. Astron. Astrophy. 46, 385 (2008), D. Weinberg, et al. arXiv:1201.2434 (2012).
- (3) D. Rubin, et al., arXiv:1205.3494 (2012); G. Folatelli, et al., Astron. J., 139, 120 (2010)
- (4) C. Kobayashi & K. Nomoto, Astrophys. J., 707, 1466 (2009)
- (5) M. A. Abramowicz, et al., ibid, 332, 646 (1988), E. Szuszkiewicz, M. A. Malkan & M. A. Abramowicz, ibid, 458, 474 (1996); A. M. Beloborodov, Mon. Not. R. Astron. Soc., 297, 739 (1998)
- (6) J.-M. Wang, E. Szuszkiewicz, et al., Astrophys. J., 522, 839 (1999); J.-M. Wang & Y.-Y. Zhou, ibid, 516, 420 (1999)
- (7) S. Mineshige, et al., Pub. Astron. Soc. Jap., 52, 499 (2000) [see also K. Watarai, et al., ibid, 52, 133 (2000)]; L.-H. Chen & J.-M. Wang, Astrophys. J., 614, 101 (2004). We can get at 5100Å for and from their Figure 1. We have and for the present sample. This value agrees with observational results jin12 . This coefficient has no cosmological evolution.
- (8) Y.-J. Lu & Q.-J. Yu, Astrophys. J., 526, L5 (1999), O. Shemmer, et al., ibid, 646, L29 (2006); G. Risaliti et al. ibid, 700, L6 (2009); X.-L. Zhou & Y.-H. Zhao, ibid, 720, 206 (2010); D. Grupe et al. Astrophy. J. Suppl., 187, 64 (2010); W.-H. Bian & Y.-H. Zhao, Mon. Not. R. Astron. Soc., 343, 164 (2003); D. Porquet, et al. Astron. Astrophys., 422, 85 (2004) and E. Piconcelli, et al. ibid, 432, 15 (2005) for PG quasars.
- (9) J.-M. Wang, K. Watarai & S. Mineshige, Astrophys. J., 607, L107 (2004); R. V. Vasudevan & A. C. Fabian, Mon. Not. R. Astron. Soc., 392, 1124 (2009); E. Lusso, et al. ibid, 425, 623 (2012)
- (10) R. A. Remillard & J. E. McClintock, Ann. Rev. Astron. Astrophys., 44, 49 (2006)
- (11) S. A. Balbus & J. F. Hawley, Rev. Mod. Phys., 70, 1 (1998)
- (12) A. A. Galeev, et al. Astrophys. J., 229, 318 (1979); L. Stella & R. Rosner, ibid, 277, 312 (1984); J.-M. Wang & H. Netzer, Astron. Astrophys., 398, 927 (2003), X. Cao, Mon. Not. R. Astron. Soc., 394, 207 (2009)
- (13) A. Merloni, Mon. Not. R. Astron. Soc., 341, 1051 (2003)
- (14) I. M. George & A. C. Fabian, ibid, 249, 352 (1991); P. Magdziarz & A. A. Zdziarski, ibid, 273, 837 (1995)
- (15) A. M. Beloborodov, in “High Energy Processes in Accreting Black Holes”, ASP Conference Series 161, ed. J. Poutanen & R. Svensson (1999), p.295
- (16) F. Panessa, et al., Mon. Not. R. Astron. Soc., 417, 2426 (2011); V. Beckmann, et al., Astron. Astrophys., 505, 417 (2009)
- (17) D. E. Osterbrock & R. W. Pogge, Astrophys. J., 297, 166 (1985)
- (18) T. Boller, W. N. Brandt, & H. Fink, Astron. Astrophys., 305, 53 (1996)
- (19) K. M. Leighly, Astrophy. J. Suppl., 125, 297 (1999)
- (20) S. Kaspi, et al., Astrophys. J., 533, 631 (2000); S. Kaspi, et al., ibid, 629, 61 (2005)
- (21) A. Pancoast, B. J. Brewer & T. Treu, ibid, 730, 139 (2011); A. Pancoast, et al., ibid, 754, 49 (2012)
- (22) M. Bentz, et al., ibid, 697, 160 (2009)
- (23) M. Bentz, in “NLS1 and their place in the Universe”. Ed. L. Foschini et al. Proceedings of Science (2011), id. 33
- (24) C. A. Onken, et al. Astrophys. J., 615, 645 (2004); J. H. Woo et al., ibid, 716, 269 (2010); D. Park, et al., ibid, 747, 30 (2012).
- (25) K. A. Pounds, et al. Mon. Not. R. Astron. Soc., 277, L5 (1995); J. Kuraszkiewicz, et al. Astrophys. J., 542, 692 (2000); S. Collin & T. Kawaguchi, Astron. Astrophys., 426, 797 (2004); S. Collin, et al., ibid, 456, 75 (2006)
- (26) M. P. Véron-Cetty, P. Véron & A. C. Gonçalves, Astron. Astrophys., 372, 730 (2001), R. J. Williams, et al., Astrophys. J., 610, 737 (2004), H. Zhou, et al., Astrophy. J. Suppl., 166, 128 (2006), Y. Shen, et al., ibid, 194, 45 (2011)
- (27) ASCA: the Advanced Satellite for Cosmology and Astrophysics; XMM-Newton: X-ray Multi-mirror Mission; Chandra: Chandra X-ray Observatory; Swift: the Swift Gamma-ray Burst Mission. HXMT: the Hard X-ray Modulation Telescope
- (28) C. Jin, M. Ward, C. Done & J. Gelbord, Mon. Not. R. Astron. Soc., 420, 1825 (2012) and Jin et al. ibid, 425, 907 (2012). The averaged value of the bolometric correction factor is obtained from 10 NLS1s () consistent with slim_sed .
- (29) M. Vestergaard & B. M. Peterson, Astrophys. J., 641, 689 (2006)
- (30) R. De Grijs, An introduction to distance measurements in astronomy, Wiley (2011) for a review of the current distance indicators; K. Horne, et al., Mon. Not. R. Astron. Soc., 339, 367 (2003), P. Marziani, et al., Mem, S. A. It. Suppl. 3, 218 (2003) and D. Watson et al., Astrophys. J., 740, L49 (2011) suggest the BLR delay-luminosity relation can be applied to the determination of the Hubble constant, but its intrinsic scatter ( mag) prevents its application to cosmology.
- (31) J. Huchra & R. Burg, Astrophys. J., 393, 90 (1992); J. S. Ulvestad & L. C. Ho, ibid, 558, 561 (2001); L. Hao, et al. Astron. J., 129, 1795 (2005)
- (32) H. Netzer & B. Trakhtenbrot, Astrophys. J., 654, 754 (2007)
- (33) eRosita (http://www.mpe.mpg.de/erosita/) is to be launched in 2013, and HXMT in 2015, while the hard X-ray telescope Nustar was launched in June 2012 (http://www.nustar.caltech.edu/).