Large Size Scatter of Passively Evolving Lensed Galaxies at in CLASH
Abstract
In a systematic search over 11 cluster fields from Cluster Lensing And Supernova survey with Hubble (CLASH) we identify ten passively evolving massive galaxies at redshift . We derive the stellar properties of these galaxies using HST WFC3/ACS multiband data, together with Spitzer IRAC observations. We also deduce the optical rest-frame effective radius of these high redshift objects. The derived stellar masses and measured effective radii have been corrected by the lensing magnification factors, which are estimated by simply adopting the spherical NFW model for the foreground cluster lens. The observed near-IR images, obtained by HST WFC3 camera with high spatial resolution and lensed by the foreground clusters, enable us to study the structures of such systems. Nine out of ten galaxies have on average three times smaller effective radius than local ETGs of similar stellar masses, in agreement with previous works at redshift . Combined with literature data for , we find that the mass-normalized effective radius scales with redshift as . We confirm that their size distribution shows a large scatter: from normal size to times smaller compared to local ETGs with similar stellar masses. The 1- scatter of the size distribution is 0.22 and 0.34 at and ,respectively.The observed large size scatter has to be carefully taken into account in galaxy evolution model predictions.
keywords:
galaxies: formation – galaxies: evolution – galaxies: high-redshift1 Introduction
Local Early-Type Galaxies (ETGs) are spheroidal systems, which predominantly consist of old stars with mass-weighted ages of Gyr (see Renzini 2006 for a review). This provides strong evidence that most of the stars in ETGs were formed at redshift and evolved passively. Recent observations (e.g. Kriek et al. 2008) found red, massive ETGs already at . Many of these ETGs are designated as passively evolving galaxies (PEGs), generally by a color-color selection criterion and/or a low specific star formation rate (sSFR). Massive PEGs contribute a significant fraction to massive galaxies at , with a number density of (Kriek et al. 2008).
Sizes of local ETGs have been found to tightly correlate with stellar masses (Shen et al. 2003). While compared to local ETGs of similar stellar masses, the sizes of massive (), PEGs at redshift have been found to be much smaller, by a factor of (Daddi et al. 2005; Trujillo et al. 2006; Toft et al. 2007; van der Wel et al.2008; van Dokkum et al. 2008, 2009; Damjanov et al. 2009; Saracco et al. 2009; Cassata et al. 2010, 2011; Ryan et al. 2012; Newman et al. 2012; Szomoru et al. 2012; Zirm et al. 2012). Deep HST/WFC3 images reveal that PEGs at are not surrounded by the faint extended envelopes of material (e.g. Szomoru et al. 2012) . On the other hand, the lack of compact massive galaxies at low redshift implies significant size evolution from to (Trujillo et al. 2009).
Two popular models for the size evolution have been proposed: (1) dissipationless (dry) minor merger (Naab et al. 2009, Hopkins et al. 2010); (2) ”puff-up” due to the gas mass loss by AGN (Fan et al. 2008, 2010) or supernova feedback (Damjanov et al. 2009). However, recent studies found that observed size evolution of the compact massive galaxies at redshift can not be explained well by the present models. Nipoti et al (2012) constructed a CDM-based analytic framework, supported by suites of N-body merger simulations, to predict the evolution of ETGs undergoing dry mergers. Using a compilation of observations of ETGs at , they concluded that mergers alone are not consistent with the observed rate of structural evolution at . For the puff-up model, Ragone-Figueroa & Granato (2011) found the mass loss by AGN feedback can produce a significant size increase based on the results of numerical simulations. However, they augued most of the puffing up occurs when the stellar population are much younger than the estimated ages of compact high-z PEGs, so that the puffing up due to the gas mass loss may not dominate the size evolution observed so far.
Size evolution with redshift has been described by in the literature (e.g. Newman et al. 2010, Damjanov et al. 2011, Cimatti et al. 2012). However, the value of is diverse for different works, varying from to . The large diversity of may be due to the different sample selection criteria (morphological, color-color or sSFR selections) and/or partly due to the sparsity of data points at high redshift. For instance, there are only about ten objects at in Damjanov et al. 2012. Using and sSFR selection criteria, Szomoru et al. (2012) selected 21 PEGs at in the GOODS-South field as part of the CANDELS survey. They found those 21 PEGs at not only had smaller effective radii than local ETGs of similar stellar masses, but also had a significant spread in their size distribution (). If the larger size scatter is real at higher redshift, it will be another observational constraint for dissecting the size evolution models.
In this letter,we will use multiband data from the CLASH survey to search massive PEGs at . HST/WFC3 F160W-band images will be used to derive the sizes of PEGs. And complementary with the recent archive data, we will study size distribution at and size evolution with redshift. Throughout this letter, we assume a concordance CDM cosmology with , , km s-1Mpc-1. All magnitudes are in the AB systems.
2 Data and Sample Selection
The Cluster Lensing And Supernova survey with Hubble (CLASH) is an HST Multi-Cycle Treasury program that is acquiring images in 16 broad bands with the Wide Field Camera 3 (WFC3) UVIS and IR cameras, and the Advanced Camera for Surveys (ACS) for 25 clusters (Postman et al. 2012). The images are reduced and mosaiced ( pixel-1) using the MosaicDrizzle pipeline (Koekemoer et al.2011). Photometric redshifts are estimated for all the galaxies using the full 16-band photometry via both the BPZ (Benítez 2000) and LePhare (Arnouts et al. 1999) codes. In this letter, we use the released photometric catalog of 11 clusters 111http://archive.stsci.edu/prepds/clash/. We supplement the HST observations with Spitzer IRAC data. We use a software package with object template-fitting method (TFIT; Laidler et al. 2007) to measure IRAC photometry. TFIT uses the spatial positions and morphologies of objects in a high-resolution image to construct templates, which are then fitted to a lower resolution image. The fit can be simultaneously done for several close objects in a crowded field. We use the F160W band as the TFIT high-resolution template to measure the IRAC photometry.
Stellar masses and star formation rates (SFRs) are estimated from SED fitting to the full photometric data set (see Figure 1), assuming a Kroupa IMF (Kroupa 2001) and the BC03 stellar population models (Bruzual & Charlot 2003). We use a Bayesian-like code CIGALE 222http://cigale.oamp.fr/ (Noll et al. 2009) to carry out the SED fitting. As described in Noll et al. 2009 , an exponentially decreasing star formation history and a modified Calzetti attenuation law have been adopted (see Calzetti et al. 2000 for more details). The SED-derived stellar masses and SFRs are corrected by the foreground lens magnification factor. We simply adopt the spherical NFW (Navarro et al. 1997) model for the foreground cluster lens. The lensing properties of NFW halo can be calculated analytically for given position (Bartelmann 1996). The mass and concentration of the lens clusters are obtained from the literature (Umetsu et al. 2012, Zitrin et al. 2011, Gavazzi et al. 2003 and Kling et al. 2005). The detailed properties of the lens clusters are not taken into account, such as mass ellipticity, substructures, etc. The estimated magnifications may be slightly underestimated, especially for the clusters not long after merging.

We select passively evolving galaxies using a selection criterion based on sSFR, with sSFR, where is the Hubble time. As additional selection criteria, we also demand that the PEGs will be at and stellar masses . The final sample consists of ten galaxies. Our selection criterion is very close to those using a fixed sSFR (e.g. ). And we also check if our selection criterion is consistent with the color-color selection. We find eight out of ten PEGs in our sample fulfill the and color-color selection (Papovich et al. 2012). and colors correspond approximately to rest-frame vs. at , which Williams et al. (2009) showed can effectively separate passively evolving galaxies from star-forming galaxies.
| Cluster(a) | ID(b) | Ra(c) | Dec(c) | log | log sSFR(h) | n(i) | b/a(k) | ||||
|---|---|---|---|---|---|---|---|---|---|---|---|
| [deg] | [deg] | [arcsec] | [] | [yr-1] | [kpc] | ||||||
| MACSJ1206-08 | 1 | 181.53618 | -8.81180 | 64.7 | 1.83 | 1.998 | 10.85 | -11.15 | 6.3 | 1.4 | 0.39 |
| MACSJ0647+70 | 2 | 101.99016 | 70.26104 | 57.4 | 1.13 | 1.556 | 11.08 | -10.88 | 3.9 | 5.1 | 0.75 |
| MACSJ0647+70 | 3 | 101.99335 | 70.23792 | 55.6 | 1.15 | 1.941 | 10.99 | -11.23 | 3.1 | 0.9 | 0.50 |
| MACSJ0647+70 | 4 | 101.99383 | 70.23749 | 57.3 | 1.15 | 1.942 | 11.20 | -11.17 | 6.0 | 1.5 | 0.53 |
| MACSJ0744+39 | 5 | 116.21017 | 39.43837 | 74.0 | 1.14 | 2.276 | 10.88 | -10.91 | 1.8 | 0.7 | 0.62 |
| MS 2137-2353 | 6 | 325.07814 | -23.67539 | 71.2 | 1.38 | 1.534 | 10.74 | -11.16 | 2.2 | 1.0 | 0.36 |
| RXJ1347-1145 | 7 | 206.90139 | -11.74505 | 84.9 | 2.03 | 1.646 | 10.77 | -10.76 | 2.0 | 2.2 | 0.64 |
| RXJ1347-1145 | 8 | 206.86622 | -11.76696 | 64.1 | 3.30 | 1.811 | 10.56 | -11.27 | 4.5 | 2.0 | 0.32 |
| RXJ1347-1145 | 9 | 206.88078 | -11.77017 | 58.3 | 3.84 | 1.662 | 10.54 | -10.96 | 3.0 | 1.3 | 0.47 |
| MACSJ1149+22 | 10 | 177.40348 | 22.41853 | 74.4 | 1.09 | 2.007 | 11.04 | -11.13 | 4.0(l) | 0.9 | 0.87 |
(a): The foreground cluster; (b): ID of PEGs; (c): Right ascension and Declination of PEGs; (d): Projected angular distance of PEG from the cluster center; (e): The lensing magnification factor which is estimated by simply adopting the spherical NFW profile for the foreground cluster lens. The mass and concentration of the lens clusters are obtained from literature (Umetsu et al. 2012, Zitrin et al. 2011, Gavazzi et al. 2003 and Kling et al. 2005); (f): Photometric redshift of PEGs using BPZ ; (g): Stellar masses , which have been homogenized to BC03 models and Kroupa IMF ; (h): Specific star formation rate ; (i): Sersic index ; (j) : Effective radius, which has been corrected by the lensing magnification factor ; (k) : Axis ratio ; (l) : Sersic index is fixed to 4.0 .
3 Sizes of PEGs at
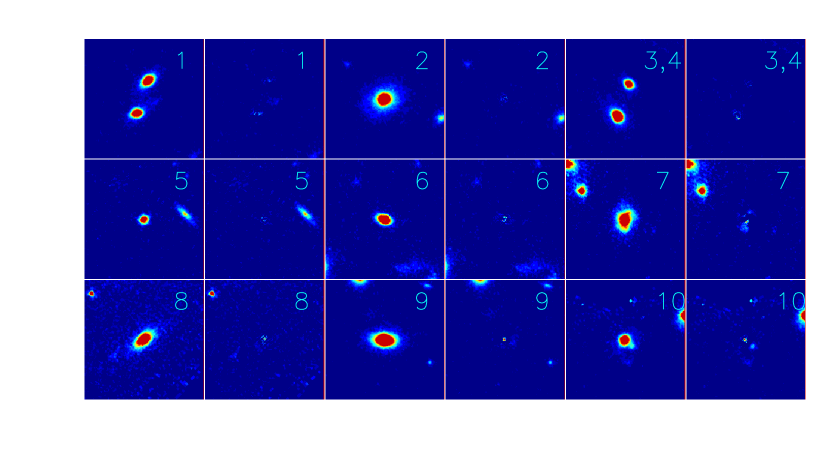
We use the GALFIT package (Peng et al. 2002) to fit Sérsic profiles to the PEGs in the HST F160W band. The fits are performed in a arcsec2 region (See Figure 2). Empirical PSFs instead of model PSFs are used in the fits. We obtain the empirical PSF for each cluster using PSFEx (Bertin 2011). PEG-1 is close to another galaxy. Two independent Sérsic models are simultaneously fitted to PEG-1 and its companion, respectively. We use the same procedure to fit PEG-3 and PEG-4 (both of them are PEGs). The Sérsic index n is fixed to 4 for PEG-10 in order to make the fit converge.
The observed images of high redshift PEGs in our sample have been lensed by the foreground clusters. We need to take the lens magnification into account in order to estimate the intrinsic sizes of PEGs. For simplicity, we assume that the lensed image has the same light profile as the source. Following the definition of the magnification factor , we have
| (1) |
where is the intrinsic angular size of the source image, is the measured angular size of the lensed image,both in unit of arcsec. is the lensing magnification factor estimated using the method introduced in the Section 2 (see Bartelmann & Schneider 2001 for more detail on lensing). The measured angular size from the best-fit Sérsic model is corrected using the formula in Equation 1 and then converted to physical size using photometric redshift.
4 Discussion

van der Wel et al. (2011) argued the majority of PEGs at in their sample were disk-dominated. We investigate this argument with our sample. Half of our PEGs have best-fitting axis ratios and six (PEG-1, PEG-3, PEG-4, PEG-6, PEG-8 and PEG-9) have (See Table 1). The axis ratio distribution indicates that a significant fraction of PEGs at may be disk-dominated. However, we find that Sérsic index are mostly greater than 2, indicating elliptical-like morphology. Only two galaxies (PEG-5 and PEG-7) have . We re-fit our PEGs with two Sérsic models. We fix the index of one Sérsic model to 4 to represent the bulge component and to represent the disk component. Two galaxies (PEG-7 and PEG-9) show a significant disk component with light in disk. The results by axis ratios and two-component model show that of PEGs at are disk-dominated in our sample.
In Figure 3, we plot the distribution of effective radius versus stellar mass for our PEGs sample at . In our sample, both stellar mass and effective radius are corrected by the lensing magnification factor. We also compare with the local relation (Shen et al. 2003) and other literature results with similar range of redshift and stellar masses (Cimatti et al. 2008, Cassata et al. 2010, Szomoru et al. 2012, Ryan et al. 2012 and Zirm et al. 2012). All stellar masses are homogenized to BC03 and Kroupa IMF. We find that our results are consistent with literature results at . Nine out of ten PEGs in our sample are below the local relation, with kpc. These galaxies are on average times smaller than the local counterparts with similar stellar masses. The compact sizes of high redshift PEGs can be formed naturally according to the dissipative collapse of baryons (see Fan et al. 2010).
In Figure 3, we find that the sizes of PEGs at span a wide range and need a significant evolution to catch up the local relation. Furthermore, we explore the size evolution with redshift combining our sample together with the literature data. We divide the combined data into two redshift bins, and . The former redshift bin includes 25 PEGs and the later bin has 31. The average stellar masses of both bins are . We adopt the local size-mass relation , where equals 0.56 by Shen et al. (2003). We plot the average mass-normalized sizes of two redshift bins in Figure 4 (filled squares). We also plot the local relation with shaded area in Figure 4. We use the relation to describe the redshift evolution. For the combined data, we have (See the dashed line in Figure 4). The value is in agreement with the result of Cimatti et al. (2012). They derived for the mass-normalized radius with . However, other results with steeper slope had been found from different samples. Using optical and near-infrared photometry in the UKIRT Ultra Deep Survey and GOODS-South fields of the CANDELS survey, Newman et al. (2012) found the size evolution of quiescent galaxies with redshift could be described as . This relation can be approximately rewritten as , with . Damjanov et al. (2011) found an even steeper value, . The sizes need to increase by a factor of for from to 0. While for , the sizes would increase by a factor of during the same comic epoch. The diversity of observed size evolution with redshift is at least partly due to the sparsity of data points at . A large number sample of PEGs at will be helpful to deicide the valid size evolution with redshift and constrain the different galaxy evolution models.

A relevant feature of the data for massive PEGs at high redshift is the quite large scatter of the size, as is apparent from Figures 3 and 4. We plot the size scatter () of two redshift bins in Figure 4. We find that the size scatter is large at in the combined data. The values of are 0.22 and 0.34 at and , respectively. Newman et al. (2012) showed a very similar result: 0.24 and 0.26 at and , respectively.In Figure 4, the error bars show 1 size scatter of two redshift bins and the shaded area reflects the distribution of local SDSS galaxies. Compared to the small size scatter of SDSS ETGs ( at ), the size scatter also needs a significant evolution with redshift (about a factor of from ).
Larger size scatter at higher redshift need to be accounted for by galaxy evolution models. If the observed size evolution with redshift is dominated by the dry minor merger, we will expect that more compact PEGs have higher dry merger rates relative to less compact objects at given redshift range. Another possibility is size evolution at could be dominated by AGN feedback. One assumption is that gas will be removed by the strong AGN feedback in a short timescale. In this case, galaxy structure after AGN feedback will relax to the new equilibrium. Another situation for AGN feedback mechanism is that the gas removal will not complete in only one single shot. Martizzi et al. (2012) used cosmological simulations to show the effect of AGN feedback on the gas distribution in the central regions of cluster galaxies. They found gas heated and expelled by AGN feedback can return after cooling; repeated cycles could modify the stars and dark matter mass profile. During the cycles, the observed sizes will oscillate from compact (all gas is located within the central regions of galaxies) to normal (gas is expelled from the galaxy center). This produces the large size scatter observed at high redshift, and the size scatter will be related to AGN activities which decrease from to . For AGN feedback mechanism, larger gas fraction at higher redshift will also be needed in order to explain the observed size scatter evolution. Most recently, Olsen et al. (2012) found the ubiquitous presence of AGN in massive, quiescent galaxies. This result provided observational indications for the important role AGN played in explaining the size (and size scatter) evolution.
It should be noticed that the lensing magnification correction that we adopted is simple, which may introduce uncertainties as well. However, the uncertainty on the lensing magnification may not significantly alter our main results above. The corrected stellar mass is proportional to , while the corrected effective radius is proportional to . As decreases/increases, the location on the size-mass plane will move along the directions shown by arrows in Figure 3. The arrows () nearly parallel to the local size-mass relation (). So the uncertainty of will have a small effect on the mass-normalized effective radius. For instance, the mass-normalized effective radius with will only change by a factor of when increases by a factor of two.
5 Summary
In this letter, we use the CLASH survey data to select a massive, lensed PEGs sample at , based on the SED-fitting sSFR and accurate photometric redshift. We deduce the optical rest-frame effective radius of these high redshift objects using GALFIT. Combined with literature data, we find the size evolution of passively evolving galaxies scales with redshift as . We confirm that their sizes have a large spread. The 1- scatter of the size distribution is 0.22 and 0.34 at and , which is about 1.4 and 2.1 times larger than the local value (), respectively. The observed large size scatter has to be carefully taken into account in galaxy evolution model predictions.
Acknowledgements
We thank the anonymous referee for the careful reading and the valuable comments that helped improving our paper. We thank Prof. Wei Zheng for discussion on CLASH data. We also thank Prof Xianzhong Zheng and Dr. Xinwen Shu for valuable suggestions on Spitzer IRAC data analysis. This work has been supported by the Chinese National Science Foundation (NSFC-11203023) and Chinese Universities Scientific Fund (WK2030220004). L.F. thanks the partly financial support from the China Postdoctoral Science Foundation (Grant No.:2012M511411). We specially thank the CLASH team making the catalogues and images available for public. This work is also partly based on archival data obtained with the Spitzer Space Telescope.
References
- [Arnouts et al. (1999)] Arnouts, S., Cristiani,S., Moscardini, L., et al. 1999, MNRAS, 310, 540
- [Bartelmann (1996)] Bartelmann, M. 1996, A&A, 313, 697
- [Bartelmann & Schneider(2001)] Bartelmann, M., & Schneider, P. 2001, Physics Reports, 340, 291
- [Benítez (2000)] Benítez, N. 2000, ApJ, 536, 571
- [Bertin (2011)] Bertin, E. 2011,Astronomical Data Analysis Software and Systems XX, 442, 435
- [Bruzual & Charlot (2003)] Bruzual, G., & Charlot, S. 2003, MNRAS, 344, 1000
- [Calzetti et al.(2000)] Calzetti, D., Armus,L., Bohlin, R. C., et al. 2000, ApJ, 533, 682
- [Cassata et al. (2010)] Cassata, P.,Giavalisco, M., Guo, Y., et al. 2010, ApJL, 714, L79
- [Cassata et al. (2011)] Cassata, P.,Giavalisco, M., Guo, Y., et al. 2011, ApJ, 743, 96
- [Cimatti et al. (2008)] Cimatti, A., Cassata, P., Pozzetti, L., et al. 2008, A&A , 482, 21
- [Cimatti et al. (2012)] Cimatti, A., Nipoti, C., & Cassata, P. 2012, MNRAS , 422, L62
- [Daddi et al. (2005)] Daddi, E., Renzini, A.,Pirzkal, N., et al. 2005, ApJ, 626, 680
- [Damjanov et al. (2009)] Damjanov, I.,McCarthy, P., Abraham, R., et al. 2009, ApJ, 695, 101
- [Damjanov et al. (2011)] Damjanov, I., Abraham, R. G., Glazebrook, K., et al. 2011, ApJL, 739, L44
- [] Fan, L., Lapi, A., De Zotti, G., & Danese, L. 2008, ApJL,689, L101
- [] Fan, L., Lapi, A., Bressan, A., et al. 2010, ApJ, 718, 1460
- [Gavazzi et al.(2003)] Gavazzi, R., Fort, B., Mellier, Y., et al. 2003, A&A, 403, 11
- [Hopkins et al. (2010)] Hopkins, P. F., Bundy,K., Hernquist, L., et al. 2010, MNRAS, 401, 1099
- [Kling et al.(2005)] Kling, T. P.,Dell’Antonio, I., Wittman, D., & Tyson, J. A. 2005, ApJ, 625, 643
- [Koekemoer et al. (2011)] Koekemoer, A., Faber, S., Ferguson, H., et al. 2011, ApJS, 197, 36
- [Kriek et al.(2008)] Kriek, M., van der Wel,A., van Dokkum, P., et al. 2008, ApJ, 682, 896
- [Kroupa (2001)] Kroupa, P. 2001, MNRAS , 322,231
- [Laidler et al. (2007)] Laidler, V. G.,Papovich, C., et al. 2007, PASP, 119, 1325
- [] Naab, T., Johansson, P., & Ostriker, J. 2009, ApJ, 699, L178
- [Martizzi et al. (2012)] Martizzi, D.,Teyssier, R., & Moore, B. 2012, arXiv:1211.2648
- [Navarro et al. (1997)] Navarro, J. F., Frenk,C. S., & White, S. 1997, ApJ, 490, 493
- [Newman et al.(2010)] Newman, A., Ellis, R., Treu, T., et al. 2010, ApJL, 717, L103
- [Newman et al. (2012)] Newman, A., et al. 2012, ApJ , 746, 162
- [Nipoti et al.(2012)] Nipoti, C., Treu, T., et al. 2012, MNRAS, 422, 1714
- [Noll et al. (2009)] Noll, S., Burgarella, D., et al. 2009, A&A, 507, 1793
- [Papovich et al.(2012)] Papovich, C., Bassett,R., Lotz, J. M., et al. 2012, ApJ, 750, 93
- [Pardos Olsen et al. (2012)] Olsen, P. , K.,Rasmussen, J., et al. 2012, arXiv:1212.1158
- [] Peng, C., Ho, L., Impey, C., et al. 2002, AJ, 124, 266
- [] Postman, M., Coe,D., Benitez,N., et al. 2012, ApJS,199,25
- [Ragone-Figueroa & Granato (2011)] Ragone-Figueroa, C., & Granato, G. L. 2011, MNRAS, 414, 3690
- [Renzini (2006)] Renzini, A. 2006, ARA&A, 44, 141
- [Ryan et al. (2012)] Ryan, R., Jr.,McCarthy, P., Cohen, S., et al. 2012, ApJ, 749, 53
- [Saracco et al. (2009)] Saracco, P., Longhetti,M., & Andreon, S. 2009, MNRAS, 392, 718
- [Shen et al. (2003)] Shen, S., Mo, H. J.,White, S. D. M., et al. 2003, MNRAS, 343, 978
- [Szomoru et al. (2012)] Szomoru, D., Franx, M.,& van Dokkum, P. 2012, ApJ , 749, 121
- [Toft et al. (2007)] Toft, S., van Dokkum, P.,Franx, M., et al. 2007, ApJ, 671, 285
- [Trujillo et al. (2006)] Trujillo, I., Feulner,G., Goranova, Y., et al. 2006, MNRAS, 373, L36
- [Umetsu et al.(2012)] Umetsu, K., Medezinski, E., et al. 2012, ApJ, 755, 56
- [van der Wel et al. (2008)] van der Wel, A., Holden, B., Zirm, A., et al. 2008, ApJ, 688, 48
- [van der Wel et al. (2011)] van der Wel, A., Rix, H.-W., Wuyts, S., et al. 2011, ApJ, 730, 38
- [van Dokkum et al. (2008)] van Dokkum, P., Franx, M., Kriek, M., et al. 2008, ApJL, 677, L5
- [Williams et al.(2009)] Williams, R.,Quadri, R., Franx, M.,et al. 2009, ApJ, 691, 1879
- [Zirm et al. (2012)] Zirm, A. W., Toft, S.,& Tanaka, M. 2012, ApJ , 744, 181
- [Zitrin et al.(2011)] Zitrin, A., Broadhurst,T., Barkana, R.,et al. 2011, MNRAS, 410, 1939