The mid-infrared environments of 6.7 GHz Methanol Masers from the Methanol Multi-Beam Survey
Abstract
We present a study of the mid-infrared environments and association with star formation tracers of 6.7 GHz methanol masers taken from the Methanol Multi-Beam (MMB) Survey. Our ultimate goal is to establish the mass of the host star and its evolutionary stage for each maser site. As a first step, the GLIMPSE survey of the Galactic Plane is utilised to investigate the environment of 776 methanol masers and we find that while the majority of the masers are associated with mid-infrared counterparts, a significant fraction (17%) are not associated with any detectable mid-infrared emission. A number of the maser counterparts are clearly extended with respect to the GLIMPSE point spread function and we implement an adaptive non-circular aperture photometry (ANCAP) technique to determine the fluxes of the maser counterparts. The ANCAP technique doubles the number of masers with flux information at all four wavelengths compared to the number of the corresponding counterparts obtained from the GLIMPSE Point Source Catalogue. The colours of the maser counterparts are found to be very similar to the smaller study carried out by Ellingsen (2006). The MMB masers are weakly associated with Extended Green Objects (EGOs) and Red MSX Survey (RMS) embedded sources (YSO and HII classifications) with 18% and 12% of masers associated with these objects respectively. The majority of MMB masers (60%) have detectable GLIMPSE infrared counterparts but have not been identified with previously recognised tracers of massive star formation; this confirms that the MMB survey has the potential to identify massive star forming regions independent of infrared selection.
keywords:
surveys - masers - infrared:stars - radio lines:stars - stars:formation - techniques:photometric1 Introduction
Massive stars (M) are a key component in the evolution of the Interstellar Medium (ISM). They provide the bulk of the radiation that ionizes the ISM and transfer kinetic energy into the ISM via stellar winds, outflows and supernovae. This injection of energy may trigger new generations of star formation (e.g. Elmegreen, 1992). Yet our understanding of the formation of massive stars is very limited in contrast to low mass star formation. This is due in part to the rarity of high mass stars but also to their large distances from the Sun (typically 1 kpc) and their very brief pre-main sequence lives. Massive stars enter the main sequence before accretion has finished and therefore whilst still deeply embedded in an obscuring dusty nebula (Garay & Lizano, 1999; Zinnecker & Yorke, 2007). Due to the observational difficulty in identifying the brief and rare early stages of massive star formation, it has been only within the last decade that massive young stellar objects (MYSOs) and high mass “protostellar objects” (HMPOs111as these objects are likely hydrogen-burning they should strictly not be referred to as “protostellar” but we reproduce here the original acronym of Beuther et al. (2002) to avoid confusion.) have been identified in large numbers (e.g. Lumsden et al., 2002; Beuther et al., 2002; Urquhart et al., 2011).
Despite these limitations a tentative evolutionary sequence for massive star formation has emerged. The sequence commences with a sub-millimetre bright cold core with a typical diameter of pc, a mass of and a typical temperature of 10-20 K, embedded within a much larger molecular clump 1000 M⊙ which in turn is embedded within a giant molecular cloud. The presence of an Infrared Dark Cloud (IRDC) is often observed at this point (Simon et al., 2006; Peretto & Fuller, 2009; Kauffmann & Pillai, 2010; Peretto et al., 2010; Peretto & Fuller, 2010), but the detection of an IRDC is dependent upon observing the cloud against a diffuse mid-infrared background. The core collapses into a hydrostatically supported optically thick protostellar embryo which then accretes material from the core, most likely via a circumstellar disk. The onset of the main sequence does not halt the accretion, which continues until the young massive star is hot enough to produce ionizing UV photons. These photons ionize the surrounding material, creating an HII region. Initially the HII region is gravitationally bound (Keto, 2003) but as the ionizing flux rises the surrounding hot core is unable to contain it gravitationally.
At this point the inflow of material becomes important in quenching the expansion of the HII region. The ionized gas is contained as a 10000 AU diameter bubble (Kurtz, 2005) and is observed in the radio waveband as a Hyper Compact HII (HCHII) region. During this phase the material trapped within the HCHII region continues to accrete. Eventually a combination of reduced inflow and increased UV flux results in the HCHII expanding to form an Ultra Compact HII (UC HII) region (Hoare et al., 2007) and as a consequence any further accretion may be terminated. The UCHII region continues to expand, with the rate of expansion and final size and morphology being determined by the mass of the driving core and the density of the surrounding ambient material (Ellingsen, Shabala & Kurtz, 2005). Finally, the ionizing source becomes visible as a main sequence massive star (Hoare et al., 2007; Purcell, 2006; Keto, 2003; Motte et al., 2008; Wood & Churchwell, 1989, and references therein).
One of the principal tracers of massive star formation is the 6.7 GHz Class II methanol maser (Menten, 1991), thought to be exclusively associated with massive star formation (Minier et al., 2003; Cragg, Sobolev & Godfrey, 2005; Ellingsen, 2006; Walsh et al., 1999; Green et al., 2012) and to primarily trace the stage between the infrared-dark phase and the UC HII region (Van der Walt, 2005; Ellingsen, 2006). Whilst much work has been recently carried out on the evolutionary period of star formation traced by the Class II methanol masers (e.g. Breen et al., 2011; Breen & Ellingsen, 2011; Ellingsen et al., 2011; Breen et al., 2010a, b) a number of details remain unclear, particularly the minimum bolometric luminosity traced by the masers (Minier et al., 2003; Xu et al., 2008) and the relationship between the masers and their wider infrared environment. In part this is due to the historical lack of an unbiased and large sample of masers with positions sufficiently precise to allow reliable identification with infrared and sub-mm counterparts. Many of the presently known methanol masers were discovered via large-beam single dish observations of IRAS point sources (see Pestalozzi et al. 2007 for a compilation of detected masers), hence are both biased towards bright far-infrared sources and do not have positions measured to an accuracy of better than an arcminute or so. Most of the infrared/maser comparison studies that have been carried out so far are limited to small samples of masers whose positions have been measured interferometrically or inferred by other means (e.g. Ellingsen, 2006; Pandian et al., 2010).
These constraints have now been addressed by the Methanol Maser Multi-Beam (MMB) Survey: a deep, high resolution, untargeted survey of the Galactic Plane and Magellanic Clouds with the goal of providing the first comprehensive catalogue of Class II 6.7 GHz methanol masers (Green et al., 2009; Caswell et al., 2010; Green et al., 2010; Caswell et al., 2011; Green et al., 2012). The 6.7 GHz methanol masers were first found using a multi-beam receiver on Parkes and then individually re-observed with the ATCA and Merlin interferometers to obtain sub-arcsecond positions (see Green et al., 2009, for further details of the survey strategy). The Parkes MMB survey region encompasses and (Green et al., 2009), with plans to later extend the survey to the Northern Galactic Plane. With this two step approach the MMB Survey will provide an essentially complete survey of 6.7 GHz methanol masers in the Galaxy, each with positional accuracy suitable for follow-up comparison studies in the infrared and sub-mm.
In this paper we describe a follow-up study which has been carried out with an interim MMB catalogue of 824 6.7 GHz masers and the GLIMPSE (Galactic Legacy Infrared Mid-Plane Survey Extraordinaire) infrared survey of the Galactic Plane (Benjamin et al., 2003). The GLIMPSE survey (including the individual I, II and 3D surveys) covers and approximately in 4 infrared bands (3.6, 4.5, 5.8 and 8.0 m respectively and usually referred to as Bands 1 to 4 in that order) with the IRAC camera on Spitzer.
Our interim catalogue is derived from those masers that had been interferometrically positioned at the time this work was carried out. The interim catalogue includes 684 masers in the longitude range that have already been published in Caswell (2009), Caswell et al. (2010), Green et al. (2010), Caswell et al. (2011) and Green et al. (2012)222The MMB catalogue is available at http://astromasers.org. The remaining 140 masers lie in the longitude range and will be reported in a further publication (Fuller et al., 2012, in prep). Note that our interim catalogue does not include 23 masers from the published catalogue whose positions had not yet been interferometrically determined at the time this work was carried out.
Using GLIMPSE we seek to identify the infrared counterparts of the masers so that we may investigate both their environment (i.e. are the masers preferentially found towards infrared dark regions such as IRDCs?), the colours of the maser counterparts and the likely nature of their exciting sources. This work builds upon that of Ellingsen (2006) but with a much larger sample of masers and an aperture photometry approach that is not biased to the limitations of the GLIMPSE point source catalogue in regions of crowding or high background. Future publications will examine the spectral energy distributions and infrared luminosities of the masers (using MIPSGAL, Hi-GAL and ATLASGAL data; Carey et al. 2009a; Molinari et al. 2010a; Schuller et al. 2009), and their association with other tracers of massive star formation. Preliminary work in characterising the nature of the MMB masers is included in the present paper from comparisons with the Red MSX Source (RMS) survey (Urquhart et al., 2011, 2008; Lumsden et al., 2002).
2 Method
The process of comparison with the GLIMPSE survey was performed in two ways: a detailed inspection of GLIMPSE cut-out images centred on each maser and a positional cross-match of the maser coordinates with the GLIMPSE point source catalogues, similar to that performed by Ellingsen (2006). The first method allows a detailed investigation of the appearance of the maser counterparts and the wider environments in which the masers are found, whereas the second method permits the study of the infrared colours of a large sample of masers. We use the GLIMPSE I, II & 3D survey data and images for maximum areal coverage.
The GLIMPSE Point Source Catalogue contains 69.7 million sources extracted from the GLIMPSE I, II & 3D images which are considered to be high reliability (99.5%) point sources (Churchwell et al., 2009). A less reliable but more complete GLIMPSE Point Source Archive (GPSA) contains some 104 million point sources. In order to be included in the GPSC each source must be a point source that is detected at least twice in one wavelength band and once in an adjacent wavelength band (referred to as the “2+1” criteria) with a signal-to-noise of greater than 5 for both detections. The criteria for the remaining bands are relaxed to be either or upper limits. For the GPSA the 2+1 criteria are relaxed to a detection twice in any one wavelength band or once in two adjacent wavelength bands, resulting in a more complete but less reliable catalogue of point sources.
We cross-matched the MMB catalogue to the GPSC and GPSA using a 2″ matching radius (for discussion of this particular selection see Sect. 2.2). Within the GLIMPSE I, II & 3D survey area the MMB catalogue contains 776 6.7 GHz Class II methanol masers. When cross-matching against the GLIMPSE catalogues we find 430 of these masers with counterparts in the GPSC and 519 with counterparts in the GPSA (note that the GPSA contains all sources found in the GPSC cross-match, i.e. the GPSC is a more reliable subset of the GPSA).
However, less than half of these sources have detections in all 4 wavelength bands (219 sources from the GPSC and 253 from the GPSA) and only 75% have detections in any 3 GLIMPSE bands. This is an inevitable outcome of the GLIMPSE point source detection algorithm which, although highly successful in the detection of stellar point sources, may not be optimised for the crowded and complex environments of massive star fomation (see Sect. 2.2 of Robitaille et al., 2008, and references therein for further discussion). Visual inspection of the GLIMPSE cut-out images confirmed that this is indeed the case; the majority of MMB masers were associated with emission in all 4 bands, in many cases with nebulous emission or emission extended beyond the Spitzer PSF, that is not catalogued within the GPSC or GPSA.
As the primary aim of our work is to obtain accurate mid-infrared colours of the MMB masers we have implemented an adaptive non-circular aperture photometry technique (referred to as ANCAP) to measure the fluxes of masers in all four IRAC bands. In Sect. 2.1 we describe our visual inspection and classification methods, followed by our aperture photometry technique in Sect. 2.2. Finally we inspect the relationship between MMB masers and a number of other published catalogues of star formation tracers (e.g. Red MSX Survey objects, Urquhart et al. (2011), and Extended Green Objects, Cyganowski et al. (2008)) in Sect. 2.3.
2.1 Visual inspection of GLIMPSE images
GLIMPSE 12 arcminute FITS cut-out images were obtained for all four IRAC bands via the NASA/IPAC Gator database query tool, with each image centred on an MMB maser. We select images of this size as it is the typical angular size of many IRDC complexes (e.g. Peretto & Fuller, 2009; Simon et al., 2006) and star forming complexes/Giant Molecular clouds (e.g. Solomon et al., 1987). RGB images were generated by a script with IRAC bands 1, 2 and 4 (i.e. 3.6, 4.5 and 8 m) represented by blue, green and red, respectively and overlaid with the MMB catalogue. The RGB images were used to classify the maser counterparts by environment and extension, in addition to the identification of masers associated with Extended Green Objects (EGOs), Infrared Dark Clouds (IRDCs) and infrared clusters.
IRDCs have high levels of extinction, often , and appear as dark “holes” within the diffuse 8.0 m emission associated with Polycyclic Aromatic Hydrocarbons (PAHs) (Parsons, Thompson & Chrysostomou, 2009; Simon et al., 2006; Peretto & Fuller, 2009; Egan et al., 1998). We identify IRDCs in the GLIMPSE images by the absence of background 8.0 m emission and a reduction in the number of background stars. Given the often irregular and filamentary appearance of IRDCs (Simon et al., 2006; Peretto & Fuller, 2009), visual associations of masers and IRDCs are usually more accurate than simple nearest-neighbour matching (see e.g. Parsons, Thompson & Chrysostomou, 2009) and so we choose the visual approach here.
For EGOs and infrared clusters our visual search is complementary to positional cross matches against the Cyganowski et al. (2008) EGO and (Mercer et al., 2005; Bica & Bonatto, 2008; Froebrich, Scholz & Raftery, 2007) cluster catalogues. By visually examining the GLIMPSE cutouts we can search for associated EGOs and/or clusters that may have been missed in the catalogues. EGOs are identified by the presence of bright green extended emission in the cutout images, using a similar process to that employed by Cyganowski et al. (2008). Infrared clusters and cluster candidates are identified by inspecting the GLIMPSE images and, where available, UK Infrared Deep Sky Survey (UKIDSS) Galactic Plane Survey images (Lucas et al., 2008). We identify clusters via local overdensities of infrared stars, taking as a lower limit the presence of at least 10 stars as cluster members, and with the maser lying within the projected bounds of the cluster.
2.2 Adaptive Non-circular Aperture Photometry of the maser counterparts
We have implemented an adaptive non-circular aperture photometry (ANCAP) technique to measure the fluxes of extended infrared counterparts to the masers and provide as large a sample of masers with fluxes in all 4 GLIMPSE bands as possible. Our technique is based on that used by Cyganowski et al. (2008) to measure the fluxes of EGOs within the GLIMPSE image archive. The “region” feature of the SAO DS9 FITS viewer was used to draw non-circular apertures around our sources. The counterparts are identified by the presence of a co-located peak in all four IRAC bands within 2 arcseconds of the maser, a radius selected to be consistent with previous studies by Ellingsen (2006) and the typical resolution of IRAC wavelength band 4 (8 m). If a clear peak cannot be identified in all four bands within 2″ of the maser we do not undertake photometry for this maser, to avoid including local regions of nebulosity which may encompass large areas and multiple shorter wavelength sources. By utilising all four bands to identify the counterpart the rate of misidentification is reduced. In the case where there is more than one possible counterpart we also make no measurement, to avoid confusion.
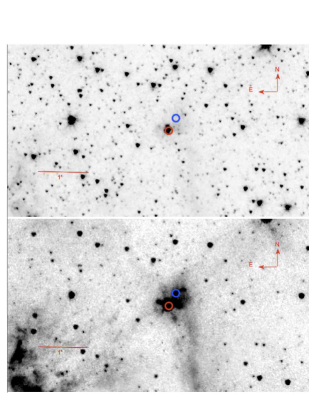
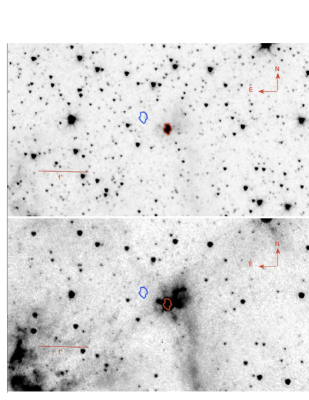
Figure 1 illustrates the process used in identifying the infrared counterpart. In this example there are two masers in the field, marked by the red and blue circles in each frame. If we used only the band 4 image to determine our association we would incorrectly associate both masers with the large “double-lobed” object. However by inspecting the band 1 image we see that in fact only the maser marked with the red circle is associated with a source with flux in all four bands. In our example, Figure 1 bands 3 and 4 would be rejected for aperture size and shape determination, due to the likelihood of contamination. In this case band 2 would be used for this function.
The aperture shapes are selected to avoid contamination from field sources, whilst containing as much flux as possible. Preference is given to band 4 when choosing the aperture shape, although in cases where selecting the aperture in band 4 causes avoidable contamination band 3 is used instead. The background is removed by subtracting the mean level contained in an identically sized aperture located in an area of the image representative of the background local to the maser source. Both aperture and background regions are constant in size, shape and position across all four bands. The aperture sizes used are typically less than 20″ in radius. The DS9 funtools plugin (http://www.cfa.harvard.edu/~john/funtools/ds9.html) allows us to integrate the flux in both regions and thereby obtain a raw flux to which we applied unit, scale and aperture corrections as outlined in the IRAC cookbook (http://ssc.spitzer.caltech.edu/postbcd/irac_reduction.html). Figure 2 shows a set of IRAC images overlaid with the region which make up the aperture and the background.
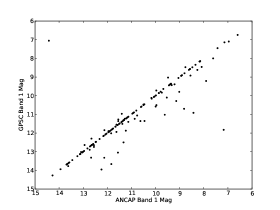
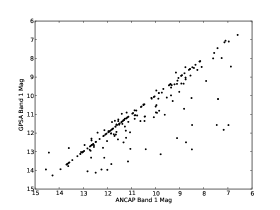
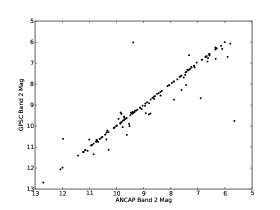
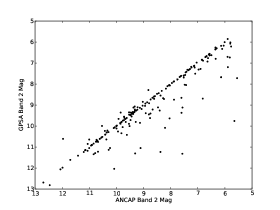
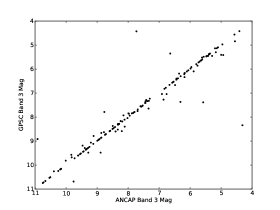
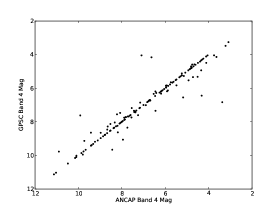
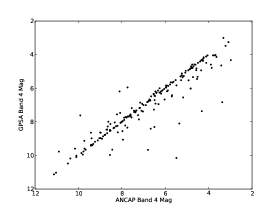
In order to confirm the reliability of our measured aperture fluxes we compare against those sources that are also contained in the GLIMPSE Point Source Catalogue (GPSC) and the GLIMPSE Point Source Archive (GPSA). Within our sample of aperture photometry measurements there are 200 sources in common with the GPSC and 300 sources in common with the GPSA (the exact number in common varies from band to band). Plots of the aperture measured magnitudes (ANCAP) versus the GPSC and GPSA magnitudes at each waveband are shown in Figure 3. For the majority of sources in common with the GPSC and GPSA we measure magnitudes that are in either close agreement or up to a few magnitudes brighter than tabulated in the Catalogue or Archive (note that the typical magnitude errors in the GPSC and GPSA are 0.2 mag). The latter sources are consistent with those that our technique identifies as extended objects, hence the GPSC and GPSA have underestimated the total flux of these objects. We also identify a few objects (10 in total) within the common sample where our aperture photometry measurements are fainter than those from the GPSC or GPSA. In general these objects lie within regions of complex background and, as our background subtraction method differs substantially from that used by GLIMPSE (which determines the background via annular regions using DAOPHOT333See http://www.astro.wisc.edu/glimpse/glimpse_photometry_v1.0.pdf for more details on this process.), it is likely that the discrepancy in measurements is caused by different background subtraction. In any case the fraction of sources affected in this way is small (5%) and so we are confident that our aperture photometry technique yields good results for the majority of sources.

2.3 Cross-matches with other catalogues: RMS, EGO and infrared clusters
Earlier lower angular resolution investigations overlap extensively with the GLIMPSE/MMB region studied here. In particular, there has been intensive study of red objects selected from the MSX survey (Lumsden et al., 2002), which has yielded the Red MSX Source (RMS) survey catalogue (e.g. Urquhart et al., 2008, 2011). The RMS catalogue is the result of a Galaxy-wide search for Massive Young Stellar Objects (MYSO) and contains over 2000 objects that have been classified as either Young Stellar Objects (YSO), compact or ultracompact HII regions, OH/IR stars or evolved stars based on their IR morphology, free-free radio emission, distance and luminosity. The RMS catalogue and its construction are detailed in Urquhart et al. (2008, 2011) and available at http://ast.leeds.ac.uk/RMS.
A cross-match of MMB masers with the RMS catalogue has been made to identify the subset of MMB sources categorized in the RMS catalogue as YSOs or HII regions. The properties of even a small sample of these well-studied objects can then yield insights as to the likely nature of the less-well-studied majority of MMB sources. Within the region covered by both the MMB and RMS surveys there are 983 RMS objects of HII region or YSO classification and 673 MMB masers. Note that the RMS does not cover the inner region of the Galaxy () and the MMB catalogue does not currently extend beyond longitude . Although the RMS objects were discovered by MSX colour selection and initially had a positional accuracy of 18″, all of the catalogue objects have since had more accurate positions determined from GLIMPSE or by dedicated near- or mid-IR imaging (Mottram et al., 2007; Urquhart et al., 2008). We thus selected a cross-matching radius of 2″ to identify RMS objects associated with MMB masers.
EGOs are extended bright objects with excess emission at 4.5 m (IRAC band 2), often coloured green in three colour IRAC images (Cyganowski et al., 2008). They are thought to identify emission from shocked molecular gas via the presence of either CO bandhead or shocked H2 lines (Cyganowski et al., 2009), with shocked H2 emission recently confirmed in at least one object (De Buizer & Vacca, 2010). Cyganowski et al. (2008) have compiled a visually identified catalogue of EGOs drawn from the GLIMPSE survey, with later VLA follow-up showing a high incidence of these EGOs with Class II 6.7 GHz methanol masers (18 out of 28 searched). Here, we perform the inverse of the Cyganowski et al. (2009) search by identifying MMB masers associated with EGOs to test the assertion of Cyganowski et al. (2009) on a much larger sample of masers. We identify EGOs associated with MMB masers by cross-matching against the Cyganowski et al. (2008) catalogue using a matching radius of 2″.
The visual search process that we employed to find infrared clusters and cluster candidates might be expected to include objects that are merely asterisms rather than bona fide clusters and to assist in the identification of clusters we also included a positional cross-match with catalogues of known clusters. The cluster catalogues of Mercer et al. (2005), Bica & Bonatto (2008) and Froebrich, Scholz & Raftery (2007) were used, plus the the UKIDSS DR4 cluster catalogue of 477 clusters (Lucas et al., in preparation). To take into account the typical angular diameter of the infrared clusters our matching radius was set to 1′.
3 Results
3.1 Visual Inspection and catalogue cross-matching
Of the 776 masers within the GLIMPSE I, II & 3D survey region, seven masers could not be used for the visual inspection process due to the maser falling slightly outside the coverage of individual images. For the remaining 769 masers we find that they are located in one of the four following broad categories:
-
1.
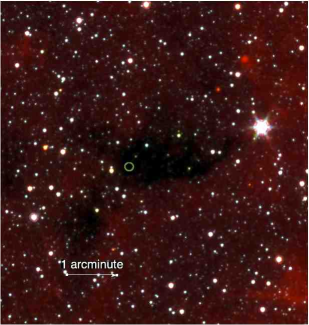
Masers embedded within an IRDC with no IRAC counterpart. Hence they are infrared-dark at IRAC wavelengths due to extinction (or the lack of infrared emission). This represents 5% (37) of our maser counterparts. Figure 4 shows a typical example of this category.
-
2.
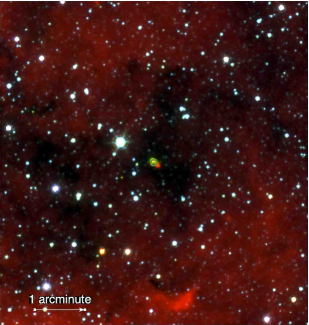
Masers that are located within, or are located on the perimeter of an IRDC but have a visible IRAC counterpart and therefore are infrared-bright. This class represents 21% (164) of our sample of maser counterparts. Figure 5 shows a typical example of this category.
-
3.
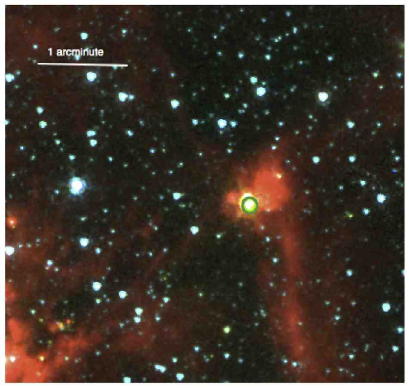
Masers that are infrared-bright and not located within an IRDC. This class contains 62% (473) of our sample. Figure 6 shows a typical example.
-
4.
Masers that are infrared-dark (they have no identifiable counterpart in any band) but are not located within an Infrared Dark Cloud. Our examination indicates that 12%(95) of our objects are of this type.
We identify a total of 112 EGOs associated with 608 MMB masers located within the GLIMPSE I survey area (note that the Cyganowski et al. 2008 catalogue is comprised of EGOs found only in the GLIMPSE I images) that had good imaging data. All associated EGOs were found as a result of positional matching against the Cyganowski et al. (2008) catalogue. The visual search described in Sect. 2 did not identify any more EGOs than the corresponding visual search of Cyganowski et al. (2008), suggesting that the Cyganowski et al. (2008) catalogue of 304 EGOs is largely complete (at least towards 6.7 GHz masers). Our results imply that 18% of masers are associated with EGOs, with the implication that EGO-targeted searches would only be able to find 18% of the masers. Conversely, we find that the fraction of EGOs that have a 6.7-GHz maser counterpart is 37%. but varies according to the Cyganowski et al. (2009) EGO classification as ’likely to be a massive YSO outflow’ or ’possibly’. With this distinction, we find 25% (41/165) of the ’possible’ EGOs are associated with an MMB maser, increasing to 52% (69/133) for ’likely’ EGOs. The latter statistic is in agreement with a small sample investigation by Cyganowski et al. (2009), yielding 18 methanol masers towards 28 ’likely’ outflow EGOs, although their result was biased by the EGO sample preferentially containing several known masers.
The combined infrared cluster catalogue used to cross match with the MMB contains 118 clusters and cluster candidates within the region covered by our maser sample. It is found that eight masers are located within one arcminute of these clusters. Our cross matching with the early results of the UKIDSS Cluster search (Lucas et al., in prep.) shows that only six more MMB masers, out of 306 that are currently covered in the region examined, are within 1 arcminute of a cluster or cluster candidate. Thus the total number of masers that are found within 1′ of an infrared clusters (or candidates) is 14.
We find a total of 82 MMB masers within 2″ of an RMS object. Within the overlapping region common to both MMB and RMS surveys there are 983 RMS objects (of type HII region or YSO) and 673 masers, thus the detection fractions of maser-associated RMS objects and RMS-associated MMB masers are 8% and 12% respectively. Of the 82 MMB masers matched to an RMS object 56 are associated with type “YSO or YSO?”, 22 with “HII regions”, 2 with “UC HII regions” and 2 with “HII/YSO” blends. We did not find any associations between MMB masers and the evolved star categories in the RMS survey.
3.2 Adaptive Non-circular Aperture Photometry
As previously mentioned, there are 769 masers from the MMB survey with available GLIMPSE images in all 4 wavelength bands. Using the method described in Sect. 2.2 we successfully managed to obtain aperture photometry in all four GLIMPSE bands toward a total of 512 masers. The remaining 257 masers either had no detectable counterpart to a level of 5 (as in categories i) and iv) in Sect. 2.2, a total of 132 masers) or were in regions too confused to reliably identify an infrared counterpart in all four bands (a total of 125 masers). A simple positional association with the GLIMPSE Point Source Catalogue (GPSC) or Archive (GPSA) results in a total of 219 and 253 masers respectively with infrared counterparts measured at all four wavelength bands (see Sect. 2). Hence our adaptive non-circular photometric method more than doubles the number of masers with known infrared counterparts measured at all four bands over catalogue-based searches.
We list the measured magnitudes for a representative sample of the infrared counterparts to the MMB masers in Table 1. The full version of this Table is contained in the Online Supplement and comprises infrared counterparts to 626 masers published in Caswell (2009), Caswell et al. (2010), Green et al. (2010), Caswell et al. (2011) and Green et al. (2012). We will publish the magnitudes of the remaining infrared counterparts simultaneously with the positions and fluxes of the 6.7 GHz masers (Fuller et al. 2013, in prep). All statistics and figures of the infrared counterparts presented in this paper refer to the full interim catalogue of 769 masers.
| Source name | Equatorial coordinates | ANCAP Magnitudes | Morphology | ||||
| (, ) | RA (2000) | Dec. (2000) | 3.6 m | 4.5 m | 5.8 m | 8.0 m | Class |
| (°°) | (h m ss.s) | (°′″) | |||||
| 312.108+0.262 | 14 08 49.31 | -61 13 25.1 | 11.2 | 9.5 | 9.3 | 9.7 | 3 |
| 312.307+0.661 | 14 09 24.95 | -60 47 00.5 | 9.9 | 8.6 | 7.4 | 5.9 | 3 |
| 312.501-0.084 | 14 12 48.95 | -61 26 03.2 | 10.7 | 9.8 | 8.0 | 6.7 | 3 |
| 312.597+0.045 | 14 13 14.35 | -61 16 57.7 | 11.5 | 9.8 | 9.0 | 8.4 | 3 |
| 312.598+0.045 | 14 13 15.03 | -61 16 53.6 | 11.6 | 10.0 | 8.5 | 7.3 | 3 |
| 312.698+0.126 | 14 13 49.85 | -61 10 24.1 | 12.5 | 10.6 | 9.5 | 8.5 | 3 |
| 312.702-0.087 | 14 14 25.12 | -61 22 29.0 | 12.7 | 10.6 | 9.3 | 8.8 | 3 |
| 313.469+0.190 | 14 19 40.94 | -60 51 47.3 | 10.6 | 7.6 | 6.1 | 5.3 | 3 |
| 313.577+0.325 | 14 20 08.58 | -60 42 00.8 | 9.6 | 8.1 | 6.5 | 5.3 | 3 |
| 313.705-0.190 | 14 22 34.74 | -61 08 26.8 | 10.5 | 8.1 | 6.4 | 5.7 | 3 |
| 313.767-0.863 | 14 25 01.73 | -61 44 58.1 | 8.1 | 6.4 | 5.5 | 4.8 | 3 |
| 313.774-0.863 | 14 25 04.80 | -61 44 50.3 | … | … | … | … | 2 |
| 313.994-0.084 | 14 24 30.78 | -60 56 28.3 | 13.5 | 10.9 | 10.2 | 9.4 | 3 |
| 314.221+0.273 | 14 25 12.89 | -60 31 38.4 | 8.9 | 7.1 | 5.7 | 3.7 | 3 |
| 314.320+0.112 | 14 26 26.20 | -60 38 31.3 | 5.8 | 4.5 | 2.0 | 1.9 | 3 |
| 315.803-0.575 | 14 39 46.46 | -60 42 39.6 | 10.2 | 8.8 | 7.1 | 6.3 | 3 |
| 316.359-0.362 | 14 43 11.20 | -60 17 13.3 | … | … | … | … | 3 |
| 316.381-0.379 | 14 43 24.21 | -60 17 37.4 | 11.0 | 10.0 | 8.1 | 6.6 | 3 |
| 316.412-0.308 | 14 43 23.34 | -60 13 00.9 | 12.8 | 11.3 | 9.5 | 8.0 | 3 |
| 316.484-0.310 | 14 43 55.37 | -60 11 18.8 | 12.7 | 9.7 | 7.6 | 6.4 | 3 |
| 316.640-0.087 | 14 44 18.45 | -59 55 11.5 | … | … | … | … | 3 |
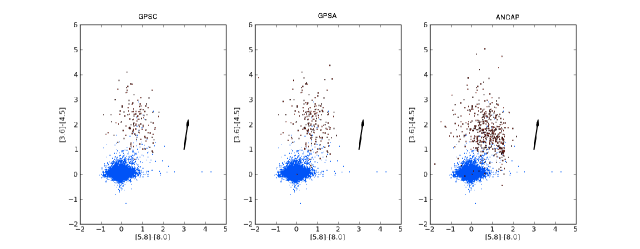
In Figure 7 we show [3.6][4.5] versus [5.8][8.0] colour-colour plots of the maser counterparts compared to a sample population of 15 000 sources drawn randomly from the GLIMPSE Point Source Catalogue (from those sources with detections at all 4 bands). We show the colours of maser counterparts drawn from the GLIMPSE Point Source Catalogue (GPSC), GLIMPSE Point Source Archive (GPSA) and the ANCAP photometry measured here. A reddening vector of is displayed, and was calculated based on that of Gutermuth (2005) and references therein. The maser counterparts are, as expected for YSOs, much redder than the general stellar population and show colours consistent with the smaller sample of 6.7 GHz masers investigated by Ellingsen (2006). All three photometric systems show good agreement in the colours of the maser counterparts, although the ANCAP counterparts occupy a marginally wider range in colour space than the GPSC or GPSA sample.
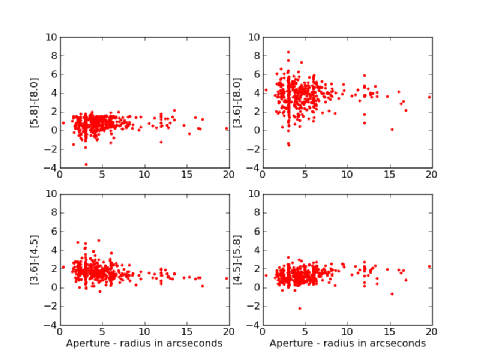
We investigate trends in colour with aperture size in Figure 8, where the aperture size is defined as the effective radius of the non-circular aperture (i.e. the radius of a circle with the same area as the non-circular aperture). In general the infrared colours of the counterparts display no marked trend with aperture size, although there is a weak trend toward a bluer colour with increasing aperture in the [3.6][4.5] colour. This may be due to increased contamination by fore- or background stellar objects as the aperture size increases. There appears to be considerably larger scatter in the colours involving the 8.0 m band, which could result from a contribution from extended PAH emission to the counterpart fluxes.
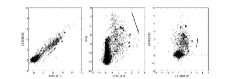
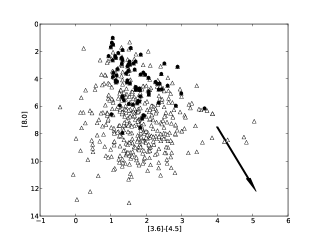
The largest sample of masers investigated in the GLIMPSE wavelength bands prior to the MMB Survey was that of Ellingsen (2006), who identified 41 Class II 6.7 GHz masers (drawn from a statistically complete sample) to have counterparts in the GPSC and GPSA. Figure 9 shows [3.6][8.0] versus [3.6][5.8] and [5.8][8.0] versus [3.6][4.5] colour-colour diagrams, plus a [3.6][4.5] versus [8.0] colour-magnitude diagram (c.f. Figs. 15–19 of Ellingsen 2006) of the 512 maser ANCAP infrared counterparts compared to the Ellingsen sample. It can be seen in this Figure that there is a close correspondence in colour-colour and colour-magnitude space between the masers whose infrared counterparts were determined by our ANCAP method and the GPSC/GPSA sample of Ellingsen (2006). The close correspondence between the two samples lends weight to the overall accuracy of the ANCAP procedure. While the bulk of our ANCAP counterparts lie in the same colour-colour and colour-magnitude space as the Ellingsen sample, there are a small number of counterparts with bluer or redder colours. The counterparts with blue colours lie in the predominantly stellar region traced by the random GLIMPSE PSC sample (the blue dots in Figure 9) and as such are likely to be foreground stellar contaminants.
4 Discussion
Here we draw together the results of our visual inspection of the GLIMPSE images, our adaptive non-circular photometry of extended IR counterparts to the MMB masers, and the results of the catalogue cross-matches. We dwell upon three main issues: the environments of the MMB masers, the colours of their infrared counterparts and the role of the masers as tracers of star formation.
4.1 The infrared environments of MMB masers
From our visual inspection of the GLIMPSE images we see that 6.7 GHz methanol masers appear to occur in one of two environments: those that are embedded within an infrared dark cloud (IRDC) and those that are associated with bright, often extended, mid-infrared emission. We also observe an apparent intermediate stage whereby there is a bright mid-IR counterpart associated with the maser, in turn embedded within an IRDC. We find 5% of our MMB maser sample to be associated with IRDCs, 62% of the sample to be associated with bright mid-IR emission and a further 21% to be associated with mid-IR emission embedded within IRDCs. The remaining 12% of the MMB maser sample are not associated with any mid-IR emission or visible IRDCs within the GLIMPSE images.
The difference in the environments traced by the masers indicated that 6.7 GHz masers trace more than one common evolutionary stage, as suggested by Ellingsen (2006) who also found a similar fraction of 6.7 GHz masers (albeit from a much smaller sample) to be associated with IRDCs. If we assume that the different mid-IR environments reflect a common evolutionary theme, then a plausible scenario is that the IRDC-associated and infrared-dark masers trace the earliest and most deeply embedded phase of star formation, followed by a transitional stage whereby the embedded source begins to break free of the IRDC, becoming visible in the mid-IR, and finally followed by a bright extended mid-IR phase where the source exciting the maser has disrupted the IRDC. Many of the bright mid-IR sources are found to be extended with respect to the GLIMPSE point spread function and at least some of these sources correspond to compact HII regions rather than the point-like morphologies expected by ultracompact or hypercompact HII regions.
However, this hypothesis does not take into account the distance of the maser – for example beyond a distance of 10 kpc a typical ultracompact HII region would be unresolved in GLIMPSE. Accurate distance determinations (free from kinematic distance ambiguities) are required to determine the spatial extent of the extended mid-IR emission combined with follow-up radio observations to confirm the HII region hypothesis by detecting free-free emission that is morphologically associated with the mid-IR emission (e.g. Hoare et al., 2007; Mottram et al., 2007; Urquhart et al., 2008)
To confirm that the IRDC-associated and infrared-dark masers trace an embedded phase of star formation within an IRDC requires longer-wavelength observations, e.g. from the MIPSGAL survey (Carey et al., 2009b) or the Hi-GAL survey (Molinari et al., 2010b). A study based on the results of the MIPSGAL and Hi-GAL surveys is in preparation and preliminary results indicate that these masers do indeed trace embedded star formation within these clouds. In addition, if these masers represent early deeply embedded phases of massive star formation some of them may show detectable hypercompact HII regions, (e.g. Longmore et al., 2007). High frequency high resolution radio continuum follow-up observations will be made to discover which masers are in this category. The role of the infrared-dark masers that are not associated with IRDCs is much less clear. We hypothesise that these masers represent distant sources whose associated IRDCs have either been rendered invisible by foreground diffuse Galactic mid-IR emission, or are too small or low contrast to be effectively detected by GLIMPSE.
4.2 The colours of the mid-infrared counterparts of MMB masers
Prior to the work carried out in this paper, the largest investigations of the GLIMPSE counterparts of 6.7 GHz masers have been carried out by Ellingsen (2006, 2007); Breen et al. (2010a) and Breen et al. (2011). In summary, Ellingsen (2006) took a sample of fifty six 6.7 GHz methanol masers and found that 29 masers (52%) have GPSC counterparts within 2″. This leads to a colour-magnitude selection criterion of [3.6]-[4.5]1.2 and [8.0]. In a follow up paper (Ellingsen, 2007) this criterion was used to select 5676 GPSC objects. Of these the 100 brightest in 8 m and the 100 reddest at [3.6][4.5] were selected as candidates for radio observations in order to detect 6.7 GHz methanol masers. This led to the detection of 38 maser sources, of which nine were new discoveries.
Breen et al. (2011) followed up 580 6.7 GHz masers drawn from the MMB catalogue at 12.2 GHz with the Parkes telescope and identified 12.2 GHz maser counterparts towards a total of 250 masers. Breen et al. (2011) also investigated the detection statistics and colours of their maser sample with the GLIMPSE point source catalogue in the same manner as Ellingsen (2006). The detection statistics of the Breen et al. (2011) masers are in agreement with those of Ellingsen (2006), although there is marginally higher detection rate for 6.7 GHz masers without associated 12.2 GHz emission than for sites showing both maser transitions. Breen et al. (2011) interpret this difference as an indication that sites with both maser transitions may be more evolved than those showing only 6.7 GHz maser emission. The infrared colours of the maser counterparts were found to be similar to the smaller sample of Ellingsen (2006).
In our visual inspection of the GLIMPSE images and positional cross-matches with the GPSC and GPSA we found that a significant fraction of the maser counterparts (480 masers out of 769) are extended in the mid-IR. As described in Sect. 3.2 we measured the fluxes in all 4 IRAC bands of 512 MMB maser counterparts using our adaptive non-circular aperture phometry method, which is a factor 2 increase over simply matching against the GPSC or GPSA catalogues, an order of magnitude increase over the sample of Ellingsen (2006) and more than doubling the Breen et al. (2011) sample . Despite the much larger size of our sample we find a striking agreement between the colours of our maser counterparts and those of Ellingsen (2006) and Breen et al. (2011). Figure 9 reveals that both samples occupy a very similar colour space and are much redder than the typical GLIMPSE population. In our larger sample we observe a marginally wider scatter in colours than Ellingsen (2006) and Breen et al. (2011), particularly in colours involving the 8 m band, however there are no clear trends. A small number of masers show stellar colours consistent with the general GLIMPSE population. These masers are likely to be chance line-of-sight alignments with foreground or background stars.
As noted in Ellingsen (2006) the masers appear to occupy a colour-space similar to that of Class 0 protostars as modelled in Whitney et al. (2003). However, it is also similar to the region occupied by HII regions as shown in Cohen et al. (2007) and we should not draw the conclusion that the maser counterparts invariably represent a Class 0-like object with an in-falling envelope without first excluding the possibility that some, at least, are HII regions.
4.3 The relationship between maser and infrared properties
With our large sample of maser infrared counterparts and the measured properties (e.g. 6.7 GHz flux, luminosity, velocity range) of their corresponding masers from the MMB Survey we are in the position to search for correlations between properties of the infrared and 6.7 GHz maser emission. This would enable us to search for potential evolutionary effects similar to those suggested by Breen & Ellingsen (2011) and Breen et al. (2012) in which the luminosity and velocity range of water and methanol masers are found to be correlated with the volume-averaged density of their host molecular clumps. We searched for trends in all of the measured IR properties contained in this paper (magnitude, colour, morphology) against each of the measured 6.7 GHz properties from the MMB survey (6.7 GHz flux and velocity range). We found no significant trends in any case. There is no tendency for the MMB masers to have measurably different properties for different morphological classes of infrared emission (e.g. IRDCs or Extended Green Objects), nor for different mid-infrared colour or magnitude. We cannot rule out evolutionary effects within our sample, although we can conclude that the physical mechanism behind the GLIMPSE emission is likely to be unrelated to that driving the masers themselves.
4.4 Methanol masers as tracers of star formation
The MMB masers are found to be rather weakly associated with Extended Green Objects (EGO) and Red MSX Survey (RMS) sources, with 18% of MMB masers found to be associated with EGO and 12% found to be associated with RMS HII regions or YSOs (with 20 masers in common between EGO and RMS, which is 3% of the total number of masers). We find that the EGO detection rate is consistent with that of Cyganowski et al. (2008) when the split between “likely” and “probable” EGOs is considered. Accounting for masers that are associated with both EGOs and RMS objects, there are 23% of the MMB sample that are found to be associated with either an EGO or an RMS object. A further 17% of MMB masers have no detectable mid-infrared counterparts, either being associated with an IRDC or with no detectable counterpart, which means that 60% of the MMB sample are infrared-bright but are not associated with other known massive star formation tracers such as EGO or RMS objects.
The question thus arises as to why the RMS and MMB surveys are only weakly correlated, if the hypotheses that both types of object trace current massive star formation are correct? To consider this question we must first recall that RMS is a survey that is primarily based on infrared selection, with specific MSX colour criteria required for selection as a candidate massive YSO (Lumsden et al., 2002) followed by detailed inspection at other wavelengths to weed out contaminants (Urquhart et al., 2008). The MMB survey on the other hand does not rely upon infrared selection, merely upon the initial detection of a 6.7 GHz maser by Parkes and its successful recovery at higher angular resolution by the ATCA. So any difference between the populations traced by RMS and MMB may simply be due to a difference in the intrinsic mid-infrared colours of RMS sources and 6.7 GHz masers.
We investigate the colours of the RMS and maser populations in Figure 10, by plotting the colour versus the m magnitude for maser counterparts both associated and unassociated with RMS sources. It can clearly be seen in Figure 10 that the RMS-associated masers are both brighter at m and bluer in than those maser counterparts that are not associated with RMS objects. The former is relatively easy to explain due to the fact that all RMS sources were selected from the MSX Survey. The MSX Survey was much shallower than GLIMPSE and has a limiting magnitude of 6.2 at 8.2 m (Cohen, Hammersley & Egan, 2000), although may reach deeper in regions that are less confused by the diffuse Galactic background. Hence the non-association of MMB masers that are fainter than a magnitude of 6.2 at 8.0 m with RMS sources is entirely consistent with the limiting magnitude of MSX. A total of 304 of the 512 MMB maser counterparts for which we obtained photometry via the ANCAP procedure are fainter than magnitude 6.2 at 8.0 m.
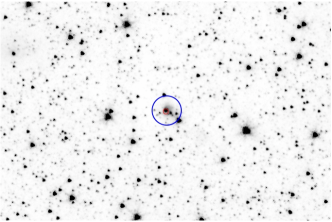
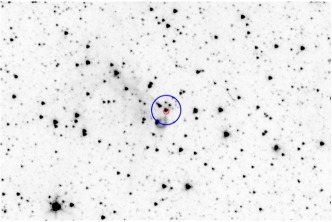
Secondly, it can be seen that the masers extend to a bluer region in than the RMS sources, extending into the domain where . The RMS sources are (by definition) selected to be red in MSX bands, with one key criterion being that , corresponding approximately to . If this is similar to a corresponding criterion for the typical RMS source this could fully account for the observed absence of RMS sources with in Figure 10. A secondary effect may arise from the poorer angular resolution of MSX relative to GLIMPSE for 8.0 m measurements. We might then interpret the fact that masers trace bluer objects than the RMS as being due to contamination of the MSX photometry by nearby, potentially stellar, objects. In Figure 11 we show 8.0 m GLIMPSE images of two MMB masers that are not associated with an RMS source. The large circle marked on the image represents the beam size of MSX at 8.0 m and shows the presence of a number of additional objects within the MSX beam. The flux from these stellar objects increases the 8.0 m MSX flux sufficiently that these two masers fail the selection criterion of the RMS Survey. We checked a random sub-sample of MMB masers using MSX photometry and found that this is generally the case for those masers with bright MSX counterparts. The RMS survey is thus naturally biased towards bright massive star forming regions that are isolated on the scale of the MSX beam.
Hence the reason that MMB and RMS appear to trace weakly related populations is entirely consistent with the properties of the initial RMS selection criteria, i.e. towards brighter infrared counterparts with 6.2 and for regions with relatively unconfused MSX photometry. The MMB survey thus offers a powerful technique for identifying massive star forming regions that is independent of infrared selection (e.g. Ellingsen et al., 1996; Ellingsen, Shabala & Kurtz, 2005).
Looking in more detail at the classifications of RMS objects found in the MMB maser sample, we see that the majority of the RMS objects found to be associated with masers belong to the YSO category (56/82 objects), with the next highest category association being “HII region” (22/82 objects). This is consistent with our visual inspection of the GLIMPSE images where 50% of the MMB maser sample were found to be point-like (similar to the near-IR/Spitzer morphology of YSOs found by Urquhart et al., 2008) and the remainder either extended or infrared-dark.
The RMS survey were able to determine unambiguous kinematic distances, and hence luminosities, for 78 of the 82 RMS sources associated with MMB masers. All of these RMS sources have luminosities that are consistent with massive star-forming regions; the minimum luminosity found is 104 L⊙, with a median for the sample of 3.2104 L⊙. Although we are only able to determine the bolometric luminosity for a small fraction of MMB masers (12%), by this approach we are confident that our sample of masers does not contain a significant fraction of low luminosity objects. The RMS survey contains YSOs with luminosity down to a few tens to hundreds and so, if low-luminosity YSOs were common in the MMB sample we would expect to have discovered some of them in our catalogue cross-match.
The implication is that 6.7 GHz masers trace a range of evolutionary stages in massive star formation, from those so deeply embedded within their parent clouds that they are undetectable at 8 m (e.g. Parsons, Thompson & Chrysostomou, 2009), to YSOs and HII regions. Caution must, however, be exercised as the reality is that massive star forming regions are highly complicated and confused complexes. We note that increasing the matching radius for MMB masers and RMS objects from 2″ to 5″ almost doubles the number of matched MMB masers. A more sophisticated analysis, using maps of extended structures and precise point source positions, is needed to disentangle the precise relationship between 6.7 GHz masers, HII regions and YSOs.
In a future publication we will investigate the bolometric luminosity of the MMB sample by using Herschel measurements of their SEDs from the Hi-GAL survey (Molinari et al., 2010b). We are also conducting distance determinations (e.g. Green & McClure-Griffiths, 2011) and additional multiwavelength follow-ups (similar to the RMS survey) to complement Herschel measurements so as to achieve our goal of extending full evolutionary classification to all MMB sites.
4.5 The infrared cluster maser connection
The cross match of the MMB and the infrared cluster catalogues (Mercer, Bica and Froebrich catalogue, plus the UKIDSS DR4 catalogue in preparation) yielded only 14 cross matches. A visual inspection of the GLIMPSE images and of the UKIDSS GPS (Lucas et al., 2008) images, where available, shows that the majority of the maser-associated clusters are not distinct in the near infrared and that only two masers are clearly associated with infrared clusters. We also cross-matched the RMS catalogue to our cluster sample with the result that only 28 clusters are associated with a RMS YSO or HII region. These two observations tentatively suggest that massive star formation has ended by the time a cluster becomes distinguishable in the near infrared. However, we must consider the fact that the cluster catalogues used in this work contain mostly nearby clusters (Bica & Bonatto, 2008), or clusters with predominantly low mass star formation, whilst the MMB and RMS sources are spread over a wide range of distances. Therefore we should be cautious in drawing any firm conclusions from this match. Cross matching the MMB with the much deeper UKIDSS Infrared cluster catalogue (Lucas et al in prep.), should provide a more reliable indication due to the number of more distant clusters detected; a preliminary cross match with the UKIDSS Infrared cluster catalogue so far indicates that the lack of correlation between masers and infrared clusters continues within the deeper survey.
5 Summary & Conclusions
We have carried out a detailed study of the mid-infrared environments of the 6.7 GHz methanol masers discovered in the MMB Survey using the Spitzer GLIMPSE survey. Our study comprises 776 6.7 GHz masers within the GLIMPSE I, II and 3D survey regions. We have implemented an adaptive non-circular aperture photometry technique (ANCAP) that determines the mid-IR flux of infrared counterparts to the masers in all 4 GLIMPSE bands. Our ANCAP technique doubles the number of masers with fluxes in all four bands (512 masers) compared with the corresponding number of counterparts obtained from the GLIMPSE point source catalogue (219 or 253 masers depending on whether the reliable GLIMPSE Catalogue or complete GLIMPSE Archive are used). We also examine the positional association of the masers with a number of star formation tracers: EGOs, IRDCs, RMS sources and infrared clusters.
We reach the following conclusions:
-
1.
Visual inspection of the images around each maser reveals a generally complex infrared morphology with the maser counterparts often being extended with respect to the Spitzer PSF. The morphology of the maser environments falls into one of four broad categories: a) the maser is embedded within an IRDC with no IRAC counterpart and thus has no detectable infrared counterpart (37 masers); b) the maser is located within an IRDC and has a detectable counterpart (164 masers); c) infrared-bright masers, often with extended counterparts, and that are not associated with IRDCs (473 masers); and d) masers with no detectable infrared counterpart and that are not associated with an IRDC (95 masers).
-
2.
We find that colours of the MMB maser counterparts sample agree very closely with those of a smaller sample studied by Ellingsen (2006) and Breen et al. (2011), but with a marginally larger scatter in colour. The region of mid-infrared colour space traced by the masers is similar to that of Class 0 protostars (Whitney et al., 2003) and HII regions (Cohen et al., 2007).
-
3.
We find 112 Extended Green Objects (EGOs) from the Cyganowski et al. (2008) catalogue to be associated with MMB 6.7 GHz masers (out of 608 masers searched), with the implication that EGO-targeted searches are able to detect only 18% of the 6.7 GHz masers. We also investigated extensively the fraction of EGOs that have a 6.7 GHz maser counterpart, and show that the investigation by Cyganowski et al. (2009) is compatible with our more complete statistics once the Cyganowski et al. (2009) sample is corrected for the “likely” rather than “possible” EGOs.
-
4.
Few masers (and few embedded RMS sources) are found within 1′ of infrared clusters which suggests that ongoing massive star formation has largely ceased by the time a cluster is discernible in the near-infrared. However this result may be due to a distance bias in the catalogue of infrared clusters used.
-
5.
The MMB masers are found to be rather weakly associated with RMS objects. Only 82 MMB masers lie within 2″ of an RMS object of type “HII region” or “YSO”, with the majority (56 masers) associated with type “YSO”. Combining this result with the EGO sample implies that 60% of the MMB masers have a detectable infrared counterpart within the GLIMPSE survey but are not associated with other known massive star formation tracers. We corroborate the common belief that 6.7-GHz masers are associated with an early stage of star formation, often extending earlier than the ultracompact HII region phase (Ellingsen, 2006; Walsh et al., 1998). Hence, the MMB survey offers a powerful way of identifying massive star forming regions that is independent of infrared selection (Ellingsen, Shabala & Kurtz, 2005; Ellingsen et al., 1996).
-
6.
MMB masers appear to trace a range of phases in the massive star formation process, with some masers associated with IRDC and some with infrared bright YSOs or HII regions. Future work to investigate the nature of infrared-dark masers is ongoing and includes studies of the far-IR & sub-mm SEDs (using the Herschel Hi-GAL survey, Molinari et al., 2010b) and of their high frequency radio continuum to identify hypercompact HII regions (e.g. Longmore et al., 2007)
6 Acknowledgments
We would like to thank the referee, Andrew Walsh, for a thorough and constructive report that improved our paper. We wish to thank the University of Hertfordshire and the Science and Technology Facilities Council for their support. This research has made use of NASA’s Astrophysics Data System Abstract Service; the NASA / IPAC Infrared Science Archive (which is operated by the Jet Propulsion Laboratory, California Institute of Technology, under contract with the National Aeronautics and Space Administration); SAOImage DS9, developed by Smithsonian Astrophysical Observatory; FunTools developed by High Energy Astrophysics Division of the Smithsonian Astrophysical Observatory and data products from the GLIMPSE survey, which is a legacy science program of the Spitzer Space Telescope, funded by the National Aeronautics and Space Administration.
References
- Benjamin et al. (2003) Benjamin R., Churchwell E., Babler B., Bania T., Clemens D., Cohen, M. Dickey J., Indebetouw R., et al., 2003, PASP, 810, 953
- Beuther et al. (2002) Beuther H., Schilke P., Menten K. M., Motte F., Sridharan T. K., Wyrowski F., 2002, ApJ, 566, 945
- Bica & Bonatto (2008) Bica E., Bonatto, C.and Camargo D., 2008, MNRAS, 385, 349
- Breen et al. (2010a) Breen S. L., Caswell J. L., Ellingsen S. P., Phillips C. J., 2010a, MNRAS, 406, 1487
- Breen & Ellingsen (2011) Breen S. L., Ellingsen S. P., 2011, MNRAS, 416, 178
- Breen et al. (2011) Breen S. L., Ellingsen S. P., Caswell J. L., Green J. A., Fuller G. A., Voronkov M. A., Quinn L. J., Avison A., 2011, ApJ, 733, 80
- Breen et al. (2012) Breen S. L., Ellingsen S. P., Caswell J. L., Green J. A., Voronkov M. A., Fuller G. A., Quinn L. J., Avison A., 2012, MNRAS, 421, 1703
- Breen et al. (2010b) Breen S. L., Ellingsen S. P., Caswell J. L., Lewis B. E., 2010b, MNRAS, 401, 2219
- Carey et al. (2009a) Carey S. J., Noriega-Crespo A., Mizuno D. R., Shenoy S., Paladini R., Kraemer K. E., Price S. D., et. al, 2009a, PASP, 121, 76
- Carey et al. (2009b) Carey S. J. et al., 2009b, PASP, 121, 76
- Caswell (2009) Caswell J. L., 2009, PASA, 26, 454
- Caswell et al. (2010) Caswell J. L. et al., 2010, MNRAS, 404, 1029
- Caswell et al. (2011) —, 2011, MNRAS, 417, 1964
- Churchwell et al. (2009) Churchwell E. et al., 2009, PASP, 121, 213
- Cohen et al. (2007) Cohen M., Green A. J., Meade M. R., Babler B., Churchwell E. B., et al, 2007, MNRAS, 374, 979
- Cohen, Hammersley & Egan (2000) Cohen M., Hammersley P. L., Egan M. P., 2000, AJ, 120, 3362
- Cragg, Sobolev & Godfrey (2005) Cragg D., Sobolev A., Godfrey P., 2005, MNRAS, 360, 533
- Cyganowski et al. (2009) Cyganowski C. J., Brogan C. L., Hunter T. R., Churchwell E., 2009, ApJ, 702, 1615
- Cyganowski et al. (2008) Cyganowski C. J., Whitney B. A., Holden E., Braden E., Brogan C. L., Churchwell E., Indebetouw R., Watson C. e. a., 2008, ApJ, 136, 2391
- De Buizer & Vacca (2010) De Buizer J. M., Vacca W. D., 2010, AJ, 140, 196
- Egan et al. (1998) Egan M. P., Shipman R. F., Price S. D., Carey S. J., Clark F. O., Cohen M., 1998, ApJ, 494, L199
- Ellingsen (2006) Ellingsen S., 2006, ApJ, 638, 241
- Ellingsen (2007) —, 2007, MNRAS, 377, 571
- Ellingsen et al. (2011) Ellingsen S. P., Breen S. L., Sobolev A. M., Voronkov M. A., Caswell J. L., Lo N., 2011, ApJ, 742, 109
- Ellingsen, Shabala & Kurtz (2005) Ellingsen S. P., Shabala S. S., Kurtz S. E., 2005, MNRAS, 357, 1003
- Ellingsen et al. (1996) Ellingsen S. P., von Bibra M. L., McCulloch P. M., Norris R. P., Deshpande A. A., Phillips C. J., 1996, MNRAS, 280, 378
- Elmegreen (1992) Elmegreen B., 1992, in Star Formation in Stellar Systems, G. Tenorio-Tagle, M. Prieto, & F. Sanchez, ed., pp. 381+
- Froebrich, Scholz & Raftery (2007) Froebrich D., Scholz A., Raftery C. L., 2007, MNRAS, 374, 399
- Garay & Lizano (1999) Garay G., Lizano S., 1999, PASP, 111, 1049
- Green et al. (2009) Green J. A. et al., 2009, MNRAS, 394, 783
- Green et al. (2010) Green J. A. et al., 2010, MNRAS, 409, 913
- Green et al. (2012) —, 2012, MNRAS, 420, 3108
- Green & McClure-Griffiths (2011) Green J. A., McClure-Griffiths N. M., 2011, MNRAS, 417, 2500
- Gutermuth (2005) Gutermuth R., 2005, PhD thesis, University of Rochester
- Hoare et al. (2007) Hoare M. G., Kurtz S. E., Lizano S., Keto E., Hofner P., 2007, Protostars and Planets V, 181
- Hoare et al. (2007) Hoare M. G., Kurtz S. E., Lizano S., Keto E., Hofner P., 2007, Protostars and Planets V, 181
- Kauffmann & Pillai (2010) Kauffmann J., Pillai T., 2010, ApJ, 723, L7
- Keto (2003) Keto E., 2003, ApJ, 599, 1196
- Kurtz (2005) Kurtz S., 2005, in IAU Symposium, Vol. 227, Massive Star Birth: A Crossroads of Astrophysics, R. Cesaroni, M. Felli, E. Churchwell, & M. Walmsley, ed., pp. 111–119
- Longmore et al. (2007) Longmore S. N., Burton M. G., Barnes P. J., Wong T., Purcell C. R., Ott J., 2007, MNRAS, 379, 535
- Lucas et al. (2008) Lucas P. W., Hoare M. G., Longmore A., Schröder A. C., Davis C. J., Adamson A., Bandyopadhyay R. M. e. a., 2008, MNRAS, 391, 136
- Lumsden et al. (2002) Lumsden S. L., Hoare M. G., Oudmaijer R. D., Richards D., 2002, MNRAS, 336, 621
- Menten (1991) Menten K. M., 1991, APJL, 380, L75
- Mercer et al. (2005) Mercer E. P., Clemens D. P., Meade M. R., Babler, B. L.; Indebetouw R., Churchwell E. B. e. a., 2005, ApJ, 635, 560
- Minier et al. (2003) Minier V., Ellingsen S. P., Norris R. P., Booth R. S., 2003, A&A, 403, 1095
- Molinari et al. (2010a) Molinari S. et al., 2010a, PASP, 122, 314
- Molinari et al. (2010b) —, 2010b, PASP, 122, 314
- Motte et al. (2008) Motte F., Bontemps S., Schneider N., Schilke, P.and Menten K. M., 2008, Massive Star Formation: Observations Confront Theory ASP Conference Series, 387, 22
- Mottram et al. (2007) Mottram J. C., Hoare M. G., Lumsden S. L., Oudmaijer R. D., Urquhart J. S., Sheret T. L., Clarke A. J., Allsopp J., 2007, A&A, 476, 1019
- Pandian et al. (2010) Pandian J. D., Momjian E., Xu Y., Menten K. M., Goldsmith P. F., 2010, A&A, 522, A8
- Parsons, Thompson & Chrysostomou (2009) Parsons H., Thompson M. A., Chrysostomou A., 2009, MNRAS, 399, 1506
- Peretto & Fuller (2009) Peretto N., Fuller G. A., 2009, A & A, 505, 405
- Peretto & Fuller (2010) Peretto N., Fuller G. A., 2010, ApJ, 723, 555
- Peretto et al. (2010) Peretto N. et al., 2010, A&A, 518, L98
- Pestalozzi et al. (2007) Pestalozzi M., Chrysostomou A., Collett J. L., Minier V., Conway J., Booth R. S., 2007, A & A, 463, 1009
- Purcell (2006) Purcell C., 2006, PhD thesis, University of New South Wales
- Robitaille et al. (2008) Robitaille T. P. et al., 2008, AJ, 136, 2413
- Schuller et al. (2009) Schuller F. et al., 2009, A&A, 504, 415
- Simon et al. (2006) Simon R., Rathborne J. M., Shah R. Y., Jackson J. M., Chambers E. T., 2006, ApJ, 652, 1325
- Solomon et al. (1987) Solomon P. M., Rivolo A. R., Barrett J., Yahil A., 1987, ApJ, 319, 730
- Urquhart et al. (2008) Urquhart J. S., Hoare M. G., Lumsden S. L., Oudmaijer R. D., Moore T. J. T., 2008, in Astronomical Society of the Pacific Conference Series, Vol. 387, Massive Star Formation: Observations Confront Theory, H. Beuther, H. Linz, & T. Henning, ed., pp. 381–+
- Urquhart et al. (2011) Urquhart J. S. et al., 2011, MNRAS, 410, 1237
- Van der Walt (2005) Van der Walt J., 2005, MNRAS, 360, 153
- Walsh et al. (1998) Walsh A. J., Burton M. G., Hyland A. R., Robinson G., 1998, MNRAS, 301, 640
- Walsh et al. (1999) Walsh A. J., Hyland A. R., Robinson G., Burton M. G., 1999, MNRAS, 291, 261
- Whitney et al. (2003) Whitney B. A., Wood K., Bjorkman J. E., Cohen M., 2003, ApJ, 598, 1079
- Wood & Churchwell (1989) Wood D., Churchwell E., 1989, ApJ, 340, 265
- Xu et al. (2008) Xu Y., Li J. J., Hachisuka K., Pandian J. D., Menten K. M., Henkel C., 2008, A&A, 485, 729
- Zinnecker & Yorke (2007) Zinnecker H., Yorke H., 2007, Ann.Rev.Astron.Astrophys., 45, 481