The Baryon Acoustic Oscillation Broadband and Broad-beam Array: Design Overview and Sensitivity Forecasts
Abstract
This work describes a new instrument optimized for a detection of the neutral hydrogen 21cm power spectrum between redshifts of : the Baryon Acoustic Oscillation Broadband and Broad-beam (BAOBAB) Array. BAOBAB will build on the efforts of a first generation of 21cm experiments which are targeting a detection of the signal from the Epoch of Reionization at . At , the emission from neutral hydrogen in self-shielded overdense halos also presents an accessible signal, since the dominant, synchrotron foreground emission is considerably fainter than at redshift 10. The principle science driver for these observations are Baryon Acoustic Oscillations in the matter power spectrum which have the potential to act as a standard ruler and constrain the nature of dark energy. BAOBAB will fully correlate dual-polarization antenna tiles over the 600–900MHz band with a frequency resolution of 300 kHz and a system temperature of 50K. The number of antennas will grow in staged deployments, and reconfigurations of the array will allow for both traditional imaging and high power spectrum sensitivity operations. We present calculations of the power spectrum sensitivity for various array sizes, with a 35-element array measuring the cosmic neutral hydrogen fraction as a function of redshift, and a 132-element system detecting the BAO features in the power spectrum, yielding a error on the distance scale, and, in turn, significant improvements to constraints on the dark energy equation of state over an unprecedented range of redshifts from .
Subject headings:
instrumentation: interferometers — cosmological parameters — distance scale — techniques: interferometric — large-scale structure of the universe1. Introduction
The Baryon Acoustic Oscillation (BAO) features in the large-scale matter distribution have recently drawn attention as a standard ruler by which the geometry of the universe can be directly measured (Eisenstein et al., 1998, 1999). These features in the cosmic microwave background (CMB) power spectrum and the matter power spectrum today are imprints from the acoustic oscillations in the primordial photon-baryon plasma that recombined at . The features in the power spectrum appear at multiples of the sound horizon scale at recombination, making them effective standard rulers. Measuring the BAO wiggles at several redshifts yields geometric measurements of the universe — the Hubble parameter, , and the angular diameter distance, — that constrain properties of the dark energy that dominates the cosmic energy content at and is the current leading theory for the accelerated expansion of the universe. Since the first detection of the BAO signal (Eisenstein et al., 2005), several experiments have been undertaken to use these features for precision cosmology, including the Sloan Digital Sky Survey III Baryon Oscillation Spectroscopic Survey (SDSS-III BOSS; Schlegel et al. 2009)111http://www.sdss3.org/surveys/boss.php/, WiggleZ (Drinkwater et al., 2010)222http://wigglez.swin.edu.au/site/, and the Hobby-Eberly Telescope Dark Energy Experiment (HETDEX; Adams et al. 2011)333http://hetdex.org/, as well as a number of planned future experiments, such as the Subaru Prime Focus Spectrograph (PFS; Ellis et al. 2012), Euclid (Amendola et al., 2012), BigBOSS (Schlegel et al., 2011), and the Wide-Field Infrared Survey Telescope (WFIRST)444http://wfirst.gsfc.nasa.gov/. All of these experiments target individual galaxies with spectroscopic observations.
Rather than targeting individual objects, a 21cm intensity mapping experiment can detect fluctuations in neutral hydrogen emission on large scales (Chang et al., 2008; Wyithe et al., 2008; Morales & Wyithe, 2010; Pritchard & Loeb, 2012), with two dimensions corresponding to angles on the sky, and the third line-of-sight dimension arising from the differential redshifting of 21cm line emission as a function of distance. After reionization, the power spectrum of 21cm fluctuations is expected to be a biased tracer of the matter power-spectrum, since the remaining neutral hydrogen resides in high-density, self-shielded regions such as in galaxies and other collapsed halos (Barkana & Loeb, 2007; Madau et al., 1997). As a result, 21cm intensity mapping experiments present a promising complement to spectroscopic galaxy surveys for BAO science. Several 21cm intensity mapping experiments have been proposed, including the prototype Cylindrical Radio Telescope (CRT; formerly HSHS, Peterson et al. 2006; Seo et al. 2010)555http://cmb.physics.wisc.edu/people/lewis/webpage/, the Canadian Hydrogen Intensity Mapping Experiment (CHIME)666http://www.mcgillcosmology.ca/chime, BAORadio (Ansari et al., 2012a, b), the BAO from Integrated Neutral Gas Observations experiment (BINGO; Battye et al. 2012, and an ongoing experiment with the Green Bank Telescope (GBT; Chang et al. 2010).
The flexibility in angular and spectral responses of radio interferometers, which measure the power spectrum both parallel and perpendicular to the line of sight (Morales, 2005), gives 21cm BAO the ability to survey larger cosmological volumes and operate over a wider range of redshifts than current spectroscopic galaxy redshift surveys. As a result, the 21cm BAO signal has the potential for probing expansion throughout and beyond the critical epoch when dark energy comes to dominate the energy density of the universe. Furthermore, a 21cm intensity mapping experiment can probe redshifts with roughly uniform sensitivity, without complications arising from sky emission lines in the optical/near-infrared. The 21cm signal can be used to constrain the location of the BAO peaks as a function of redshift, and thereby measure the magnitude and time-evolution of dark energy.
21cm BAO experiments can draw on the considerable investments in low-frequency radio astronomy developed in the past decade for studies of the Epoch of Reionization (EoR). In this paper, we present the Baryon Acoustic Oscillation Broadband and Broad-beam (BAOBAB) array, a new experiment, building on the legacy of the Precision Array for Probing the Epoch of Reionization (PAPER; Parsons et al. 2010)777http://eor.berkeley.edu/ and the Murchison Widefield Array (MWA; Lonsdale et al. 2009)888http://www.mwatelescope.org/, for measuring the 21cm HI power spectrum at a redshift of . This paper is structured as follows: in §2, we present a system architecture for the BAOBAB instrument. In §3, we forecast the sensitivity and cosmological constraints that will be achieved by BAOBAB. We consider several possible challenges and extensions for this approach in §4, and conclude in §5. Throughout this work we assume the WMAP7 best fit CDM cosmological model: , , , , and (Larson et al., 2011).
2. The BAO Broadband and Broad-beam Array
The past decade has seen significant progress in the design, construction, and calibration of low-frequency interferometric arrays toward the goal of detecting the highly-redshifted 21cm signal from the Epoch of Reionization. The technologies used in BAOBAB inherit from two EoR experiments — PAPER and the MWA — but with several significant modifications to optimize the instrument for BAO science. The entire signal chain will be re-tuned to operate between 600–900 MHz. These frequencies corresponds to redshifted 21cm emission between , a band chosen for several reasons. First, these moderate redshifts complement the undergoing lower redshift galaxy surveys like BOSS by probing what is currently a relatively unexplored volume of the universe. Secondly, at these frequencies, commercially available amplifiers and cables provide suitable low-noise performance that would not be obtainable at higher frequencies (lower redshifts). Furthermore, this band also avoids the bright sky noise and ionospheric effects that complicate lower frequency (higher redshift) observations.
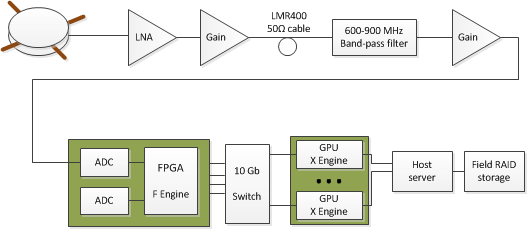
BAOBAB will be a non-phase-tracking, broadband array of beam-formed tiles. By lowering the field-of-view of each element, the use of beamformed tiles like the MWA will significantly increase BAOBAB’s power spectrum sensitivity over that of an array of the equivalent number of single dipoles, without increasing the correlator demands. Each tile will consist of 4 scaled versions of the PAPER sleeved-dipole design and groundscreens, electronically beamformed to point to zenith. Two linear polarization signals from each tile enter a digital signal processor that computes both auto- and cross-correlation products and outputs the results locally to disk. A block diagram is given in Fig. 1; the key properties of the BAOBAB system are listed in Table 1 and are described in more detail in the remainder of this section.
| Operating Bandwidth | 600–900 MHz |
|---|---|
| Number of Tiles | 32–128 |
| Collecting Area per Element | 2.6 |
| Gain per Element | 18 dBi |
| Field-of-View | 0.045 str |
| Receiver Noise Temperature | 40 K |
| System Temperature | 50 K |
| Maximum Imaging Baseline | 60 m |
| Redundant Baseline Scale | 1.6 m |
| , | 0.01, 2.5 |
| Array Configuration | Reconfigurable (see Fig. 6) |
| Frequency Resolution | 300 kHz |
| Snapshot Integration Time | 10 s |
2.1. Siting
Since radio-frequency interference (RFI) is prevalent at these frequencies, BAOBAB will need to be located at a radio quiet site. The bottom panel of Figure 2 shows preliminary measurements made by a prototype 2-antenna BAOBAB interferometer deployed at the Leuschner Observatory near Berkeley, CA.
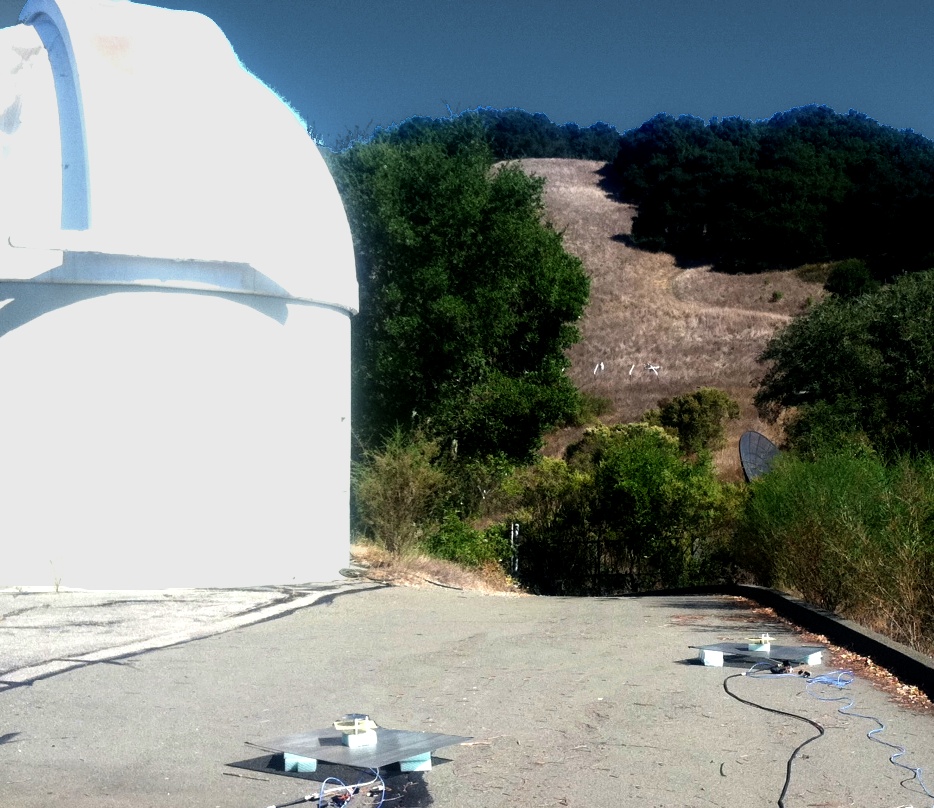
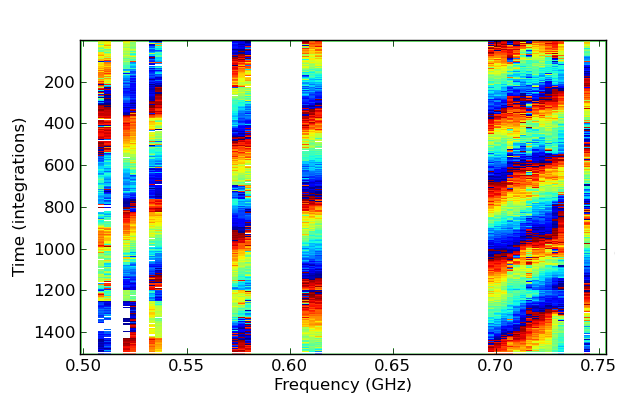
At this site, only 40 MHz of a 400–800 MHz operating band show solar fringes uncorrupted by RFI, demonstrating the need for the primary BAOBAB deployment to be located at a quieter site, such as the NRAO site near Green Bank, WV. Next-generation activities may take place at the Square Kilometer Array South Africa (SKA-SA) reserve in the Karoo desert. This site is currently occupied by the PAPER and MeerKAT arrays, and has been shown to be a pristine RFI environment (Jacobs et al., 2011).
2.2. Analog System
With the drastic reduction in sky noise relative to EoR frequencies, BAOBAB’s system temperature will be dominated by the analog electronics. These components must therefore be optimized to reduce receiver noise while maintaining the smooth spatial and spectral responses that are a hallmark of the PAPER design and a key component of the delay spectrum foreground isolation approach presented in Parsons et al. (2012b) (hereafter P12b) and discussed in §3.3. The analog system will include the collecting element (consisting of 4 antennas and reflectors), low-noise amplifier, coaxial cable, and receiver.
The BAOBAB element will begin with a 1/5-scale PAPER antenna (Parsons et al., 2010), as shown in Figure 3.
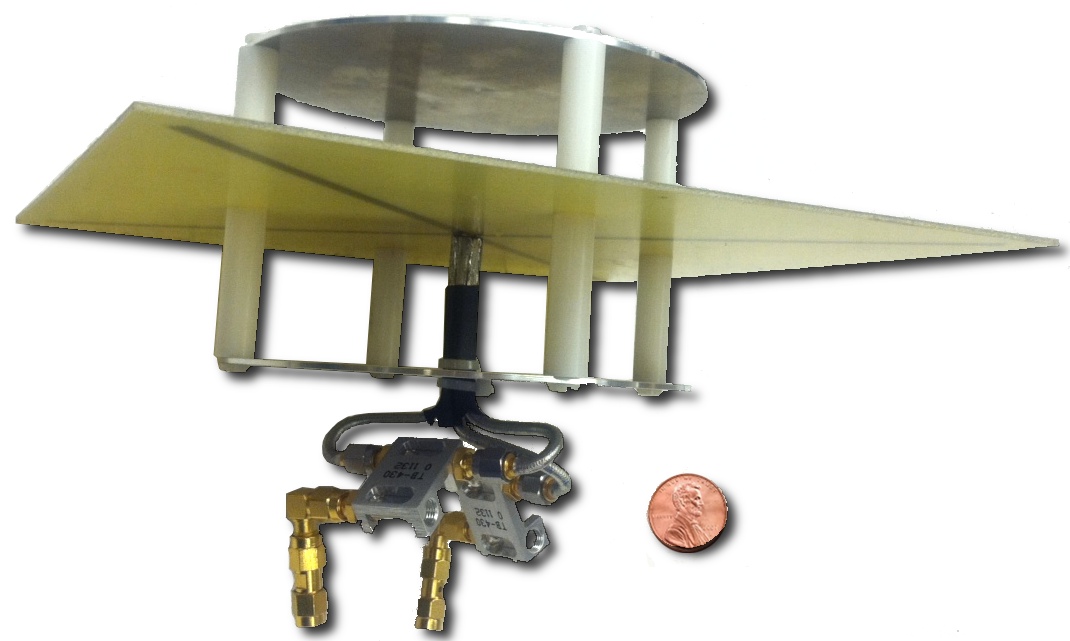

This design is a dual-polarized version of the sleeved dipole design that uses a twin-resonance structure consisting of a pair of crossed dipoles located between a pair of thin aluminum disks. The element’s reliability has been demonstrated in PAPER arrays over the past several years. A trough reflector under each dipole will be used to increase the directivity toward zenith. The electromagnetic behavior of the element was modeled extensively for PAPER using CST Microwave Studio, and shown to perform as desired through calibration with celestial sources in Pober et al. (2012). The geometrically re-tuned prototype shown in the top panel of Figure 3 will be optimized to operate efficiently over the 600–900 MHz band.
Rather than deploy single elements like PAPER, BAOBAB will use a tile of dipoles and ground-screens, as shown in Figure 3. A fixed zenith beamformer will be used to combine the signals, increasing the gain by 6 dB and reducing the field-of-view by a factor of four. Both analog and digital beamformers are being investigated. A key issue is the mutual coupling, which should be reduced by the additional groundscreens between dipoles. The net effect is that for a fixed correlator size, the power-spectrum sensitivity is increased by a factor of four (see §3.2).
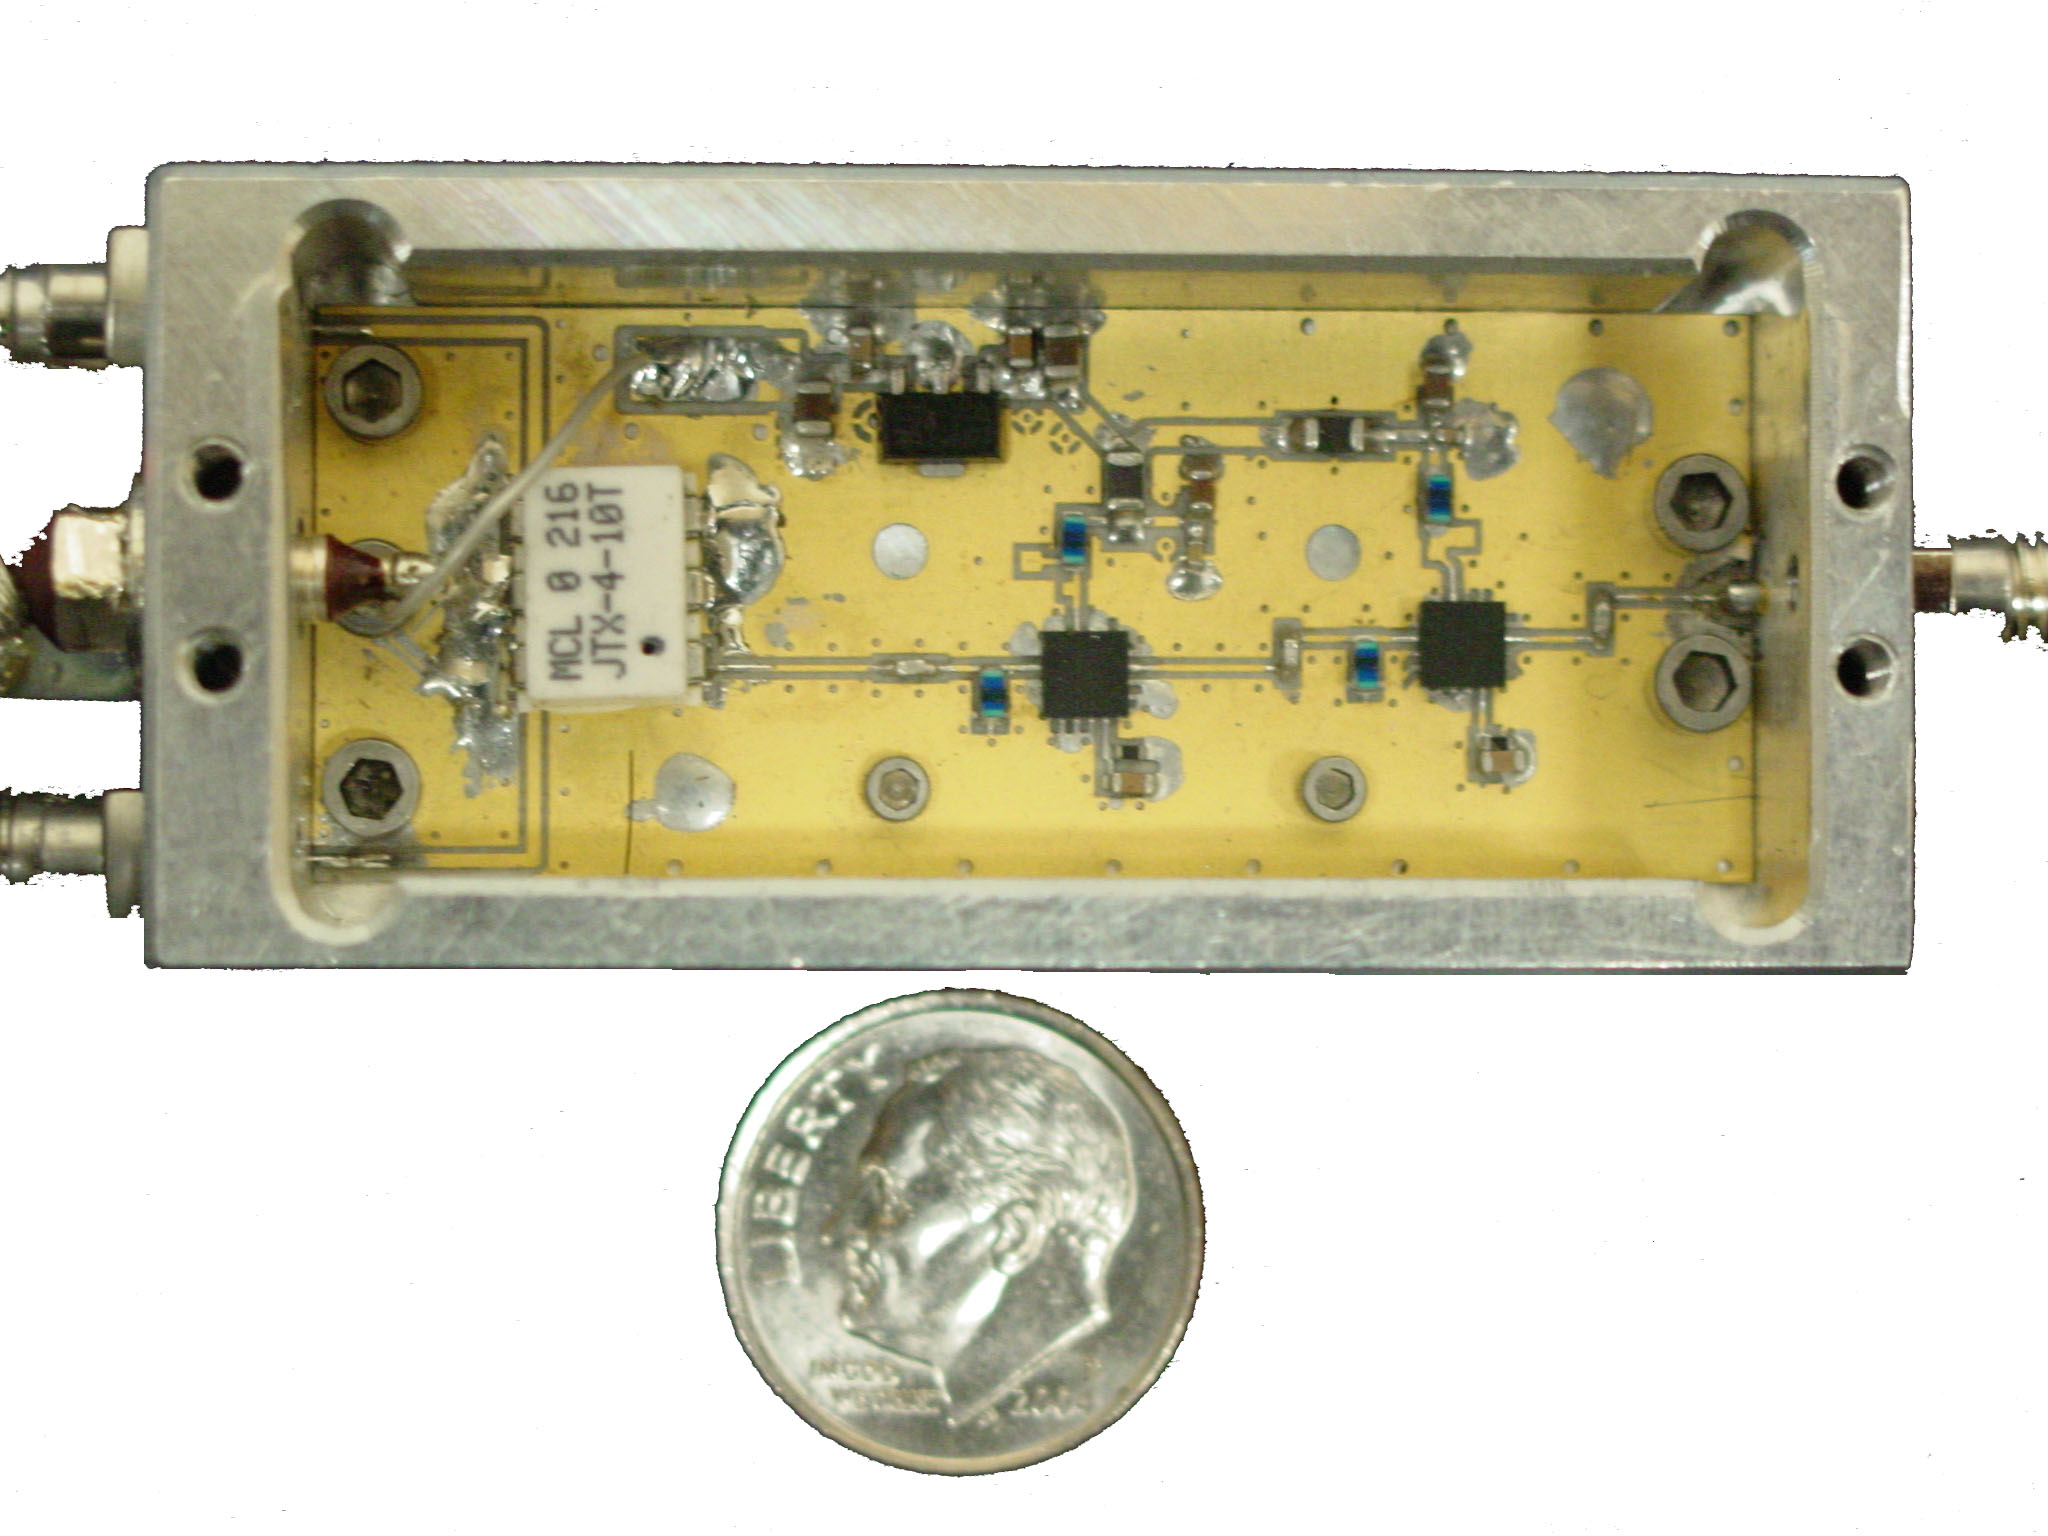
The amplifier designed for PAPER has a measured noise temperature of 110 K with 30 dB of gain across the 120-170 MHz band (Parsons et al., 2010). For application to BAO at , we will modify this amplifier design to operate from 600–900 MHz. Besides re-tuning the filter and amplifier circuits, however, one of the major activities in this modification will be to reduce the noise temperature of the front-end amplifier in order to obtain a target system temperature of 50 K. This change reflects one of the key differences between the BAO and EoR foregrounds. System noise in the EoR band is dominated by K sky noise from galactic synchrotron emission. In the BAO band, the sky temperature is reduced to K, making the front-end amplifier the leading source of noise. Uncooled commercial UHF-band amplifier transistors based on GasFET or HEMT technology can reliably achieve noise figures of 0.4 dB, corresponding to a receiver temperature of 30K. A prototype BAOBAB balun/amplifier using a Hittite HMC617LP3 LNA with a quoted noise figure of 0.5 dB is shown in Figure 4; tests are underway to determine the noise temperature of the complete system.
2.3. Digital System
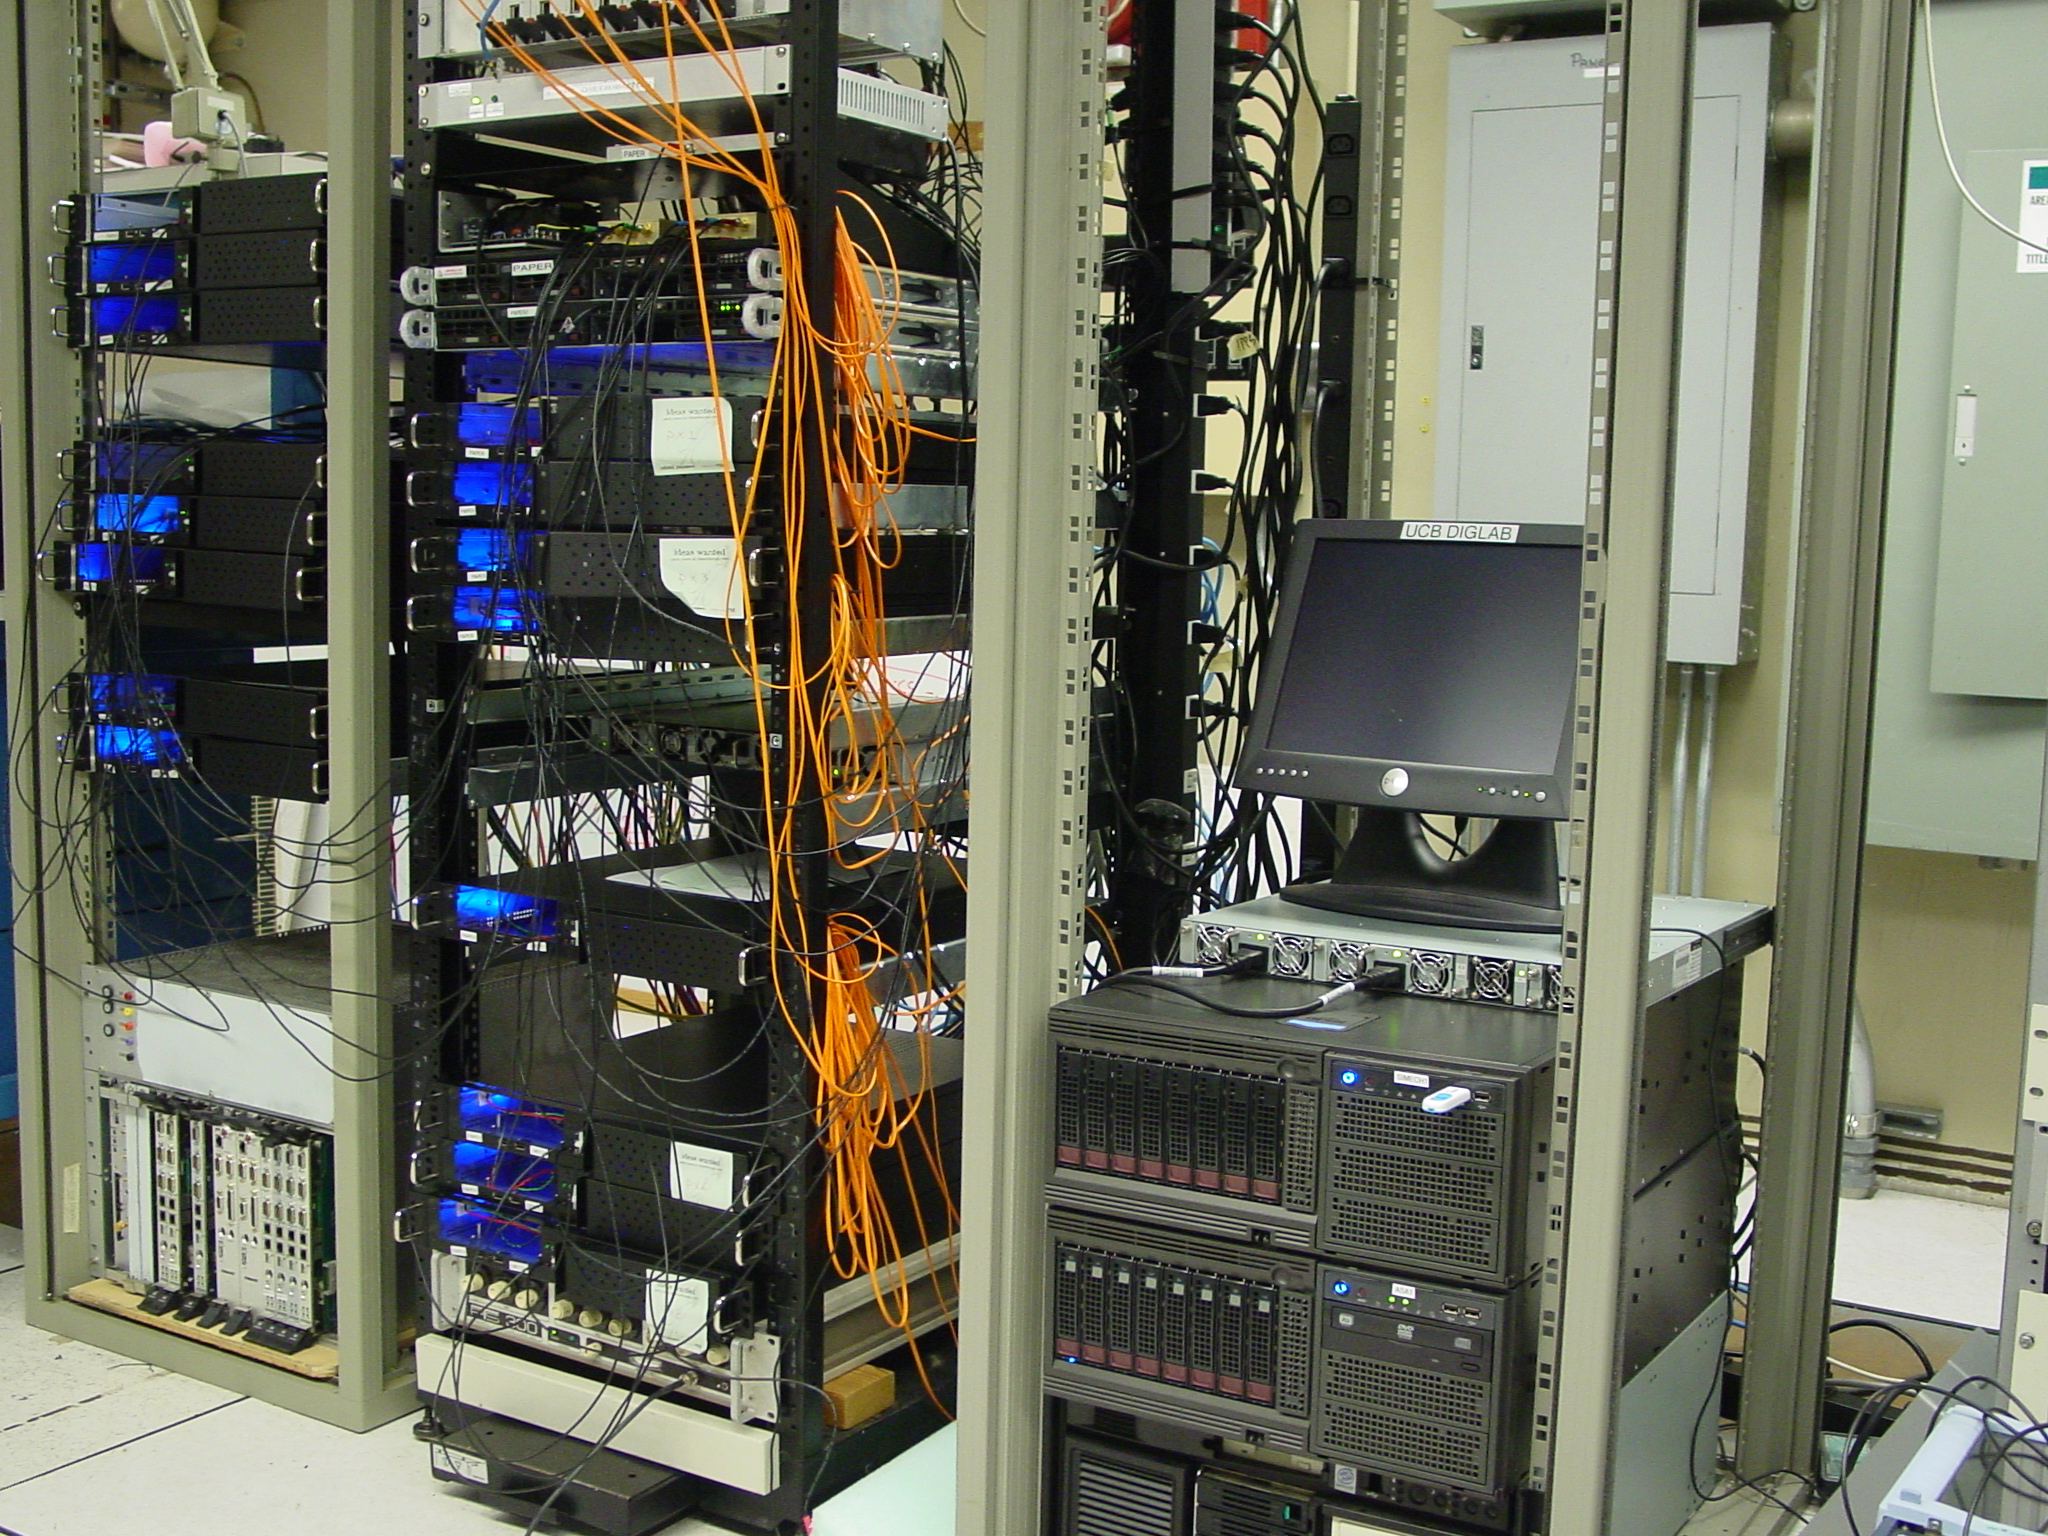
The BAOBAB correlator will follow the scalable correlator design used by PAPER and other members of the international Collaboration for Astronomy Signal Processing and Electronics Research (CASPER)999https://casper.berkeley.edu, a real-time digital correlator based on Field-Programmable Gate Array (FPGA) processors and graphics processing units (GPUs) (Parsons et al., 2008; Clark et al., 2011). The correlator architecture we employ uses modular signal processing electronics and packetized communication protocols to build correlators that are flexible in the number of antennas correlated and the bandwidth correlated by each antenna. A photograph of a 128-input FPGA/GPU correlator is shown in Fig. 5.
The generic FX correlator architecture we implement consists of modules responsible for digitizing and channelizing each set of antenna inputs (F-Engines), followed by a set of signal processing modules responsible for cross-multiplying all antennas and polarizations for a single frequency (X-Engines) and accumulating the results. Unique to this architecture, signal processing engines transmit packetized data through commercially available 10 Gb Ethernet switches that are responsible for routing data between boards. This architecture, along with analog-to-digital converters, modular FPGA-based signal processing engines, and a software environment for programming, debugging, and running them, were developed in collaboration with CASPER at the University of California, Berkeley (Parsons et al., 2008). The flexibility and modularity of this correlator design shortens development time, and in this case, allows an existing 64-input, 100-MHz PAPER correlator with 8 ROACH-boards and 4 dual-GPU boxes to be straight-forwardly modified to become a 32-input, 300-MHz BAOBAB correlator using the same boards and signal processing libraries. A forthcoming publication on this correlator will be presented in Ali et al. (2013).
2.4. Configuration
BAOBAB will employ small antennas and above-ground cabling with relatively inexpensive LMR400 50-Ohm coaxial cables; these cables will not be buried, allowing BAOBAB to easily change between different array configurations by moving antenna elements. Following the principles outlined in (Parsons et al. 2012a, hereafter P12a), BAOBAB will employ a minimum-redundancy imaging configurations for characterizing foregrounds with minimal sidelobes and maximum-redundancy configurations to repeatedly sample the same locations in the -plane, substantially improving sensitivity to the three-dimensional power spectrum of 21cm emission at . Although future experiments may target a range of angular scales to map 21cm emission in the plane of the sky, by focusing on a limited number of Fourier modes, these maximum-redundancy configurations can improve sensitivity to the power spectrum by an order of magnitude or more in mK2, relative to an equivalent observation with a minimum-redundancy configuration.
However, as will be discussed further in §3.2.1, the mapping of baseline length to a transverse -mode on the sky is significantly larger for BAOBAB than for PAPER. In order to probe the relatively large-scale BAO features, then, BAOBAB will use the most compact configurations possible for its power spectrum measurements. Such an array configuration for a 35-element system, as well as that of a 32-element imaging configuration, are shown in Figure 6.
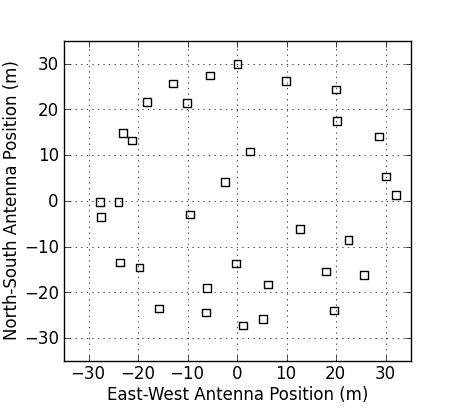
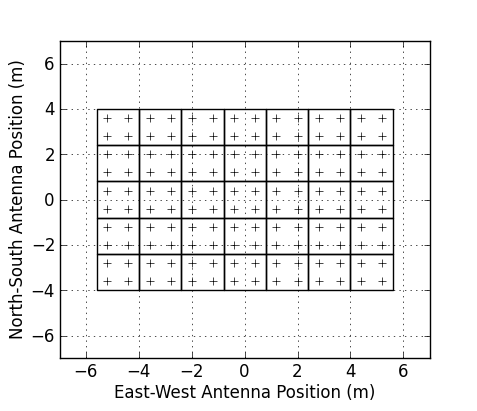
The tiles are spaced 1.6m apart, effectively touching end-to-end. Investigations of cross-talk and mutual coupling will take place during an early prototype of the system; it may be the case that a phase-switch or additional shielding between tiles will be necessary to accommodate the short baselines required by BAO science.
With a modular CASPER correlator increasingly able to process larger numbers of antenna inputs, BAOBAB naturally lends itself to a staged approach. Early tile-element prototypes will characterize system performance, while a subsequent -element array will study foreground emission and constrain the neutral hydrogen fraction as a function of redshift with a measurement of the 21cm power spectrum (§3.4). A -tile version of BAOBAB will measure BAO features and provide substantial improvements over our current constraints on the equation of state and time evolution of dark energy (§3.5).
3. Predicted Cosmological Constraints from BAOBAB
In this section we present predictions for forthcoming cosmological constraints for several iterations of the BAOBAB instrument. We begin by reviewing the predicted signal strength for the cosmological 21cm power spectrum in §3.1. In §3.2, we adapt the power spectrum sensitivity calculations of P12a for an array operating at , including the effects of sample variance and shot noise. In 3.3, we briefly review the delay spectrum foreground removal procedure of P12b. While a detailed study of foregrounds is beyond the scope of this paper, it is worthwhile to discuss the implications of the technique on which Fourier modes of the 21cm power spectrum will be accessible. We conclude the section by presenting forecasts for a 35- and 132-element BAOBAB system in §3.4 and §3.5 respectively, including Fisher matrix predictions for constraints on the dark energy equation of state in the latter section. In the discussion of §4, we explore possible directions for improvement with larger BAOBAB arrays.
3.1. The 21cm Power Spectrum
As with galaxy redshift surveys, a 3D map of the neutral hydrogen in the universe will serve as a tracer of the underlying dark matter power spectrum. The brightness of the observable radio 21cm signal will depend on the cosmological neutral hydrogen fraction, as well as the bias of hydrogen containing halos with respect to the dark matter (Barkana & Loeb, 2007; Madau et al., 1997; Ansari et al., 2012b):
| (1) |
| (2) |
where is the mean 21cm brightness temperature at redshift ; is the linear matter power spectrum; is the bias factor of HI containing halos with respect to the dark matter; is the mass fraction of neutral hydrogen with respect to the overall cosmological baryon content (i.e., ); is the cosmological constant, and and are the matter and baryon density in units of the critical density, respectively.
We plot the predicted 21cm brightness temperature power spectrum, , for our fiducial model at redshifts of 0.67, 0.89 and 1.18 (corresponding to frequencies of 850, 750, and 650 MHz, respectively) in Figure 7.
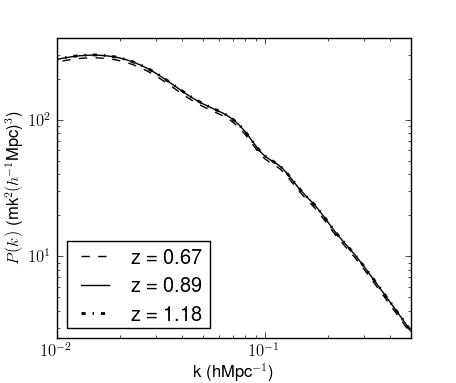
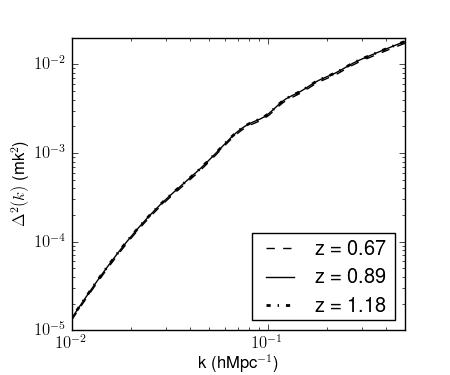
Predictions for the matter power spectrum come from CAMB (Lewis et al., 2000)101010http://camb.info/. We also plot the dimensionless power spectrum, . For the remainder of this paper will we primarily express our results in terms of , due to its more intuitive units (mK2) and simple physical interpretation as the variance per logarithmic bin.
In practice, the 21cm power spectrum is measured in redshift space, which can be, at linear order, related to the real-space as (Kaiser, 1987):
| (3) |
where is the wavevector projected along the line-of-sight , and from linear theory where is the dimensionless linear growth rate and for CDM cosmologies. To incorporate the effects of redshift-space distortions in 1D plots of the power spectrum, we reduce our thermal noise error bars in -space by the factor of ; however, our cosmological analyses keep full 2D information. We do not attempt to constrain cosmological parameters like by measuring the power spectrum as a function of . We assume fiducial values of = 0.015 and = 0.75, chosen to agree with as measured by Chang et al. (2010). To obtain individual constraints on these parameters, one will need to measure redshift-space distortions themselves.
3.2. Sensitivity of an Array to the 21cm Signal
There are three independent sources of statistical uncertainty in a 21cm power spectrum measurement: thermal noise in the interferometric visibilities, sample variance, and shot noise, of which the last is in some sense “signal,” but still inhibits measurements of cosmological parameters. For the first-generation of 21cm experiments, thermal noise will be the dominant source of uncertainty in measurements of the power spectrum. We therefore calculate the effects of thermal noise independently in §3.2.1. We add in the effects of sample variance in §3.2.2 and argue in §3.2.3 that shot noise can be neglected for these experiments.
3.2.1 Thermal Noise
Thermal noise, in addition to being the dominant source of uncertainty in first generation 21cm BAO experiments, is also likely to be least familiar to those used to optical redshift surveys. Given the limited collecting area of early experiments, reducing thermal noise contributions is of paramount importance, even at the expense of the number of Fourier modes measured. Much of the work in this section explicitly follows the derivation of an interferometric array’s power spectrum sensitivity presented in P12a (only the prefactors have changed to account for different fiducial values at ). The approach of P12a is to treat each baseline as an independent probe of the 21cm power spectrum at one set by the baseline length, and many -values along the line-of-sight. We therefore first derive the sensitivity of a single-baseline; the sensitivity of the array is the aggregate sum of all these independent measurements.
We begin with a version of equation 16 from P12a, which gives the power spectrum of the thermal noise obtained from one integration of a dual-polarization baseline:
| (4) |
where is a scalar translating observed units to cosmological distances in Mpc ( converts from angles on the sky to transverse distances, from bandwidth to line-of-sight distance), is the solid angle of the primary beam of one element in steradians, is the system temperature, and is the amount of integration time of the sample. It is again worth emphasizing that this equation is not valid for all -modes (which would imply a white noise power spectrum throughout Fourier-space), but rather only those modes sampled by the one baseline in question.
We also note that this relationship is very similar to equation 31 in Ansari et al. (2012b). Quantitatively, however, they differ by a factor of 4. There are two separate effects contributing to this difference. Firstly, our equation is explicitly for a dual-polarization receiver, giving us twice as many independent samples of the same -modes and therefore half the noise. Secondly, for the receiver design of the BAOBAB system, the RMS fluctuations in a measurement are given by (Kraus, 1966; Thompson et al., 2001). Ansari et al. (2012b) include an additional factor of 2 in their equation (21), perhaps due to the design of their system including phase switching or some other effect.
The science goals of a BAO experiment are to actually measure and ; that is, since the exact values of and depend on the underlying cosmology, we can combine the known physical scale of BAO with the angular and frequency scales in the observed signal to extract the detailed expansion history of the universe. For the purpose of a sensitivity derivation, however, the behavior of and can be considered well enough known to compute fiducial values for equation 4.
is related to the angular size distance, , as
| (5) |
with in the matter/dark-energy dominated epoch being approximately given by . Numerical integration for a flat universe with , , and yields proper (Wright, 2006). Ignoring the evolution in the angular diameter distance around , we can write:
| (6) |
Note that although we use this (admittedly somewhat poor) approximation for simplicity in deriving the relations for thermal noise power spectra in this subsection, all the subsequent results include the full -dependence of the angular diameter distance.
A few more words are warranted concerning the magnitude of at . Given the scaling of equation 5, a -baseline (6.8m a ) corresponds to a transverse wavemode of , a non-negligible value compared to the first BAO peak at . Therefore, baselines longer than will lose access to the first peak and be less effective probes of cosmology, regardless of foreground effects to be discussed later. This scaling motivates the extremely compact configurations proposed for BAOBAB in §2, despite the possible systematics associated with such short baselines.111111Epoch of Reionization experiments at , however, do not find themselves limited by the transverse modes probed. (P12a), so that a -baseline corresponds to . With this scaling, the effect of the component on the measured power spectrum will always be sub-dominant to the foreground effects described in P12b.
To compute the scaling between frequency, , and comoving line-of-sight distance, , we use
| (7) |
Since , we have that , so
| (8) |
Evaluating the above numerically, we get
| (9) |
Finally, we compute the product used in equation 4:
| (10) |
Nominally, at .121212The magnitude of at represents an often under-appreciated gain in sensitivity between a 21cm BAO experiment and a similar reionization experiment. At , , meaning that the quoted EoR signal strength of is normalized over a much larger volume. The smaller volume scalar at means that over an order of magnitude less thermal noise is picked up per equivalent integration.
The other values in equation 4 are system-dependent parameters. The BAOBAB tiles have a considerably sized primary beam on the sky, sr.131313This value for primary beam was estimated based on models of the PAPER single dipole primary beam and a simple array-factor to estimate a tile beam. The actual value will depend on the illumination pattern of the ground screen flaps by the dipole. If prototype systems substantially under-perform in this regard, a second-stage of element design may be necessary to reduce the size of the primary beam in order to achieve the sensitivities presented here. However, this beam is significantly narrower than that of a single dipole, so that the use of beamforming results in a considerably lower noise level, since our noise power spectrum scales as into equation 4.
The issue of system temperature is another instance where a BAO experiment at is fundamentally different from an EoR experiment at . In the EoR case, Galactic synchrotron emission is the primary source of noise at 150 MHz, with a value of K toward the galactic poles. However, synchrotron emission scales approximately as
| (11) |
At frequencies around MHz, . This value is substantially below typical receiver temperatures of , so that receiver temperatures will dominate . As described in §2, BAOBAB will have a system temperature of approximately 50K across its entire band.
We can express the noise power spectrum of one dual-polarization baseline integrating on one Fourier mode by substituting these fiducial values in equation 4. However, before doing so, it is worthwhile to look ahead and emphasize that the remaining results in this section are intended to give both a quantitative sense of the level of thermal noise in 21cm observations and scaling relations for the effect of various instrumental and observational parameters. In the sensitivity calculations of §3.4 and §3.5, however, we fully simulate the -coverage of our arrays, including the effects of earth-rotation synthesis. We then use equation 4 to evaluate the thermal noise level in each -pixel given an effective integration time in that pixel.
Substituting our fiducial values into equation 4 yields the following result for the sensitivity of a single baseline to the 21cm power spectrum:
| (12) |
where is the length of the baseline in wavelengths. We have also replaced , the integration time in a sample, with a combination of factors of and . These quantities are related to the amount of time a single-baseline will sample a -pixel: sets the diameter of the pixel and sets the length of time the baseline samples that same pixel before earth rotation causes it to move into an independent pixel (longer baselines drift through the -plane faster). The full derivation of this relation is given in §2.2 of P12a. The choice of a 20-wavelength baseline is arbitrary. We have also added a factor; each day of an observation provides an identical measurement to the previous day, resulting in a linear increase in the power spectrum sensitivity. Our fiducial “long observation” is 180 days; we set this value as a hard maximum for the number of days BAOBAB can observe in one calendar year. This choice comes from the fact that observations will be compromised by foreground emission when either the Galactic plane or the sun is in view.
In order to calculate the sensitivity of an entire interferometric array, we must sum the contributions of all the Fourier modes sampled by every baseline, paying careful attention to the number of times a unique Fourier mode is sampled by distinct redundant baselines. If each baseline measured an independent Fourier mode, the overall power spectrum sensitivity of an array would grow proportionally to the square root of the number of baselines (or, alternatively, linearly with number of antennas). To first approximation, every baseline can contribute an independent measurement of each -mode in the power spectrum, since the frequency axis covers a very broad range in . 141414 The situation is more complicated than this for two reasons. First, each baseline has a minimum -mode it can measure, corresponding to its length in . The analytic formulae below ignore this effect, which becomes important for small values of . However, we emphasize that the cosmological sensitivity results in the subsequent sections do take this effect into account. Second, redshift space distortions break the isotropy between and so that modes of equal cannot naïvely be combined. As stated previously, we maintain 2D information in our full analysis and only combine modes in annuli of equal . Only for the purposes of making 1D power spectrum plots, do we combine all modes of equal by reducing the noise in each mode by . However, coherent integration on a particular Fourier mode beats down thermal noise as the square-root of the number of samples in temperature, and hence linearly in the temperature-squared units of a power spectrum. Therefore, redundant measurements can improve the power spectrum sensitivity of an array to select Fourier modes faster than two non-redundant baselines measuring independent modes of the same magnitude. In our formalism, this additional sensitivity boost from redundant sampling enters through the metric for the amount of redundancy in an array configuration, defined in P12a as:
| (13) |
where labels individual pixels, and the number of one-second integration samples falling within pixel . The ratio measures the increase in sensitivity for a redundant array over one in which there is no sampling redundancy from either redundant baselines or redundant time samples. (This hypothetical “reference” array is obviously non-physical, as it assumes each independent integration in time will measure a statistically independent sky; in practice, this means that the metric incorporates the length of time an array can observe the same patch of sky.) An factor of is representative of the 32-element drift-scanning maximum-redundancy arrays described in P12a.
Using this metric, we can express the resultant sensitivity of an arbitrary array as:
| (14) |
This equation is derived in Appendix B.2 of P12a. The term is computed from sampling patterns including earth rotation aperture synthesis effects over a period of one hour phased to a single pointing center. One hour roughly corresponds to the time it takes a point on the sky to drift through the width of the BAOBAB primary beam, after which a statistically independent patch of sky comes to dominate the data, so that additional integration time only grows the sensitivity as . In general, accounts for most all effects regarding array configuration, so that the additional factors of and that appeared in equation 3.2.1 do not appear in 3.2.1. The factor of sets the total integration time per day, which will likely be limited by the size of a low foreground emission region (i.e., a “cold patch”). We choose 8 hours as the maximum time that can spent observing cold patches per day, a value influenced by existing all-sky maps and observations with PAPER.
3.2.2 Sample Variance
In galaxy redshift surveys, the sample variance can be calculated relatively simply by counting Fourier modes over an effective survey volume. However, in the case of BAOBAB, not all modes are equal, since we have used redundant samples of certain modes to beat down thermal noise. In creating a 1- or 2-D power spectrum out of the full 3-D Fourier space, we must take a weighted combination of these modes, since the ratio of thermal noise to sample variance can vary between every -mode measured.
Using inverse-variance weighting to combine each measurement at a particular -mode, one finds that the optimal estimator of the power spectrum results in an error that can be calculated by combining the errors on each measured mode in inverse-quadrature:
| (15) |
where is the resultant uncertainty on a given -mode, is the per-mode thermal noise calculated with equation 4 taking the full -coverage and earth-rotation synthesis into account, is the cosmological 21cm power spectrum (which is also the sample variance error), and is an index labeling the independent -modes measured by the array over which we are summing (note that we never combine modes into bands with significantly varying , which is why we can sum inverse absolute variance instead of inverse fractional variance).
Since the sample variance is completely a function of the -coverage of an array, it is best calculated numerically, as described in the preceding section. In Figure 8 we plot the 1D thermal noise and sample variance uncertainties for two maximum-redundancy configurations of BAOBAB — 35- and 132-tiles — shown in Figures 6 and 10.
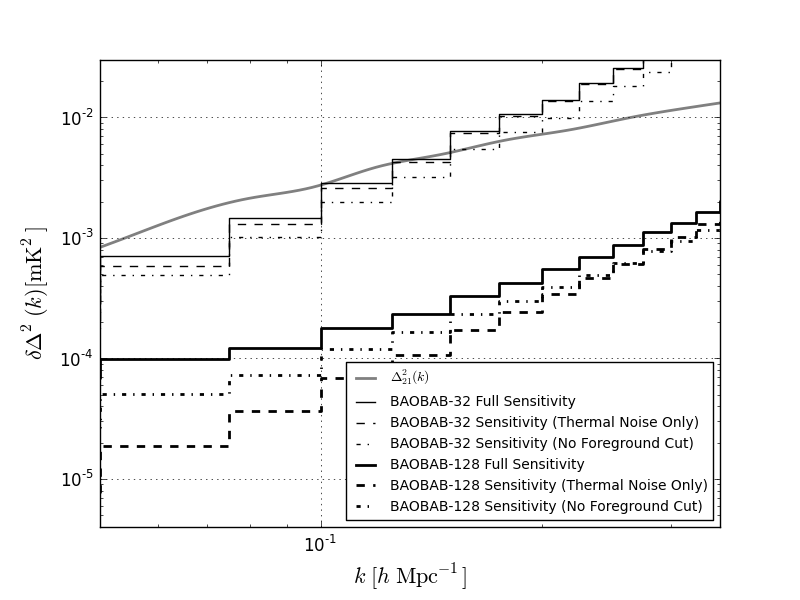
To calculate the sample variance, we use the 21cm brightness power spectrum from CAMB, also plotted for comparison. At the scale of the first acoustic peak, sample variance has clearly become the dominant source of error for a long integration with 132-elements; we discuss possible methods for improving this situation in §3.5 and §4.2. At the smaller scales, however, the analytic functions given in the previous section accurately reproduce the array sensitivity. Note that the thermal noise only curve in Figure 8 is not a perfect power law because not all baselines can probe the largest scales. We also plot the effect of our foreground model of §3.3; the achievable sensitivity if no modes are excluded by foregrounds is shown by the dot-dashed lines. The other two curves do include the effects of the foreground model.
3.2.3 Shot Noise
Measurements of the 21cm power spectrum will also be affected by the discrete nature of the neutral hydrogen distribution at low redshift. Only overdensities self-shielded to the Ry ionizing background contain neutral hydrogen, so we will be subject to the same galactic shot noise as optical redshift surveys. Following Seo et al. (2010), we assume that galaxy positions and luminosities are distributed with probability proportional to , where is the bias and is the mass overdensity. This allows us to treat shot noise as a scale-independent contribution to the power spectrum with . In terms of 21cm brightness:
| (16) |
Using the result of Seo et al. (2010) (who use a fit to the neutral hydrogen mass function of Zwaan et al. 2005), and at and . The number density of hydrogen-containing halos is substantially higher than for the bright galaxies used in optical/NIR surveys, making shot noise a substantially smaller contaminant; it will only begin to dominate the signal at . Regardless of uncertainties in this calculation, shot noise is clearly a subdominant effect, and we neglect it for the remainder of this work.
3.3. The Delay Spectrum Technique at
Before combining the results of the last two sections, we must discuss the effect of foregrounds on power spectrum measurements. The presence of foreground emission orders of magnitude brighter than the cosmological 21cm signal has been one of the major impediments for high-redshift 21cm tomography. P12b presented a per-baseline delay-spectrum technique for isolating foreground emission solely on the basis of its spectral smoothness. In this section we briefly recapitulate the principles of the delay-spectrum technique, and present a simple approximation for the behavior of foregrounds in the 600-900 MHz band.
The delay spectrum technique is a methodology for using each baseline of an interferometer as a independent probe of the 21cm power spectrum. The most powerful aspect of this approach is that the frequency dependence of a baseline’s Fourier sampling pattern, typically regarded as a major complication for 21cm experiments, naturally gives rise to an isolation of foreground emission in Fourier space. The ability to remove foregrounds on a per-baseline basis allows multiple baselines to be tuned to target the same Fourier mode for greater sensitivity, as opposed to more traditional techniques that use overlapping -coverage at multiple frequencies to avoid the issue of frequency-dependent sampling.
At the heart of the delay transform is a dual interpretation of the Fourier transform of interferometric visibilities along the frequency axis. On the one hand, for 21cm experiments, frequency maps directly into redshift since the observed signal is a spectral line. Therefore, the Fourier transform along the frequency axis gives , the Fourier wavemode along the line of sight. However, the frequency dependence of a baseline’s length (as measured in wavelengths), gives rise to the delay transform interpretation of the frequency Fourier transform presented in Parsons & Backer (2009). If performed over a wide enough bandwidth, this transform maps sources to Dirac delta functions in “delay space,” corresponding to the geometric delay of signal arrival time between the two elements of the baseline. There is thus a maximum delay at which any signal coming from the sky can appear, set by the physical length of the baseline. Furthermore, each source delta-function will be convolved by a kernel representing the Fourier transform of that source’s intrinsic spectrum (as well as any spectral features introduced by the instrument). Therefore, as long as the instrumental frequency structure is kept to a minimum, sources with smooth intrinsic spectra (such as foreground emission) will have their emission confined within the region of delay space set by the maximum delays (the so-called “horizon-limit”). Sources with unsmooth emission, like the 21cm signal, will be convolved by a broad kernel, scattering “sidelobes” well beyond the horizon limit, and creating a window for detecting 21cm emission free of smooth-spectrum foregrounds.
A major component of P12b was to calculate the mapping between cosmological -space and delay space. To phrase the same question in other terms, we explicitly calculated the effect of “mode-mixing” due to the frequency dependence of a baseline’s sampling on the recovery of the 21cm power spectrum. For short baselines like those used in BAOBAB, delay-modes proved an effective probe of the 21cm power spectrum, recovering the signal without corruption due to mode-mixing.
A full simulation quantifying the effects of the delay transform on foregrounds is beyond the scope of this work. Rather, we assign a minimum which depends on baseline length, below which we consider modes as being wholly contaminated by foregrounds. These contaminated modes are treated as not “measured” by the array, that is, they are excluded from the sum in equation 15. Since the horizon limit described above is a linear function of baseline length, we use which linearly increases on longer baselines. We model our choice for the exact value of on the simulations presented for PAPER in P12b, which finds for -baselines at 150 MHz foregrounds contaminate modes with . At EoR frequencies of 150 MHz, this cutoff maps to delay-modes of 400 ns. Since BAOBAB baselines are physically shorter by a factor of 5, this reduces the maximum delay-space contamination to 80 ns, which in turn maps back to at 750 MHz, using the parameter from equation 8. There are two important factors which will further serve to reduce this number for BAOBAB. First, celestial foregrounds should have power law spectra with steeply decrease in intensity versus frequency, and so will be fainter than at EoR frequencies. Although the signal has also fallen a similar amount, this reduced foreground structure will still make the delay transform even more effective at isolating foreground emission. Secondly, the narrower primary beam of BAOBAB will limit the delay modes from which there can be appreciable celestial emission, as sources near the horizon will be significantly attenuated.
To better determine the scale of in our foreground model, we perform a cursory calculation in which the delay-transform is applied to a simulated sky model. In these simulations, we assume the sky is entirely composed of point sources, where the source strength distribution follows a power-law with a slope of -2.0, normalized to a 2 Jy source per 10 steradians, a distribution derived empirically from PAPER data with extrapolation to the BAOBAB band. We also model the frequency spectrum of each source as a power-law with a normal distribution of spectral indices centered on -1.0 and a standard deviation of 0.25. We refer to these simulations as “cursory,” since they exclude instrumental effects such as RFI flagging and frequency-dependent beam structure. Instead, we use a single, frequency-independent Gaussian to model the primary beam of the BAOBAB tile; the potential effects of a more realistic beam model are discussed in §4. We find the delay transform confines foregrounds to -modes below a value of for baselines of 16 wavelengths. The value for the maximum delay of a 16 baseline at 750 MHz (i.e., the horizon limit) is , which implies that the intrinsic spectral behavior of foreground emission corresponds to a kernel of width . In this work, our foreground model is to exclude -modes smaller than the sum of the maximum realizable delay on a baseline (converted from seconds of light-travel time to using equation 8) and this kernel. The maximum realizable delay scales linearly with baseline length, while the additive kernel remains constant. In effect, this model states that intrinsic spectral structure in foregrounds corrupt beyond a naïve prediction based only on the physical length of the baseline. We explore the effects of modifying this model in §4.1.
3.4. Detecting the HI Power Spectrum
The first major science result from BAOBAB will be the detection of the 21cm power spectrum near . We present predictions for the power spectrum error bars using the formalism outlined above: we fully simulate the -coverage of our arrays, including the effects of earth-rotation synthesis, over a one-hour period. We then use equation 4 to evaluate the thermal noise level in each -pixel given an effective integration time in that pixel. We incorporate redshift-space distortion effects by reducing the magnitude of these thermal noise errors according to equation 3. We include the effects of sample variance in our measurements using equation 15, combining measurements with the same , but maintaining 2D information in the ()-plane. These error bars are further reduced by both the square root of the number of independent 1-hour pointings available per-day (8 in our fiducial calculation) and by the number of days observed. For the plots below, we further compress these errors into 1D, but use the full 2D information for our calculations of detection significance and cosmological parameter extraction in §3.5.
A high significance detection will be achievable with a short -month observation with a 35-tile system operating in the maximum redundancy shown in Figure 6.151515Correlator inputs have traditionally been in powers of 2; hence this array is our -tile configuration. The sensitivity calculations do assume that all 35 elements are correlated. The predicted measurement for a 30-day observation (240 hours) is shown in Figure 9.
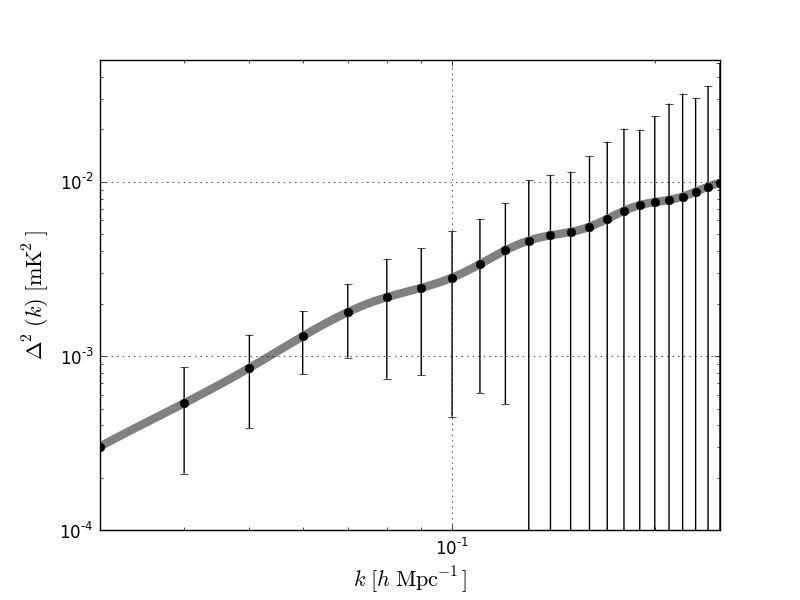
These observations assume a 100-MHz bandwidth centered on 750 MHz (). The net result is an detection of the 21cm power spectrum when our model for foreground emission from §3.3 is used to exclude contaminated modes. Results for bands centered on and 850 MHz are similar, yielding and detections, respectively. Although a small effect, we do modify the system temperature in each band to represent the change in sky temperature; a spectrally-flat is therefore only assumed on 100 MHz scales. Rather, the lower significance detection at the lowest redshifts results primarily from the scaling of the angular diameter distance; at redshift , a baseline corresponds to a wavemode of , limiting the number of baselines that can probe the largest-scale -modes where thermal noise is lowest. Over the range, both the 21cm signal and, the noise remain roughly constant in magnitude, the latter because it is dominated by a frequency-independent front-end amplifier noise temperature. This trend does not continue indefinitely, however, as sky noise increases with increasing redshift, eventually dominating the system temperature.
Measurements of this significance will allow for an accurate determination of , the combination of the cosmic neutral hydrogen fraction and the bias of neutral hydrogen containing regions, as a function of redshift. Breaking the degeneracy between these parameters will require additional information. Measuring redshift-space distortions can, in principle, separate the effects of the two terms. Constraints from a longer integration or a system with elements will further improve constraints on the neutral hydrogen power spectrum, and it will be possible for these systems to measure redshift-space distortion effects. Measuring these effects accurately requires more careful systematic control, which may warrant different configurations and observing strategies, so we postpone an exploration of this science to a future work (see, e.g., Masui et al. 2010).
3.5. Detecting Baryon Acoustic Oscillations
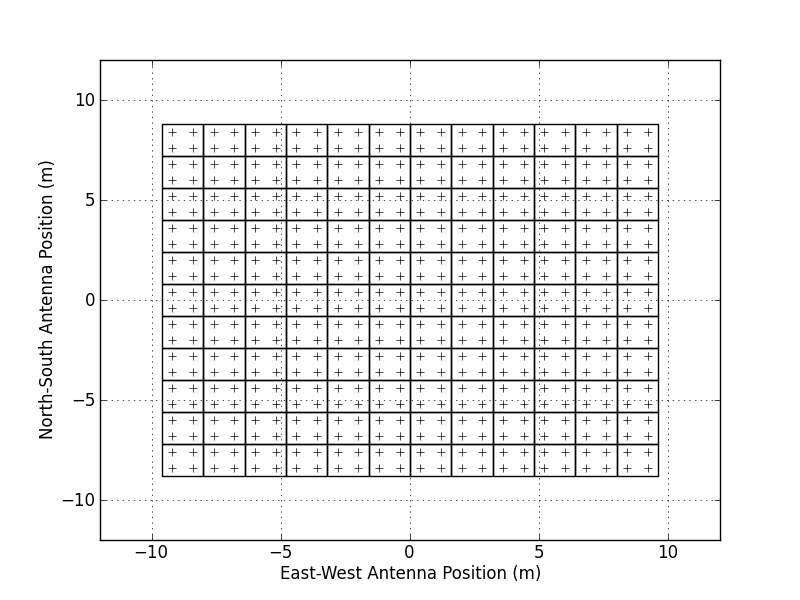
As shown in in Figure 8, a 132-tile BAOBAB array with the configuration shown in Figure 10 has effectively reached the sample variance limit in 180 days (1440 hours) of observing time.
Using the methodology described at the beginning of §3.4, we calculate that this observation yields a detection of the BAO features at , with effective and non-detections at the and bands, respectively, where we have isolated the BAO features from the broad-band shape of the power spectrum by removing a model fit using the transfer function from Eisenstein & Hu (1998). The effect of sample variance is most dominant at the lower redshifts, because the angular diameter distance scaling means that fewer samples of the BAO scale can be found in the same area of sky (this observation of 8-independent fields with a 0.045 steradian primary beam corresponds to an effective survey area of square degrees). While longer observations with the same array configuration can improve these constraints by reducing thermal noise on the smaller scale modes, a better approach will be to observe additional independent fields.
For our fiducial BAOBAB observation, we use an array which observes 24 independent fields (i.e., three independent declination observations for 8 hours per day), yielding an effective survey area of square degrees. We discuss the motivation for this particular approach to increasing survey volume in §4.2. There are several equivalent ways an experiment can probe this additional area. One approach would be to conduct three 1-year surveys, with the dipoles pointed towards a different declination; this could be achieved by physically placing the array on an platform inclined by , or potentially by adding a steering component to the tile-beamformers. If the beamformers are designed to allow multiple beams, one could in principle achieve similar sensitivities with only one year of observing, although at the expense of additional degrees of complexity in the system. If funding permits, the simplest approach might be to build three 132-tile BAOBAB arrays, each tilted towards a different declination; this would also yield the subsequently predicted sensitivities in only one season of observing. Note that for BAO science these independent configurations are potentially more desirable than an array with a larger number of fully correlated tiles. Since we are using a close-packed configuration, the addition of more tiles can only yield new modes at corresponding larger where the amount of BAO information is significantly diminished. It may be possible that more information could be recovered from these larger modes using a reconstruction method (e.g. Eisenstein et al. 2007, Padmanabhan et al. 2009, Noh et al. 2009), but we do not explore this option in this work. If there is significant BAO information beyond , then a -tile array could possibly yield tighter constraints than two 132-tile arrays observing for the same amount of time. In §4.2, we discuss other ways to increase the survey footprint and further reduce the effect of sample variance.
We plot the expected constraints for the three-declination range fiducial BAOBAB observations on the BAO features in Figure 11, where the broad band shape of the power spectrum has been removed using the transfer function fit of Eisenstein & Hu (1998), which neglects BAO.
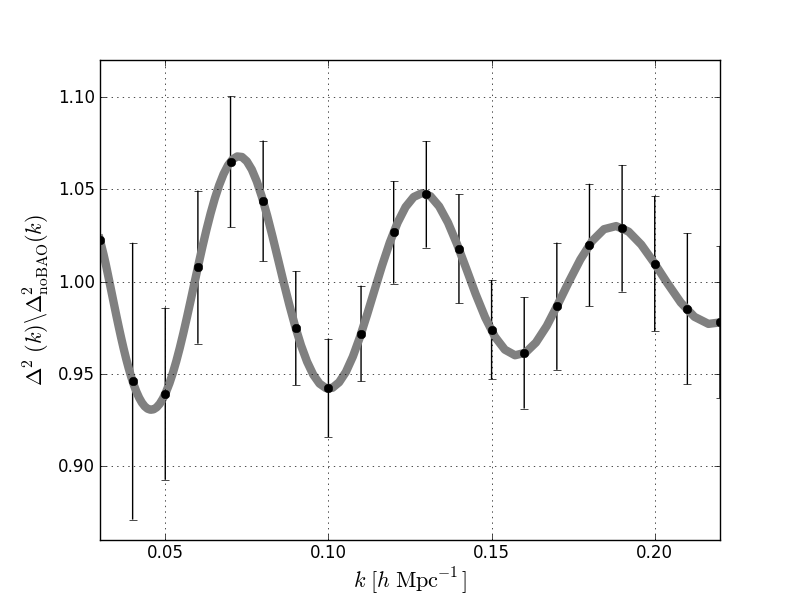
The measurements from a 180-day integration at each declination range with this array amount to an 4.7 detection of these features. Results are similar for the other redshift bins, with expected 3.6 and 5.7 detections at redshifts of 0.67 and 1.18, respectively. While it is clear from Figure 8 that sample variance dominates the errors on the largest scale modes after 180 days of observing one declination range, we find the additional sensitivity towards the higher BAO peaks with this observing duration yields better constraints on the signal than e.g., observing twice as many declination ranges for 90 days.
With a significant BAO detection, BAOBAB can also begin to place constraints on cosmological parameters. To quantify the effect of such measurements, we use the Fisher matrix formalism of the Joint Dark Energy Mission (JDEM) Figure of Merit Science Working Group (FoMSWG; Albrecht et al. 2009), defining our Fisher matrix as:
| (17) |
where is some observable measured at some values, is the variance in a measured value of , are cosmological parameters, and we sum over all measured values.
We propagate our power spectrum measurements into constraints on the Hubble parameter and angular diameter distance using this formalism, where , our measured power spectrum, , the set of -modes we measured, and . The derivatives with respect to and are straightforward to calculate, as they affect our measurements through the and parameters defined in equations 5 and 8. In effect, changing or changes the -modes sampled by BAOBAB. For our calculations, we exclude -modes deemed contaminated by our foreground model of §3.3. We also model the nonlinear degeneration of higher -modes using the elliptical Gaussian formula from Seo & Eisenstein (2007). To isolate the constraints provided by the BAO features from the broad-band shape of the power spectrum, we again remove a model fit using the transfer function from Eisenstein & Hu (1998). We split our data into three redshift bins centered at and 1.18. Although our frequency coverage is continuous between and 1.37, we find that there is minimal penalty for using only three bins in a Fisher matrix study. The result of this calculation is that our fiducial 3-declination, 180-day integration yields measurements of with an error ranging from 9% to 4.5% across our three redshift bins, from low to high redshift, and measurements of with errors effectively constant at 17% over the same range (note that errors % should be understood in the usual formal Fisher matrix sense – these measurements would not correspond to significant detections, taken in isolation). The particularly poor constraints on come from the loss of modes due to foreground emission; we further explore the effects of our foreground model in §4.1. Taking correlations between and into account, these measurements amount to to errors on a “dilation factor,” which scales and in proportion. Expressed as a single constraint on the distance scale, these measurements correspond to a dilation factor error of . The exact uncertainties are given in Table 2.
| Survey | Redshift | Error | Error | Correlation | Error |
|---|---|---|---|---|---|
| BAOBAB | 0.67 | 8.9% | 17.1% | 0.71 | 4.4% |
| BAOBAB | 0.89 | 6.1% | 16.4% | 0.72 | 3.3% |
| BAOBAB | 1.18 | 4.5% | 17.5% | 0.73 | 2.6% |
| BOSS-LRG | 0.35 | 1.8% | 1.0% | 0.41 | 0.7% |
| BOSS-LRG | 0.6 | 1.7% | 1.0% | 0.41 | 0.7% |
| BOSS-Ly | 2.5 | 3.1% | 7.4% | 0.58 | 2.0% |
It is also straightforward to propagate these errors on and into errors on underlying cosmological parameters through the Fisher matrix formalism of equation 17. In this case, is now or , and corresponds to the redshift bin it was measured in. is given by:
| (18) |
is given by:
| (19) |
The parameters of interest, , are now the underlying cosmological parameters. We use the parameterization of the JDEM FoMSWG, which include and (, where , and correspond to the matter, baryon, curvature and present day dark energy density, respectively) although we use the simpler 2-component form for the dark energy equation of state:
| (20) |
Following the convention of Dark Energy Task Force report (Albrecht et al., 2006), we marginalize over all other parameters after combining our Fisher matrices with constraints from other experiments, to create matrix representing constraints on and . As a Figure of Merit we use FoM = , where is our original Fisher matrix , marginalized to a 2D -space; this FoM is proportional to the inverse of the error ellipse area in the plane.
As a baseline for current dark energy constraints, we use the JDEM FoMSWG predictions for the Planck satellite, combined with constraints from the BOSS-LRG survey listed in Table 2 and a 5% error on . This combination of experiments yields an FoM of 8.7. Including the measurements from our fiducial BAOBAB observation increases this FoM value to 16.6. For comparison, BAOBAB combined with Planck and the constraint only yields a FoM of 4.4; the strength of BAOBAB therefore lies in adding complementary high-redshift information to the BOSS-LRG survey: the high-redshift constraints from BAOBAB can significantly improve our current measurements of the dark energy equation of state. (And, since the BOSS experiment is already underway and yielding high-quality data (Dawson et al., 2013), this is the more interesting comparison to make.) These constraints are plotted as 1 and 2 error ellipses in Figure 12.
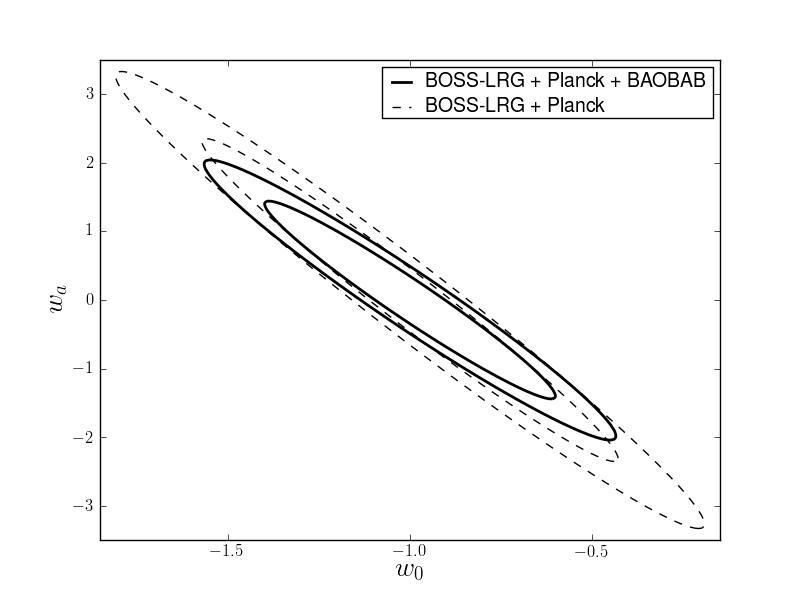
If we include the Ly forest survey of BOSS, our baseline constraint FoM becomes 17.8 which is improved to 23.0 with the inclusion of BAOBAB data. Even when the BOSS-Ly forest constraints between redshifts 2 and 3 are added, BAOBAB still provides valuable information, serving to increase the FoM by .
4. Discussion
We break this discussion into two parts. In §4.1, we consider two components of our analysis which may be overly simplistic: our model of the BAOBAB primary beam as a frequency-independent Gaussian, and our foreground emission model. We discuss the effects any shortcomings in these models could have on our conclusions. In §4.2, we consider the fact that sample variance is the dominant source of uncertainty in our measurements, and present future approaches that could improve the dark energy constraints possible with the BAOBAB instrument.
4.1. Potential Shortcomings in the Analysis
A effect that could modify the predictions presented in this work is the use of an overly simplistic model for the BAOBAB beam: a frequency independent Gaussian. Although this model is sufficient to calculate sensitivities, the effects of a more realistic beam model on the delay spectrum foreground removal technique will necessitate further investigations. The principle cause for concern is from the existence of frequency-dependent grating-lobe structure associated with the tile. These sidelobes can introduce apparent frequency structure into otherwise spectrally smooth foreground emission. If this structure represents a significant increase in the size of the delay-space convolving kernel, it will move the foreground contaminated region to higher values. If the size of the effect is large enough to push foreground emission on the shortest baselines beyond the first BAO peak, the predicted cosmological constraints could be reduced.
Note, however, that the frequency-independent Gaussian beam is not as bad an assumption as it might first appear. Our choice to neglect the frequency evolution of the beam is partially motivated by experience with the PAPER dipole beam, which, like BAOBAB, uses a modified dual-polarization “sleeved” dipole design to limit the frequency evolution of the beam to only over the MHz band (Pober et al., 2012). Of more concern are the grating lobes introduced by beamforming in tiles. If we were trying to image the sky, ignoring the grating lobes would be unjustified. With the delay spectrum approach, though, the issue is not the existence of the sidelobes, but their frequency dependence. If the frequency Fourier transform of the beam pattern is particularly broad — corresponding to rapid evolution of the beam pattern with frequency — then foreground emission will have a similarly broad footprint in delay space, compromising the 21cm signal. Of course, the grating lobes themselves will change position as a function of frequency, introducing additional structure not in the PAPER beam. However, as argued in P12b, it is difficult for an element only several wavelengths across to possess such frequency structure. As stated in §3.3, we will postpone a detailed investigation of these effects to a future paper with empirical studies of the beam shape, and focus here on array sensitivities, for which the Gaussian model is sufficient.
As noted in §3.5, our constraints on are significantly limited by foreground emission. We illustrate this effect in Figure 13, which shows the sampling pattern of BAOBAB-132 at 750 MHz in the (-)-plane, highlighting those modes discarded as contaminated by our foreground model of §3.3.
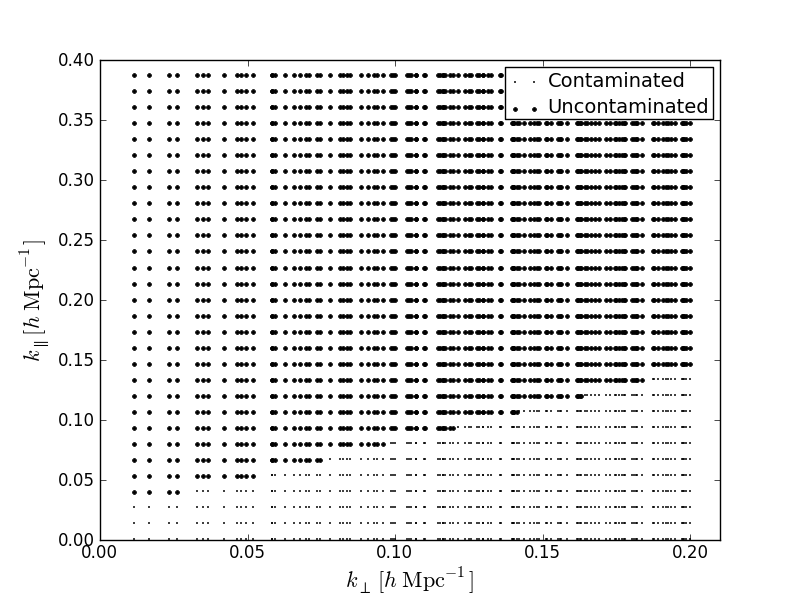
Foreground contamination effectively excludes modes where , i.e., transverse modes. This has the effect of significantly degrading the achievable constraints on .
While our foreground model presented in §3.3 is empirically motivated, accurate predictions for foreground emission will need to come from early BAOBAB arrays or other 21cm experiments. We briefly explore the effect of changing the size of the additive component of our foreground model arising from the spectral smoothness (or lack thereof) the emission. For our fiducial model, this term has a magnitude of ; as test cases, we analyze the constraints obtainable with BAOBAB if this term is changed by . This has the effect of moving the cutoff between contaminated and uncontaminated modes in Figure 13 up or down by .
The effect of increasing this term (i.e., if foreground emission is not as spectrally smooth as predicted) is to degrade the significance of our BAO detections in each of the redshift bins by , our , , and constraints by , , and percentage points, respectively. Reducing the foreground emission footprint in -space (i.e., if foregrounds are spectrally smoother than predicted) has similar effects with the opposite sign: the significance of our BAO detections in each band are increased by , our , , and constraints are improved by , , and percentage points, respectively. From this analysis, it is clear that foreground emission can significantly alter the achievable constraints on , but ultimately, the success of BAOBAB will not be determined by the details of foreground spectral properties.
4.2. Improving Our Constraints
As discussed in §3.5, sample variance dominates the uncertainties in power spectrum measurements from BAOBAB. However, measuring a new set of independent modes is not a trivial undertaking. By using a close-packed array, BAOBAB completely samples the -plane out to some maximum baseline length. Therefore a simple array rotation or reconfiguration will not yield new samples. Furthermore, in our highest redshift bin of , the longest baseline in the 132-tile array probes a transverse -mode of (and at lower redshift, this longest baseline corresponds to an even larger value of ). At this scale and smaller, most BAO information is being lost to non-linear damping effects. Therefore, while a larger array will beat down thermal noise faster, the cosmological returns from increasing the array size beyond tiles are limited, since effectively no new modes with significant BAO information will be probed.
As an upper-limit to the constraints obtainable with a single-declination, square degree, 132-tile BAOBAB observation (as opposed to our fiducial observation targeting three declination fields) we compute the results of a completely sample variance limited survey, i.e., one where thermal noise uncertainties have been set to 0 (although modes are still excluded using our foreground emission model). This sample variance limited 132-tile BAOBAB observation yields distance scale uncertainty of , averaged over our whole band (compared with for our fiducial 1-year observation of 3 independent declination fields). For comparison, a 10-year (14,400 hour), one declination observation with the same array yields a distance scale uncertainty of . Therefore, while better constraints can come from a longer observation, obtaining measurements of new modes to beat down sample variance is clearly the optimal way to proceed. There are two ways forward to achieve this goal: map a different volume of the universe (as with our fiducial experiment) or recover foreground corrupted modes. We consider each of these approaches in turn.
Since BAOBAB is a zenith-pointing, drift-scanning telescope, to map a new area of the sky, it will either need to be relocated to a different latitude or tilted to point towards a different patch of sky. Either option is potentially feasible, as even a 132-tile BAOBAB experiment spans less than 20 meters. With a primary beam full-width half-max of , there are independent pointings in declination that BAOBAB can target. Since our fiducial observation already targets three declination fields, mapping every declination could in principle yield up to reductions in the error bars over the results presented.
The other way to potentially measure new modes and beat down sample variance is to recover samples we have considered corrupted by foregrounds. There are two ways foregrounds compromise BAOBAB observations. The first is the limited observing time per-day, set by Galactic emission, which we have treated as irreparably corrupting all samples, even those in principle recoverable with the delay transform. If it is possible to observe all 24 hours of right ascension, as opposed to the 8 considered here, the constraints from a single observing season will increase by a factor of . While it is unlikely that all 24 hours of right ascension will be workable, our fiducial value of 8 hours per day, motivated by observations with present EoR experiments, may well be conservative, since Galactic synchrotron emission has significantly fallen in brightness compared to EoR frequencies.
Even when observing a “cold patch,” foregrounds corrupt large scale -modes with a footprint moving to smaller scales as baseline length increases (§3.3). If these modes could be retrieved, they could significantly increase the volume of Fourier space that BAOBAB can probe. As an upper-limit, we calculate the obtainable power spectrum constraints ignoring all foreground contamination. The result is that a 1-year (1440-hour) observation in each of three independent declination fields yields a distance scale uncertainty of 1.4% combined over the entire redshift range, an increase of over the same observation including foreground emission. In particular, we note that a foreground-free observation yields errors of on at redshifts of 0.67, 0.89 and 1.18, respectively — a factor of improvement over the predictions for an observation including the effects of foreground emission. While an analysis of foreground removal techniques is beyond the scope of this work, this result is suggests that foreground removal may be the way to improve constraints on .
As an order of magnitude estimate, we can consider whether a foreground removal or subtraction scheme might be more effective in the BAO band than at EoR frequencies. At , the 750-MHz BAO 21cm power spectrum reaches , compared with a peak brightness at EoR frequencies of 150 MHz reaching . The steep spectrum Galactic synchrotron emission has a spectral index of -2.5, and so will fall by a factor of in units of temperature squared. (Extragalactic point sources are less steep spectrum, and so will not fall off in brightness as steeply. Therefore, this estimate can be considered a lower limit on the foreground-to-signal ratio). Roughly speaking, then, the foreground-to-signal ratio is unchanged compared with EoR experiments, suggesting that a foreground isolation scheme like the delay-spectrum technique is still likely the most viable approach for first-generation experiments limited in collecting area.
5. Conclusions
In this work we have presented a concept for a new experiment using the redshifted 21cm line of neutral hydrogen to probe cosmology at . The BAO Broadband and Broad-beam Array (BAOBAB) will incorporate both the hardware and analysis infrastructure developed for 21cm experiments at higher redshifts.
The hardware design will borrow heavily from the Precision Array for Probing the Epoch of Reionization (PAPER) and the Murchsion Widefield Array (MWA), using a scaled version of the PAPER dipoles as a feed element, tiling dipoles as done by the MWA, and modifying the CASPER FPGA/GPU PAPER correlator to perform full dual-polarization cross-correlations of all elements. Significant improvements to the system temperature will be brought about through state-of-the-art uncooled, low-noise amplifiers. Relative to PAPER, the collecting area will be substantially increased through the use of tiles of 4 dipoles combined through a beamformer, as demonstrated by MWA efforts. Although we have largely avoided specific cost-estimates, it is fair to say that this infrastructure is obtainable at a fraction of the cost of the -million dollar ground-based optical redshift surveys.
On the analysis side, BAOBAB will use the maximum redundancy configurations and delay spectrum foreground removal techniques presented in Parsons et al. (2012a) and Parsons et al. (2012b) to enhance sensitivity to Fourier modes along the line-of-sight. Motivated by the science of Baryon Acoustic Oscillations, BAOBAB will utilize extremely close-packed arrays to maximize the number of short baselines. The sensitivity calculations presented here show that BAOBAB will achieve several milestone measurements over our anticipated staged deployment process. A -element BAOBAB system will yield high significance detections of the HI power spectrum, and constrain the evolution of the cosmic neutral hydrogen fraction from to 1.5 as well as the bias of DLAs. Over the same wide redshift range, a -element system will allow for a first detection of the BAO features in the power spectrum, and yield errors on the distance scale at the several percent level. When combined with our current constraints on dark energy, including those forthcoming from the BOSS and Planck experiments, BAOBAB’s measurements result in substantial increase in the Dark Energy Task Force Figure of Merit, representing constraints on the nature and time evolution of dark energy over a wide range of cosmic history.
References
- Adams et al. (2011) Adams, J. J., et al. 2011, ApJS, 192, 5
- Albrecht et al. (2006) Albrecht, A., et al. 2006, arXiv:astro-ph/0609591
- Albrecht et al. (2009) —. 2009, arXiv:0901.0721
- Amendola et al. (2012) Amendola, L., et al. 2012, arXiv:1206.1225
- Ansari et al. (2012a) Ansari, R., Campagne, J.-E., Colom, P., Magneville, C., Martin, J.-M., Moniez, M., Rich, J., & Yèche, C. 2012a, Comptes Rendus Physique, 13, 46
- Ansari et al. (2012b) Ansari, R., Campagne, J.-E., Colom, P., Le Goff, J.-M., Magneville, C., Martin, J.-M., Moniez, M., Rich, J., & Yèche, C. 2012b, A&A, 540, 129
- Barkana & Loeb (2007) Barkana, R., & Loeb, A. 2007, Reports on Progress in Physics, 70, 627
- Battye et al. (2012) Battye, R. A., Browne, I. W. A., Dickinson, C., Heron, G., Maffei, B., & Pourtsidou, A. 2012, arXiv:1209.0343
- Chang et al. (2010) Chang, T.-C., Pen, U.-L., Bandura, K., & Peterson, J. B. 2010, Nature, 466, 463
- Chang et al. (2008) Chang, T.-C., Pen, U.-L., Peterson, J. B., & McDonald, P. 2008, Physical Review Letters, 100, 091303
- Clark et al. (2011) Clark, M. A., La Plante, P. C., & Greenhill, L. J. 2011, arXiv:1107.4264
- Dawson et al. (2013) Dawson, K. S., et al. 2013, AJ, 145, 10
- Drinkwater et al. (2010) Drinkwater, M. J., et al. 2010, MNRAS, 401, 1429
- Eisenstein & Hu (1998) Eisenstein, D. J., & Hu, W. 1998, ApJ, 496, 605
- Eisenstein et al. (1998) Eisenstein, D. J., Hu, W., & Tegmark, M. 1998, ApJ, 504, L57
- Eisenstein et al. (1999) —. 1999, ApJ, 518, 2
- Eisenstein et al. (2007) Eisenstein, D. J., Seo, H.-J., Sirko, E., & Spergel, D. N. 2007, ApJ, 664, 675
- Eisenstein et al. (2005) Eisenstein, D. J., et al. 2005, ApJ, 633, 560
- Ellis et al. (2012) Ellis, R., et al. 2012, arXiv:1206.0737
- Jacobs et al. (2011) Jacobs, D. C., et al. 2011, ApJ, 734, L34
- Kaiser (1987) Kaiser, N. 1987, MNRAS, 227, 1
- Kraus (1966) Kraus, J. D. 1966, Radio Astronomy (New York, NY: McGraw-Hill)
- Larson et al. (2011) Larson, D., et al. 2011, ApJS, 192, 16
- Lewis et al. (2000) Lewis, A., Challinor, A., & Lasenby, A. 2000, ApJ, 538, 473
- Lonsdale et al. (2009) Lonsdale, C. J., et al. 2009, IEEE Proceedings, 97, 1497
- Madau et al. (1997) Madau, P., Meiksin, A., & Rees, M. J. 1997, ApJ, 475, 429
- Masui et al. (2010) Masui, K. W., McDonald, P., &Pen, U.-L. 2010, Phys. Rev. D, 81, 103527
- McDonald & Eisenstein (2007) McDonald, P., & Eisenstein, D. J. 2007, Phys. Rev. D, 76, 063009
- Morales & Wyithe (2010) Morales, M., & Wyithe, J. 2010, Annual Review of Astronomy and Astrophysics, 48, 127
- Morales (2005) Morales, M. F. 2005, ApJ, 619, 678
- Noh et al. (2009) Noh, Y., White, M., & Padmanabhan, N. 2009, Phys. Rev. D, 80, 123501
- Padmanabhan et al. (2009) Padmanabhan, N., White, M., & Cohn, J. D. 2009, Phys. Rev. D, 79, 063523
- Parsons et al. (2012a) Parsons, A., Pober, J., McQuinn, M., Jacobs, D., & Aguirre, J. 2012a, ApJ, 753, 81
- Parsons et al. (2008) Parsons, A., et al. 2008, PASP, 120, 1207
- Parsons & Backer (2009) Parsons, A. R., & Backer, D. C. 2009, AJ, 138, 219
- Parsons et al. (2012b) Parsons, A. R., Pober, J. C., Aguirre, J. E., Carilli, C. L., Jacobs, D. C., & Moore, D. F. 2012b, ApJ, 756, 165
- Parsons et al. (2010) Parsons, A. R., et al. 2010, AJ, 139, 1468
- Peterson et al. (2006) Peterson, J. B., Bandura, K., & Pen, U. L. 2006, arXiv:astro-ph/0606104
- Pober et al. (2012) Pober, J. C., et al. 2012, AJ, 143, 53
- Pritchard & Loeb (2012) Pritchard, J. R., & Loeb, A. 2012, Reports on Progress in Physics, 75, 086901
- Schlegel et al. (2009) Schlegel, D., White, M., & Eisenstein, D. 2009, in Astronomy, Vol. 2010, astro2010: The Astronomy and Astrophysics Decadal Survey, 314–+
- Schlegel et al. (2011) Schlegel, D., et al. 2011, arXiv:1106.1706
- Seo et al. (2010) Seo, H.-J., Dodelson, S., Marriner, J., Mcginnis, D., Stebbins, A., Stoughton, C., & Vallinotto, A. 2010, ApJ, 721, 164
- Seo & Eisenstein (2007) Seo, H.-J., & Eisenstein, D. J. 2007, ApJ, 665, 14
- Thompson et al. (2001) Thompson, A. R., Moran, J. M., & Swenson, G. W. 2001, Interferometry and Synthesis in Radio Astronomy, 2nd Edition (New York, NY: John Wiley & Sons)
- Wright (2006) Wright, E. L. 2006, PASP, 118, 1711
- Wyithe et al. (2008) Wyithe, J. S. B., Loeb, A., & Geil, P. M. 2008, MNRAS, 383, 1195
- Zwaan et al. (2005) Zwaan, M. A., Meyer, M. J., Staveley-Smith, L., & Webster, R. L. 2005, MNRAS, 359, L30