Transit Timing Observations from Kepler: VII. Confirmation of 27 planets in 13 multiplanet systems via Transit Timing Variations and orbital stability
Abstract
We confirm 27 planets in 13 planetary systems by showing the existence of statistically significant anti-correlated transit timing variations (TTVs), which demonstrates that the planet candidates are in the same system, and long-term dynamical stability, which places limits on the masses of the candidates—showing that they are planetary. All of these newly confirmed planetary systems have orbital periods that place them near first-order mean motion resonances (MMRs), including 6 systems near the 2:1 MMR, 5 near 3:2, and one each near 4:3, 5:4, and 6:5. In addition, several unconfirmed planet candidates exist in some systems (that cannot be confirmed with this method at this time). A few of these candidates would also be near first order MMRs with either the confirmed planets or with other candidates. One system of particular interest, Kepler-56 (KOI-1241), is a pair of planets orbiting a 12th magnitude, giant star with radius over three times that of the Sun and effective temperature of 4900 K—among the largest stars known to host a transiting exoplanetary system.
keywords:
celestial mechanics; methods: data analysis; techniques: photometric1 Introduction
NASA’s Kepler mission continues to identify many candidate transiting exoplanet systems, which now number nearly 2000 (Borucki et al., 2011; Batalha et al., 2012). The process of confirming or validating these planet candidates as real exoplanets often requires a significant amount of analysis and effort; and consequently the number of confirmed planets lags far behind the new candidate discoveries. In an effort to ameliorate this situation we published a new approach to planet confirmation that requires a less detailed analysis (Fabrycky et al., 2012a; Ford et al., 2012a; Steffen et al., 2012a) and can generally be accomplished in much less time. This approach essentially relies on demonstrating that two transiting candidates are in the same system and that their masses are planetary. Both aspects of this confirmation method rely on dynamical interactions. First, planets are shown to be in the same system by looking for anticorrelated transit timing variations (TTVs) that arise from short-term changes in obital period due to planet-planet interactions within the system (Agol et al., 2005; Holman and Murray, 2005). Second, the candidates are shown to have planetary mass by requiring that the system be dynamically stable.
This method is a particularly useful means of identifying true planetary systems from among the false positive systems—allowing ground-based follow-up resources to be devoted to studying systems that are both real and dynamically interesting (as manifest by their significant TTV signal). While detailed TTV analyses have been instrumental in confirming several multiplanet systems (e.g., Kepler 9 (Holman:2010), Kepler 11 (Lissauer et al., 2011a), Kepler 18 (Cochran et al., 2011), and Kepler 36 (Carter et al., 2012)), 21 planets in 10 multiplanet systems have been confirmed by these new methods that we apply again here (Kepler systems 23 through 32, Fabrycky et al. (2012a); Ford et al. (2012a); Steffen et al. (2012a)). These 10 confirmed multiplanet systems include several that have particularly interesting properties and are likely to be the subject of future investigations. For example: all of the systems are near mean-motion resonance (MMR), Kepler-25 (KOI-244, Steffen et al. (2012a)) is relatively bright at Kp , Kepler-30 (KOI-806, Fabrycky et al. (2012a)) has TTVs that deviate from a constant period by nearly a day over the course of the Kepler data, and many (Kepler 23, 24, 26, 31, and 32) have additional planet candidates that may be confirmed or validated. As more data from Kepler are gathered, new systems that can be confirmed by the means outlined above can be found. In this paper we apply the same methods used in (Fabrycky et al., 2012a; Ford et al., 2012a; Steffen et al., 2012a) to 2 additional quarters of Kepler data (all data through Q8) and confirm 27 new planets in 13 systems.
This paper is organized as follows. In §2 we summarize the stellar properties for the host stars in these systems and the basic orbital and physical characteristics of the planets. The dynamical confirmation of the relevant 27 planets is presented in §3. We make concluding remarks in §4. Data and results from some of the analyses performed in this paper are shown in the Appendix.
2 Stellar and Planet Properties
We take the stellar properties from the tables given in Batalha et al. (2012). The procedure used for determining the stellar parameters (effective temperature Teff, surface gravity and stellar radius ) for our systems was discussed in detail in Section 5.2 of that paper. In most cases, Teff and that were determined photometrically and reported in the Kepler Input Catalog were used as a starting point. These values were then corrected by matching to the Yonsei-Yale stellar evolution models (Demarque et al., 2004) (cf. Figure 2 of Batalha et al. (2012)). Kepler Followup Observing Program reconnaissance spectra have also been obtained for most of these KOIs. In general there is reasonable agreement between the stellar parameters in Table 1 and those obtained through the reconnaissance spectroscopy. In a few cases of disagreement, the discrepancy can be attributed to the low S/N of the reconnaissance spectra, thus we rely on the published parameters. The basic planet size and orbital properties for the systems under consideration are also taken from (Batalha et al., 2012) and are given in Table 2111We note that because these planets show significant TTVs, the estimates for the transit depth and duration will be off slightly since the Kepler pipeline assumes a linear ephemeris.. We note that the giant star KOI-1241 along with KOI-262 are quite bright and therefore amenable to in-depth asteroseismic study. We expect that the stellar properties, particularly for the giant, may be revised somewhat from the values presented here and in Batalha et al. (2012) once such studies have been completed. In neither case is the planet interpretation of the transiting candidates in jeopardy.
| Kepler | KOI | KID | Kp | Teff | |||
|---|---|---|---|---|---|---|---|
| (K) | () | () | |||||
| 48 | 148 | 5735762 | 13.04 | 5190 | 4.49 | 0.89 | 0.89 |
| 49 | 248 | 5364071 | 15.264 | 3974 | 4.73 | 0.53 | 0.55 |
| 50 | 262 | 11807274 | 10.421 | 6058 | 3.98 | 1.88 | 1.23 |
| 51 | 620 | 11773022 | 14.669 | 5803 | 4.52 | 0.91 | 1.00 |
| 52 | 775 | 11754553 | 15.095 | 4075 | 4.74 | 0.52 | 0.54 |
| 53 | 829 | 5358241 | 15.386 | 5858 | 4.53 | 0.89 | 0.98 |
| 54 | 886 | 7455287 | 15.847 | 3705 | 4.75 | 0.5 | 0.51 |
| 55 | 904 | 8150320 | 15.791 | 4362 | 4.7 | 0.58 | 0.62 |
| 56 | 1241 | 6448890 | 12.44 | 4931 | 3.58 | 3.14 | 1.37 |
| 57 | 1270 | 8564587 | 14.809 | 5145 | 4.63 | 0.73 | 0.83 |
| 58 | 1336 | 4077526 | 14.82 | 5843 | 4.39 | 1.03 | 0.95 |
| 59 | 1529 | 9821454 | 14.307 | 6074 | 4.51 | 0.94 | 1.04 |
| 60 | 2086 | 6768394 | 13.959 | 5915 | 4.13 | 1.5 | 1.11 |
| Planet | KOI | Radius | Duration | period | ||||||||
|---|---|---|---|---|---|---|---|---|---|---|---|---|
| () | (hours) | (days) | (days) | (days) | (days) | |||||||
| 48 b | 148.01 | 0.02208 | 3.1E-04 | 2.14 | 2.8412 | 57.06301 | 1.0E-03 | 4.7779803 | 1.4E-05 | 1.0000 | ||
| 48 c | 148.02 | 0.03243 | 4.0E-04 | 3.14 | 3.5027 | 58.33981 | 7.7E-04 | 9.6739283 | 2.0E-05 | 2.0247 | 2.0247 | 1.03 |
| 148.03 | 0.02426 | 4.1E-04 | 2.35 | 5.9308 | 79.06567 | 2.8E-03 | 42.895916 | 3.2E-04 | 8.9778 | 4.4342 | 0.97 | |
| 248.03 | 0.03213 | 1.4E-03 | 1.85 | 1.8736 | 105.12838 | 1.2E-03 | 2.576555 | 1.2E-05 | 1.0000 | |||
| 49 b | 248.01 | 0.04723 | 1.9E-03 | 2.72 | 2.9766 | 103.28753 | 1.0E-03 | 7.2037945 | 2.2E-05 | 2.7959 | 2.7959 | 0.89 |
| 49 c | 248.02 | 0.04423 | 2.0E-03 | 2.55 | 2.8577 | 102.84919 | 2.2E-03 | 10.9129343 | 6.9E-05 | 4.2355 | 1.5149 | 1.20 |
| 248.04 | 0.03445 | 2.0E-03 | 1.99 | 2.8905 | 74.26167 | 4.3E-03 | 18.5962181 | 2.1E-04 | 7.2175 | 1.7041 | 1.18 | |
| 50 b | 262.01 | 0.01074 | 1.5E-04 | 2.2 | 4.2439 | 105.63186 | 2.2E-03 | 7.8125124 | 5.2E-05 | 1.0000 | ||
| 50 c | 262.02 | 0.01362 | 3.0E-04 | 2.79 | 2.6022 | 69.96857 | 2.2E-03 | 9.3761368 | 5.6E-05 | 1.2001 | 1.2001 | 1.73 |
| 51 b | 620.01 | 0.07074 | 2.0E-04 | 7.05 | 5.7799 | 92.10435 | 6.2E-04 | 45.1555023 | 7.2E-05 | 1.0000 | ||
| 51 c | 620.03 | 0.05731 | 8.1E-03 | 5.71 | 2.7849 | 228.32095 | 2.2E-03 | 85.3128662 | 9.6E-04 | 1.8893 | 1.8893 | 2.57 |
| 620.02 | 0.09717 | 2.4E-04 | 9.68 | 8.4192 | 145.02345 | 6.2E-04 | 130.1831055 | 3.3E-04 | 2.8830 | 1.5259 | 0.38 | |
| 52 b | 775.02 | 0.03698 | 3.8E-03 | 2.1 | 2.4223 | 109.37692 | 1.5E-03 | 7.8773565 | 3.8E-05 | 1.0000 | ||
| 52 c | 775.01 | 0.03225 | 3.3E-03 | 1.84 | 3.1252 | 105.72549 | 2.7E-03 | 16.3850021 | 1.4E-04 | 2.0800 | 2.0800 | 0.99 |
| 775.03 | 0.03268 | 3.4E-03 | 1.86 | 4.1756 | 84.59631 | 4.4E-03 | 36.4459076 | 4.9E-04 | 4.6267 | 2.2243 | 0.98 | |
| 829.02 | 0.01987 | 8.4E-04 | 1.92 | 4.0291 | 71.78461 | 4.8E-03 | 9.7519283 | 1.3E-04 | 1.0000 | |||
| 53 b | 829.01 | 0.02987 | 1.1E-03 | 2.89 | 4.4815 | 107.77608 | 2.9E-03 | 18.6489525 | 1.6E-04 | 1.9123 | 1.9123 | 1.12 |
| 53 c | 829.03 | 0.03277 | 1.2E-03 | 3.17 | 5.0162 | 96.84816 | 3.8E-03 | 38.5583038 | 4.1E-04 | 3.9539 | 2.0676 | 1.14 |
| 54 b | 886.01 | 0.03842 | 1.3E-03 | 2.1 | 3.4129 | 103.20573 | 2.9E-03 | 8.0109434 | 6.9E-05 | 1.0000 | ||
| 54 c | 886.02 | 0.02254 | 1.0E-03 | 1.23 | 4.9738 | 76.44842 | 9.1E-03 | 12.0717249 | 2.9E-04 | 1.5069 | 1.5069 | 0.79 |
| 886.03 | 0.0318 | 4.7E-03 | 1.74 | 3.8411 | 85.32592 | 9.7E-03 | 20.9954014 | 5.8E-04 | 2.6208 | 1.7392 | 1.56 | |
| 904.01 | 0.02607 | 2.7E-03 | 1.65 | 1.6829 | 103.14939 | 1.4E-03 | 2.2111206 | 1.2E-05 | 1.0000 | |||
| 904.04 | 0.02306 | 2.5E-03 | 1.46 | 2.1085 | 68.04531 | 3.1E-03 | 4.6175265 | 4.2E-05 | 2.0883 | 2.0883 | 1.02 | |
| 904.05 | 0.02689 | 2.8E-03 | 1.7 | 2.3911 | 70.91412 | 4.2E-03 | 10.1986198 | 1.1E-04 | 4.6124 | 2.2087 | 1.15 | |
| 55 b | 904.02 | 0.03832 | 3.9E-03 | 2.43 | 3.4932 | 111.79598 | 3.1E-03 | 27.9481449 | 2.4E-04 | 12.6398 | 2.7404 | 0.96 |
| 55 c | 904.03 | 0.0349 | 3.7E-03 | 2.21 | 5.0617 | 71.99284 | 4.5E-03 | 42.1516418 | 5.3E-04 | 19.0635 | 1.5082 | 0.79 |
| 56 b | 1241.02 | 0.0112 | 3.3E-04 | 3.84 | 13.5401 | 68.55893 | 8.8E-03 | 10.5034294 | 2.5E-04 | 1.0000 | ||
| 56 c | 1241.01 | 0.02292 | 3.3E-04 | 7.85 | 11.0797 | 80.0928 | 6.1E-03 | 21.4050484 | 3.6E-04 | 2.0379 | 2.0379 | 1.55 |
| 57 b | 1270.01 | 0.02762 | 6.6E-03 | 2.19 | 1.1185 | 71.5584 | 1.0E-03 | 5.7293196 | 1.8E-05 | 1.0000 | ||
| 57 c | 1270.02 | 0.01958 | 4.6E-03 | 1.55 | 1.7074 | 66.99083 | 2.7E-03 | 11.6092567 | 8.6E-05 | 2.0263 | 2.0263 | 0.83 |
| 58 b | 1336.01 | 0.02471 | 1.0E-03 | 2.78 | 4.3967 | 69.87048 | 5.6E-03 | 10.2184954 | 1.5E-04 | 1.0000 | ||
| 58 c | 1336.02 | 0.02542 | 1.1E-03 | 2.86 | 5.1013 | 65.43209 | 6.6E-03 | 15.5741568 | 2.7E-04 | 1.5241 | 1.5241 | 0.99 |
| 59 b | 1529.02 | 0.01065 | 5.3E-04 | 1.1 | 5.977 | 70.74767 | 1.1E-02 | 11.8681707 | 3.6E-04 | 1.0000 | ||
| 59 c | 1529.01 | 0.01923 | 7.6E-04 | 1.98 | 4.1249 | 80.69818 | 6.5E-03 | 17.9801235 | 3.0E-04 | 1.5150 | 1.5150 | 1.66 |
| 60 b | 2086.01 | 0.01397 | 3.9E-04 | 2.28 | 4.1519 | 69.03637 | 4.7E-03 | 7.1316185 | 9.3E-05 | 1.0000 | ||
| 60 c | 2086.02 | 0.01513 | 4.0E-04 | 2.47 | 4.4059 | 73.06513 | 4.7E-03 | 8.9193459 | 1.1E-04 | 1.2507 | 1.2507 | 1.02 |
| 60 d | 2086.03 | 0.0156 | 8.7E-04 | 2.55 | 2.9856 | 66.24626 | 6.3E-03 | 11.9016171 | 2.0E-04 | 1.6689 | 1.3344 | 1.62 |
3 Confirmation via TTVs and orbital stability
3.1 Anticorrelated TTVs
As mentioned above and discussed in some detail in (Fabrycky et al., 2012a; Ford et al., 2012a; Steffen et al., 2012a), the presence of anticorrelated TTV signatures among planet candidates on a single target is a strong indicator that the objects are in the same system. Multiple methods can be used to establish these correlations—the approaches that we have used in the past include using Gaussian Process (GP) modeling (Ford et al., 2012a), Fourier analysis methods (Steffen et al., 2012a), and the use of simple dynamical modeling of the potential planetary system (Fabrycky et al., 2012a). Each of these approaches relies on differing amounts of physical underpinning (dynamical modeling applying the most physics while GP the least). They also use different fundamental assumptions regarding the specific form of the TTV signal (GP being the most general of the three while dynamical modeling is the least). The Fourier method lies between the other two methods both in terms of the assumed properties of the TTV signal and its physical underpinnings. Consequently, these different methods are quite complementary—all are suitable for confirming some systems but none are suitable for confirming all systems that lie within the reach of this overall approach.
The GP method of Ford et al. (2012a) models the TTV signal as a Gaussian process, deriving a generalized functional form for each object in a given pair. From these GPs the correlation between TTV signals of the two planet candidates is calculated. Finally, we estimate the probability that the observed anticorrelation is due to timing noise with a Monte Carlo analysis. For this analysis we scramble the TTV residuals, remove any resulting linear trend, model the new residuals as a GP, and recalculate the correlation coefficient. We require, as a threshold to claim that the correlation is dynamical in nature, that less than 0.1% of the Monte Carlo realizations have a more significant correlation than the actual data.
The Fourier method of Steffen et al. (2012a) generates a periodogram of the TTV signal by fitting sinusoidal models on a grid of periods:
| (1) |
where , , and are model parameters, and is the test timescale222This formula, originally given in Steffen et al. (2012a), had a typo that has been corrected here and in Steffen et al. (2012b). Specifically, is replaced by in the argument of the sinusoid functions.. The fitted values for and are stored along with their measured uncertainties, and , derived from the covariance matrix of the three-parameter fit. Next, a quantity
| (2) |
is calculated for each of the sampled periods where the “1” and “2” subscripts correspond to the two objects. Once these values have been calculated, the maximum value of for a given candidate pair, , is recorded. Finally, a Monte Carlo analysis is done to identify the probability of randomly finding a as large as that observed. Again, our threshold for claiming evidence for dynamical interactions is 0.1%.
The dynamical modeling of Fabrycky et al. (2012a) seeks to extract the dominant TTV signal from numerical integration, and determine if this signal is present in the data. A numerical integration of the system is run for each pair of planets in Table 2. We assume circular, coplanar orbits with the same orbital properties (period, phase) and physical properties (mass, derived from radius via the power-law as was used in Lissauer et al. (2011b)) as the planets we are modelling. From that simulation, the dominant frequency of the resulting TTV signal is found in a periodogram (Lomb, 1976). We fit a sinusoid of that frequency to the data, determining its amplitude. Again, a Monte Carlo study is done to see if a random realization can produce that large an amplitude at the theoretically-predicted frequency. One unique characteristic of the dynamical modeling, contrasted with the GP and Fourier methods, is that it does not require a significant TTV signal from both objects in the tested pair—and therefore not requiring an anti-correlation in the timing residuals. Rather, we only use the transits of the perturbing planet to determine its period and phase, from which the perturbed planet’s expected TTV signal follows. Thus, while it may lack generality concerning the types of TTV signals it can find, it compensates somewhat for this lack with its power to confirm the cohabitation of candidates in a system when one TTV signal is very weak—e.g., if a high-mass planet is being perturbed by a low-mass one.
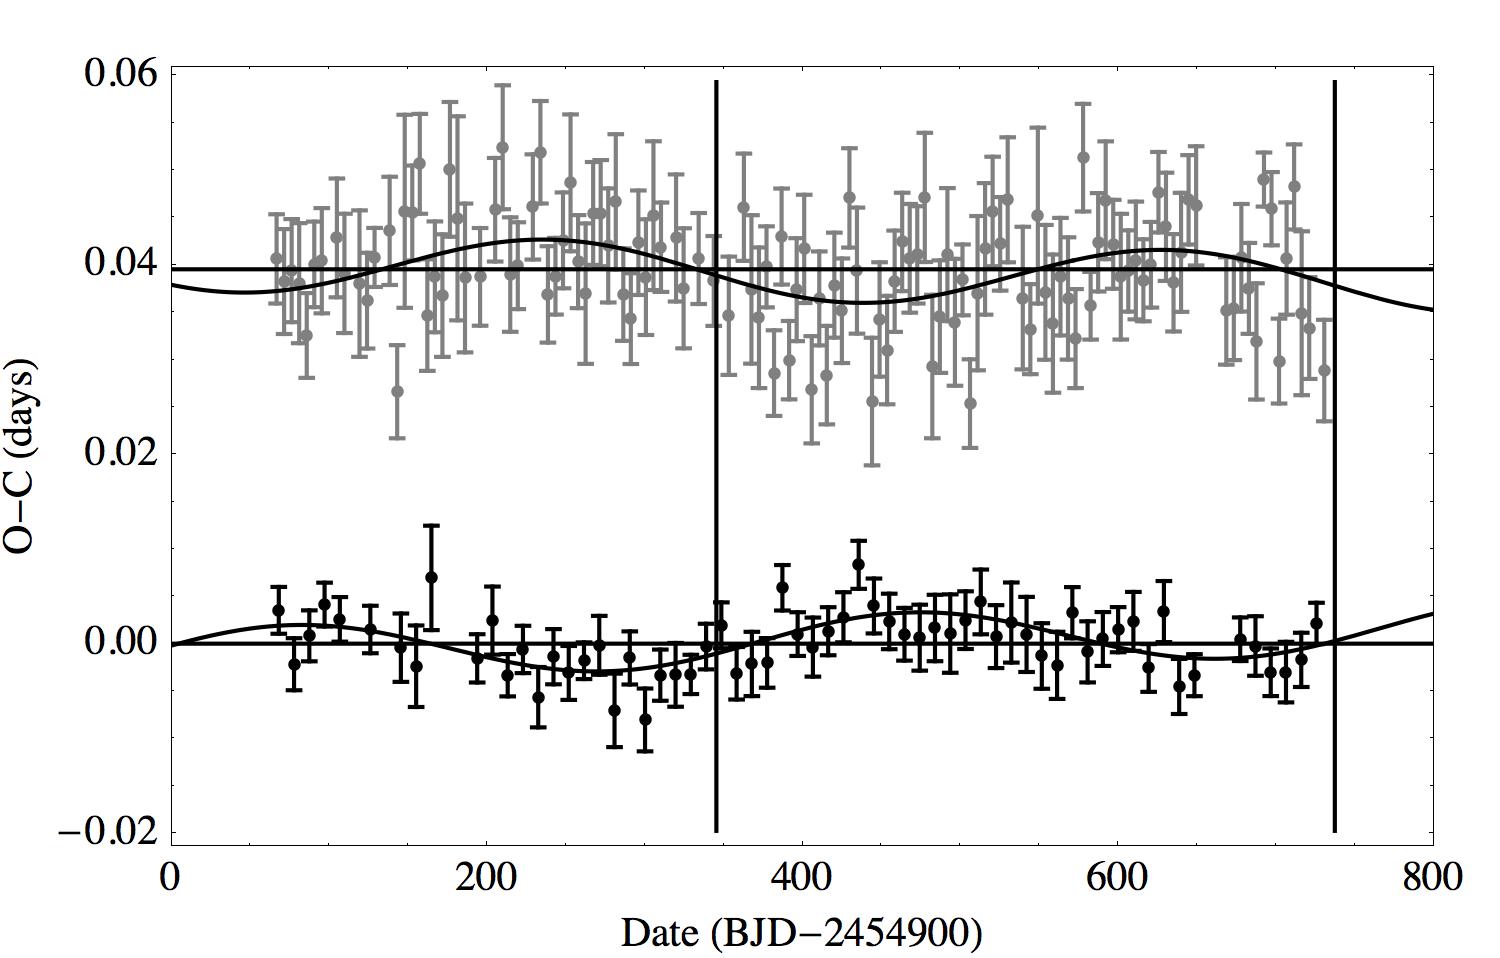
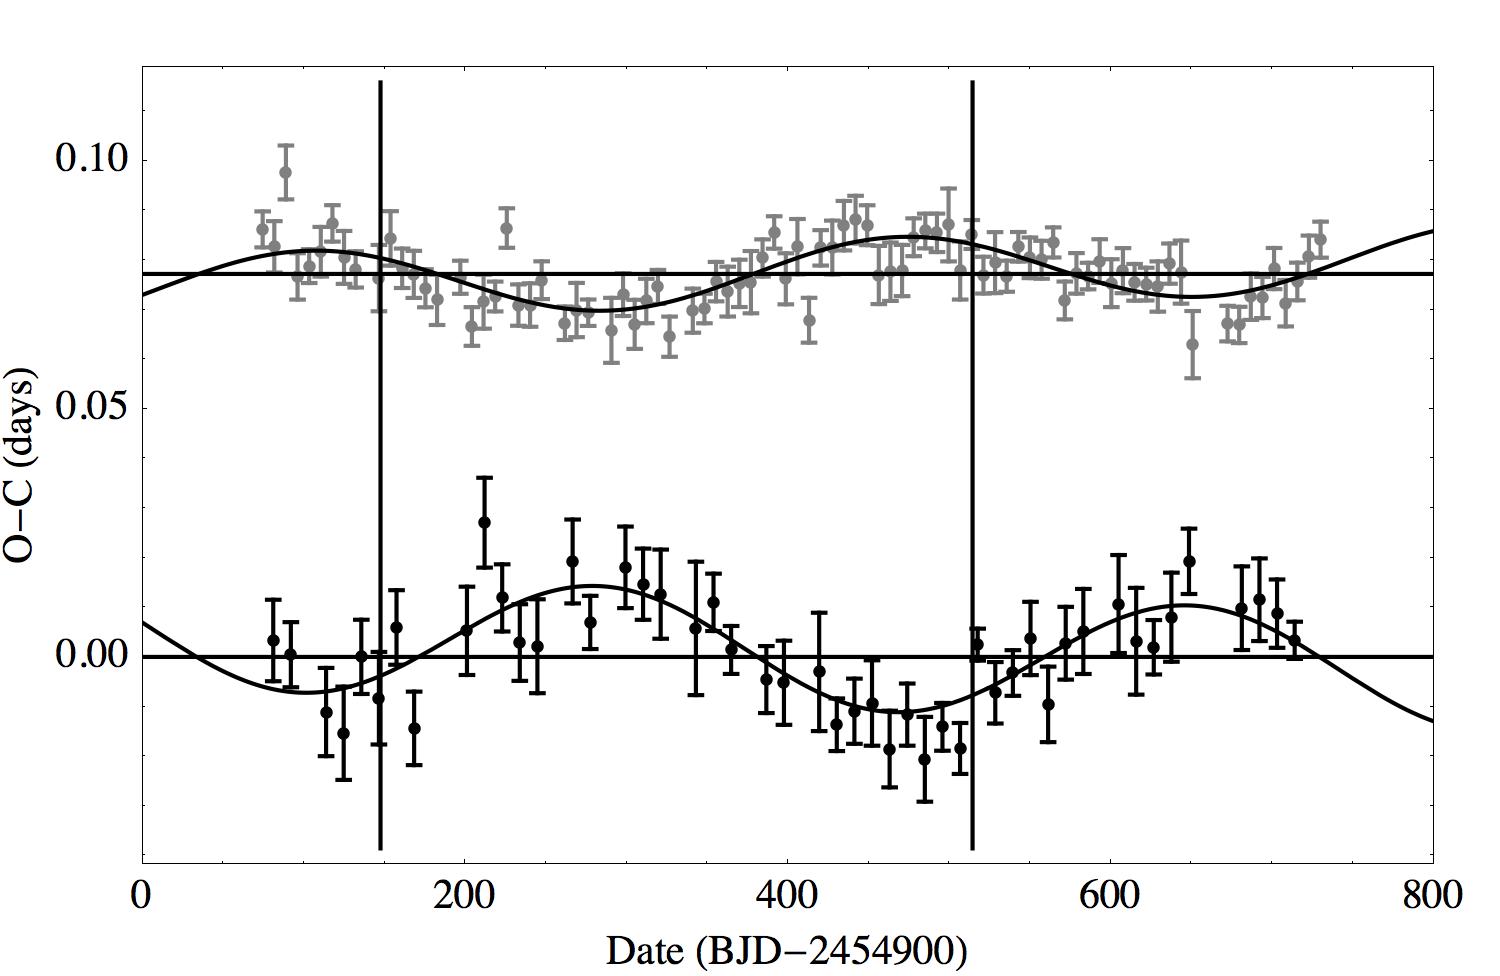
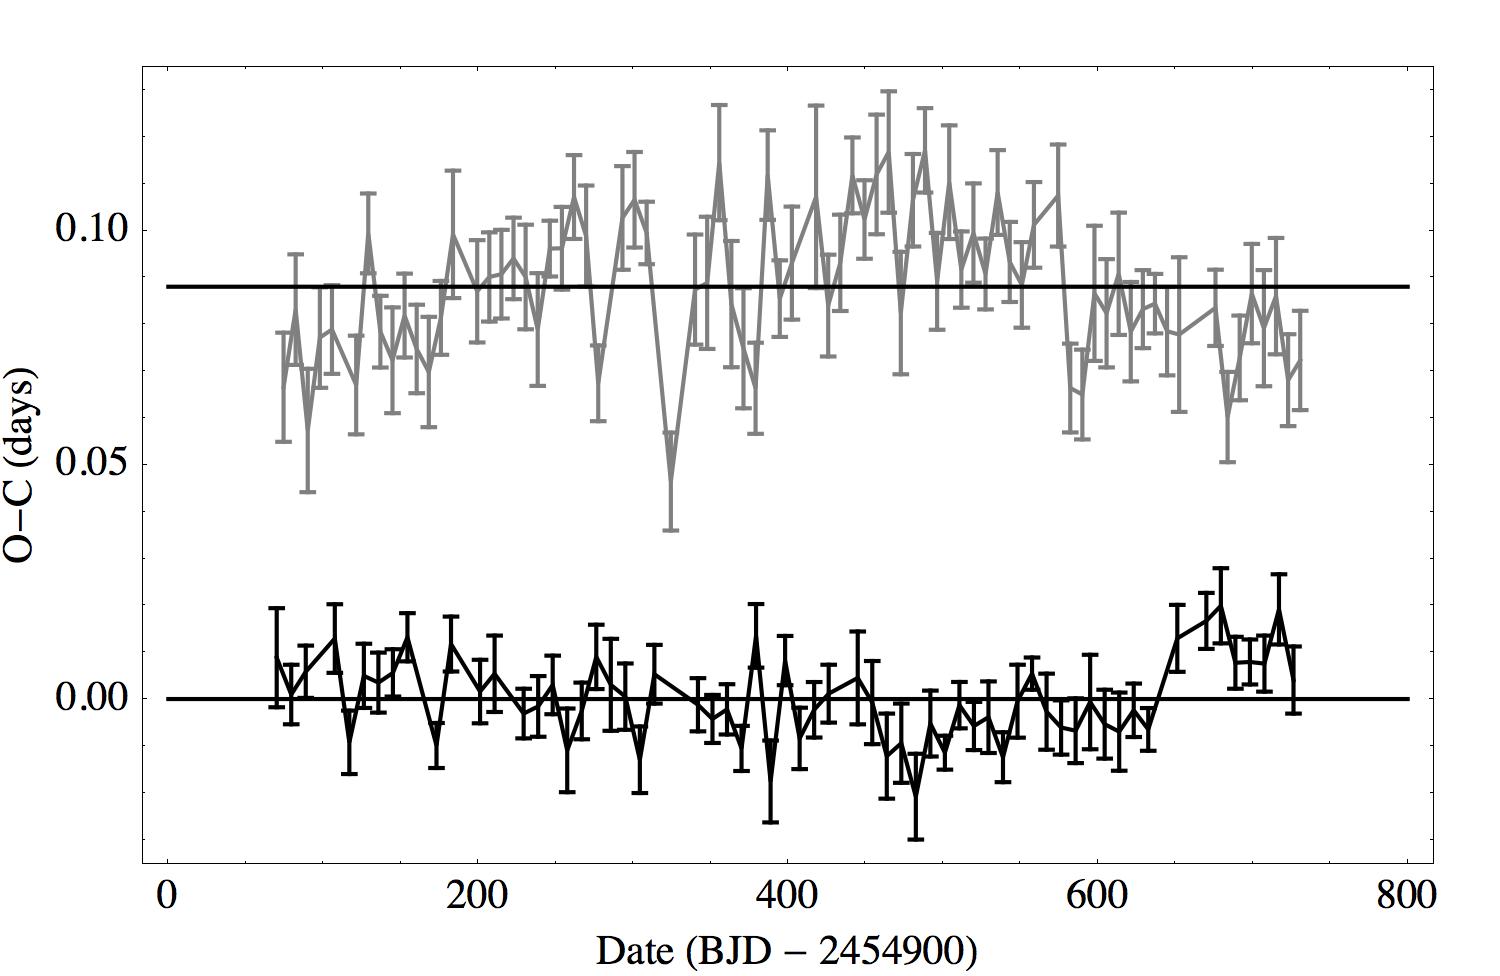
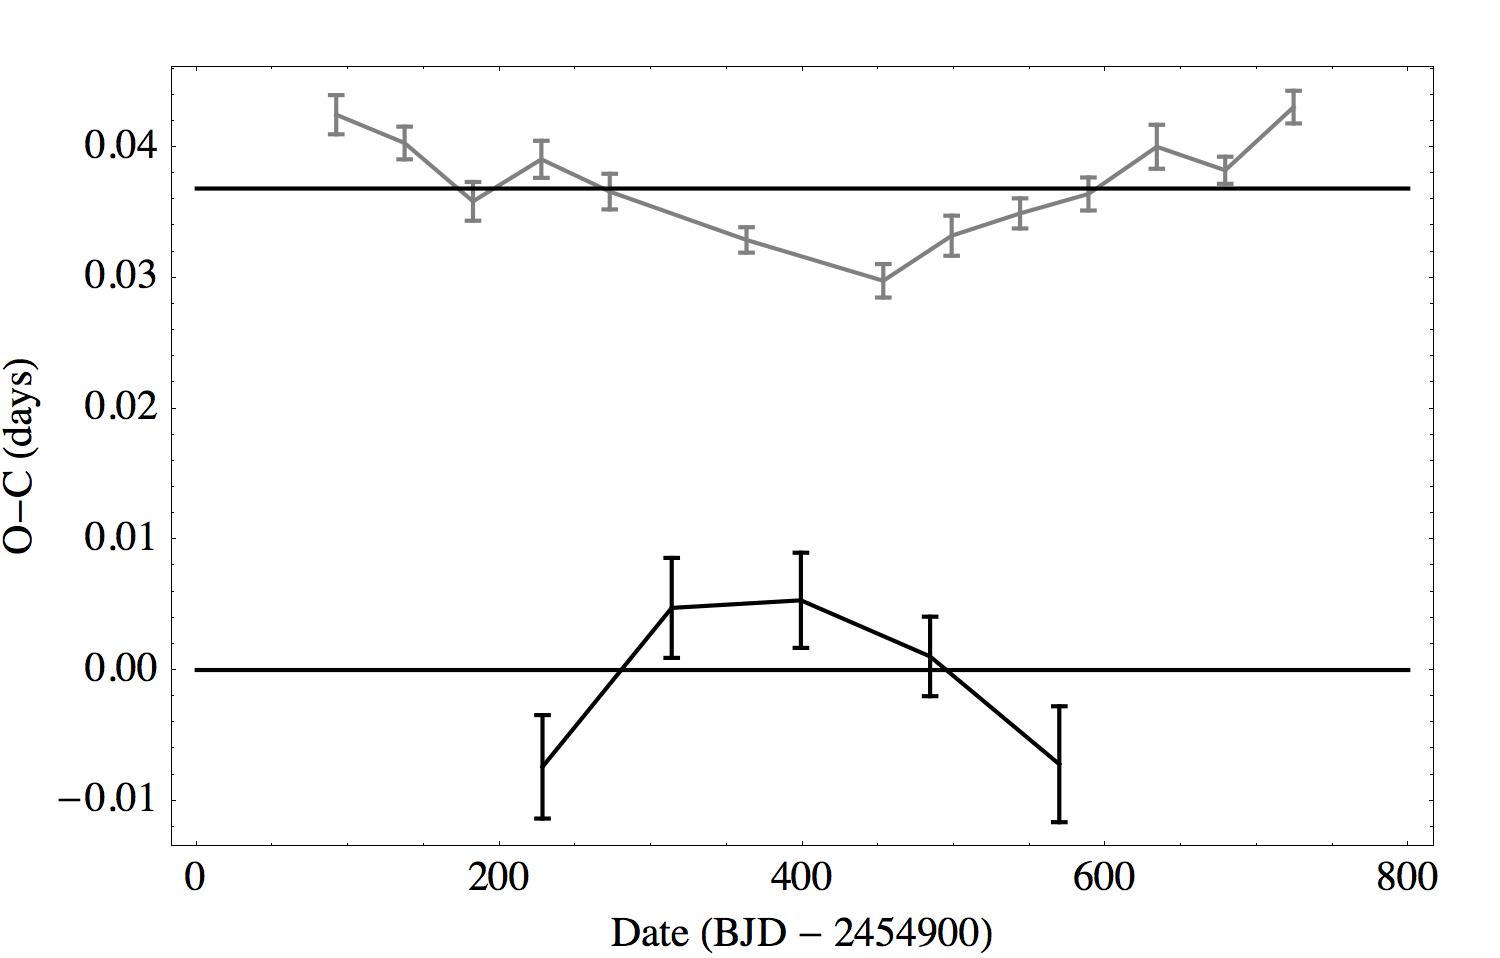
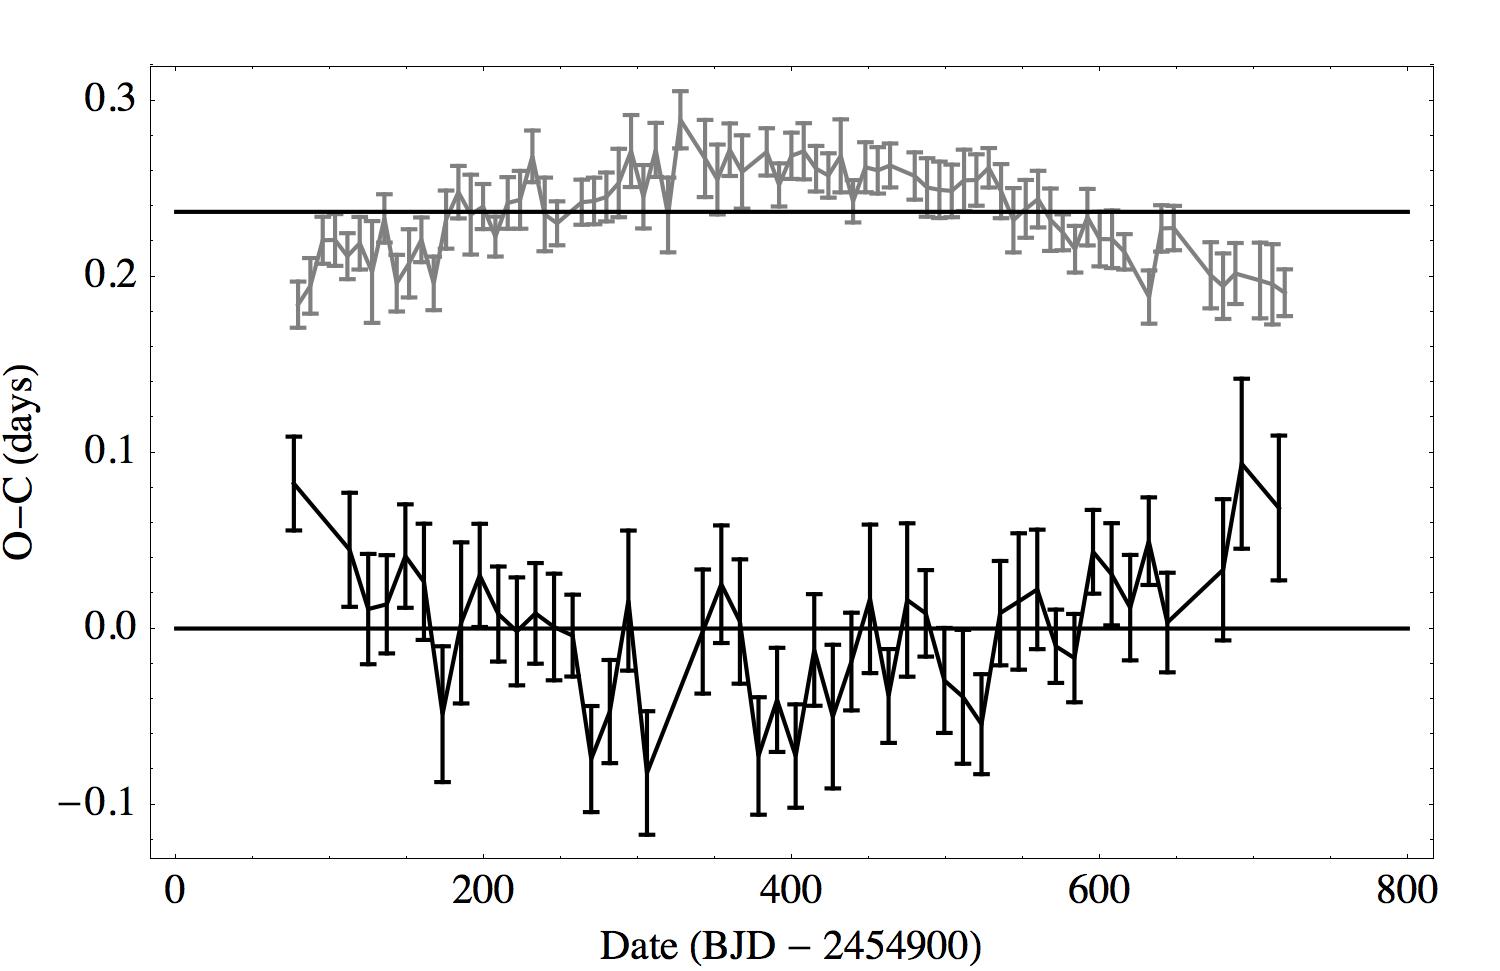
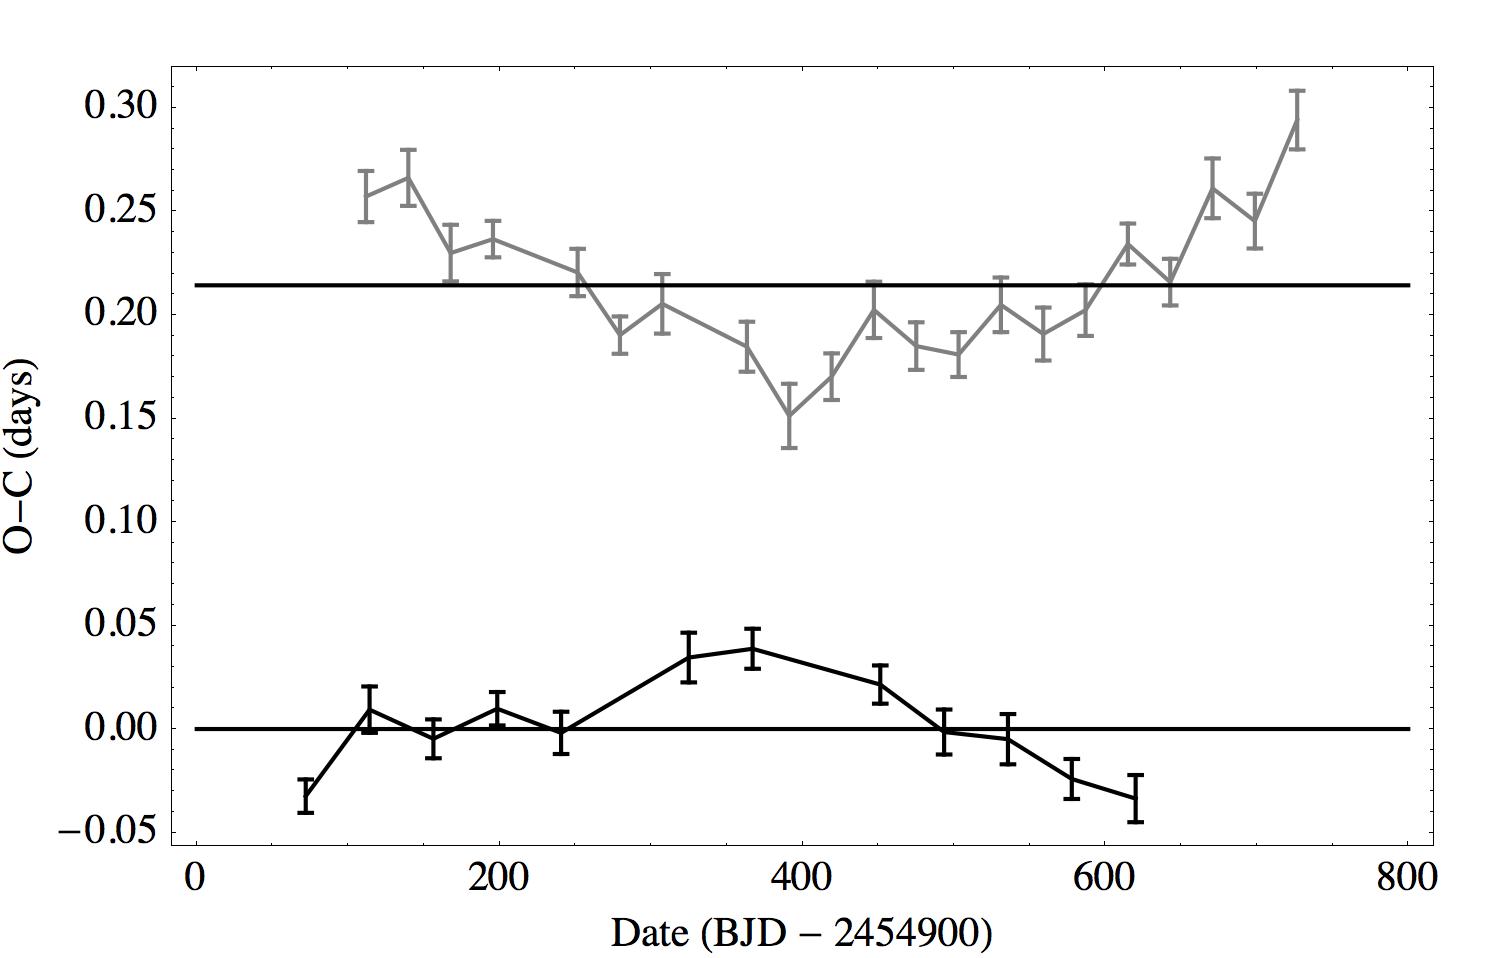
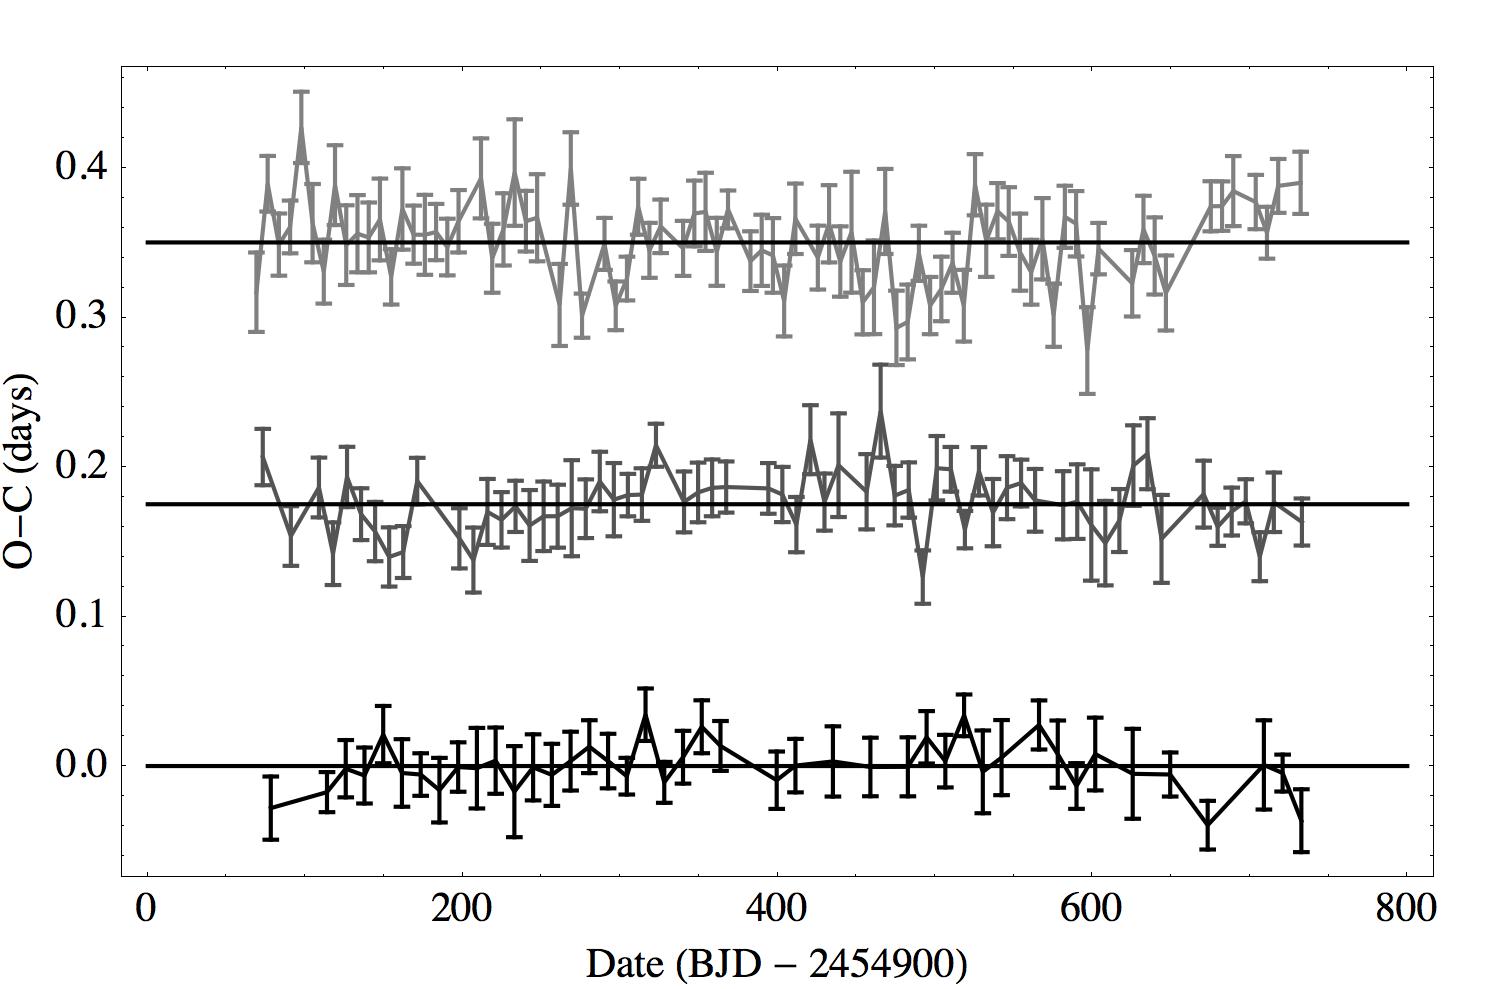
Each of these methods was applied to all of the systems being considered. The transit times for each of the analyzed candidates are produced in the manner described in (Ford et al., 2011). For each system, outlier data are removed by eliminating all transit times that are four times the Median Absolute Deviation from the best fitting linear ephemeris and eliminating all transit times where the timing uncertainty is more than twice the median timing uncertainty (as was done in Ford et al. (2012b) and Steffen et al. (2012b)). (The timing residuals for the sytems are shown graphically in the Appendix. ) The results of the Monte Carlo studies, specifically the expected False Alarm Probabilities (FAP) for relevant cases with each method, are given in Table 3. In all cases at least one of the three methods generates a sufficiently low FAP to claim that the observed anticorrelation is not due to timing noise, but more likely two planet candidates in the same system. In many cases all methods can make this claim.
In a few cases (planets in KOIs 886, 1336, 1529, and 2086) the signal to noise ratio (SNR) of each individual transit event is relatively small. Low SNR transits occationally result in poorly determined transit times and often these cases are ignored in general TTV studies of the Kepler systems (e.g., Ford et al. (2012b); Steffen et al. (2012b)). In order to increase our confidence that the observed TTV signal is real, we modelled the lightcurve using a straightforward linear-plus-sinusoid ephemeris in which we allowed the times of transit to have a sinusoidal modulation. The transit duration, impact parameter, and depth for each transiting planet were fixed (since variations in these quantities have yet to be detected for any small exoplanet). In all cases we fit the transits of both planets simultaneously. The results of this expanded ephemeris yielded a significant reduction in the over a simple linear ephemeris model (the reduction in being 830 for KOI-886, 47 for KOI-1336, 130 for KOI-1529, 48 for KOI-2086 .01 and .02, and 166 for KOI-2086 .02 and .03). These results demonstrate that the modulation in transit times, with its anticorrelation and timescale, is not due to poorly determined transit times and we proceed with our analysis in the same fashion as the other systems.
3.2 Discussion of plausible false alarms
The choice of an FAP is the same as was done in Fabrycky et al. (2012a), Ford et al. (2012a), and Steffen et al. (2012a). We have not published an exhaustive search for TTV systems that can be confirmed with this method as some Kepler systems have warranted individual scrutiny. In addition, the vetting of all KOIs is still ongoing—even as the list of KOIs continues to grow—and therefore remains nonuniform. Nevertheless, we do want to be confident that we are not misinterpreting these systems. Anticorrelated TTVs with a well-defined period and phase provide a distinct functional form that yields high confidence in the pair being true interacting planets. However, anticorrelations between parabolic TTV signatures imply a gradual change in the orbital periods, but are less powerful at eliminating alternative explanations. We look at two possible explanations for the observed anticorrelated TTVs and show that they are significantly less likely than the single system interpretation—justifying our claim that the observed TTVs are due to planetary interactions in a single system. First, we consider the possibility of a background star that hosts one of the planets. Second, we consider the case of a bound stellar binary with a planet orbiting each star where the light travel time across the system produces the TTV signal.
Consider the case where both the target star and a background star host a transiting planet; and that these planets are both being perturbed by an unseen planetary companion. Occasionally a parabolic TTV signature from one star may be anticorrelated with a parabolic TTV signal from the other. To estimate a limit on the probability of this scenario (we do not attempt to give an exact estimate, only to constrain its value) we multiply: 1) the fraction of KOIs that show only a quadratic TTV signature, 2) the fraction of KOIs as near to first-order MMRs as those in our sample, 3) the probability of a given target having a planet candidate (a proxy for the fraction of background stars that would show a candidate), and 4) the number of candidate pairs that we investigated—then we divide by two since we require an “anti”correlation in the TTV signals. Recall that the resulting false alarm probability is (a limit on) the probability of misinterpreting two distinct planetary systems as a single planetary system.
Using data from Ford et al. (2012b) we estimate the fraction of KOIs that show evidence for quadratic TTVs by selecting KOIs from (Ford et al., 2012b) where a fit using a quadratic ephemeris has a -value less than 0.05. We also require that a cubic or quartic ephemeris fail the -ratio test (with a -value greater than 0.1) when compared to a quadratic ephemeris—we want only systems with quadratic trends as the others are not subject to this particular misinterpretation of the TTV signal. We find that of Kepler planet candidates show some evidence for quadratic-only trends. Next, we note that the planet pairs we search for are within of a first-order MMR where we expect TTV signatures to be manifest. The largest absolute deviation from zero, using the statistic from (Lissauer et al., 2011b) and (Fabrycky et al., 2012b), is 0.37. We estimate the probability of finding two randomly chosen planet candidates having using the distribution of KOI periods from (Batalha et al., 2012). We select all planet candidates with period ratios within a factor of three of the median period of all KOIs (essentially the peak of the distribution which yields a conservative estimate), calculate relative to the median period, and divide by the total number of KOIs. The result is that no more than 15% of randomly chosen KOI pairs will be as close to a first order MMR as the candidates we study here. Finally, the number of KOIs seen by Kepler suggests that of Kepler target stars will have a planet candidate. Thus, no more than ) of randomly-selected pairs of candidates would show parabolic anticorrelations. When identifying systems to study in this paper, we search pairs which yields a naive expectation of 0.1 candidate pairs that show parabolic, anticorrelated TTVs. Comparing this number to the previously confirmed systems that have have anticorrelated TTVs yields a less than 1% chance of misinterpreting planets orbiting two different stars as a system of planets orbiting a single star.
Still, much more can be brought to bear to reduce this false alarm probability still further (not including constraints on the population of suitable background stars in the galaxy). We look at two tests specifically. First, and most importantly, we examined the displacement of the centroid of the target during transit. If a pair of planets were orbiting different stars, then the centroid of the target would displace in different directions during the transits of each planet. In all cases the displacement of the centroid is consistent with the planet pairs orbiting the same star and that the star is indeed the Kepler target.
For the second test, we calculated the quantity for each planet pair where and are the transit durations and and are the orbital periods for the inner and outer planets respectively. The value of for each pair should be of order unity if the planets are in the same system (Steffen et al., 2010). Indeed, the bulk of cases presented here are within the 98% confidence interval of the distribution for observed values for all of the Kepler multiple systems. The only exception is anomalous values in the Kepler-51 (KOI-620) system (2.57 and 0.38 for the 01 – .03 and .03 – .02 pairs respectively). In fact, the value for the .03 – .02 pair is the lowest observed to date. In this system one planet, Kepler-51c (KOI-620.03), appears to be on a nearly grazing orbit (see Batalha et al. (2012))—which naturally produces such extreme values for , however this may indicate the possibly of a false positive. As a check, we generated a synthetic population of planet canidates using a Monte Carlo code similar to Lissauer et al. (2011b) and Fang and Margot (2012), drawing 2 to 10 planets per system uniformly over the Kepler candidate period distribution and assuming circular orbits. Radii were also drawn from the empirical Kepler distribution. The mutual inclinations of the planets with respect to an arbitrary reference plane were Rayleigh distributed with a mean of 1.52 degrees, equivalent to the best fit regions of Fabrycky et al. (2012b). After realizations, was computed for the synthetic candidates with multiple transiting planets having total SNR . A two sample Kolmogorov–Smirnov test gives a P-value of 0.14 indicating the null-hypothesis that the synthetic and observed distributions come from the same parent distribution can not be rejected at high significance. From the synthetic population we calculate the probability of or to be 0.016. Given that there are 365 systems with multiple transiting planets and 529 corresponding pairs, a true planet system showing such extreme values is not unexpected. The values for the different planet pairs are also given in 2.
The second possible misinterpretation of an anticorrelated TTV signal that we consider is planets orbiting two gravitationally-bound stars. Here, the light travel time across the system would produce the observed period variations. In many cases this stellar binary interpretation is not consistent with the amplitude of the TTV signal—the implied orbital period is short (a few hundred days), meaning that the distance between the stars would be small, but the TTV signal is large, requiring a large separation between the stars. The worst-case scenario is when: 1) the binary has an orbital period equal to the duration of the data, 2) the phase of the orbit being such that the TTVs actually have the form of a cosine instead of a parabola, and 3) the second star being bright enough to allow the observed transit depth (here we use a stellar twin) but essentially massless so that the light travel time is maximized—a somewhat unphysical worst-case scenario. None of the systems that can be modeled with sinusoids can be explained with the binary star model since their TTV amplitudes are too large. The amplitudes of all observed parabolic TTV signals are also too large by a factor of at least 7 with the exceptions of Kepler-50 (which is very near the 6:5 MMR) and Kepler-60 (which has three planets instead of just two). Still, even these systems have amplitudes that are a factor of 2 and 1.5 too large respectively for this worst-case scenario.
In these remaining two systems (Kepler-50 and Kepler-60), all of the candidate pairs are very near first order MMRs—all are comfortably within of the resonance and have . Planets this close to MMR would naturally have TTV signals that develop over very long timescales (and would be seen only as parabolas over the course of our data). Using the same method outlined above we find that fewer than 2% of planet pairs are this close to resonance (having )—and for Kepler-60 one would need two such pairs. The probability of having a binary star system with an appropriate period ratio—between 500 and 1500 days—is approximately (using the analytic distribution given in Duquennoy and Mayor (1991) and dividing by two in order to have a binary star instead of an isolated star). Also needed is that all planets must transit their respective hosts (with a probability perhaps as large as given that the binary star system which would likely induce correlations in the orbital planes of the planets), Finally, the orbital phase of the binary must be such that it produces a parabola-resembling cosine signal (). Thus, the expected number of planet pairs in an plausible, stellar binary system is no larger than —a result slightly smaller than the scenario using a background star. Again, this possibility is much less likely than that of a single system (nearly 1000 times less likely for these two systems where this model is potentially viable). Nevertheless, the twin-star scenario given here has always been a known caveat for multi-transiting systems (especially for very widely separated binaries) and should such a system ever be seen, it would be a very interesting one for study.
| Kepler | KOI1 | KOI2 | FAP1 | FAP2 | FAPGP | FAPΞ | Confirmed | |
| 48 | 148.01 | 148.02 | 0.0022 | 19.6 | y | |||
| 148.01 | 148.03 | |||||||
| 148.02 | 148.03 | |||||||
| 49 | 248.03 | 248.01 | ||||||
| 248.03 | 248.02 | |||||||
| 248.03 | 248.04 | 0.0816 | ||||||
| 248.01 | 248.02 | 69.8 | y | |||||
| 248.01 | 248.04 | 7.1 | ||||||
| 248.02 | 248.04 | |||||||
| 50 | 262.01 | 262.02 | 0.0120 | 34.8 | y | |||
| 51 | 620.01 | 620.03 | 0.0001 | 0.0166 | 0.0006 | 79.6 | 0.0072 | y |
| 620.01 | 620.02 | |||||||
| 620.03 | 620.02 | 0.0114 | ||||||
| 52 | 775.02 | 775.01 | 0.0003 | 0.0476 | 19.1 | 0.0001 | y | |
| 775.02 | 775.03 | |||||||
| 775.01 | 775.03 | 0.0439 | ||||||
| 53 | 829.02 | 829.01 | 5.9 | |||||
| 829.02 | 829.03 | 0.0019 | 0.0004 | |||||
| 829.01 | 829.03 | 0.0009 | 0.0007 | 10.9 | 0.0072 | y | ||
| 54 | 886.01 | 886.02 | 104.3 | y | ||||
| 886.01 | 886.03 | |||||||
| 886.02 | 886.03 | 6.0 | ||||||
| 55 | 904.01 | 904.04 | 7.7 | |||||
| 904.01 | 904.05 | |||||||
| 904.01 | 904.02 | |||||||
| 904.01 | 904.03 | |||||||
| 904.04 | 904.05 | |||||||
| 904.04 | 904.02 | 0.0001 | ||||||
| 904.04 | 904.03 | 6.9 | ||||||
| 904.05 | 904.02 | 6.2 | ||||||
| 904.05 | 904.03 | |||||||
| 904.02 | 904.03 | 93.2 | y | |||||
| 56 | 1241.02 | 1241.01 | 0.0210 | 11.5 | 0.0016 | y | ||
| 57 | 1270.01 | 1270.02 | 18.1 | y | ||||
| 58 | 1336.01 | 1336.02 | 0.0001 | 0.0001 | 13.6 | 0.0006 | y | |
| 59 | 1529.02 | 1529.01 | 0.28 | y | ||||
| 60 | 2086.01 | 2086.02 | 0.0002 | 0.0092 | 10.0 | 0.0049 | y | |
| 2086.01 | 2086.03 | 0.0001 | 7.8 | y | ||||
| 2086.02 | 2086.03 | 0.0194 | 0.0001 | y |
3.3 Mass limits from orbital stability
Once the fact that the different planet candidates orbit the same star has been established, we use dynamical stability to show that their masses must be planetary. We followed the method used and described in Fabrycky et al. (2012a). Briefly, we integrate a series of planetary systems with different masses, starting from the value at which stability is analytically assured (Gladman, 1993). We integrate the system until it becomes unstable, produces close encounters, or survives without close encounters for inner-planet orbits. We set the upper limit on the planet mass as the smallest mass that yields an unstable system. For each planet candidate examined with the stability test, this value is , confirming them as planets (using the planet criterion suggested by (Schneider et al., 2011)). Table 4 shows the overall results of the stability study.
Ford et al. (2012a) discusses in detail the possible, though unlikely, scenario where the planets in those systems are both orbiting a background star instead of the target star. We mention here the implications for the planet nature of the orbiting objects. Dynamical stability yields constraints on the masses of the planets compared to the total mass of the system. So, if a background star is more massive than the target, then the corresponding mass limits would grow in proportion to the difference. It is possible that such a scenario would push the mass limits beyond the planetary regime. For most systems the mass of the true host star would need to be larger by a factor of 10 or more (for most of the systems here that would imply host). Such massive stars are quite rare and don’t survive on the main sequence for very long. For the less massive targets with large mass limits on the orbiting objects—Kepler-52 (KOI-775) in particular—a more massive background star, with a factor of two or more greater mass, could be an issue (though the orbits would all need to be oriented in a physically unfavorable manner to yield consistent transit durations). Nevertheless, refined mass limits from the next section effectively eliminate the possibility that the objects orbiting Kepler-52 are not planetary.
| Planet | KOI | Max Mass () |
|---|---|---|
| 48b | 148. 01 | 5.94 |
| 48c | 148. 02 | 11.61 |
| 49b | 248. 01 | 0.98 |
| 49c | 248. 02 | 0.72 |
| 50b | 262. 01 | 0.10 |
| 50c | 262. 02 | 0.11 |
| 51b | 620. 01 | 3.23 |
| 51c | 620. 03 | 2.60 |
| 52b | 775. 02 | 8.70 |
| 52c | 775. 01 | 10.41 |
| 53b | 829. 01 | 18.41 |
| 53c | 829. 03 | 15.74 |
| 54b | 886. 01 | 0.92 |
| 54c | 886. 02 | 0.37 |
| 55b | 904. 02 | 1.49 |
| 55c | 904. 03 | 1.11 |
| 56b | 1241.02 | 5.12 |
| 56c | 1241.01 | 12.18 |
| 57b | 1270.01 | 18.86 |
| 57c | 1270.02 | 6.95 |
| 58b | 1336.01 | 1.39 |
| 58c | 1336.02 | 2.19 |
| 59b | 1529.02 | 2.05 |
| 59c | 1529.01 | 1.37 |
| 60b | 2086.01 | 0.25 |
| 60c | 2086.02 | 0.56 |
| 60d | 2086.03 | 0.68 |
3.4 Analytic mass limits
A recent paper by Lithwick et al. (2012) gives analytic formulae that can be used to derive mass estimates or upper limits using the relative amplitudes and phases of the TTV signal. Those formulae apply once a reliable amplitude for a sinusoid-shaped TTV signal can be extracted. Here we assume that the free eccentricity is zero and apply the corresponding formula from (Lithwick et al., 2012) to the systems where this analysis is appropriate (i.e., where the amplitude of the TTV signal can be extracted).
The free eccentricity of a planet—the eccentricity it would have in isolation (as opposed to the forced eccentricity, which results from the presence of the perturbing planet)—will tend to boost the TTV signal on a nearby planet. Thus, if there is some free eccentricity, then the mass estimates that come from the above analysis should be interpreted as approximate mass upper limits. A constraint on the free eccentricity can be made from the phase of the TTV signal relative to the line of sight of the observer. In our sample of systems the uncertainty in the TTV phase is sufficiently large that we do not claim absence of free eccentricity in any system. Thus, we consider all estimates to be upper limits. Nevertheless, these upper limits are roughly one order of magnitude more stringent than what one obtains from dynamical stability.
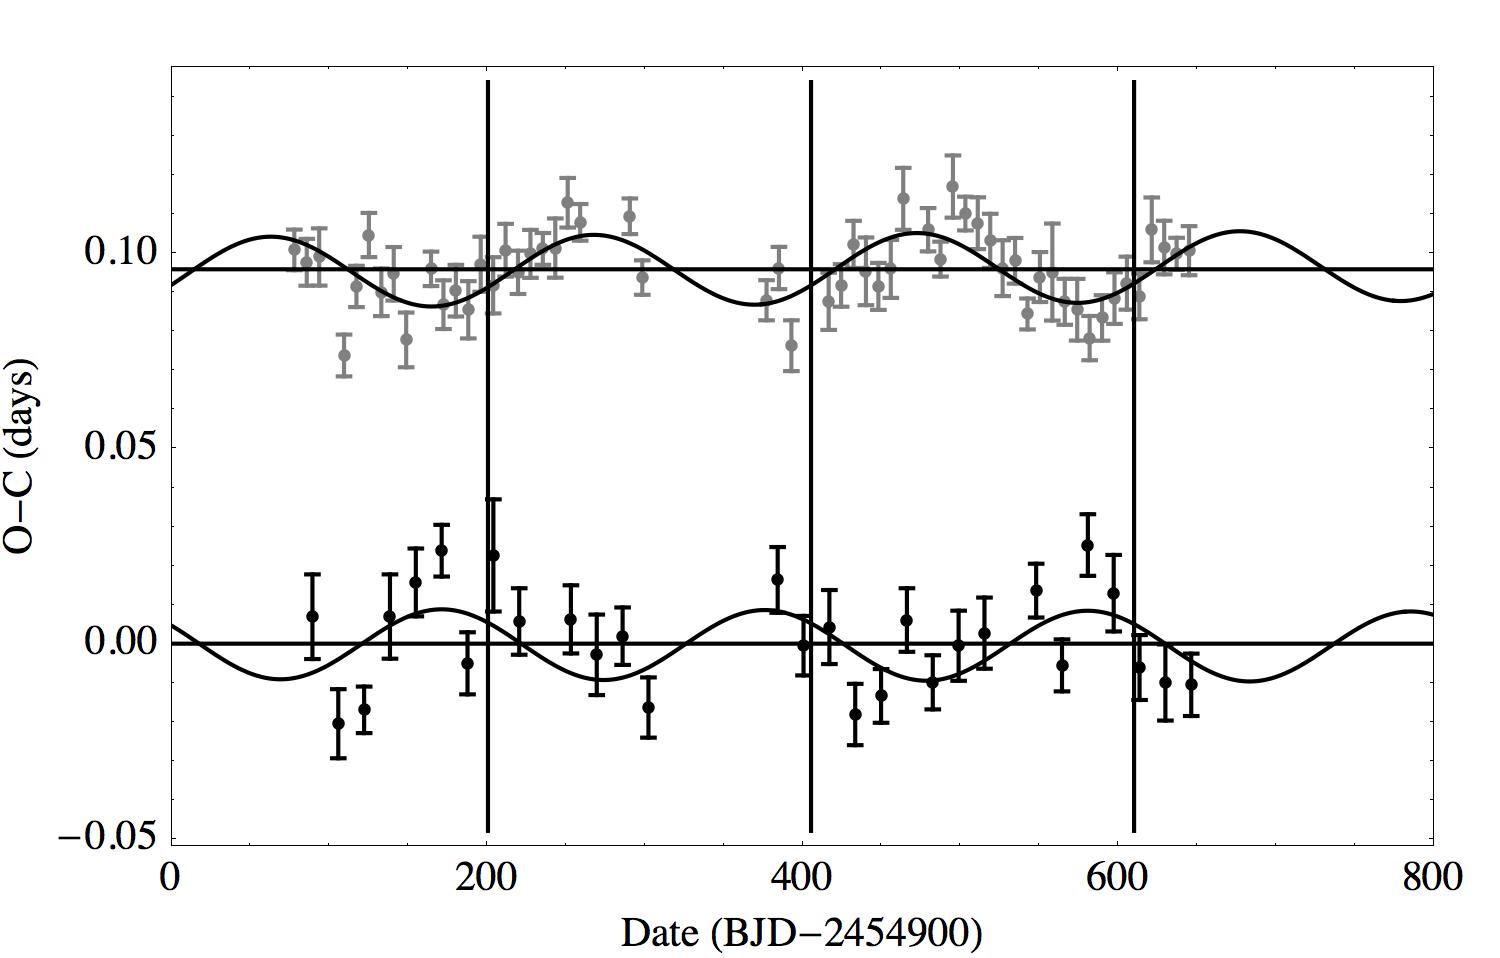
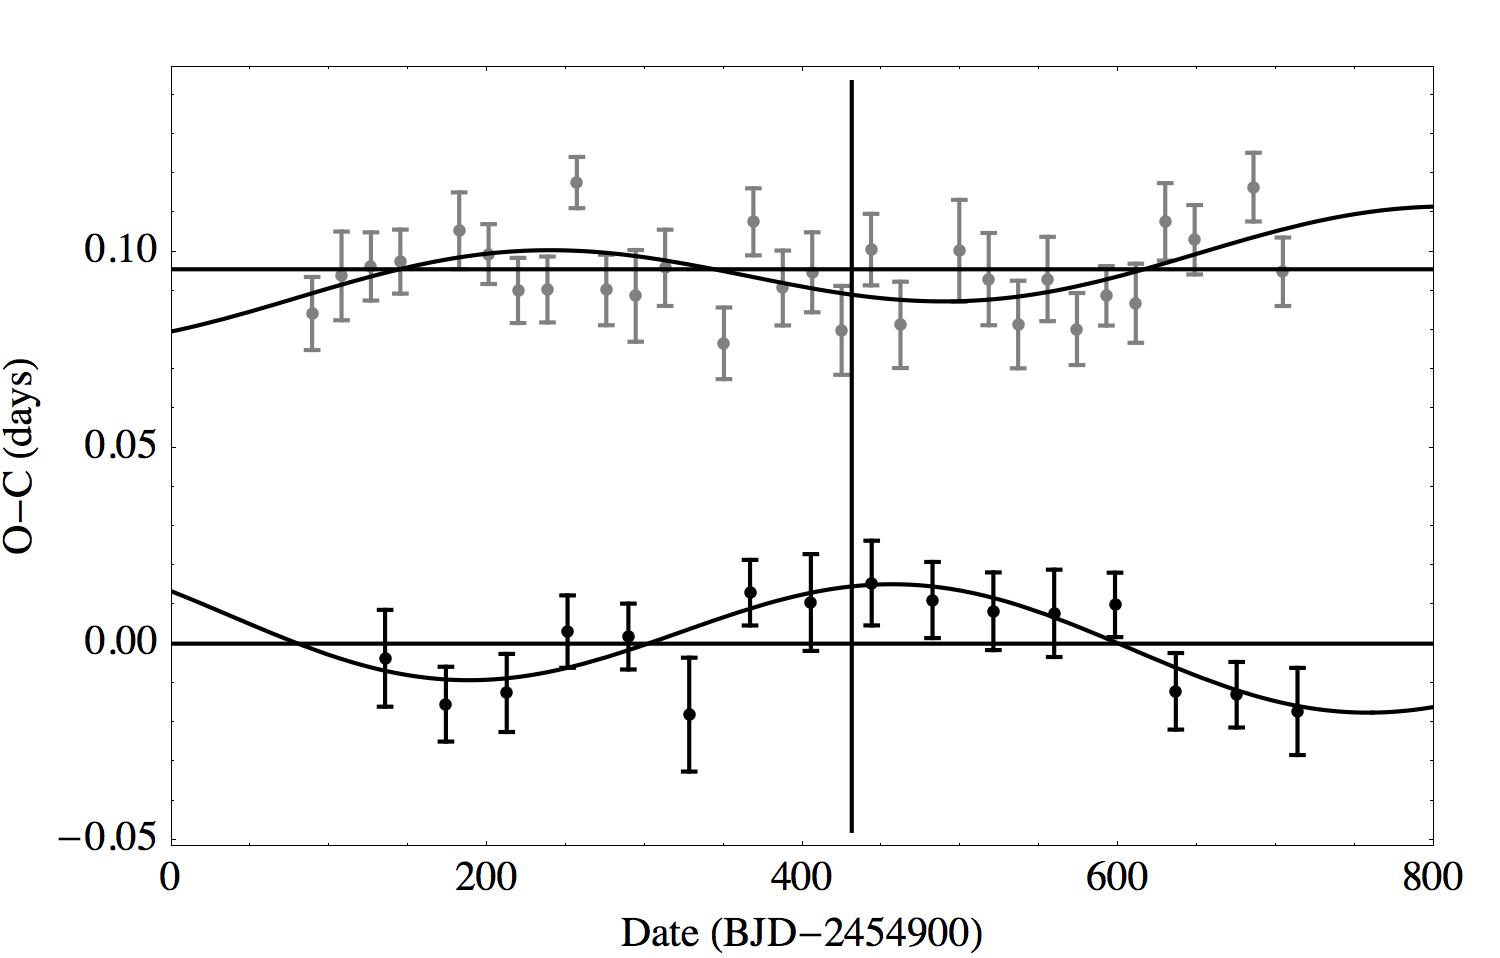
The results of this analysis are presented in Table 5 where we include the mass limits from orbital stability (copied from table 4 but now in Earth masses), the analytic mass estimate assuming zero free eccentricity, the formal uncertainty in this estimate, and the measured TTV phase and its uncertainty (note that we quote the best fitting value for the masses, so the actual mass limit at a specific confidence level must be calculated from this quantity and its given uncertainty). The systems analyzed in this manner include Kepler-48, Kepler-49, Kepler-52, Kepler-53, Kepler-57, and Kepler-58. For these systems, the location in time where the line of conjunction is along the line of sight is shown in the corresponding figures in the Appendix. Zero TTV phase (measured for the inner planet) occurs when the TTV signal crosses zero from above. A more detailed study of these systems and those discussed in (Lithwick et al., 2012) will yield an interesting estimate for the number of near-resonant systems with free eccentricity. At first glance, it appears that rougly half of the systems studied using this approach retain some free eccentricity ( 6 out of 12, though more data will inevitably yield more a more reliable count). Such a result will have implications for how the excess of planetary systems near, but perhaps not in, low-order MMRs is generated ((Lithwick and Wu, 2012; Terquem and Papaloizou, 2007; Papaloizou, 2011; Podlewska-Gaca et al., 2012; Sándor and Kley, 2006; Batygin and Morbidelli, 2012)).
| Kepler | KOI | Stability Mass Limit | TTV Mass Limit | (deg) | ||
|---|---|---|---|---|---|---|
| () | () | () | (degrees) | (degrees) | ||
| 48b | 148.01 | 1960 | 3.9 | -7.9 | 14 | |
| 48c | 148.02 | 3830 | 3.5 | -156 | 10 | |
| 50b | 248.01 | 323 | 1.3 | 47 | 9.0 | |
| 50c | 248.02 | 238 | 1.1 | -138 | 9.3 | |
| 52b | 775.02 | 2870 | 46 | -153 | 9.6 | |
| 52c | 775.01 | 3440 | 8.0 | 39 | 27 | |
| 53b | 829.01 | 6080 | 27 | -42 | 26 | |
| 53c | 829.03 | 5190 | 12 | 111 | 40 | |
| 57b | 1270.01 | 6220 | 15 | 98 | 190 | |
| 57c | 1270.02 | 2290 | 3.7 | -84 | 60 | |
| 58b | 1336.01 | 677 | 8.1 | -85 | 122 | |
| 58c | 1336.02 | 452 | 12 | 135 | 17 |
4 Discussion and Conclusion
All of the systems that we confirm here and in similar previous studies are near first-order MMR. In this case there are six pairs near the 2:1 MMR (Kepler-48, Kepler-51, Kepler-52, Kepler-53, Kepler-56, and Kepler-57), five pairs near the 3:2 MMR (Kepler-49, Kepler-54, Kepler-55, Kepler-58, and Kepler-59), and one pair each in the 4:3 (Kepler-60 c and d ), 5:4 (Kepler-60 b and c), and 6:5 (Kepler-50). Several systems show additional planet candidates that, due to their presence in known multi-transiting systems, are very likely to be true planets as well (Lissauer et al., 2012). If we consider all of the KOIs to be planets, then a few systems will have multiple pairs of planets near first order MMRs with some of these pairs being adjacent links in a near resonant chain including: Kepler-51 near a 3:2 – 2:1 chain (3:2:1), Kepler-53 near a 2:1 – 2:1 chain (4:2:1), Kepler-55 with one pair near the 2:1 and a separate pair near the 3:2, and Kepler-60 near a 5:4 – 4:3 chain (20:15:12). The balance of the planet pairs in these systems, if near a resonance at all, must be near a resonance of higher order.
These planetary systems, like the other systems that have been confirmed via TTV analyses, are of particular interest for long-term scrutiny with follow-up observations and dynamical studies. The detailed dynamics of planetary systems yield meaningful information about the evolutionary histories of the orbital architectures of the system. For example, the differences in the fraction of systems that show multiple candidates and detectabe TTVs among smaller planet candidates with few-day orbital periods compared with the larger, Jupiter-sized candidates in the same period range—these hot Jupiters have no compelling signs of current planet-planet dynamics—gives strong clues as to their likely distinct dynamical history compared to the bulk of the exoplanet population (Steffen et al., 2012).
These newly confirmed planetary systems continue to show the value that transit timing variations have and will have in transiting planet endeavors. As new planets are found, with increasingly smaller sizes and longer orbital periods, TTVs provide the only viable means of determining planetary masses. TTVs, along with statistical validation via the techniques employed in (Torres et al., 2011) and (Lissauer et al., 2012), will likely be the primary means to demonstrate the planetary nature of the planet candidates that the Kepler spacecraft identifies (in part because the stars in the Kepler field are often too dim to make good Radial Velocity targets).
Two of these systems show a modest gap in the orbital period ratios of adjacent pairs of KOIs. If planetary systems tend to be dynamically packed (e.g. Barnes and Raymond (2004); Lissauer (1995); Laskar (2000)) then there may be additional undetected planets in these gaps. In this set of systems, the most promising examples for future investigations include Kepler-48 which has a gap that is over a factor of 4 in period ratio and KOI-248 which has a gap that is nearly a factor of three in orbital period. A detailed TTV analysis of these two systems would provide useful constraints on or support for the hypothesis of dynamically packed systems.
The planetary system orbiting the giant star Kepler-56 is another interesting individual system—being an early discovery of a transiting multiplanet system hosted by a giant. Chromospheric emission from giant stars causes the star to be limb brightened in certain pass bands (e.g. the Calcium H and K lines). Comparison of the transit duration in these bands with the duration from the broad band Kepler data may yield a direct measurement of the size of the chromosphere (Assef et al., 2009).
Continued monitoring by the Kepler spacecraft and future study will likely yield more precise mass measurements of the planets in these systems and consequently provide constraints on their bulk composition. Such mass measurements will in turn improve our understanding of planet formation processes outside of our own solar system and are useful to place or solar system in the context of the general planet population.
Acknowledgements
We thank Yoram Lithwick, Roberto Sanchis-Ojeda, Bill Chaplin, and Daniel Huber for their useful input and discussions. Funding for the Kepler mission is provided by NASA’s Science Mission Directorate. We thank the entire Kepler team for the many years of work that is proving so successful. J.H.S acknowledges support by NASA under grant NNX08AR04G issued through the Kepler Participating Scientist Program. D. C. F. and J. A. C. acknowledge support for this work was provided by NASA through Hubble Fellowship grants #HF-51272.01-A and #HF-51267.01-A awarded by the Space Telescope Science Institute, which is operated by the Association of Universities for Research in Astronomy, Inc., for NASA, under contract NAS 5-26555. R.C.M. is supported by the National Science Foundation Graduate Research Fellowship under Grant No. DGE-0802270.
References
- Agol et al. [2005] E. Agol, J. Steffen, R. Sari, and W. Clarkson. MNRAS, 359:567–579, May 2005.
- Assef et al. [2009] R. J. Assef, B. S. Gaudi, and K. Z. Stanek. ApJ, 701:1616–1626, August 2009.
- Barnes and Raymond [2004] R. Barnes and S. N. Raymond. ApJ, 617:569–574, December 2004.
- Batalha et al. [2012] N. M. Batalha et al. ArXiv e-prints, February 2012.
- Batygin and Morbidelli [2012] K. Batygin and A. Morbidelli. ArXiv e-prints:1204.2791, 2012.
- Borucki et al. [2011] W. J. Borucki et al. ApJ, 736:19–+, July 2011.
- Carter et al. [2012] J. A. Carter, E. Agol, et al. ArXiv e-prints:1206.4718, June 2012.
- Cochran et al. [2011] W. D. Cochran et al. ApJS, 197:7, November 2011.
- Demarque et al. [2004] P. Demarque, J.-H. Woo, Y.-C. Kim, and S. K. Yi. ApJS, 155:667–674, December 2004.
- Duquennoy and Mayor [1991] A. Duquennoy and M. Mayor. A&A, 248:485–524, August 1991.
- Fabrycky et al. [2012a] D. C. Fabrycky, E. B. Ford, J. H. Steffen, et al. ApJ, 750:114, May 2012a.
- Fabrycky et al. [2012b] D. C. Fabrycky et al. ArXiv e-prints:1202.6328, February 2012b.
- Fang and Margot [2012] J. Fang and J.-L. Margot. ArXiv e-prints, July 2012.
- Ford et al. [2012a] E. B. Ford, D. C. Fabrycky, J. H. Steffen, et al. ApJ, 750:113, May 2012a.
- Ford et al. [2011] E. B. Ford et al. ApJS, 197:2–+, November 2011.
- Ford et al. [2012b] E. B. Ford et al. ArXiv e-prints:1201.1892, January 2012b.
- Gladman [1993] B. Gladman. Icarus, 106:247, November 1993.
- Holman and Murray [2005] M. J. Holman and N. W. Murray. Science, 307:1288–1291, February 2005.
- Laskar [2000] J. Laskar. Physical Review Letters, 84:3240–3243, April 2000.
- Lissauer [1995] J. J. Lissauer. Urey prize lecture: On the diversity of plausible planetary systems. Icarus, 114:217–236, April 1995.
- Lissauer et al. [2011a] J. J. Lissauer et al. Nature, 470:53, January 2011a.
- Lissauer et al. [2011b] J. J. Lissauer et al. ApJS, 197:8, November 2011b.
- Lissauer et al. [2012] J. J. Lissauer et al. ApJ, 750:112, May 2012.
- Lithwick and Wu [2012] Y. Lithwick and Y. Wu. ArXiv e-prints:1204.2555, April 2012.
- Lithwick et al. [2012] Y. Lithwick, J. Xie, and Y. Wu. ArXiv e-prints:1207.4192, July 2012.
- Lomb [1976] N.R. Lomb. Astrophys.Space Sci., 39:447–462, 1976.
- Papaloizou [2011] J. C. B. Papaloizou. Celestial Mechanics and Dynamical Astronomy, 111:83–103, October 2011.
- Podlewska-Gaca et al. [2012] E. Podlewska-Gaca, J. C. B. Papaloizou, and E. Szuszkiewicz. MNRAS, 421:1736–1756, April 2012.
- Sándor and Kley [2006] Z. Sándor and W. Kley. A&A, 451:L31–L34, June 2006.
- Schneider et al. [2011] J. Schneider, C. Dedieu, P. Le Sidaner, R. Savalle, and I. Zolotukhin. A&A, 532:A79, August 2011.
- Steffen et al. [2012a] J. H. Steffen, D. C. Fabrycky, E. B. Ford, et al. MNRAS, 421:2342–2354, April 2012a.
- Steffen et al. [2012b] J. H. Steffen, E. B. Ford, et al. ArXiv e-prints:1201.1873, January 2012b.
- Steffen et al. [2010] J. H. Steffen et al. ApJ, 725:1226–1241, December 2010.
- Steffen et al. [2012] Jason H. Steffen et al. Proc.Nat.Acad.Sci., 109:7982–7987, 2012. doi: 10.1073/pnas.1120970109.
- Terquem and Papaloizou [2007] C. Terquem and J. C. B. Papaloizou. Migration and the Formation of Systems of Hot Super-Earths and Neptunes. ApJ, 654:1110–1120, January 2007.
- Torres et al. [2011] G. Torres et al. ApJ, 727:24, January 2011.
Appendix A Timing residuals for each system.
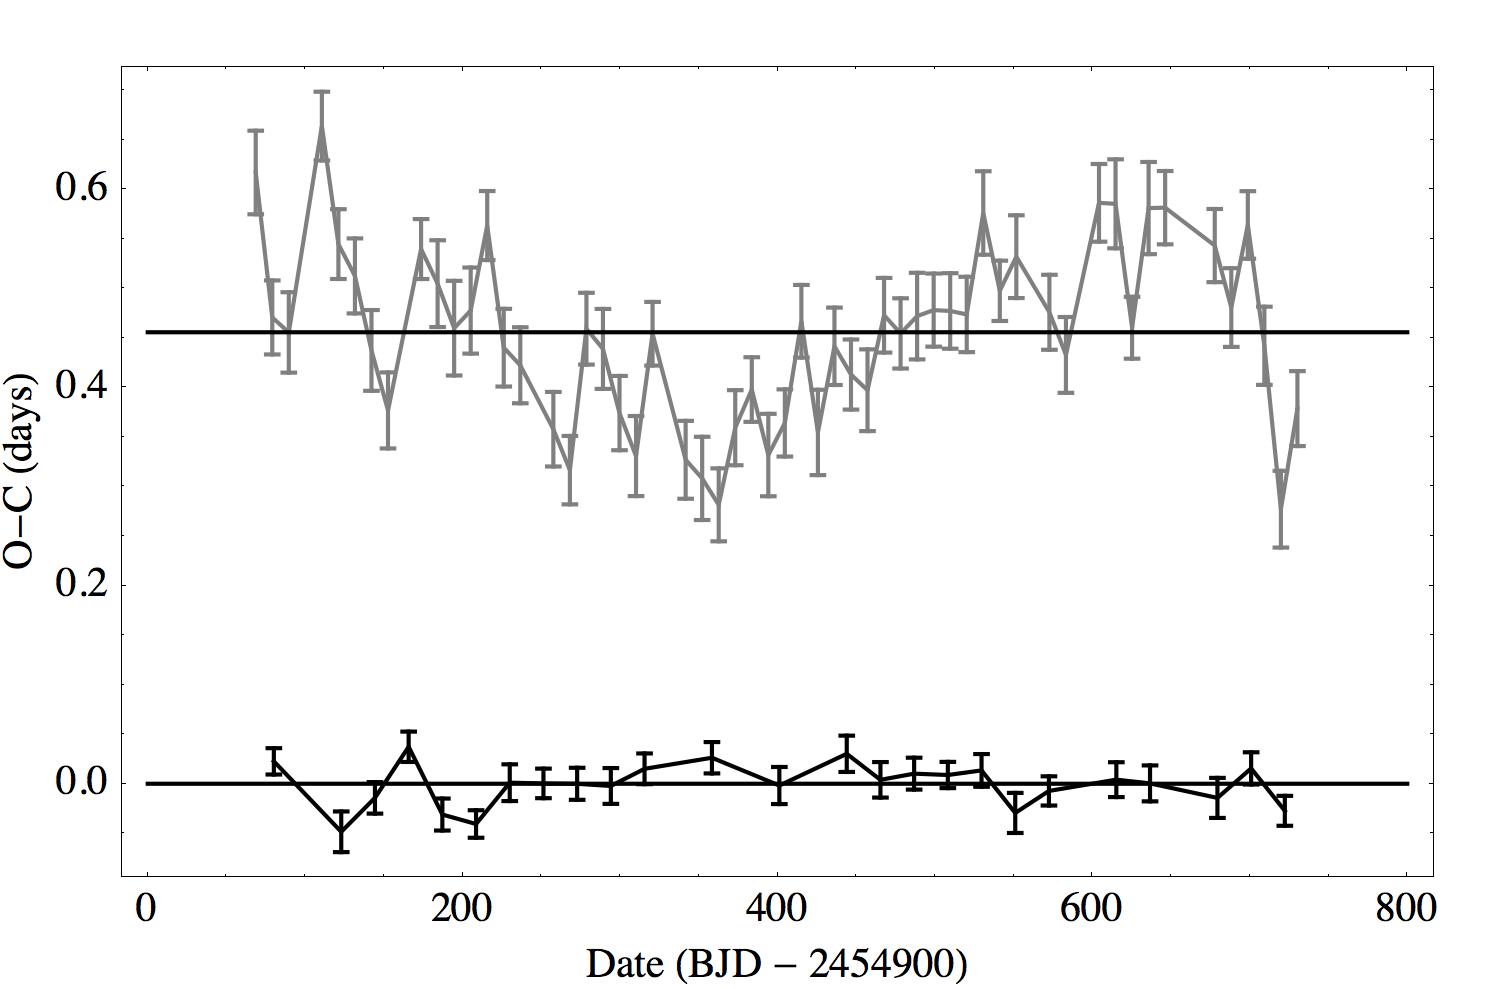
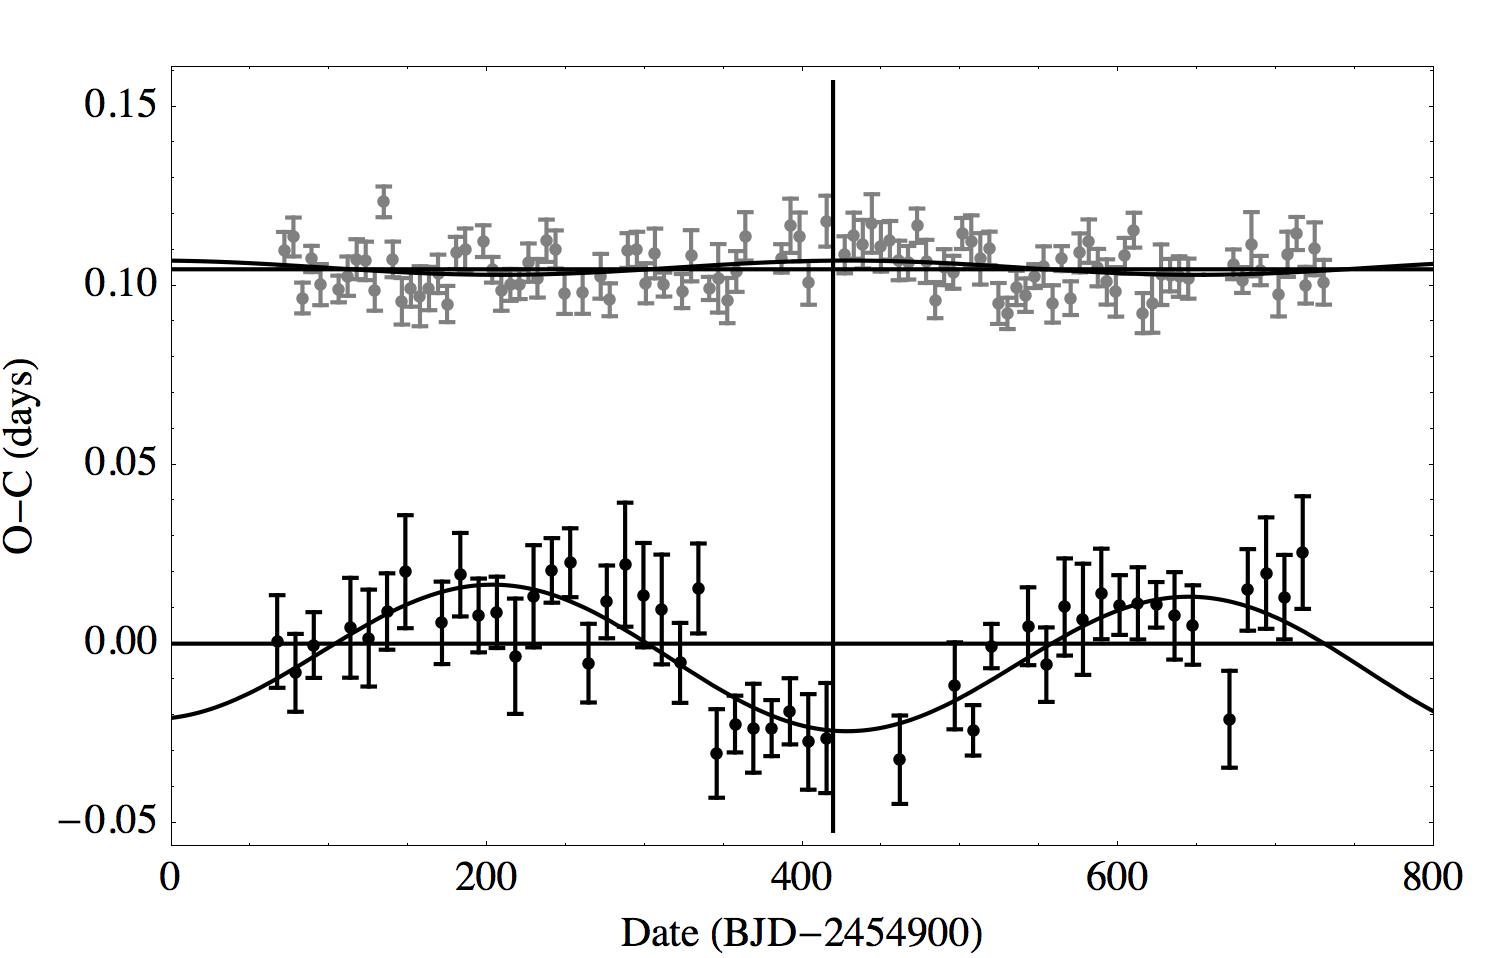
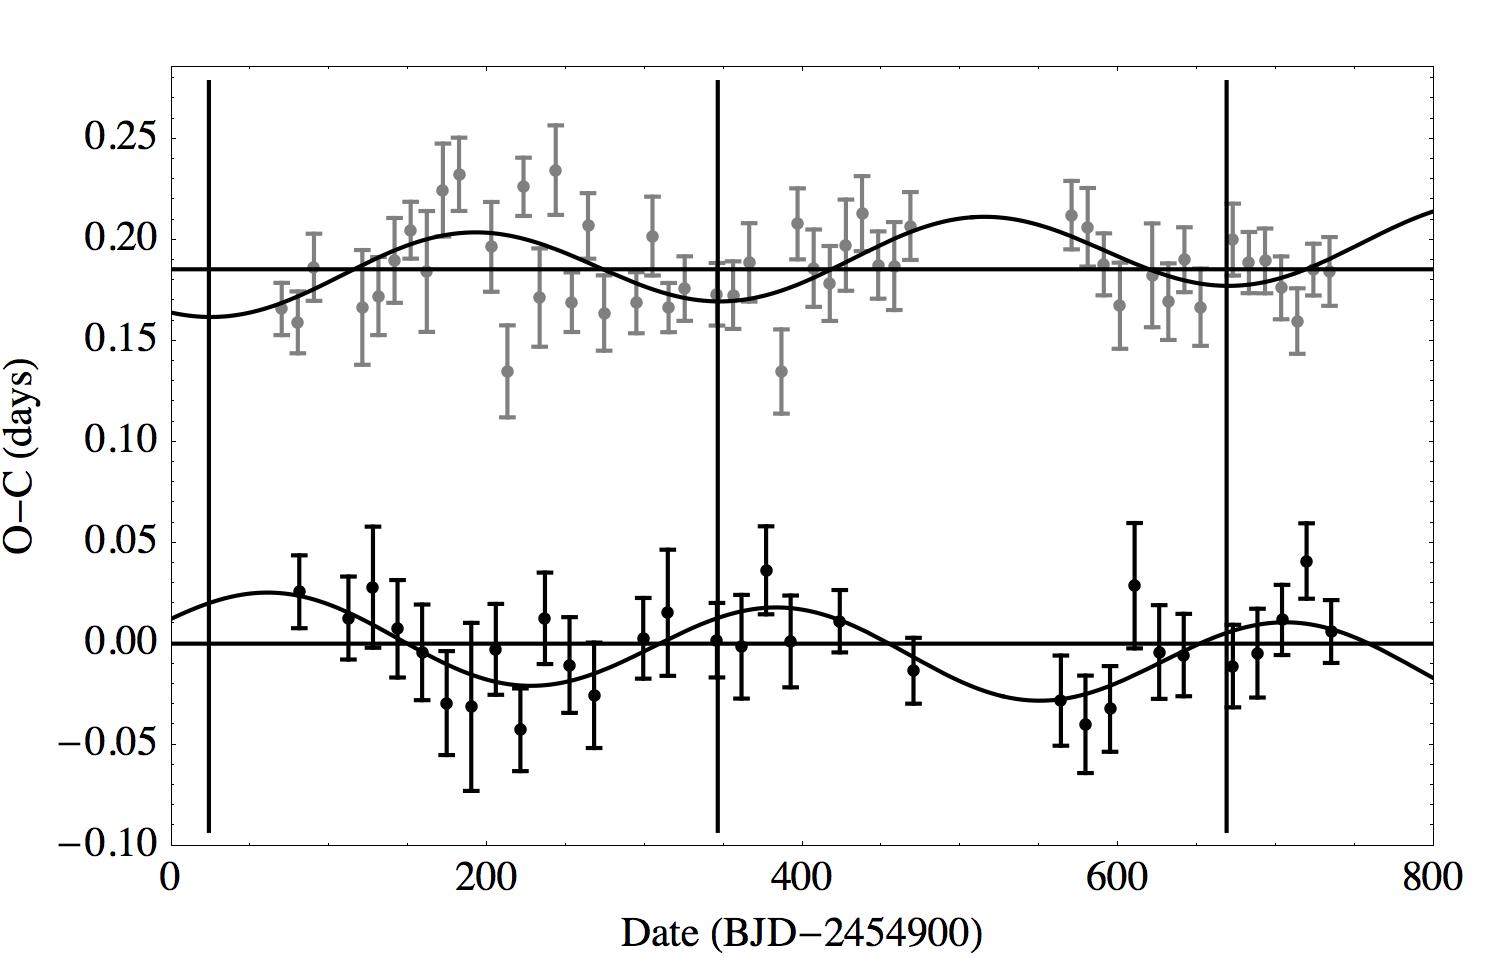
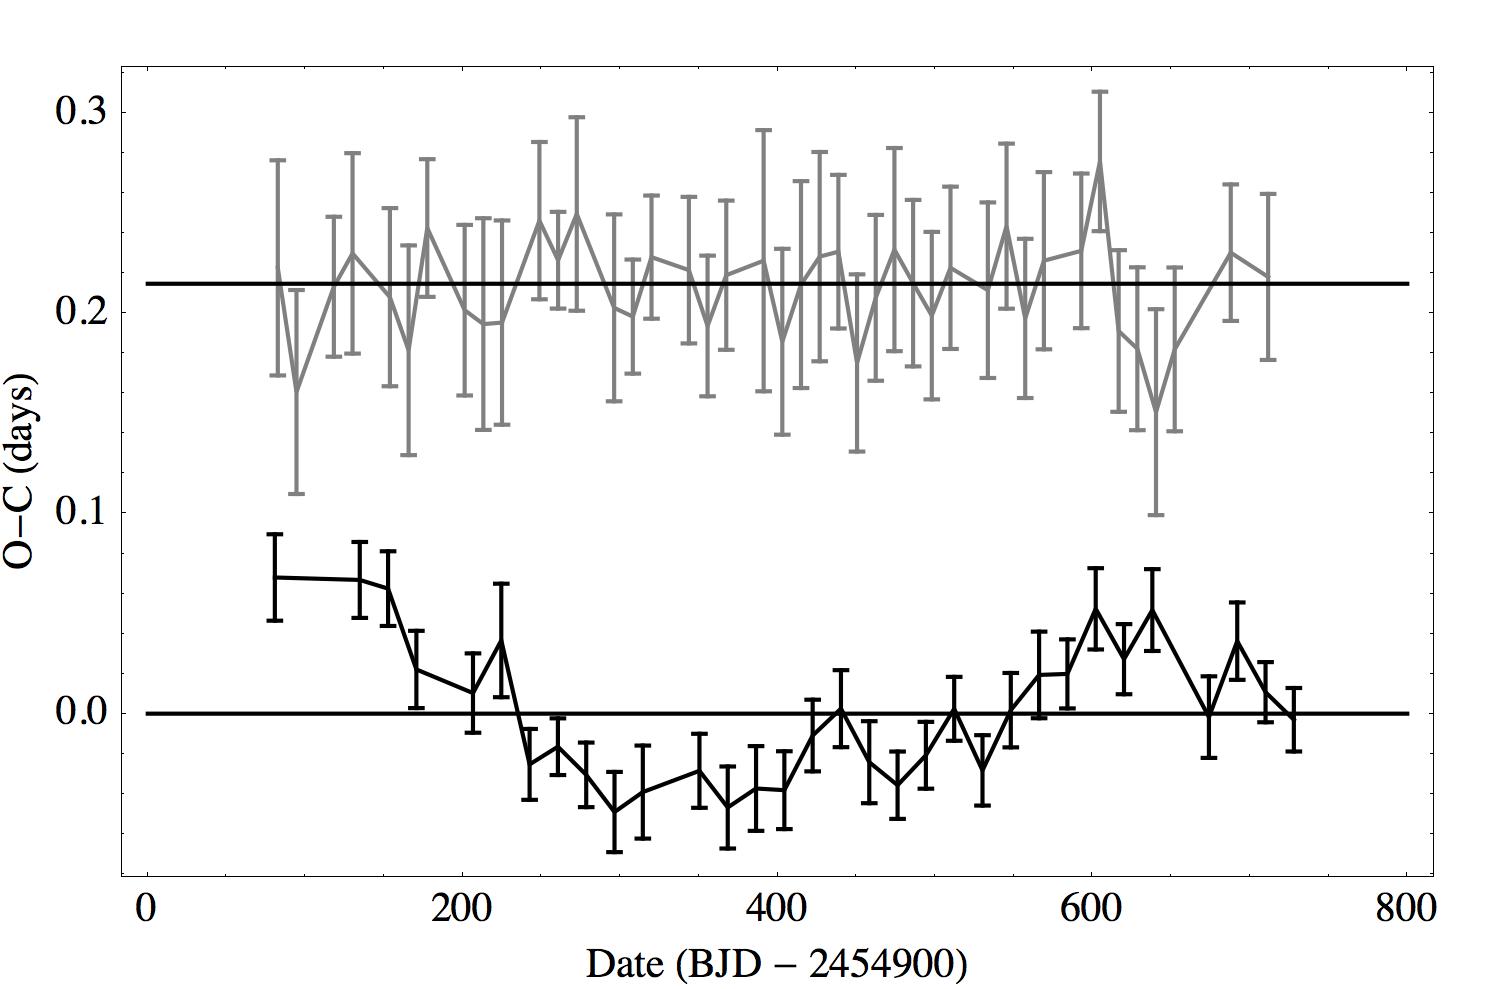
In this appendix we show the data that were used in the analysis of the paper (Figures 1, 2, 3, 4, 5, 6, 7, 8, 9, 10, 11, 12, and 13). The timing residuals (TTV signal) of the inner planet(s) are displaced vertically for convenience in viewing. We also show in Table 6 the values, the TTV period associated with , and associated fit parameters (from Equation 1) for the pairs of planets that can be confirmed with the Fourier methods.
| KOI | ||||||||
|---|---|---|---|---|---|---|---|---|
| (days) | (days) | (days) | (days) | (days) | (days) | (days) | ||
| 148 inner | 19.6 | 381 | -0.00202 | 0.00068 | -0.00191 | 0.00076 | -0.00032 | 0.00051 |
| outer | 0.00245 | 0.00042 | 0.00044 | 0.00046 | 0.00024 | 0.00031 | ||
| 248 inner | 69.8 | 386 | 0.00608 | 0.00071 | 0.00102 | 0.00074 | 0.00035 | 0.00052 |
| outer | -0.01063 | 0.00137 | -0.00281 | 0.00158 | 0.00063 | 0.00103 | ||
| 262 inner | 34.8 | 1080 | 0.01328 | 0.00289 | -0.01321 | 0.00282 | -0.00909 | 0.00226 |
| outer | -0.00668 | 0.00188 | 0.00706 | 0.00180 | 0.00482 | 0.00148 | ||
| 620 inner | 79.6 | 2117 | -0.02297 | 0.00332 | -0.00805 | 0.00144 | 0.02013 | 0.00294 |
| outer | 0.09573 | 0.01485 | 0.04132 | 0.00678 | -0.09856 | 0.01528 | ||
| 775 inner | 19.1 | 192 | 0.00245 | 0.00150 | -0.00691 | 0.00150 | -0.00034 | 0.00106 |
| outer | -0.00273 | 0.00316 | 0.01003 | 0.00272 | 0.00056 | 0.00207 | ||
| 829 inner | 10.9 | 527 | 0.00297 | 0.00265 | -0.00606 | 0.00283 | -0.00123 | 0.00199 |
| outer | -0.01049 | 0.00256 | 0.00798 | 0.00269 | 0.00222 | 0.00188 | ||
| 886 inner | 104.3 | 817 | 0.00676 | 0.00182 | -0.03673 | 0.00243 | -0.00956 | 0.00153 |
| outer | -0.00958 | 0.00526 | 0.04975 | 0.00786 | 0.01469 | 0.00473 | ||
| 904 inner | 93.2 | 1042 | -0.04334 | 0.00539 | 0.05861 | 0.00625 | 0.03503 | 0.00461 |
| outer | 0.05047 | 0.00827 | -0.02519 | 0.00541 | -0.02724 | 0.00544 | ||
| 1241 inner | 11.5 | 434 | 0.07482 | 0.01245 | -0.04064 | 0.01291 | -0.01055 | 0.00905 |
| outer | -0.00374 | 0.00586 | 0.01510 | 0.00643 | 0.00415 | 0.00449 | ||
| 1270 inner | 18.1 | 428 | 0.00000 | 0.00089 | 0.00213 | 0.00103 | 0.00046 | 0.00071 |
| outer | 0.00096 | 0.00198 | -0.01916 | 0.00218 | -0.00459 | 0.00152 | ||
| 1336 inner | 13.6 | 321 | -0.00904 | 0.00370 | -0.01294 | 0.00412 | 0.00358 | 0.00283 |
| outer | 0.01880 | 0.00392 | 0.00230 | 0.00450 | -0.00384 | 0.00300 | ||
| 2086 inner | 10.0 | 662 | 0.01122 | 0.00412 | 0.00738 | 0.00401 | 0.00006 | 0.00287 |
| outer | -0.00806 | 0.00335 | -0.00626 | 0.00342 | 0.00000 | 0.00239 |
