The slowly evolving role of environment in a spectroscopic survey of star formation in galaxies since
Abstract
We present a deep [OII] emission line survey of faint galaxies () in the Chandra Deep Field South and the FIRES field. With these data we measure the star formation rate (SFR) in galaxies in the stellar mass range at , to a limit of SFR. The presence of a massive cluster (MS1054-03) in the FIRES field, and of significant large scale structure in the CDFS field, allows us to study the environmental dependence of SFRs amongst this population of low-mass galaxies. Comparing our results with more massive galaxies at this epoch, with our previous survey (ROLES) at the higher redshift , and with SDSS Stripe 82 data, we find no significant evolution of the stellar mass function of star–forming galaxies between and , and no evidence that its shape depends on environment. The correlation between specific star formation rate (sSFR) and stellar mass at has a power-law slope of , with evidence for a steeper relation at the lowest masses. The normalization of this correlation lies as expected between that corresponding to and the present day. The global SFR density is consistent with an evolution of the form over , with no evidence for a dependence on stellar mass. The sSFR of these star–forming galaxies at does not depend upon the density of their local environment. Considering just high-density environments, the low-mass end of the sSFR- relation in our data is steeper than that in Stripe 82 at , and shallower than that measured by ROLES at . Evolution of low-mass galaxies in dense environments appears to be more rapid than in the general field.
keywords:
galaxies: dwarf — galaxies: evolution — galaxies: downsizing — galaxies: environment — galaxies: general1 Introduction
In recent years, evidence of the bimodal nature of the galaxy population has been obtained with increasing precision (e.g. Strateva et al., 2001; Baldry et al., 2004; Bell et al., 2007). Locally, the galaxy population divides quite cleanly into those which are actively star-forming and those in which star-formation has been terminated, or “quenched”. The relative mix of these two populations appears to be strongly dependent on both environment and stellar mass (, e.g. Baldry et al., 2006; Peng et al., 2010). In particular, the high mass end of the galaxy stellar mass function (GSMF) is dominated by passively evolving galaxies, while the actively star–forming population dominates at stellar masses below (e.g. Pozzetti et al., 2010) at z1. Observations suggest that star formation is truncated first in the most massive galaxies (e.g. Cowie et al., 1996; Bundy et al., 2006; Pozzetti et al., 2010); however, the stellar mass function of actively star–forming galaxies itself evolves very little (e.g. Pozzetti et al., 2010; Gilbank et al., 2010a, b).
Similarly, in the local universe the relative fraction of star-forming galaxies is strongly dependent on environment, with the densest environments dominated by passive or “quenched” galaxies, and star-forming galaxies preferentially residing in lower density, “field” environments. But the properties of star-forming galaxies themselves have at most a weak dependence on environment (Balogh et al., 2004; Wolf et al., 2009; Vulcani et al., 2010). Recently, several authors have claimed evidence for evolution in this environment dependence (e.g. Gerke et al., 2007; Cucciati et al., 2010; Bolzonella et al., 2010; McGee et al., 2011; Patel et al., 2011; George et al., 2011), with several observations possibly indicating enhanced star formation rates (SFRs) in dense regions at z1, under some circumstances (Elbaz et al., 2007; Cooper et al., 2008; Ideue et al., 2009; Sobral et al., 2011; Grützbauch et al., 2011). All of these effects are relatively subtle, so comparisons between works are complicated by different definitions of environment (e.g. Cooper et al., 2010; Muldrew et al., 2012), sample selection and choice of estimator (e.g., average SFR, average specific star formation rate , SFR of star-forming population), and star-formation indicators (e.g. Gilbank et al., 2010a; Patel et al., 2011). Indeed, previous, apparently contradictory, results may be reconciled when uniform definitions are adopted (Cooper et al., 2010; Sobral et al., 2011).
Peng et al. (2010) recently presented an illuminating, phenomenological description encapsulating the environmental and stellar mass dependence of galaxy activity and suggested that these effects appear to be entirely separable. In their model, the efficiency of environment–driven transformation is independent of stellar mass and redshift, and the shape of the stellar mass function (SMF) for star–forming galaxies is universal and time–independent. However, their model says nothing about the rate at which galaxies transform from the star–forming to passive sequence; if this rate is slow enough, it will be observable as a population of primarily low–mass galaxies with lower-than-average SFR.
A direct measurement of this timescale, which would provide important insight into the mechanisms driving this evolution, can be obtained by detecting a population of galaxies currently under the influence of “environment-quenching”. The most likely place to find such a signature is amongst low-mass galaxies (for which mass-quenching is ineffective), at redshifts , when gas fractions and infall rates are high. Most spectroscopic surveys at these redshifts are limited to fairly massive galaxies (e.g. Noeske et al., 2007; Cooper et al., 2010; Bolzonella et al., 2010; Patel et al., 2011; Muzzin et al., 2012). The Redshift One LDSS-3 Emission Line Survey (hereafter ROLES) was designed to extend this work to lower stellar masses at , by searching for emission lines in selected samples, from fields with very deep imaging (Davies et al., 2009). This was a spectroscopic survey, conducted using the LDSS-3 instrument on the Magellan (Clay) telescope in Chile. With a custom made KG750 filter, redshifts and [OII] emission line fluxes were obtained for galaxies at in the mass range .
ROLES demonstrated that the sSFR-mass relation evolves steadily with redshift, in a nearly mass-independent way, so the SFR density (SFRD) evolution is characterised primarily by an evolution in normalization only (Gilbank et al., 2010b). However, there is a hint that the low-mass end of the sSFR-mass relation becomes steeper at (Gilbank et al., 2011), suggesting that the lowest-mass galaxies formed their stars later, and on longer timescales. Surprisingly, despite the small fields covered, Li et al. (2011) found a clear environmental dependence amongst the star–forming population. Star–forming galaxies in only moderately (factor ) overdense regions at appear to have higher SFR, a result that is opposite to the (weak) trend seen locally. This is qualitatively consistent with results from some other surveys (e.g. Elbaz et al., 2007; Ideue et al., 2009; Sobral et al., 2011).
Here, we adopt the ROLES methodology (Gilbank et al., 2010b) to explore star formation and its environmental dependence amongst low-mass galaxies over the redshift range . This provides an intermediate link between ROLES at and the local Universe, using consistent galaxy selection and SFR measurement methods. Moreover, the redshift range and fields were chosen to include highly overdense regions, including the well-studied MS1054-03 galaxy cluster (e.g. van Dokkum et al., 2000; Förster Schreiber et al., 2006). Thus the data span a wider range in environment compared with the ROLES data.
This paper is presented as follows. §2 describes the survey and image reduction methodology, while details of the emission line detection procedure are presented in §3. The basic measurements, corrections, and limiting values are presented in §4. Our results are shown in §5, and we compare our results on the environmental independence of sSFR with published results at and in §6. Finally, our conclusions are summarized in §7. AB magnitudes are used throughout unless otherwise stated and we use a CDM cosmology of , , and . Finally, note that all ROLES SFRs have been corrected using the empirical stellar mass dependent relationship determined in Gilbank et al. (2010a), and described in §4.
2 Data Acquisition & Reduction
The design and implementation of the present survey is similar to our previous work at (Gilbank et al., 2010b, hereafter referred to as ROLES). In this section we review the target selection criteria, observation strategy, and image reduction steps.
2.1 Target Selection
Targets were selected based upon their -band magnitudes, , and their photometric redshifts as provided by Förster Schreiber et al. (2006, FIRES) and Mobasher & Dahlen (2009, CDFS). During the initial survey mask design phase, photometric redshifts were used to prioritize those targets which were expected to lie within our redshift range of , considering the probability distribution of the photometric redshift. Galaxies with large photometric redshift uncertainties, or which were expected to lie outside our target redshift range, were also included in the mask design, with lower priority. As with ROLES, the high sampling density in these fields means that the details of the prioritisation play a limited role, and the photometric redshift preselection does not constitute a strong prior.
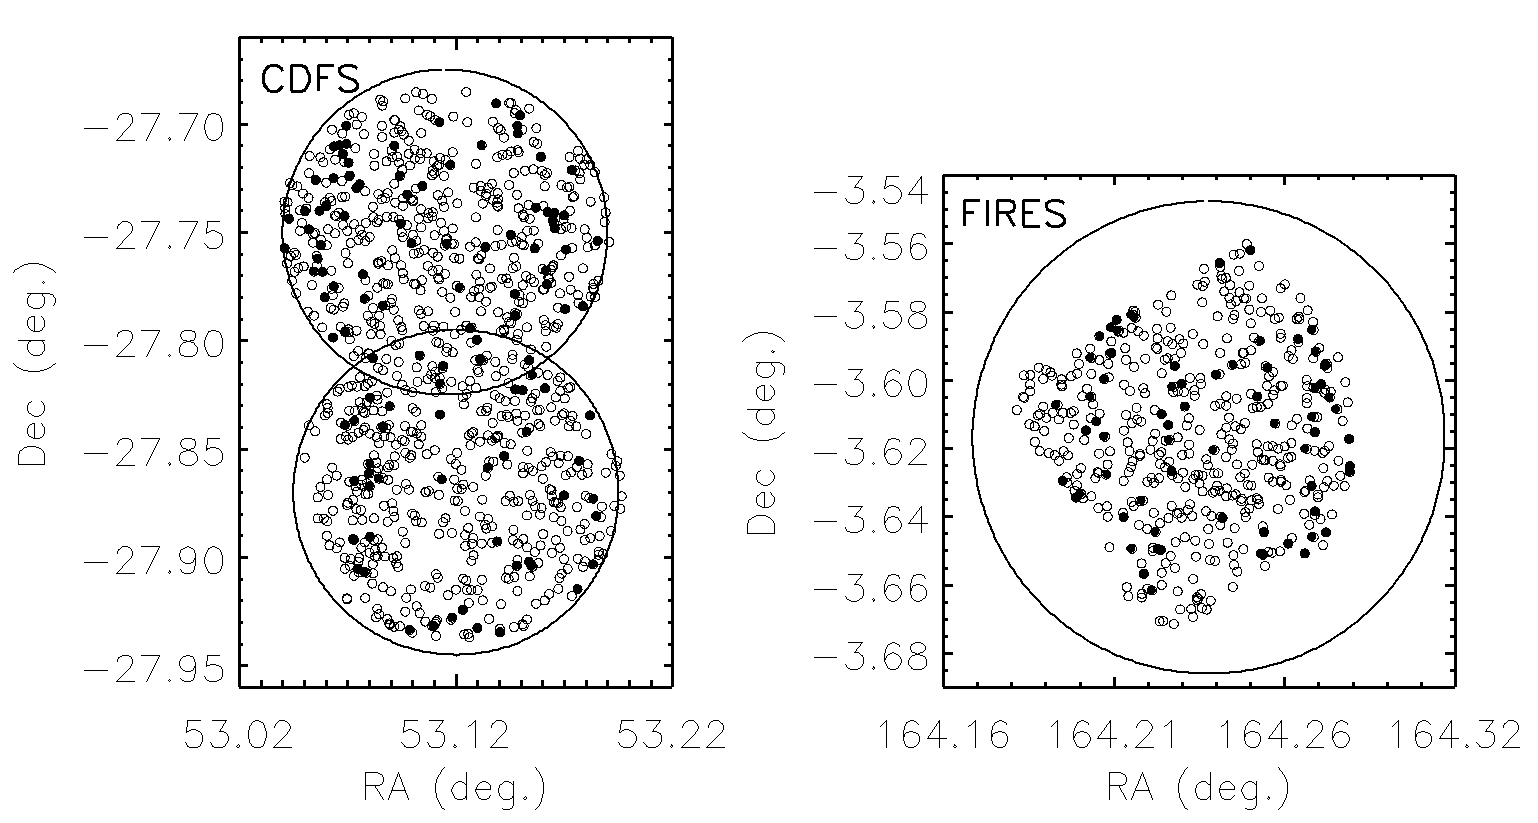
Our survey consists of two pointings in the Great Observatories Origins Deep Survey (GOODS) region of the Chandra Deep Field South (CDFS, e.g. Wuyts et al., 2008) and one pointing in the MS1054-03 cluster region of the Faint Infra-Red Extragalactic Survey (FIRES, e.g. Förster Schreiber et al., 2006; Crawford et al., 2011) field, for a total of 18 masks. The three pointings are shown in Figure 1 with observational targets and emission line detections (described below) indicated.
2.2 Observations
All spectroscopic observations were obtained using the 6.5 meter Magellan (Clay) telescope. Multi-object spectroscopy for our 1946 targets was provided by the Low Dispersion Survey Spectrograph 3 (LDSS-3). The spectra were dispersed by the medium red grism (300 lines/mm) which has a dispersion of approximately at and a relatively uniform throughput across the KG650 wavelength range. Combined with the plate scale of and survey mask slit width of 0.8”, the resolution is FWHM.
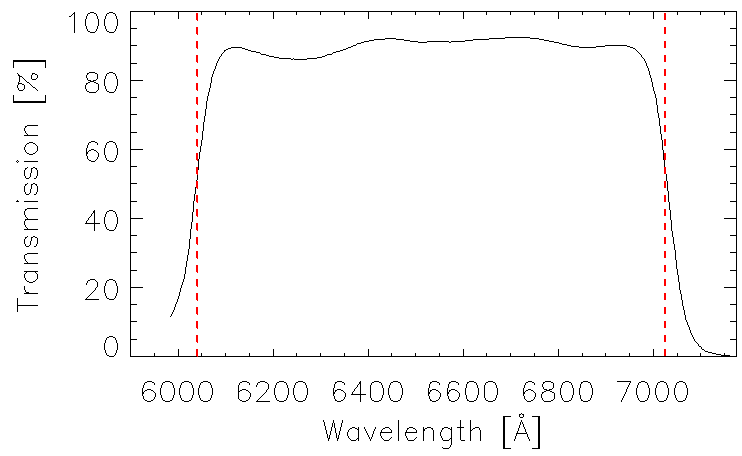
The spectral wavelength range was limited to approximately by a filter, herein referred to as KG650. The transmission curve for the KG650 filter is shown in Figure 2. From this transmission we define our sensitivity range as .
The design of the survey masks was driven by the Nod & Shuffle (N&S, Glazebrook & Bland-Hawthorn, 2001; Gilbank et al., 2010b) observing strategy. The principle advantage of this technique is that it allows for accurate sky subtraction at red wavelengths, where the sky brightness is dominated by rapidly varying emission lines. Target slits were 0.8″ wide by 3.0″ long, which allowed for nearly 200 objects to be targeted per mask given the LDSS-3 FOV of 8.2′ diameter, and the requirement that dispersed object spectra must not overlap. We used a N&S cycle time of 60 seconds and a slit nod distance of 1.2″.
The exposure time for each mask is shown in Table 1. From the 18 masks combined, a total of 3292 objects were targeted. This includes objects which were targeted in multiple masks, and filler objects that do not satisfy our primary selection criteria. The total number of primary targets was 2770 (including duplicates), of which 1946 are unique. These are split between 640 in FIRES and 1306 in CDFS. There were cases where slits were cut too close to mask edges, or to each other, and thus yielded unusable spectra. The number of bad slits per mask typically ranged between 2 and 7. CDFS masks 40 and 41 had an unusually large number of bad slits, with 13 and 14 respectively. For the FIRES field, three exposures per mask were acquired while for CDFS we adopted a shorter exposure time per mask and acquired four frames per mask. The total exposure time per mask was identical for FIRES and CDFS except for CDFS masks 40 and 41 where we acquired an extra 30 minute exposure for each due to time remaining in the observing programme.
| Mask ID | Field | Exposure Time | Seeing | |
|---|---|---|---|---|
| (hrs) | (arcsec) | |||
| mask24 | FIRES | 115 | 2 | 0.5 |
| mask25 | FIRES | 112 | 2 | 0.6 |
| mask26 | FIRES | 100 | 2 | 0.63 |
| mask27 | FIRES | 95 | 2 | 0.53 |
| mask28 | FIRES | 99 | 2 | 0.6 |
| mask29 | FIRES | 105 | 2 | 0.72 |
| mask30 | CDFS.1 | 191 | 2 | 1.0 |
| mask31 | CDFS.1 | 180 | 2 | 0.79 |
| mask32 | CDFS.1 | 178 | 2 | 0.8 |
| mask33 | CDFS.1 | 175 | 2 | 1.0 |
| mask34 | CDFS.1 | 178 | 2 | 1.0 |
| mask35 | CDFS.1 | 171 | 2 | 0.66 |
| mask36 | CDFS.2 | 167 | 2 | 0.86 |
| mask37 | CDFS.2 | 167 | 2 | 0.92 |
| mask38 | CDFS.2 | 164 | 2 | 0.88 |
| mask39 | CDFS.2 | 160 | 2 | 1.19 |
| mask40 | CDFS.2 | 156 | 2.5 | 0.82 |
| mask41 | CDFS.2 | 154 | 2.5 | 0.74 |
2.3 Image Reduction
The FITS image files created by LDSS-3 were processed through an image reduction pipeline similar to that described in the Carnegie Observatories COSMOS (Carnegie Observatories System for MultiObject Spectroscopy) Cookbook111See http://obs.carnegiescience.edu/Code/cosmos/Cookbook.html, with custom-written IDL routines to supplement the existing software when required.
2.3.1 Initial Frame Combining
LDSS-3 was read out in two amplifier mode meaning that each mask exposure consisted of two raw FITS images. These images were combined using the COSMOS “stitch” routine with gain parameters set according to each specific amplifier and dewar parameter set to LDSS3-2. The “stitch” routine removes bias and corrects for differences between amplifier gains in LDSS-3 so no further bias removal was necessary after this stage.
2.3.2 Bad Pixel Mask from Charge Traps & Cosmic Rays
A bad pixel mask (BPM) was created using Nod & Shuffle dark frames (N&S darks) acquired using the same N&S parameters as for the science frames. The resulting image is one which is mostly dark (predominantly read noise counts) with streaks of bright pixels indicating bad pixels created by charge being trapped by individual pixels in the CCD array. The streaks correspond to the charge shuffle distance and direction defined by the N&S strategy. A BPM was made from a N&S dark by dividing the original N&S dark frame by a 1x3 boxcar smoothed version (smoothing done in the direction perpendicular to the shuffle direction) of the same frame. Bad pixels appeared brighter in the ratio of the frames and were recorded as being bad in the BPM. Since several N&S darks had been acquired, they were each processed in the same manner and finally median combined into one single BPM.
As many masks were observed with only three exposures, we used the IRAF cosmicrays task to identify the locations of cosmic rays (CR) in each frame based upon user-defined threshold levels and cosmic ray shapes. The pixel locations were recorded as a unique BPM for each exposure, and this resulted in superior quality image stacks during median combination.
2.3.3 Wavelength Calibration
The COSMOS apertures routine was used to make predictions of initial positions of the slit centers in each mask. These positions were compared to the actual slit center positions as imaged through the optical path and corrected (to less than 1 pixel difference) using the align-mask routine. The positions of known arc lines were predicted for the arc calibration frames using the align-mask, map-spectra, and spectral-map routines. The COSMOS adjust-map routine was adequate for providing an initial wavelength calibration solution for most slits in a given mask. However there remained several cases where analysis of sky emission lines revealed inaccurate calibration. For this reason an IDL routine was used to determine a third order wavelength calibration solution to all of the slits in each mask, based on the position of these emission lines. Final emission line position residuals were typically .
2.4 Creation of Stacked Frames
For most masks the individual exposures to be stacked were acquired on different dates. As masks were interchanged in the optical path frequently and the telescope was at different orientations while tracking the target field at different times of the year, differences in mask flexure, rotation, and shifts were introduced between one exposure and another. The transformations between science frames and an arbitrary reference frame were determined based on the common sky emission line centroid positions in each frame. The transformations commonly required a small rotation, shifts in the and directions, and on occasion a multiplicative scaling. The IRAF task geomap computed these transformations while the geotran task was used to apply them to each non-reference frame to be stacked.
The applied geomap/geotran transformations accounted for differences in slit positions from one exposure frame to another. However, there were also cases where the target galaxy within a slit varied slightly in position between the frames to be stacked. To rectify this, another IDL program was written to determine and apply any further required shifts in the spectral and spatial directions based upon a list of bright emission lines identified by eye and found in each frame to be stacked. Any such shifts were typically in the and/or directions.
The steps required to create the stacked signal frame from the N&S observations are described below. Individual exposure frames are labeled as A and B, and the recipe can be extended to an arbitrary number of frames.
-
1.
Shift frame A by 16 pixels in the spatial (“y”) direction, to get a new frame ;
-
2.
Perform the subtraction A - to get a new frame . This is the sky subtracted frame;
-
3.
Shift frame by 6 pixels in the spatial (“y”) direction, to get a new frame ;
-
4.
Perform the subtraction - to get a new frame . This frame is the “positive” image frame;
-
5.
Repeat steps (i) through (iv) for all individual exposure frames;
-
6.
Determine if individual frame flux scaling is necessary for each frame based upon the flux level ratios of several manually identified emission lines common between the brightest frame and the frame being scaled;
-
7.
Apply further (small) frame shifting if necessary based upon the centroided positions of the identified emission lines used in step 6;
-
8.
Median add the “positive” image frames, + = C.
The IRAF task imcombine was used to median stack the individual “positive” image frames. The bad pixel mask described in §2.3.2, which includes identified cosmic rays, was used to ignore pixels during the combination.
A corresponding noise frame was created in a manner similar to the stacked signal frame, as described by Gilbank et al. (2010b). In the equations below the subscripts ij refer to the pixel of the frame.
-
1.
Apply the same frame flux scaling, determined in step (vi) of the stacked science frame creation recipe, to each sky added frame;
-
2.
Apply the same (small) frame shifts, determined from the locations of common bright emission lines used in step (vii) of the stacked science frame creation recipe, to each sky added frame;
-
3.
Stack (median add) the sky added image frames to get a new frame, ;
-
4.
Add in the LDSS-3 read noise, R. The read noise must be added in twice since the median combined frame consists of a shifted frame added to a non-shifted frame, each containing read noise. The read noise adjusted frame is calculated as follows:
(1) -
5.
Scale frame by the number of individual science frames used in the median combination, ,
(2) -
6.
Shift the frame by 6 pixels in the spatial (“y”) direction, to get a new frame ;
-
7.
Perform the quadrature addition of these last two frames to get the final noise frame:
(3)
3 Emission Line Detection
3.1 Creation of Signal-to-Noise Frame
To identify faint emission lines, a normalized 2-D convolution kernel, , was created which had the same Gaussian shape as a typical bright emission line (FWHM=[5.5,3.5] pixels), and was convolved with the signal () and noise () frames to give flux-conserved, convolved signal and noise frames, according to:
| (4) |
and
| (5) |
The next step was to estimate the continuum found in the original signal frame. Similar to the convolution of the signal and noise frames, a convolution was again performed on the raw signal frame, using a 2-D normalized averaging kernel, :
| (6) |
The shape of the kernel consisted of a zero central region (20 pixels spectral by 3 pixels spatial) and two sidebands (also each 20 pixels spectral and 3 pixels spatial). The sidebands had the same Gaussian FWHM of 3.5 pixels in the spatial direction as the emission line kernel for their entire spectral length of 20 pixels. Convolving the kernel with the raw science frame provided an estimation of the continuum for the pixel located at the center of the kernel. The zero region was included so that the continuum estimate was not biased by the presence of an emission line. This provides a continuum estimate that is effectively an average of the flux in the spectral and spatial directions, in the “wings” of the pixel for which the continuum was being determined.
The noise due to the continuum, , was calculated by convolving the emission line kernel, , with the estimation of the continuum frame, , as follows:
| (7) |
and the total noise frame, , was calculated by adding in quadrature the convolved raw noise frame with the convolved continuum noise estimate
| (8) |
In most cases the noise is dominated by sky line emission, but the continuum noise is not entirely negligible.
This procedure accurately accounts for statistical noise in our spectra, but may not account for low-level systematics resulting from weak charge traps, sky emission residuals (minimized but not entirely eliminated with N&S cycles of 60s), or overlapping spectra. We analyzed the rms fluctuations in the final science frames and compared this with the associated noise estimate, for each mask. Specifically, thirty equally spaced “test” locations were chosen along the center line (distributed in the spectral direction) of each slit in a given mask, for both the stacked science and stacked noise frames. The mean pixel value for each slit test location in the science frame was determined by taking the mean of the pixel values within two 60 pixel sidebands, located to either side of the test location. The fluctuation of the test location pixel value from the mean was then simply the actual pixel value subtract the mean value. For every slit in the mask, the science fluctuation () and noise value () for thirty test locations were recorded. Histograms of the science fluctuations and corresponding noise values were then fitted with Gaussians. Finally, the ratio of the best-fit Gaussian standard deviation of the science frame fluctuations and the Gaussian mean of the noise values gave the “noise correction factor” (NCF):
| (9) |
A typical noise correction factor was 1.2, indicating that residual systematics amount to an additional 20% on top of the statistical noise.
The final S/N frame was calculated as
| (10) |
3.2 Emission Line Finding
The central five rows of each spectrum was extracted from the 2D frame, to minimize effects near slit edges that affect line detection. For every pixel above a S/N threshold of , an “n-connected neighbour” search was performed to locate connected neighbouring pixels that also exceed this threshold. A candidate detection then consists of two or more connected pixels; if multiple detections were separated by five pixels or less, they are combined into a single detection. Detections found within three pixels of the spectral ends of the extracted spectrum, and those that were due to overlaps of order spectra, were excluded. The resulting list was visually inspected, and obvious false detections (due in general to overlapping spectra or missed cosmic rays) were manually removed.
3.2.1 Catalogue Purity


The catalogue was internally tested in two ways to determine the purity, following Gilbank et al. (2010b). We first consider the reproducibility of emission lines for the 412 galaxies that were targeted on more than one mask. For these galaxies, detection lists were compared and emission lines were considered to match if their wavelengths were within of each other. If a detection was found in all of the masks the galaxy was targeted in, then it was considered fully recovered; otherwise it was considered spurious. This is therefore a conservative estimate of the purity. The results of this test are shown in Figure 3 where it is clear that 95% of spurious detections occurred in detections below .
An independent test of purity is to consider spectra for which more than one candidate is detected. The wavelengths of these candidates were compared with expected sets of lines, which are likely to appear in only a small number of combinations: the complex (), and the pair. Candidates were considered real detections if their line ratios matched one of these combinations. In the case that the lines did not correspond to an expected set, the line with the highest significance was considered real, while the next-highest significance line was considered spurious; lower significance lines were omitted for the purpose of this test. Figure 4 shows the S/N distribution of these real and spurious lines; of spurious lines have significance less than .
From these tests, we conclude that % of false detections occur below a significance threshold of ; thus we only consider detections above this limit in our analysis.
3.3 Emission Line Flux Determination
Flux calibration was based on the spectrophotometric standard star HD 49798 (Bohlin & Lindler, 1992). Emission line fluxes and their errors were measured from the stacked raw science frames with the continuum estimation removed, and the stacked raw noise frames. The bad pixel masks were incorporated to eliminate bad pixels and cosmic rays. For each detection, the centroid position of the flux was found within a 15 x 17 pixel box, initially centered on the location of the highest significance pixel in the emission line. The total emission line flux was taken to be the sum of flux within a 7 x 5 pixel region about this centroid. The line flux error was calculated for the same pixels, based on the noise spectrum.
To account for varying photometric conditions, we compare the flux in the continuum measured from the spectra on each mask with photometric data from public catalogues. For the CDFS field we use the R-band magnitudes from FIREWORKS (Wuyts et al., 2008), which covers almost exactly the same wavelength range as our spectroscopy. For the FIRES field, the available photometry does not include R-magnitudes, so we interpolated between the HST WFPC2 F606W and F814W filters. For each mask we calculate the average offset between the flux in our spectra and the continuum flux measured from the imaging. We use this to identify the most photometric mask in each field, and the offsets from this mask for all of the others. We then correct the flux calibration for the non-photometric masks, to match this reference frame. The correction is typically mag, with a maximum of 1 mag.
We take advantage of galaxies within our linelist that were imaged on multiple masks, to further check the consistency of the flux calibration and our uncertainty estimates. The flux differences for separate observations were determined and plotted as a function of line flux, as shown in Figure 5. As expected, the matching line flux differences are scattered about zero. The significance of each difference is obtained by dividing by the flux uncertainties added in quadrature. The significance distribution has a standard deviation of , but a Kolmogorov–Smirnov test cannot distinguish between this distribution and a normal distribution with . Thus we conclude that uncertainties in relative flux calibration from mask-to-mask are negligible.

We looked for a correlation between the flux difference compared with the photometry and galaxy size. While there does appear to be a correlation in the expected sense, that larger galaxies are missing more flux in our spectroscopy, there is a lot of scatter from object to object. We have elected therefore not to apply an aperture correction, but note that the fluxes for our largest galaxies are likely underestimated. Only three of our spectra overlap with spectra obtained by Vanzella et al. (2008); while this comparison shows our flux calibration is consistent with theirs, there are not enough objects in common to state this with a high degree of confidence. Thus we expect our line fluxes are dominated by this systematic uncertainty in flux calibration, which is likely at least a factor of with a dependence on galaxy size.
The wavelength-dependent flux limit was determined for each survey mask from the associated noise propagated through the analysis pipeline. For each mask, the average noise spectrum was determined from all the dispersed spectra in the mask, and secure detections were then defined as those brighter than . Figure 6 shows the flux of all detected lines, and the average 5 noise level for all masks. Unless otherwise stated, analysis in this paper excludes lines that fall below the average flux limit shown here, to enforce a uniform limit.

3.4 Line Identification
For galaxies in the catalogue where more than one emission line was detected with an appropriate wavelength separation, identification was straightforward. However, there are only 41 such candidates, 15 of which are identified as [OII]. The remainder of the catalogue consists of single emission lines, for which we rely on the photometric redshift probability distribution functions (PDFs) to identify the line, as described in Gilbank et al. (2010b). The relative likelihood of a line being [OII] was assigned to each detection in our catalogue by determining the ratio of the probability of the emission line being [OII] to the total probability of being either , or one of the complex. The probabilities were calculated by integrating the photometric redshift PDFs over the redshift ranges corresponding to the lines of interest in our spectral window.
For a few lines, publicly available spectroscopy covering a larger wavelength range are available; nine from Crawford et al. (2011, MS1054-03) and 73 from Wuyts et al. (2008, FIREWORKS) have secure redshifts. Figure 7 shows these secure redshifts as a function of the wavelength of the detected emission line in our sample. Straight lines indicate the redshift–wavelength relation for different emission lines, including [OII] (black dashed line). The detections denoted by solid symbols were those which had an integrated photometric redshift probability of being [OII].
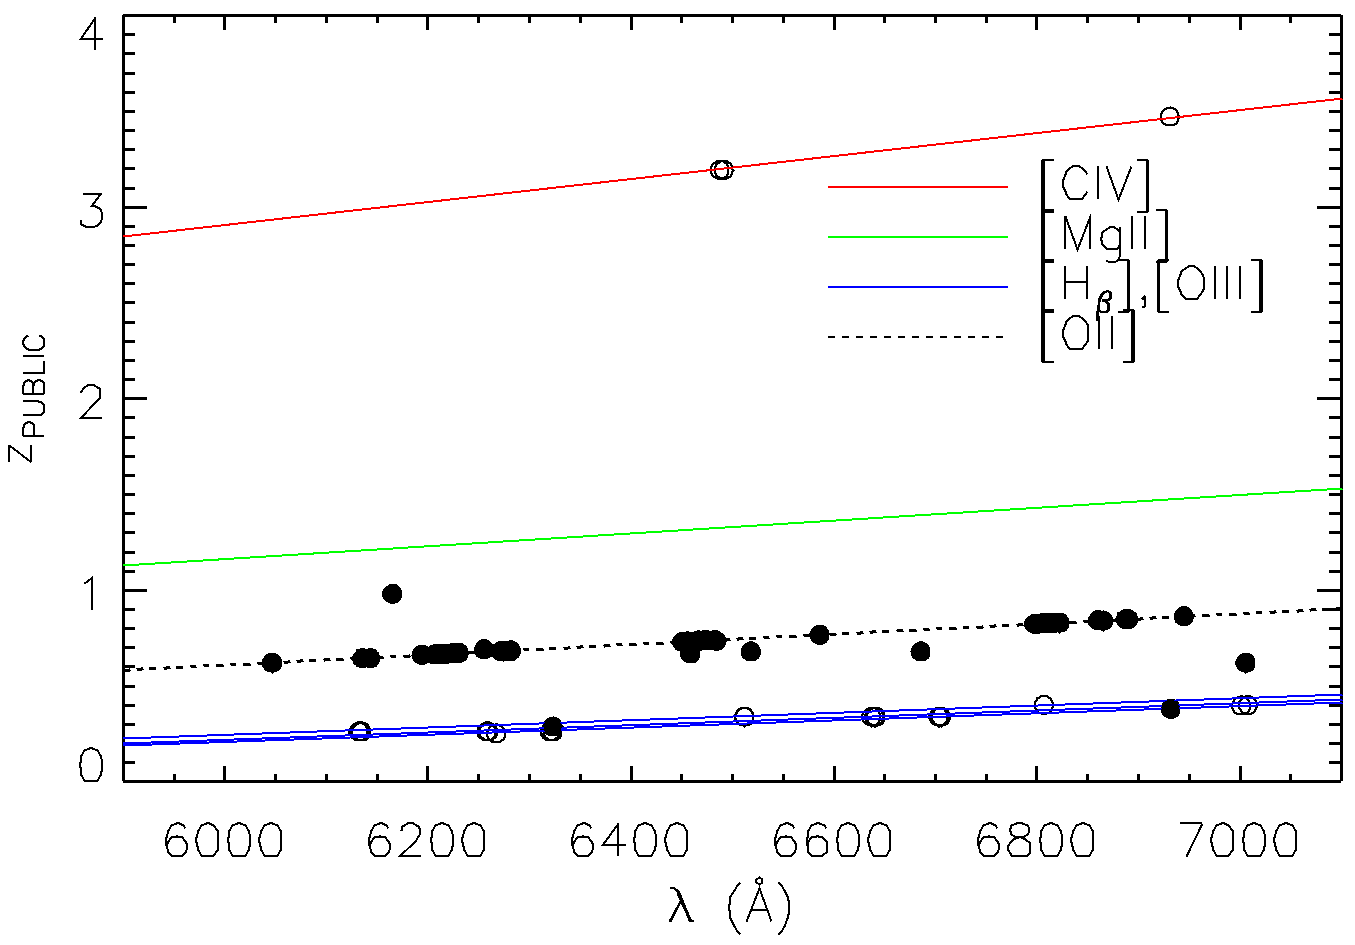
Most of the emission lines which had a high probability of being [OII] () are confirmed as such from the public redshift. Of the 82 matched detections shown in the figure only three appear inconsistent with their published redshift, suggesting that the purity of our sample is over 95 per cent.
3.5 Final Catalogue
The final catalogue contains all detections with , and a redshift determined following the line identification procedure described above. The detections were also given a line quality flag as follows:
-
0:
Line is not likely [OII] based on the photometric redshift PDF, and there is no existing public redshift
-
1:
Photometric redshift is consistent with the detection being [OII]
-
2:
Photometric redshift is consistent with the detection being [OII], confirmed by detection of [NeIII].
-
3:
Photometric redshift is consistent with the detection being [OII], confirmed by a published redshift.
4 Analysis
Spectroscopic redshifts determined for the galaxies in our line list, as well as photometry in the CDFS field from the FIREWORKS catalogue (Wuyts et al. 2008; , , , , , , , , , , , , [3.6], [4.5], [8.0]), and in the FIRES field (Förster Schreiber et al. 2006; , , , , , , , and ), served as inputs to the stellar PEGASE.2 (Fioc & Rocca-Volmerange, 1997) population models, as described in Glazebrook et al. (2004). The models were fit to aperture magnitudes, and the final stellar masses222PEGASE.2 only accounts for luminous stars in its determination of stellar mass. Thus stellar remnants such as white dwarfs, neutron stars, and black holes were not included. were subsequently scaled according to the total magnitude.
Emission line luminosities were first converted to “fiducial” star formation rates (), starting from the Kennicutt (1998) relation
| (11) |
where the factor of 1.82 accounted for the conversion from a Salpeter IMF (Salpeter, 1955) to the BG03 IMF (Baldry & Glazebrook, 2003), and we assume . In practice, and the other coefficients in Equation 11 are likely to depend strongly on the galaxy stellar mass. We therefore use the empirical correction advocated by Gilbank et al. (2010a, Eq.8), based on analysis of the SDSS:
| (12) |
where , , , , and . We apply this correction to all SFR reported in this paper.
This SFR estimate assumes that the [O II] emission arises from gas ionized by massive stars; any contribution from an active galactic nucleus (AGN) would reduce the SFR. We would not expect AGN to contribute significantly in such low-mass galaxies; in Gilbank et al. (2010b) we confirmed from analysis of mid-infrared colours and Chandra point sources that AGN were entirely negligible in that sample. We will therefore also neglect AGN contamination, except when we include higher mass galaxies from other surveys (§ 4.1).
4.1 Extension of the survey to higher masses
We supplement our survey with brighter (more massive) galaxies, primarily from publicly available VLT/FORS2 spectroscopy overlapping our CDFS sample area, from (Vanzella et al., 2008). Their sample was a colour and photometric redshift selected catalogue with targets found between the redshift ranges of and . We selected only those targets which were found within the LDSS-3 field-of-view centered on our CDFS field pointings, and which fell within our redshift range of . Their observation masks used 1″ slits (compared to 0.8” for ROLES) and exposure times for each mask were typically hours. Hereafter this higher mass sample is referred to as FORS2.
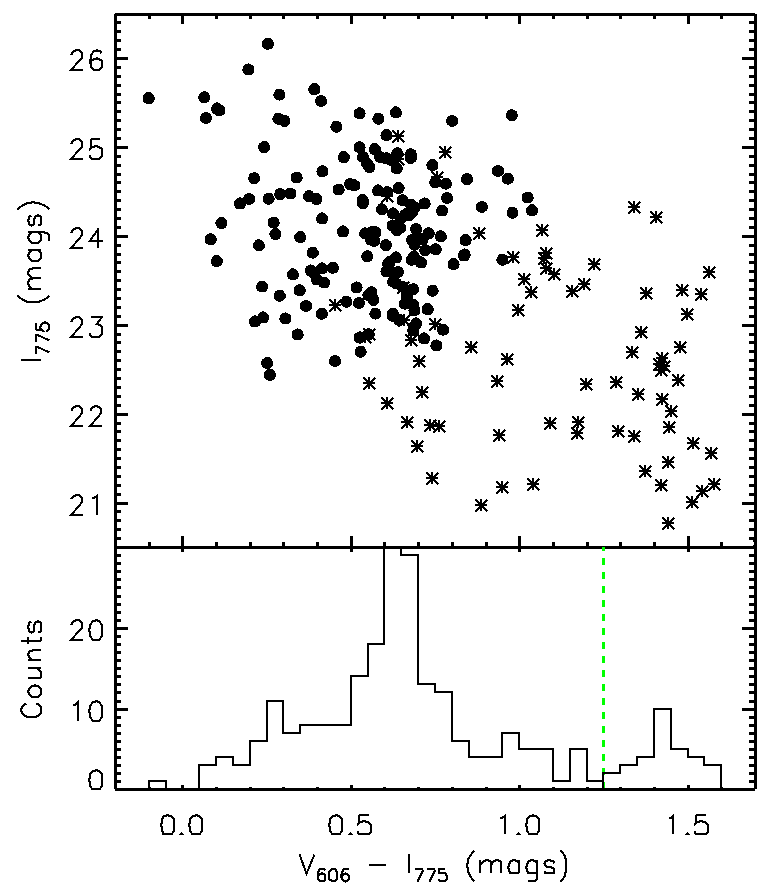
For these massive galaxies, there is more concern that the emission lines could arise from AGN or LINER emission, rather than star formation. As in ROLES, we therefore exclude red-sequence galaxies from the sample, using a colour-magnitude diagram (CMD) consisting of bands which bracket the break at . Figure 8 shows the characteristic bimodal colour distribution of galaxies in our CDFS and FORS2 samples; while all our low-mass targets are in the blue cloud, a subset of the FORS2 galaxies are on the red sequence, with .
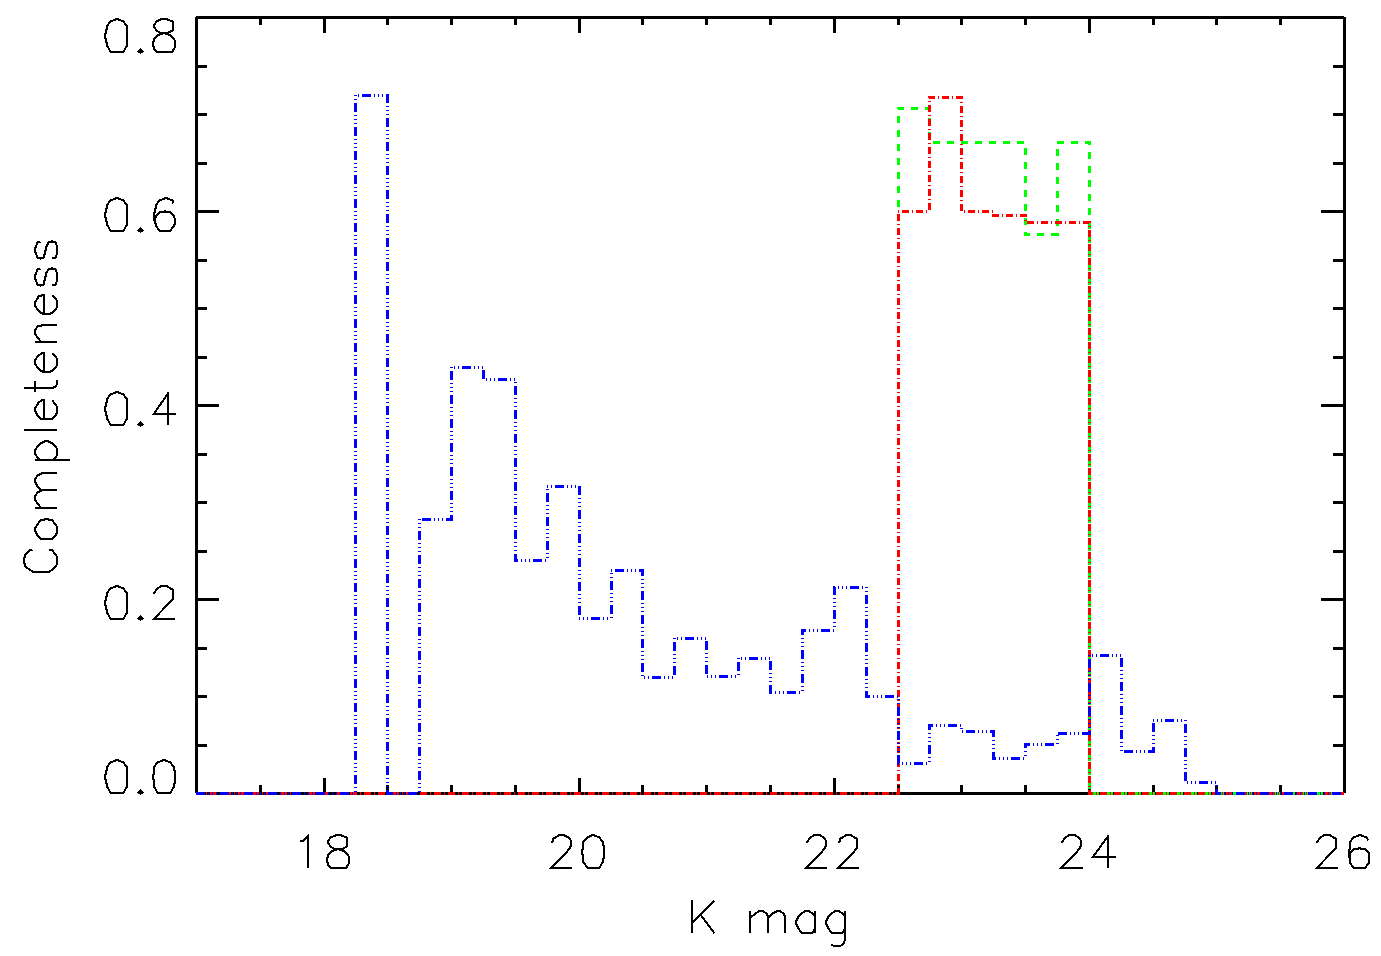
For each FORS2 emission line we calculated as before (with a typical value of ). The -magnitude binned FORS2 completeness was determined in the same way as for our data, and the results are shown in Figure 10. We extracted spectroscopic redshifts, line identifications and quality flags, and 1D spectra for these galaxies. [OII] emission line fluxes were measured from the 1D spectra in the same way as for our own data. A constant noise flux limit of was adopted, approximately the same as the average noise flux limit for the rest of our sample (see Figure 6).
4.2 Completeness
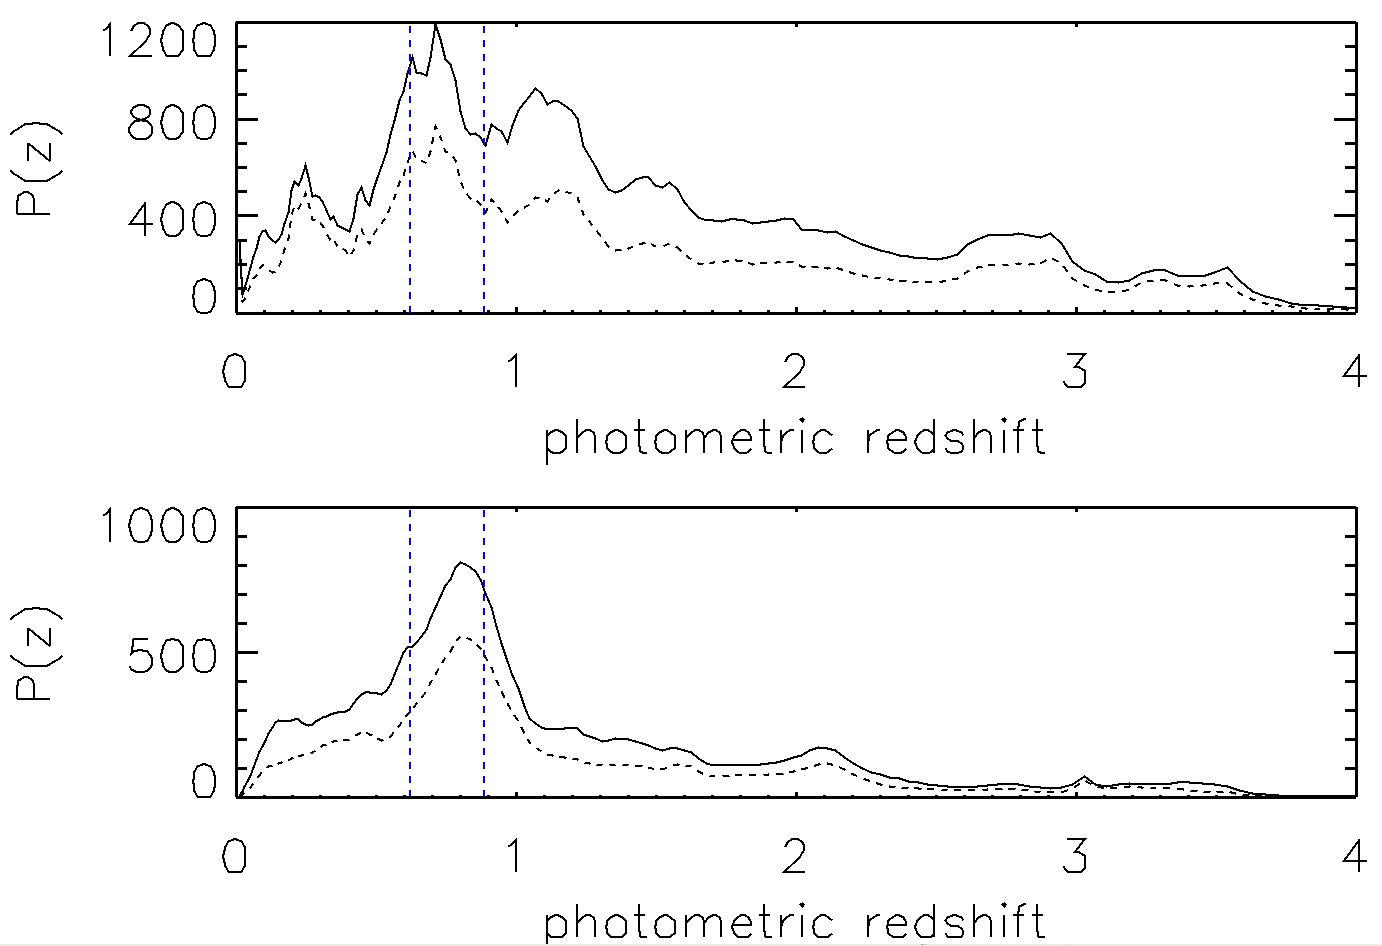
As for ROLES, we characterize our spectroscopic completeness as follows. For each field, all photometric redshift probability distribution functions corresponding to galaxies within our target fields were first binned by -magnitude. Within each bin the PDFs were summed, giving the total redshift distribution for all galaxies in each bin, . The summed redshift distribution in each bin was then integrated over the redshift of interest here, . The process was then repeated for only those galaxies that were successfully targeted (i.e., the slit was successfully extracted), and the ratio of this to the total distribution yields the targeting completeness. The redshift PDFs of targeted and candidate galaxies are shown in Figure 9.
The resulting completeness is high, per cent, and independent of magnitude. This is shown in Figure 10 with the CDFS field represented by the red dashed line and the FIRES field denoted by the green dashed line. The figure also includes spectra for brighter galaxies from the public domain, discussed in § 4.1.
4.3 Redshift distribution and definition of dense environments
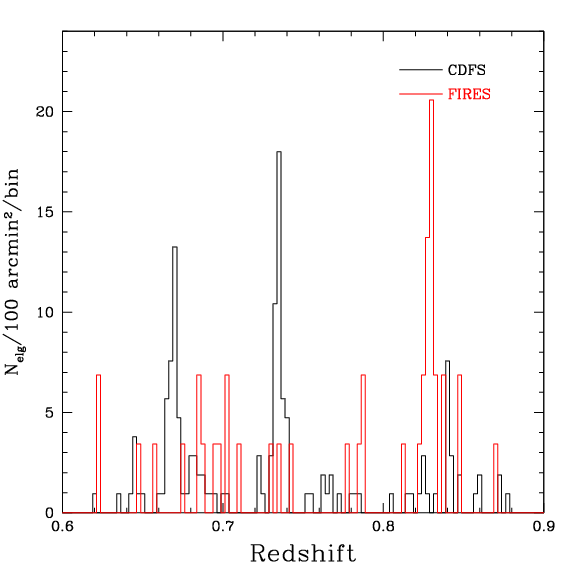
The redshift distribution of our emission line galaxies is shown in Figure 11. Two prominent peaks in this distribution at and correspond to the well-known “wall-like” structures in the CDFS (Gilli et al., 2003; Le Fèvre et al., 2004; Vanzella et al., 2005; Ravikumar et al., 2007). We associate all CDFS galaxies with and with these structures. As traced by our low-mass galaxy sample, this structure is spread fairly uniformly over the LDSS3 field of view, without an apparent density gradient or central concentration. The rest-frame velocity dispersion of emission line galaxies in each of these structures is km/s and km/s, respectively. The other important structure, at , is the MS1054-03 cluster, in the FIRES field (Förster Schreiber et al., 2006); all galaxies in the field and within of this redshift are associated with the cluster. The rest-frame velocity dispersion of these emission line galaxies is km/s, in good agreement with van Dokkum et al. (2000). Together, these three subsets of galaxies are referred to as “dense environments” for the subsequent analysis. Combined, the subsample comprises 112 galaxies, 23 of which are associated with the MS1054-03 cluster. The remaining galaxies are referred to as the “field”; it now represents an underdense sample relative to the average of our full sample. We will show in § 5.2 that both the CDFS “walls” and the MS1054 cluster are comparably overdense, by a factor of at least relative to the field, and probably more like a factor .
4.4 [OII] Luminosity, Stellar mass and SFR Limits
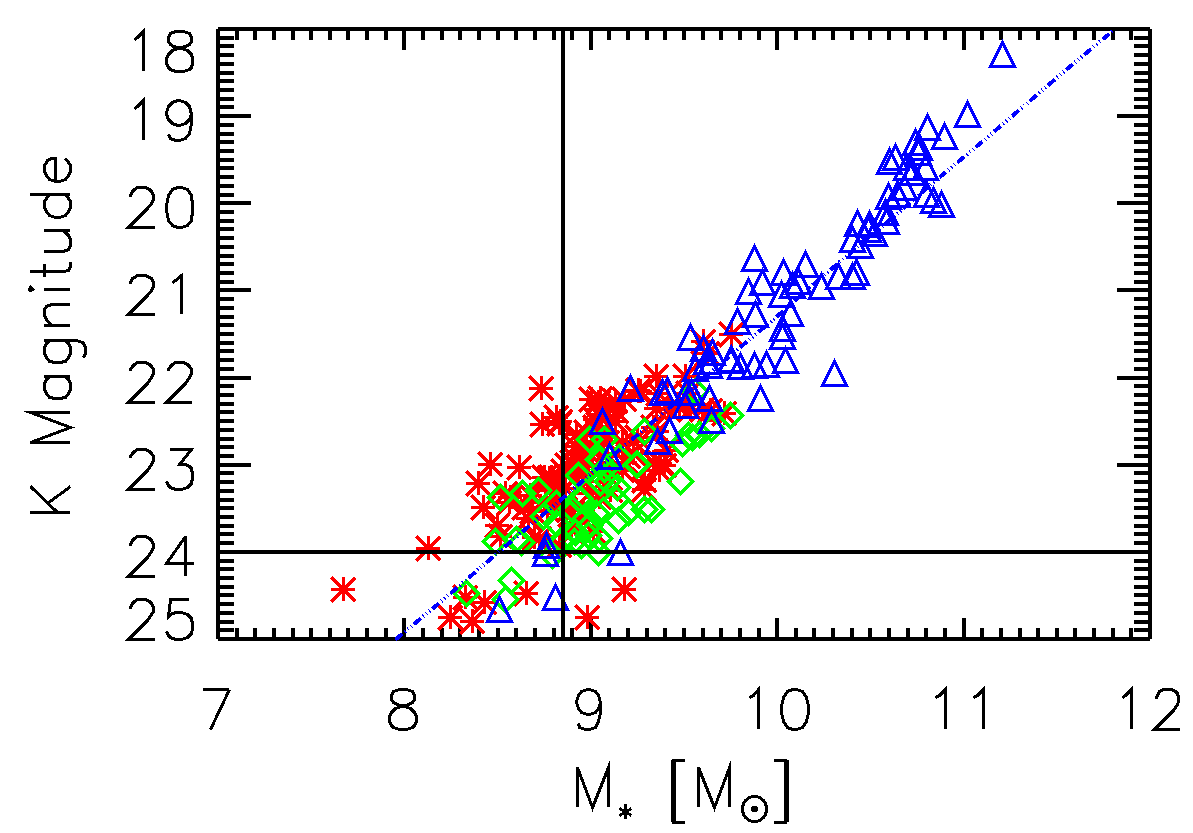
The stellar mass limit of our sample is determined from the scatter in the correlation between -magnitude and stellar mass shown in Figure 12. The horizontal line shows our limiting selection magnitude of . Based on the scatter in this relation, the sample is nearly ( per cent) complete in stellar mass for . We take this to be our mass completeness limit; the sample extends to lower masses, but is systematically missing galaxies with high ratios.
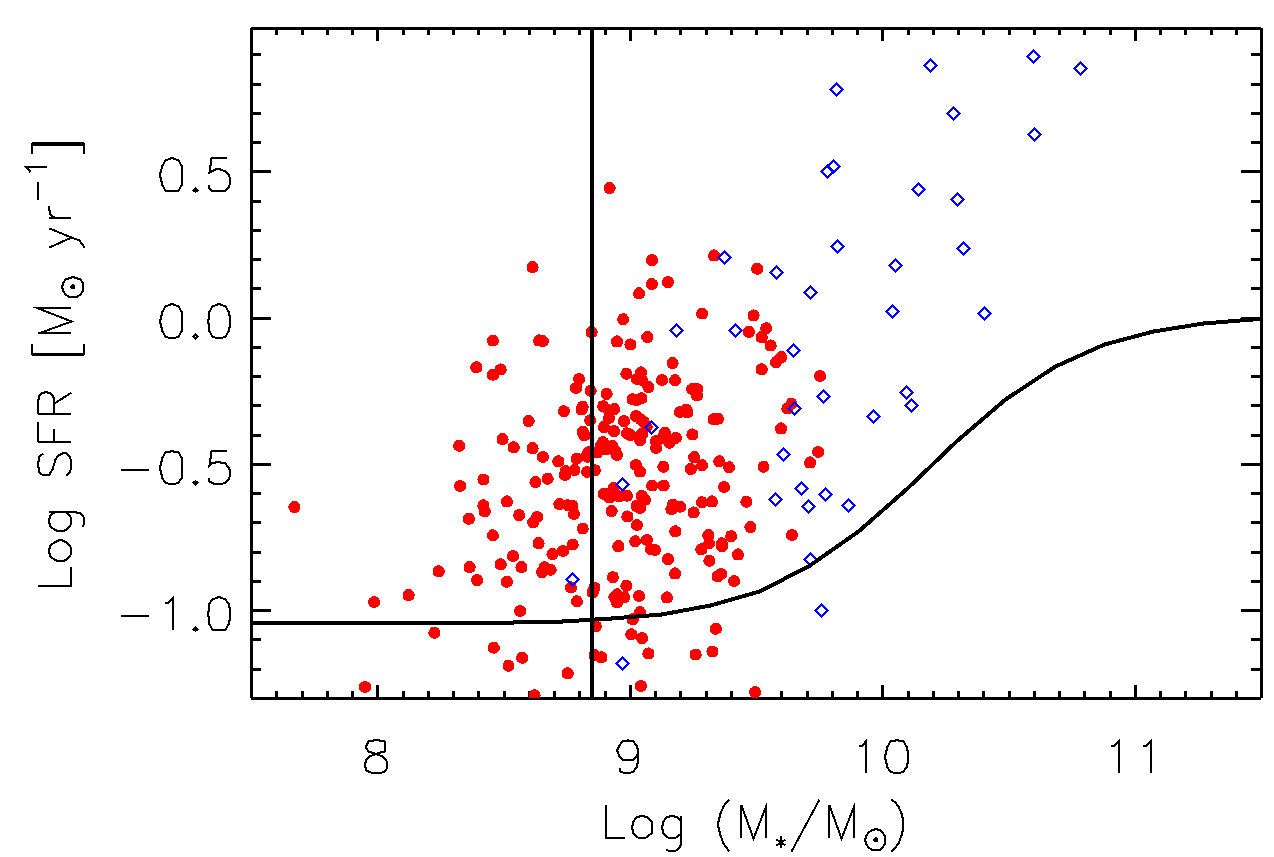
The average [OII] flux limit as a function of wavelength was shown in Figure 6. The sample is statistically complete for fluxes as low as . Considering our low redshift bound of , the corresponding [OII] luminosity limit at which the sample should be statistically complete is determined to be . However, most of the volume is limited to higher luminosities, and is a more representative limit for most of the data. The limiting SFR (including the mass-dependent empirical correction) can be determined from the [OII] luminosity limit, using Equations 11 and 12. Figure 13 is a plot of the empirically corrected SFRs versus stellar mass. The mass and SFR limits are indicated with solid lines. We reach SFR at the low stellar masses of interest here, corresponding to a mass doubling time (assuming a recycling factor ) of years. This is almost twice the Hubble time at , and we expect this depth is sufficient to capture most of the star formation at these masses (e.g. Noeske et al., 2007; Gilbank et al., 2011).
4.5 Survey Volume and density estimates
Our survey volume is defined by the survey area, the limiting magnitudes (), and a flux limit on the emission line detection. As in ROLES, we determine the redshift limit for which the galaxy would fall outside our magnitude limits, including the -correction term
| (13) |
The wavelength-dependent flux limit shown in Figure 6 was similarly used to determine the redshift limits over which each detected emission line would be observable. The volume, , from which a galaxy with a detected emission line could have been found was then calculated from the survey area (105.62 and 29.15 square arcminutes for our CDFS and FIRES pointings, respectively) and the redshift space bounded by the -magnitude and noise flux limits, and the wavelength limits of our spectra. The volume, , was determined for each galaxy by integrating the differential co-moving volume (see Hogg 1999) between the appropriate redshift limits. The maximum () is in the CDFS fields, and in FIRES.
The three structures are defined by the redshift limits given in § 4.3. Interpreting the redshift limits as cosmological, removing these regions reduces the volume of our field sample by per cent. For the MS1054 cluster and CDFS walls themselves, which are decoupled from the Hubble flow, most of the galaxies are likely located within a volume that is much smaller than this cosmological volume. We will assume their line-of-sight extent is 10 Mpc (i.e. assuming a Mpc virial radius, which is still probably conservatively large). This corresponds to a volume of Mpc-3 for the cluster, and Mpc-3 and Mpc-3 for the two CDFS walls.
4.6 ROLES and SDSS Stripe 82 data
We will compare our results with similarly-selected data, from ROLES (Gilbank et al., 2010b) at , and the local Universe from our Stripe82 analysis (Gilbank et al., 2011). Both of these samples are consistent with our present analysis in the choice of IMF, the empirical calibration of [OII] to SFR, and the removal of red, massive galaxies333In fact, the Stripe 82 analysis is based on H measurements of the SFR which, by construction, are consistent with the mass-dependent [O II]-SFR conversion. This avoids the incompleteness in [O II] noted by Gilbank et al. (2011) for high mass galaxies in Stripe 82..
The ROLES SFR are also limited by [O II] flux, and thus the mass-dependent SFR limit has the same form as shown in Figure 13. However, the greater luminosity distance and brighter sky at the wavelength of redshifted [O II] at means, despite the longer exposure times, that the limiting SFR at is about a factor greater than in the present study. In Gilbank et al. (2011), we demonstrated that, locally, the SFRD has converged for /yr, for galaxies with , and /yr for galaxies with . Globally, the average sSFR is known to evolve approximately as (e.g. Prescott et al., 2009). Assuming the shape of the SFRD does not evolve strongly, we would expect ROLES ( at ) to be complete at /yr, and the present study ( at ) to be complete at . Thus, we expect our samples are deep enough to have recovered most of the star formation in the Universe, and to be fairly insensitive to the precise choice of limiting SFR.
5 Results
5.1 Star formation rate density
The SFRD was computed as follows:
| (14) |
where the SFR was calculated according to Equations 11 and 12, and the sum is over all galaxies in a given bin of stellar mass. is the probability that the line is [OII], relative to the probability of it being any other plausible emission line; is a magnitude-dependent weight to account for incompleteness. Figure 14 shows the SFRD for our LDSS3 sample. Recall from Figure 10 that our completeness drops significantly for bright () galaxies, corresponding to .
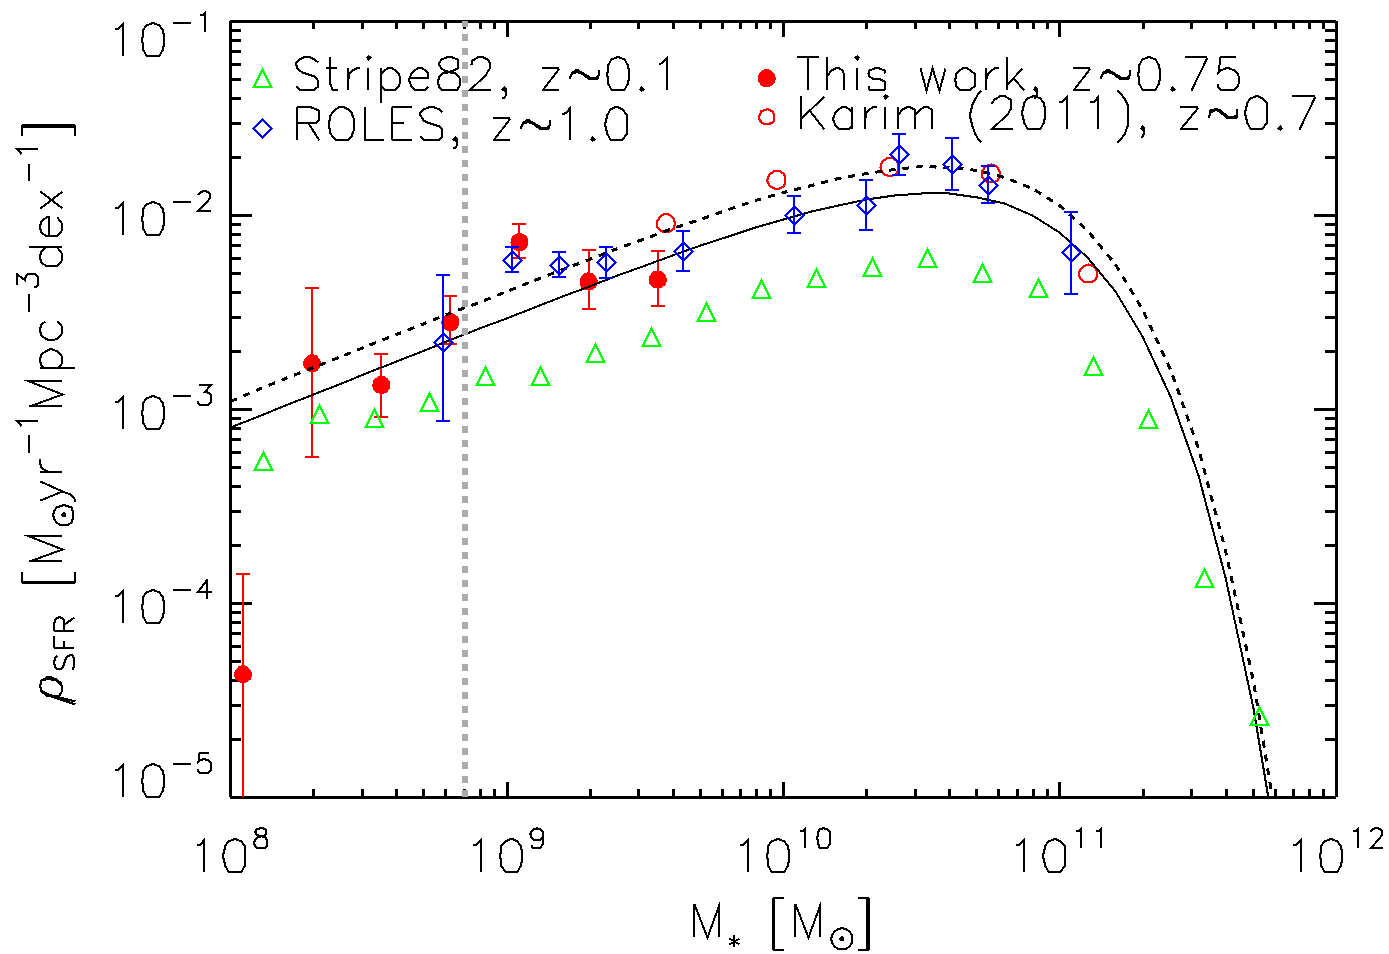
Moreover, this high mass end has no contribution from the FIRES field, and is therefore especially sensitive to cosmic variance (not included in the error bars) given the large scale structure in the CDFS field. Finally, no aperture corrections have been applied, which means SFRs are likely underestimated for the most massive galaxies. Thus we limit our data to , and replace the higher mass measurements with the data of Karim et al. (2011), who used stacked radio observations in the COSMOS field to measure SFR over a wider field than we have here. They note that there is a factor difference in normalization between [OII]–based SFR and their analysis. To eliminate this likely systematic offset, the Karim et al. (2011) SFRD should be reduced (or our [OII] data should be increased) by this factor. However, we show the data as measured, with no rescaling applied.
We compare this with results from ROLES (Gilbank et al., 2010b) at , and the local Universe from our Stripe82 analysis (Gilbank et al., 2011). Interestingly, the ROLES SFRD is consistent with our new data at , over most of the mass range, with some evidence for higher SFR at if the SFRD from Karim et al. (2011) are reduced by a factor as described above. Compared with the data from Stripe 82, the SFRD at both and is higher by a factor at all masses. Given the statistical and systematic uncertainties, though, we cannot rule out a continuous evolution of the form (e.g. Gilbank et al., 2010b), represented on Figure 14 as the solid and dashed lines at and , respectively.
Our findings are in good agreement with Karim et al. (2011) and Gilbank et al. (2010b), that there is no evidence here for strong evolution in the shape of the SFRD. We note that both ROLES and the present work hint at an increased contribution from the lowest-mass galaxies for which we are complete (), relative to the local Universe. However, any mass-dependent effect is fairly subtle, and it is unlikely that systematic uncertainties are understood to this level across the entire mass and redshift range. The data are not inconsistent with a simple, mass-independent evolution of over the redshift range , as suggested by Gilbank et al. (2010b).
5.2 Stellar mass function of star-forming galaxies
The galaxy stellar mass function for our sample of star-forming galaxies (SF-GSMF) is shown in Figure 15. In order to study its evolution, we compare our z0.75 data with the Stripe 82 SDSS data as detailed in § 4.6. The left panel only considers the present z0.75 data above a conservative SFR limit of 0.3 M⊙ yr-1 so as to compare directly with the depth of the slightly shallower z1 ROLES data. To compare fairly with the local data, the Stripe 82 sample is limited to M⊙ yr-1. Since the SFRD falls by a factor of 3 over this redshift interval (as discussed in § 5.1), this cut corresponds to a similarly evolving limit. For comparison, we also show the single Schechter function fit to the SDSS star-forming population at from Peng et al. (2010). Transforming to the Baldry & Glazebrook (2003) IMF, the parameters of this fit are and . The high-mass end of the SF-GSMF function () is not very well-determined in our present data, due to the limited survey area and spectroscopic sampling. At lower masses, where we expect our sample to be highly complete, the data are consistent with no evolution of the SF-GSMF from , in agreement with the conclusions of Gilbank et al. (2010b) and Peng et al. (2010).


In the right panel, the full depth of the present z0.75 dataset is considered, down to a SFR limit of 0.1M⊙ yr-1. The Stripe 82 data from the left panel is reproduced here, but we also show these data extended to a lower limiting SFR0.03M⊙ yr-1, allowing for a factor 3 in SFR evolution. We also compare with data from Pozzetti et al. (2010), shown without error bars, for clarity. This sample defined star–forming galaxies as those with , approximately consistent with the limits we apply to our data, here. Again we convert the result to correspond to a BG03 (Baldry & Glazebrook, 2003) IMF. The results are consistent with little or no evolution in the SF-GSMF over this redshift range. However, it also demonstrates the sensitivity of any measured evolution to the limiting SFR of the samples. If we account for the global evolution of SFR we find the SF-GSMF remains constant down to the lowest masses for which we have statistically complete samples. Choosing a fixed, non-evolving limit would result in a large decrease with increasing cosmic time of the SF-GSMF at the low mass end. The difference between the analysis of Peng et al. (2010), where SF galaxies are identified strictly by colour, and our Stripe82 analysis, shows that remaining systematic uncertainties of this type are at least as important as any physical evolution.

In Figure 16 we divide our sample into different environments: the MS1054 cluster in FIRES, the large-scale structure in CDFS, and the remaining population which we call the “field”. The cluster in FIRES has no public spectroscopy for , which means that field is incomplete for . Recall from § 4.5 that the normalizations of the FIRES cluster and CDFS structures are calculated assuming a comoving line-of-sight extent of Mpc. We also show the local mass function of star-forming galaxies, from Peng et al. (2010), renormalized to minimize the value of the dense and underdense samples over the range for which the data are complete. This shows that both high density environments are a factor times denser than the field sample. This depends on our assumption about the line-of-sight extent. A firm lower limit to the overdensity is a factor , obtained by assuming the cosmological volume between the redshift limits used to define each sample. We note that the shape of the single Schechter function, with and fixed to their local values, is a good fit to both the field and overdense samples. There is no evidence for it to vary with environment, and the reduced is near unity for both samples.
5.3 Specific star formation rate
The sSFR of galaxies in our sample is shown as a function of their stellar mass in Figure 17. The small filled circles represent the individual emission line galaxies. The large symbols represent the binned mean sSFR of the present, combined sample (solid red circles), compared with ROLES at (solid black circles), and local star-forming SDSS (blue diamonds) datasets.
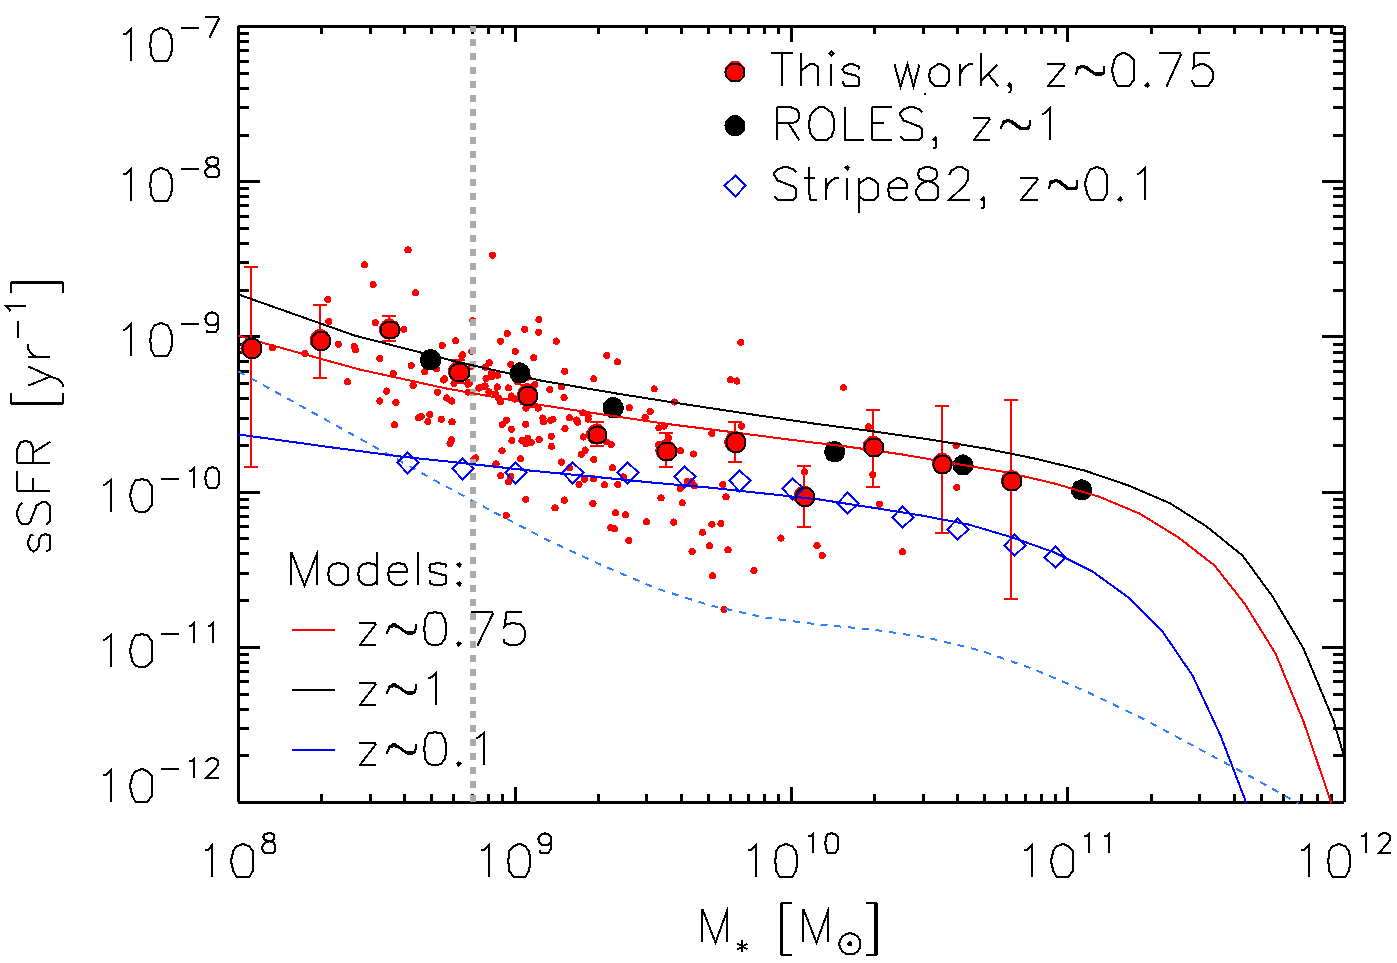
We find a distinct anti-correlation between and , with a power-law slope of over the mass range . This is similar to our finding at with ROLES, and steeper than the anti-correlation at which already poses a challenge to models (Bower et al., 2012; Weinmann et al., 2012). At all stellar masses, the sSFR at and is significantly larger than locally. Moreover, the relation significantly departs from a simple power-law, with an upturn observed at low stellar mass (see also Brinchmann et al., 2004; Elbaz et al., 2007; Popesso et al., 2011). To interpret this, we turn to the models used by Gilbank et al. (2011), based on the staged galaxy formation models of Noeske et al. (2007). These are shown as the smooth curves on Figure 17. In this model, galaxies are parametrised by an exponentially declining SFR, with formation redshift and SFR timescales both a function of stellar mass. This simple description provides a reasonable match to the observations at all three epochs shown, including the increase in sSFR observed at the lowest stellar masses in both the present data and ROLES.
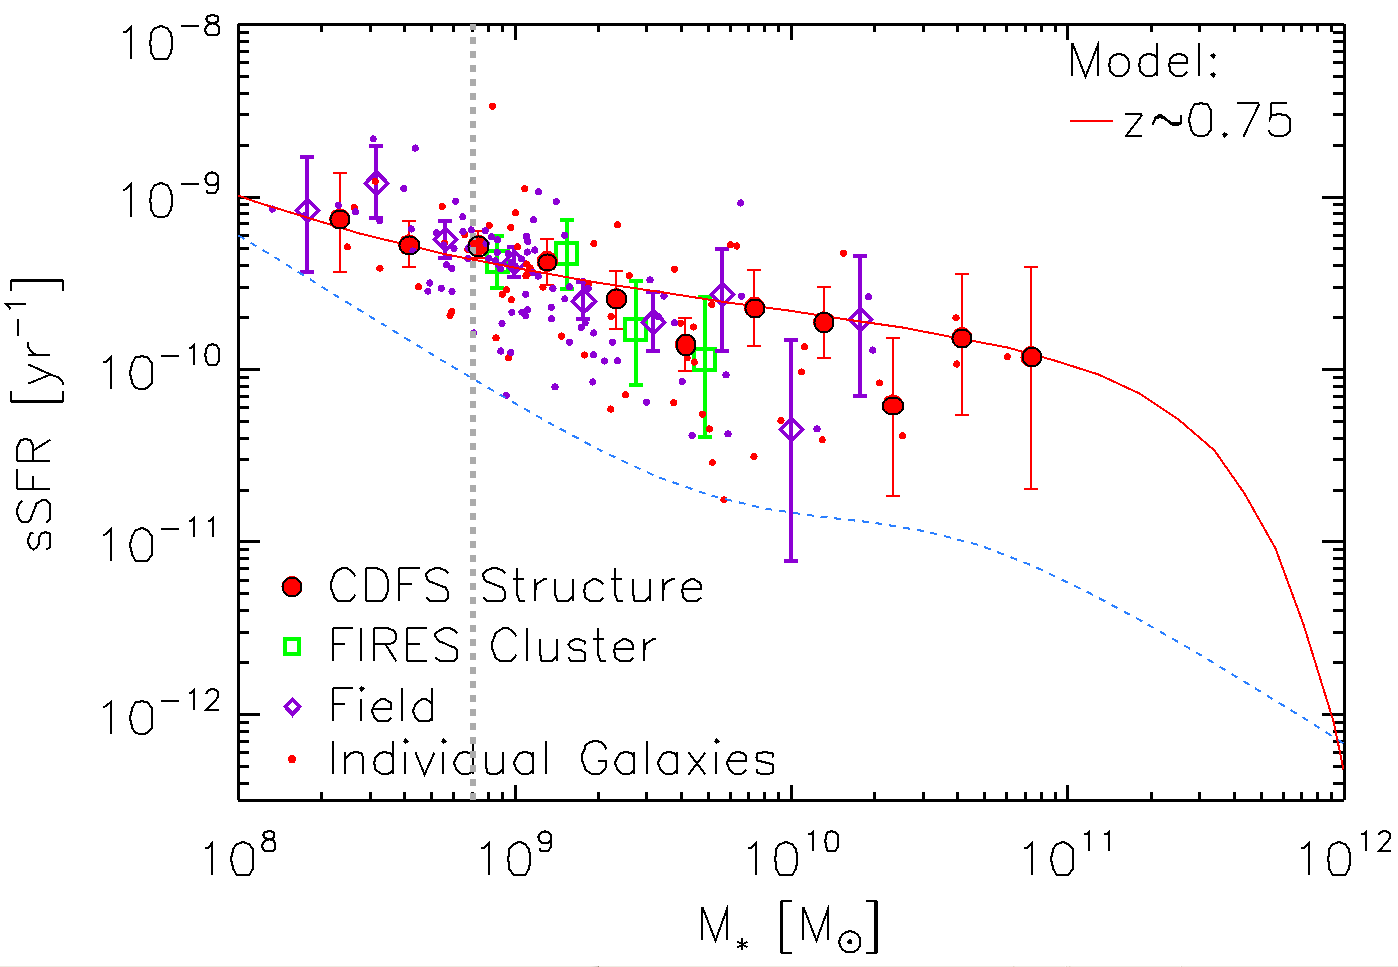
Finally, in Figure 18 we show the relation in different environments. Both high and typical density populations show a decreasing sSFR with increasing stellar mass. The shape and normalization of the relation in all environments are consistent with one another, and with the model of Gilbank et al. (2011), over the entire stellar mass range.
6 Discussion
It has consistently been shown that the main influence of environment is on the fraction of star-forming galaxies of a given stellar mass (e.g. Baldry et al., 2006; Wijesinghe et al., 2012). Amongst the star-forming population itself, any residual environment dependence is weak at best (e.g. Peng et al., 2010). However, a transformation from active to passive cannot be instantaneous and must therefore be reflected in an environmental dependence of the sSFR distribution. Results here are more controversial and depend on how the analysis was done. At low redshifts, , dense environments consistently show either no change in the sSFR relation (e.g. Peng et al., 2010) or a mildly reduced sSFR (e.g. Vulcani et al., 2010). At and above, there is some evidence that sSFR is higher amongst star forming galaxies in some dense environments, but not all (Sobral et al., 2011). While we will not resolve this issue here, our data extends the discussion to low-mass galaxies at an intermediate redshift of .
In Figure 19 we re-create the density segregated, plot from Li et al. (2011, their Figure 6). In this plot we show the density-dependent relation for each of the (SDSS), (present study) and (ROLES) epochs. The SDSS and ROLES samples were segregated according to a local density parameter, , which is defined in detail444Briefly, indicates the redshift-completeness weighted number density of star-forming galaxies limited to , found within a ‘nearest-neighbour’ volume defined by the five closest galaxies to the current galaxy being evaluated. The volume is defined by the maximum projected radius of the set of five nearest-neighbour galaxies, and the difference in co-moving distances set by the closest and farthest nearest-neighbour galaxies in redshift space. in Li et al. (2011). In the Figure, we show only the relations for the average environment, and the most overdense subsample, for best comparison with the present data.

For the ROLES sample at , Li et al. (2011) find the local density ranges from 0.04 Mpc3 to 0.6 Mpc-3, with an average of Mpc3. Thus their overdense regions are a factor denser than the average. We estimated the volume density of our subsamples in § 4.3; assuming a Mpc line-of-sight extent for our high density structures this is Mpc-3, compared with the field value of Mpc-3. While these numbers cannot be compared directly with , they are not too dissimilar in practice. The small fields mean that the nearest-neighbour approach taken by Li et al. (2011) is almost exclusively identifying structure in redshift space, as we do here. The main difference is that Li et al. use massive galaxies as tracers, while we use low-mass emission line galaxies. While the physical scales over which the density is estimated will not be identical, we may expect that the relative density between structures and the field can be fairly compared between the two analyses, to within a factor of a few. Thus, the high-density environments of the present study, overdense by a factor , are likely to be significantly denser than those of Li et al. (2011). In fact, is probably an underestimate, as at least the MS1054 virial diameter is likely much less than Mpc.
Considering first the average, “field” environments, Figure 19 shows smooth evolution of the relation from to , with little or no significant change in slope, but a normalization that increases approximately as . In contrast, the low-mass end slope of the relation in high-density environments shows mild evolution. It is flatter than the average relation locally, and steeper than the average relation at . Interestingly, our new data at an intermediate redshift shows no difference at all between the two environments. Since our survey includes environments with much higher densities, the actual evolution between and of comparably dense environments could be considerably stronger than shown here. Note that the analysis of Li et al. (2011) includes an underdense environment, for which the contrast with their densest environments is considerably larger.
The implication is that the sensitivity of low-mass, star forming galaxies to their environment has evolved significantly from to the present day. Today, the average sSFR of such galaxies is slightly lower in high-density environments, while at the average is slightly higher. This “reversal” of the SFR-environment relation has been noted by others (e.g. Elbaz et al., 2007; Li et al., 2011), and our new data at appear to correspond to the “transition” epoch where the sSFR–mass relation shows no environmental dependence.
7 Conclusions
For the first time, the faint [OII] emission from low stellar mass galaxies ( has been spectroscopically measured for galaxies in the redshift range . By targetting fields (CDFS and FIRES) with known overdensities, including the massive MS1054-03 cluster, we explore how star formation in these low-mass galaxies are affected by their environment. Our main conclusions are as follows:
-
•
There is little, if any evolution in the galaxy stellar mass function of [OII] luminous galaxies between and .
-
•
The trend of a decreasing specific star formation rate with increasing stellar mass has been confirmed down to unprecedented stellar masses. The normalization at is similar to our earlier results at , and significantly higher than at .
-
•
The average power-lase of the sSFR relation is , with indication of a steeper relation at low masses. This is consistent with what we found at with ROLES.
-
•
The star formation rate density shows little evolution between and , but is consistent with the evolution expected from comparison with the SDSS. The SFRD evolution is consistent with a mass-independent evolution in normalization; that is, the characteristic mass of star–forming galaxies is independent of redshift. However we caution that systematic and statistical uncertainties preclude us from establishing the SFRD to better than a factor of at any mass; thus there is room for relatively small, mass-dependent evolution.
-
•
Environment is found not to influence the relationship at any stellar mass at the epoch studied here, . This suggests that the SFR of star-forming galaxies is not enhanced or diminished by local density, and that the apparent reversal in correlation between environment and star formation rate occurs at higher redshift.
Our results on the constancy of the SF-GSMF are consistent with many previous works (e.g. Pozzetti et al., 2010; Gilbank et al., 2011), extending the results to lower masses at this intermediate redshift. In Li et al. (2011) we showed the emergence of a weak environmental dependence of the sSFR–mass relation on environment, such that the lowest mass galaxies in the densest environments show a significant excess sSFR compared to their lower density counterparts. In this work, we show the absence of this trend 1 Gyr later. By the present day, another Gyr later, the relation has reversed, and low-mass galaxies in dense environments have lower sSFR than the average. This smooth transition is consistent with e.g. Quadri et al. (2012), who pointed out that it would be strange to see a sharp transition given factors such as the apparently smooth growth of passive galaxies over cosmic time. We note, however, that this environmental-dependence of the star–forming population is very mild, and much weaker than the aforementioned evolution in the fraction of galaxies with no star formation whatsoever.
Acknowledgments
We thank an anonymous referee for very helpful comments that improved the paper. The ROLES collaboration would like to thank S. Crawford, T. Dahlen, H. Dominguez, M. Franx, S. Juneau, C. Maier, B. Mobasher, L. Pozzetti, E. Vanzella, and S. Wuyts for providing data and useful correspondence throughout the project. MLB acknowledges support from an NSERC Discovery Grant, and an Early Researcher Award from the Province of Ontario.
References
- Baldry et al. (2006) Baldry, I. K., Balogh, M. L., Bower, R. G., Glazebrook, K., et al. 2006, MNRAS, 373, 469
- Baldry & Glazebrook (2003) Baldry, I. K., & Glazebrook, K. 2003, ApJ, 593, 258
- Baldry et al. (2004) Baldry, I. K., Glazebrook, K., Brinkmann, J., Ivezić, Z., Lupton, R. H., Nichol, R. C., & Szalay, A. S. 2004, ApJ, 600, 681
- Balogh et al. (2004) Balogh, M. L., Baldry, I. K., Nichol, R. C., Miller, C., Bower, R. G., & Glazebrook, K. 2004, ApJL, 615, L101
- Bell et al. (2007) Bell, E. F., et al. 2007, ApJ, 663, 834
- Bohlin & Lindler (1992) Bohlin, R., & Lindler, D. 1992, Space Telescope Science Institute Newsletter, 9, 19
- Bolzonella et al. (2010) Bolzonella, M., Kovac, K., Pozzetti, L., Zucca, E., et al. 2010, A&A, 524
- Bower et al. (2012) Bower, R. G., Benson, A. J., & Crain, R. A. 2012, MNRAS, 422, 2816
- Brinchmann et al. (2004) Brinchmann, J., Charlot, S., White, S. D. M., Tremonti, C., Kauffmann, G., Heckman, T., & Brinkmann, J. 2004, MNRAS, 351, 1151
- Bundy et al. (2006) Bundy, K., Ellis, R. S., Conselice, C. J., Taylor, J. E., Cooper, M. C., et al. 2006, ApJ, 651, 120
- Cooper et al. (2008) Cooper, M. C., et al. 2008, MNRAS, 383, 1058
- Cooper et al. (2010) —. 2010, MNRAS, 409, 337
- Cowie et al. (1996) Cowie, L. L., Songaila, A., Hu, E. M., & Cohen, J. G. 1996, AJ, 112, 839
- Crawford et al. (2011) Crawford, S. M., Wirth, G. D., Bershady, M. A., & Hon, K. 2011, arXiv Astrophysics e-print
- Cucciati et al. (2010) Cucciati, O., et al. 2010, A&A, 524, A2+
- Davies et al. (2009) Davies, G. T., Gilbank, D. G., Glazebrook, K., Bower, R. G., et al. 2009, MNRAS Letters, 395, 76
- Elbaz et al. (2007) Elbaz, D., Daddi, E., Le Borgne, D., et al. 2007, A&A, 468, 33
- Fioc & Rocca-Volmerange (1997) Fioc, M., & Rocca-Volmerange, B. 1997, A&A, 326, 950
- Förster Schreiber et al. (2006) Förster Schreiber, N. M., et al. 2006, AJ, 131, 1891
- George et al. (2011) George, M. R., et al. 2011, ApJ, 742, 125
- Gerke et al. (2007) Gerke, B., et al. 2007, MNRAS, 376, 1425
- Gilbank et al. (2010a) Gilbank, D. G., Baldry, I. K., Balogh, M. L., Glazebrook, K., & Bower, R. G. 2010a, MNRAS, 405, 2594
- Gilbank et al. (2010b) Gilbank, D. G., et al. 2010b, MNRAS, 405, 2419
- Gilbank et al. (2011) —. 2011, MNRAS, 414, 304
- Gilli et al. (2003) Gilli, R., Cimatti, A., Daddi, E., Hasinger, G., Rosati, P., et al. 2003, ApJ, 592, 721
- Glazebrook & Bland-Hawthorn (2001) Glazebrook, K., & Bland-Hawthorn, J. 2001, PASP, 113, 197
- Glazebrook et al. (2004) Glazebrook, K., et al. 2004, Nature, 430, 181
- Grützbauch et al. (2011) Grützbauch, R., Conselice, C. J., Varela, J., Bundy, K., Cooper, M. C., Skibba, R., & Willmer, C. N. A. 2011, MNRAS, 411, 929
- Hogg (1999) Hogg, D. 1999, arXiv Astrophysics e-print
- Ideue et al. (2009) Ideue, Y., et al. 2009, ApJ, 700, 971
- Karim et al. (2011) Karim, A., et al. 2011, ApJ, 730, 61
- Kennicutt (1998) Kennicutt, R. C. 1998, Annual Review of Astronomy and Astrophysics, 36, 189
- Le Fèvre et al. (2004) Le Fèvre, O., Vettolani, G., Paltani, S., Tresse, L., et al. 2004, A&A, 428, 1043
- Li et al. (2011) Li, I. H., et al. 2011, MNRAS, 411, 1869
- McGee et al. (2011) McGee, S. L., Balogh, M. L., Wilman, D. J., Bower, R. G., Mulchaey, J. S., Parker, L. C., & Oemler, A. 2011, MNRAS, 413, 996
- Mobasher et al. (2009) Mobasher, B., et al. 2009, ApJ, 690, 1074
- Muldrew et al. (2012) Muldrew, S. I., et al. 2012, MNRAS, 419, 2670
- Muzzin et al. (2012) Muzzin, A., et al. 2012, ApJ, 746, 188
- Noeske et al. (2007) Noeske, K. G., et al. 2007, ApJL, 660, L47
- Patel et al. (2011) Patel, S. G., Kelson, D. D., Holden, B. P., Franx, M., & Illingworth, G. D. 2011, ApJ, 735, 53
- Peng et al. (2010) Peng, Y., Lilly, S. J., Kovac, K., Bolzonella, M., Pozzetti, L., et al. 2010, ApJ, 721, 193
- Popesso et al. (2011) Popesso, P., Rodighiero, G., Saintonge, A., et al. 2011, A&A, 532, 145
- Pozzetti et al. (2010) Pozzetti, L., et al. 2010, A&A, 523, A13
- Prescott et al. (2009) Prescott, M., Baldry, I. K., & James, P. A. 2009, MNRAS, 397, 90
- Quadri et al. (2012) Quadri, R. F., Williams, R. J., Franx, M., & Hildebrandt, H. 2012, ApJ, 744, 88
- Ravikumar et al. (2007) Ravikumar, C. D., et al. 2007, A&A, 465, 1099
- Salpeter (1955) Salpeter, E. E. 1955, ApJ, 121, 161
- Sobral et al. (2011) Sobral, D., Best, P., Smail, I., Geach, J., Cirasuolo, M., Garn, T., & Dalton, G. B. 2011, MNRAS, 411, 675
- Strateva et al. (2001) Strateva, I., Ivezić, Ž., et al. 2001, AJ, 122, 1861
- van Dokkum et al. (2000) van Dokkum, P. G., Franx, M., Fabricant, D., Illingworth, G. D., & Kelson, D. D. 2000, ApJ, 541, 95
- Vanzella et al. (2005) Vanzella, E., Cristiani, S., Dickinson, M., Kuntschner, H., et al. 2005, A&A, 434, 53
- Vanzella et al. (2008) Vanzella, E., et al. 2008, A&A, 478, 83
- Vulcani et al. (2010) Vulcani, B., Poggianti, B. M., Finn, R. A., Rudnick, G., Desai, V., & Bamford, S. 2010, ApJL, 710, L1
- Weinmann et al. (2012) Weinmann, S. M., Pasquali, A., Oppenheimer, B. D., Finlator, K., Mendel, J. T., Crain, R. A., & Maccio, A. V. 2012, eprint arXiv:1204.4184
- Wijesinghe et al. (2012) Wijesinghe, D. B., et al. 2012, ArXiv e-prints
- Wolf et al. (2009) Wolf, C., et al. 2009, MNRAS, 393, 1302
- Wuyts et al. (2008) Wuyts, S., Labbé, I., Förster Schreiber, N. M., Franx, M., Rudnick, G., Brammer, G. B., & van Dokkum, P. G. 2008, ApJ, 682, 985