Dispersal of molecular clouds by ionising radiation
Abstract
The role of feedback from massive stars is believed to be a key element in the evolution of molecular clouds. We use high-resolution 3D SPH simulations to explore the dynamical effects of a single O7 star emitting ionising photons at and located at the centre of a molecular cloud with mass and radius ; we also perform comparison simulations in which the ionising star is removed. The initial internal structure of the cloud is characterised by its fractal dimension, which we vary between and , and the roughly constant standard deviation, , of its log-normal density PDF. (i) As regards star formation, in the short term ionising feedback is positive, in the sense that star formation occurs much more quickly (than in the control simulations), in gas that is compressed by the high pressure of the ionised gas. However, in the long term ionising feedback is negative, in the sense that most of the cloud is dispersed with an outflow rate of up to , on a timescale comparable with the sound-crossing time for the ionised gas (), and triggered star formation is therefore limited to a few percent of the cloud’s mass. We will describe in greater detail the statistics of the triggered star formation in a companion paper. (ii) As regards the morphology of the ionisation fronts (IFs) bounding the Hii region and the systematics of outflowing gas, we distinguish two regimes. For low , the initial cloud is dominated by large-scale structures, so the neutral gas tends to be swept up into a few extended coherent shells, and the ionised gas blows out through a few large holes between these shells; we term these Hii regions shell-dominated. Conversely, for high , the initial cloud is dominated by small-scale structures, and these are quickly overrun by the advancing IF, thereby producing neutral pillars protruding into the Hii region, whilst the ionised gas blows out through a large number of small holes between the pillars; we term these Hii regions pillar-dominated. (iii) As regards the injection of bulk kinetic energy, by , the expansion of the Hii has delivered a mass-weighted root-mean-square velocity of ; this represents less than of the total energy radiated by the O7 star.
keywords:
Galaxies: ISM - ISM: nebulae - Hii regions - bubbles - Hydrodynamics - Stars: formation1 Introduction
Infrared shells and bubbles (Churchwell et al., 2006; Churchwell, 2008) are ubiquitous in the Galaxy and are often associated with Hii regions, i.e. localised regions in which the Lyman continuum radiation () from one or more young, massive stars ionises the gas and heats it to . Because the neutral gas outside the Hii region is much colder (), the Hii region is overpressured, and expands, sweeping up the neutral gas. Molecular clouds typically have a complicated clumpy structure, and so the ionising photons can penetrate to different distances in different directions, causing highly irregular ionisation fronts (e.g. Hegmann & Kegel, 2003). Consequently, large-scale Hii regions have complex shapes and diverse morphologies. Sometimes they appear as bright-rimmed clouds (Urquhart et al., 2009) or perfectly round shells (Deharveng et al., 2009, 2010), other times they are dominated by pillar-like structures (Sugitani et al., 2002; Smith et al., 2010; Preibisch et al., 2011), or a mixture of all three features (Koenig et al., 2008). These diverse morphologies must encode important clues as to how a massive star interacts with the surrounding interstellar medium (ISM).
Feedback from young, massive stars plays a critical role in the evolution of molecular clouds, and of the galaxies in which they reside. The input of radiative and mechanical energy due to ionising radiation and stellar winds from massive stars is most influential during the early evolution of a molecular cloud, before the first supernova explodes after . In particular, the expansion of Hii regions may have a positive effect and trigger new star formation (Elmegreen, 1998; Elmegreen et al., 2002; Whitworth & Francis, 2002; Elmegreen, 2011), but it may also have a negative effect by efficiently dispersing the surrounding cloud (Whitworth, 1979; Tenorio-Tagle, 1979; Bodenheimer et al., 1979; Williams & McKee, 1997; Franco et al., 1990; Matzner, 2002), thereby terminating star formation, and possibly also unbinding the newly-formed cluster of stars (Dale et al., 2005). Ionising feedback may also play a key role in regulating the star formation efficiency on galactic scales (McKee, 1989; Vázquez-Semadeni et al., 2010); and Hii regions and bubbles excavated by ionisation may be the first step towards launching large scale winds and outflows from galactic disks (Tenorio-Tagle et al., 2003; Hopkins et al., 2012).
Many numerical studies concerned with positive feedback, i.e. the triggering of star formation, have been performed in recent years: on individual molecular cloud cores (Bisbas et al., 2011; Haworth & Harries, 2012); in the context of bright rims and pillars (Elmegreen et al., 1995; Miao et al., 2006; Gritschneder et al., 2009, 2010; Ercolano & Gritschneder, 2011; Mackey & Lim, 2011), on parsec-scale molecular clouds (Mellema et al., 2006; Krumholz et al., 2007; Arthur et al., 2011; Walch et al., 2011); and on whole star clusters (Dale & Bonnell, 2011). Observationally, it is very difficult to distinguish triggered from spontaneous (untriggered) star formation, even though many authors have tried to identify age gradients in the young stars surrounding Hii regions (Preibisch & Zinnecker, 2007), and to establish evidence for the Collect & Collapse scenario in swept-up shells (Zavagno et al., 2006; Deharveng et al., 2008; Zavagno et al., 2010).
The negative effect of ionising feedback, i.e. its role is dispersing molecular clouds, has been evaluated analytically by Whitworth (1979). Matzner (2002) has considered cloud destruction by all stellar feedback mechanisms and concludes that ionising feedback will destroy normal giant molecular clouds in less than a crossing time. The effect of ionsation feedback has been explored numericlly by Dale et al. (2005). Based on simulations by Bonnell & Bate (2002), they model the impact of ionising feedback in turbulent, star-cluster-forming clouds, and find that photoionisation is able to unbind star clusters by efficiently removing gas quite early on during their evolution. They note that the mean gas density of the affected cloud is the critical parameter. Krumholz et al. (2006) study the disruptive power of Hii regions using semi-analytical models, and conclude that lower mass clouds () may be destroyed in . In more massive clouds disruption by ionisation plays a less important role (Krumholz & Matzner, 2009; Murray et al., 2010; Fall et al., 2010). These conclusions have recently been confirmed in 3D SPH simulations by Dale et al. (2012), who study star-cluster forming clouds with ; their lower mass clouds are comparable with the ones we investigate in the current study. They find that massive clouds resist dispersal by ionising feedback, because it is quenched by accretion flows. Quenching of feedback by strong accretion is also important in the early stages of Hii region formation, i.e. in the ultra-compact stage (Mac Low et al., 2007; Peters et al., 2010, 2011). Moreover, the location of a massive star is important for the dispersal efficiency. This has first been noted by Mazurek (1980) and Yorke et al. (1989), and recently confirmed by Gendelev & Krumholz (2012), who perform three-dimensional radiation-magneto-hydrodynamic simulations of blister-type Hii regions. They note that the recoil provided by escaping gas may also play a role in destroying the parental molecular cloud.
Feedback also drives turbulent motions in molecular clouds. Matzner (2002) argues that Hii regions are the main drivers of molecular cloud turbulence, being energetically dominant over the combined effects of stellar winds and supernovae. Mellema et al. (2006) record that the level of molecular cloud turbulence is maintained at in their simulations of ionising feedback, but they also note that radial velocities account for a significant fraction of the total kinetic energy. Gritschneder et al. (2009) discuss turbulence driving in their simulations of ionising feedback, and report that the energetic ratio of solenoidal to compressible modes (Federrath et al., 2008) is significantly reduced, relative to the fiducial ratio of 2:1.
In this paper we simulate the development of large-scale Hii regions in molecular clouds having different initial fractal dimension . In contrast with Dale et al. (2005) our molecular clouds all have the same mass, radius and density PDF. We demonstrate that the full range of morphological features observed in Hii regions might be attributable to the fractal dimension, , of the parental molecular cloud. As is increased from small values , there is a shift from Hii regions bounded by relatively smooth extended shell-like IFs, with ionised gas blowing out through large holes between these shells, to Hii regions bounded by much more irregular IFs with numerous pillars protruding into the Hii region, and ionised gas blowing out through many small holes. The kinetic energy injected into the ISM is essentially independent of , and the time taken to disperse the cloud is short ( for to for ).
The plan of the paper is the following. In section 2 we describe the generation of fractal molecular clouds and the numerical method, including the treatment of the ionising radiation. In section 3 we analyse the large-scale structure of the Hii regions obtained with different fractal dimensions, and in section 4 we analyse the structure of the corresponding IFs and the associated outflow rates. In section 5 we evaluate the injection of kinetic energy into the ISM. In section 6 we summarise our main conclusions.
2 Initial conditions and numerical method
2.1 Generation of fractal molecular clouds with an FFT algorithm
It is well known that molecular clouds are rich in internal structure, which may derive from pure turbulence (e.g. Klessen, 2001; Padoan & Nordlund, 2002), or from gravitational amplification of noise in the density field (Bonnell & Bate, 2002) or from initial turbulence leading to density fluctuations which are subsequently enhanced by gravity (Heitsch et al., 2009; Ballesteros-Paredes et al., 2011; Ballesteros-Paredes et al., 2011; Walch et al., 2010; Walch et al., 2012; Girichidis et al., 2011, 2012). It is unclear which of these processes is dominant in shaping molecular clouds. However, what we do know is that on scales from the typical prestellar core size of , up to (Bergin & Tafalla, 2007), molecular clouds subscribe to a statistically self-similar fractal structure (Stutzki et al., 1998; Elmegreen & Falgarone, 1996; Falgarone et al., 1991).
Apart from their applicability, we adopt fractal initial conditions for their practicality. Fractals with mass-size relations similar to those observed (Larson, 1981) are easily created in Fourier space (Elmegreen, 2002; Shadmehri & Elmegreen, 2011), whilst at the same time retaining the freedom to choose the fractal dimension, , arbitrarily. In contrast, when starting with a periodic box of driven or decaying turbulence (see e.g. Arthur et al., 2011, for particularly nice simulations of this type), is a consequence of the physics implemented, and cannot easily be adjusted.
Stutzki et al. (1998) have shown that a three-dimensional density field in which the power spectrum of the density fluctuations has index (i.e. ) has box-coverage fractal dimension
| (1) |
(see also Federrath et al., 2009). Thus, defining is equivalent to defining the power spectral index , and vice versa. Low corresponds to high , i.e. a density field dominated by a small number of extended density structures; conversely, high corresponds to low , i.e. a density field dominated by a large number of compact density structures.
CO line surveys are well suited to determining the structures of molecular clouds like the ones we simulate here, because this transition is a dominant coolant at number densities . Values of the fractal dimension estimated in this way are typically (Elmegreen & Falgarone, 1996). For example, observations of molecular clouds in the Milky Way typically yield (Falgarone et al., 1991; Vogelaar & Wakker, 1994; Stutzki et al., 1998; Lee, 2004; Sánchez et al., 2005), corresponding to . For Ophiuchus, Perseus, and Orion, Sánchez et al. (2007) obtain a slightly higher value, (), and Miville-Deschênes et al. (2010) derive () from Herschel-SPIRE observations of the Polaris Flare. Sánchez et al. (2007) and Schneider et al. (2011) report differences between low-mass star forming regions and massive, giant molecular clouds, based on the variance method applied to maps (Ossenkopf et al., 2008), where is the visual extinction. In M33, Sánchez et al. (2010) find on scales , and higher values of on larger spatial scales.
Here, the initial three-dimensional fractal density field is constructed in a periodic box, using an FFT-based algorithm (Shadmehri & Elmegreen, 2011). The algorithm has three main input parameters: (i) the power spectral index, , (ii) the random seed used to generate different realisations; and (iii) the density scaling constant (see Eqn. 2 below). We populate the integer modes along each Cartesian axis , where corresponds to the linear size of the box (). After generating the spectrum of density fluctuations in Fourier space, and transforming them to obtain in real space, this field is scaled according to
| (2) |
The resulting density field, , has a log-normal density PDF and a clump mass distribution in agreement with observations (as described in Shadmehri & Elmegreen, 2011). For a given spectrum of density fluctuations, changing changes the standard deviation, , of the log-normal density PDF, whilst leaving the underlying topology of the density field unchanged: small produces a very wide density PDF (large ), and conversely large produces a very narrow density PDF (small ). Before creating the initial SPH particle distribution, we shift the point of maximum density to the centre of the computational domain and cut out a sphere of diameter centred on this point. Finally, the box is partitioned with a grid, which is then populated with SPH particles, by placing the appropriate number of particles randomly within each grid cell. We have checked the fidelity of this procedure by performing a back transformation and recovering the correct power spectrum.
2.2 Numerical method
We use the SPH code Seren (Hubber et al., 2011), which is well-tested and has already been applied to many problems in star formation (e.g. Walch et al., 2011; Bisbas et al., 2011; Stamatellos et al., 2011). We employ the standard SPH implementation (Monaghan, 1992). The SPH equations of motion are solved with a second-order leapfrog integrator, in conjunction with an hierarchical, block time-stepping scheme. Gravitational forces are calculated using an octal spatial decomposition tree (Barnes & Hut, 1986), with monopole and quadrupole terms and a Gadget-style opening-angle criterion (Springel et al., 2001). We use the standard artificial viscosity prescription (Monaghan & Gingold, 1983), moderated with a Balsara switch (Balsara, 1995). Ionising radiation is treated with an HEALPix-based adaptive ray-splitting algorithm, which allows for optimal resolution of the ionisation front in high resolution simulations (see Bisbas et al., 2009). We assume the On-The-Spot approximation and do not treat the diffusive radiation field.
The temperature of ionised gas particles is set to . The temperature of neutral gas is given by a barotropic equation of state,
| (3) |
where , , and . The choice of influences the gravitational stability of the neutral gas swept up by the expanding Hii region. If the shell were able to cool to lower temperature, it would fragment more readily than currently seen in our simulations. For this reason we will explore a more realistic cooling function in a future paper. With the above prescriptions for the temperature, and assuming solar elemental composition, the isothermal sound speed is in ionised gas, and in neutral gas at low density ().
Although we are not concerned with triggered star formation in this paper, we introduce sinks at density peaks above , provided that the density peak in question is at the bottom of its local gravitational potential well (see Hubber et al., 2012, in preparation). Since , a condensation that is converted into a sink is always well into its Kelvin-Helmholtz contraction phase. Once formed, a sink is able to accrete gas smoothly from its surroundings and thereby grow in mass.
| ID | ||||
|---|---|---|---|---|
| 2.0 | 1.29 | 0.39 | 0.51, 0.77 | |
| 2.2 | 1.17 | 0.39 | 0.48, 0.65 | |
| 2.4 | 1.02 | 0.38 | 0.44, 0.59 | |
| 2.6 | 0.98 | 0.38 | 0.49, 0.77 | |
| 2.8 | 0.93 | 0.37 | 0.62, 0.89 | |
| 2.0 | 1.29 | 0.39 | 0.98, 0.99 | |
| 2.2 | 1.17 | 0.39 | 0.94, 0.99 | |
| 2.4 | 1.02 | 0.38 | ||
| 2.6 | 0.98 | 0.38 | ||
| 2.8 | 0.93 | 0.37 |
2.3 Initial conditions
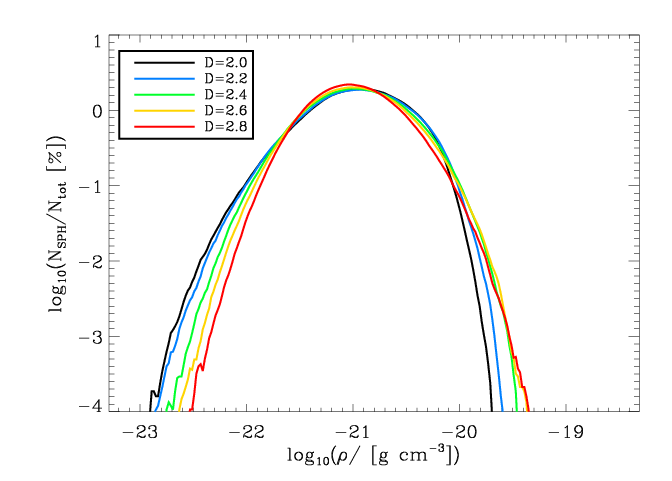
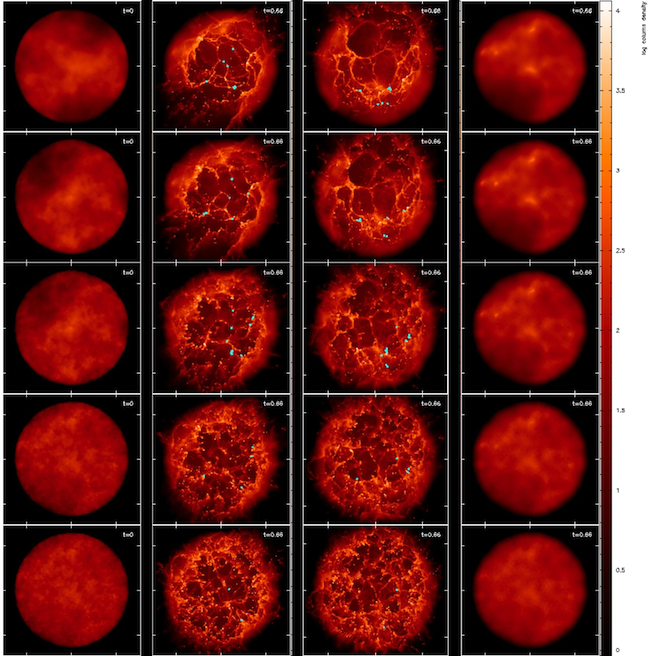
We consider a single cloud mass, , and a single cloud radius, , so the volume-weighted mean density of the cloud is , the escape velocity from the surface of the cloud is , and the mean freefall time is . Every cloud is modelled with a total number of SPH particles, resulting in a mass resolution of (Bate & Burkert, 1997).The only parameter we vary is the initial fractal dimension, . For each value of , we generate a single realisation, using the same random seed, , so that the density fields in the five different clouds have the same underlying topology. We also adjust so that the (approximately log-normal) density PDFs of the five clouds have roughly the same standard deviation (see Fig.1 for the initial mass-weighted density PDFs). We then simulate the evolution of each cloud twice, once with a single O7 star at the centre of the cloud, emitting ionising photons at , and once with no ionising star. Table 1 lists the ID of each simulation, the fractal dimension, the mass-weighted mean density, , the standard deviation of the logarithmic density PDF, , and the times, and , at which the first and fifteenth sinks are created (a measure of how rapidly star formation occurs). We note that is inevitably larger (up to a factor of 2) than . In the lefthand column of Fig. 2 we show initial column-density images of all five clouds, as seen projected on the (x,y)-plane. We note that as is increased, the scale of the dominant features in these images becomes smaller. In addition to these ten simulations involving lumpy clouds, we perform a control simulation with a uniform-density cloud of the same mass and radius: this has the ID ‘control’.
3 General evolution
3.1 Morphology
The morphology of the evolving Hii region is strongly dependent on the fractal dimension of the initial molecular cloud. In the two central columns of Fig. 2 we show column-density images of the five clouds as projected on the (x,y)- and (x,z)-planes, at time . By this time there has been considerable interaction between the Hii region and the molecular gas, and in all cases star formation has been triggered (turquoise dots mark sink particles); we will analyse the triggering of star formation in a companion paper (Walch et al., in prep.).
Although the simulated Hii regions have highly chaotic structures (which could be explored further by invoking different random seeds, ), there are also discernable statistical trends with changing . For low , the dominant density structures in the initial cloud have large coherence lengths, and consequently the Hii regions tend to be bounded by extended, relatively smooth shells, and their external appearance can be strongly dependent on viewing angle. Between the shells are large holes, through which the ionised gas can escape into the ISM. We term these Hii regions shell-dominated. Conversely, for large , the dominant density structures in the initial cloud have relatively short coherence lengths, and consequently the Hii regions tend to have a much more irregular boundary, with many neutral pillars protruding into the ionised gas. There are many small holes through which the ionised gas escapes. We term these Hii regions pillar-dominated. The transition between shell-dominated and pillar-dominated Hii regions occurs at , which is the average fractal dimension of many observed molecular clouds (see section 2.1).
In the righthand column of Fig. 2 we show, for comparison, column-density images projected on the (x,y)-plane for the simulations performed without an ionising star. Under this circumstance the evolution proceeds on a free-fall timescale, , so that after there has been much less change to the density field.
We conclude that the main requirement for the formation of pillars is the existence of small-scale structure in the density field into which the IF advances. As increases, and therefore decreases, there is more small-scale structure and more pillars are formed. Since, for turbulent gas with a fixed ratio of solenoidal to compressive modes, small-scale structure should become more abundant with increasing Mach Number, this conclusion agrees with the findings of Gritschneder et al. (2010). They have performed simulations of the ionisation of a slab of turbulent interstellar gas, and invoke different Mach numbers (where the Mach Number is measured relative to the sound speed in the neutral gas). They conclude (i) that the most favourable regime for the formation of pillar-like structures is Mach 4 to 10, and (ii) that the typical size of a pillar is set by the scale of the largest turbulent perturbation.
3.2 Radius of the Hii region
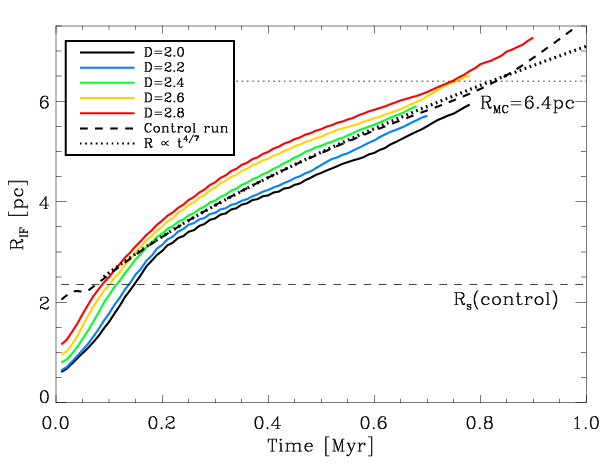
The mean radius of the ionisation front, (see Fig. 3), is an observational quantity which is easily obtained (Churchwell et al., 2006), and frequently used in statistical studies (e.g. in studies of triggered star formation by Thompson et al., 2011). Fig. 3 shows the evolution of obtained with different . is estimated by averaging the radii of all SPH particles having temperature between and (see Bisbas et al., 2009).
Given a uniform-density ambient medium, as in the control simulation, the IF advances to the Strømgren radius,
| (4) |
in a few recombination times,
| (5) |
Here is the mass of an hydrogen atom, is the Case B recombination coefficient (i.e. invoking the On-The-Spot Approximation, and therefore neglecting recombinations straight into the ground state), and is the fraction by mass of hydrogen. For the control simulation we derive . Thereafter the IF quickly switches to D-type, and the radius is given approximately by (Shu, 1991)
| (6) |
This solution is very well reproduced in the control simulation, until the IF reaches the edge of the cloud (see dashed and dotted lines on Fig. 3).
For the fractal clouds, is initially smaller than , because the O7 star is placed at the densest point in the initial density field. However, as the IF advances away from this point, the density falls below , so that expands faster than and catches up with the uniform-density solution after . Thereafter tracks the uniform-density solution quite closely () for all . For fractal clouds, there are two competing effects: (i) is reduced because the volume-weighted mean square density, , is higher than for the uniform density in the control simulation, and therefore the ionising photons should get used up balancing recombination in a smaller volume; (ii) is increased because the IF can break out of the cloud more readily, through paths of low emission measure. Effect (i) appears to dominate for low , making smaller; and effect (ii) appears to dominate for high , making larger.
4 Structural analysis of shells
From Fig. 2, it is evident that, over and above stochastic variations, there is a systematic progression in the structural properties of the Hii regions with increasing . In this section, we analyse the shell structures more quantitatively, and compute outflow rates of hot and cold gas, in order to derive cloud destruction timescales.
4.1 Shell structure
Fig. 4 shows Hammer projections of the column-density, as seen from the ionising star, at . If we adopt spherical polar coordinates, (), centred on the ionising star, then the false colour on the Hammer projection represents the column-density, , as seen in each direction, , from the ionising star,
| (7) |
For low , the Hammer projection is dominated by a small number of extended column-density features, which correspond to the extended convex shell-like segments of the ionisation front seen in the top rows of Fig. 2; because there is only a small number of extended features these Hii regions can look quite different to different external observers (compare the middle images on the top two rows of 2). Conversely, for high , the Hammer projection is dominated by a larger number of more compact column-density features, corresponding to small concave bright-rimmed clouds and pillars, as seen in the bottom rows of Fig. 2; because there is a large number of compact features, these Hii regions look rather similar to different external observers (compare the middle images on the bottom two rows of Fig. 2).
The white contours on Fig. 2 demark the separatrices between directions in which the Hii region is ionisation-bounded (i.e. rays along which the ionising photons run out before reaching the edge of the cloud), and directions in which the Hii region is density-bounded (i.e. rays along which there is still ionising radiation left at the edge of the computational domain). Table 2 gives the fraction of the sky, seen from the ionising star, that is ionisation bounded,
| (8) |
for , at times . The large-scale holes that dominate the low cases form relatively quickly after the ionising star switches on, as their formation is based on the pre-existence of coherent regions of low density which are too extended to be filled in significantly by the erosive flows at their boundaries. However, because the net length of these boundaries is relatively short, the net rate at which the remaining neutral gas is eroded is slow. Consequently starts small but decreases slowly in these cases. In contrast, the small-scale holes that dominate the high cases are initially choked because they are small and therefore the erosive flows at their boundaries are much more effective at inhibiting the escape of ionising radiation. However, because the net length of these boundaries is relatively large, the net rate of erosion is high. Consequently starts high, but decreases rapidly in these cases.
4.2 Outflow rates
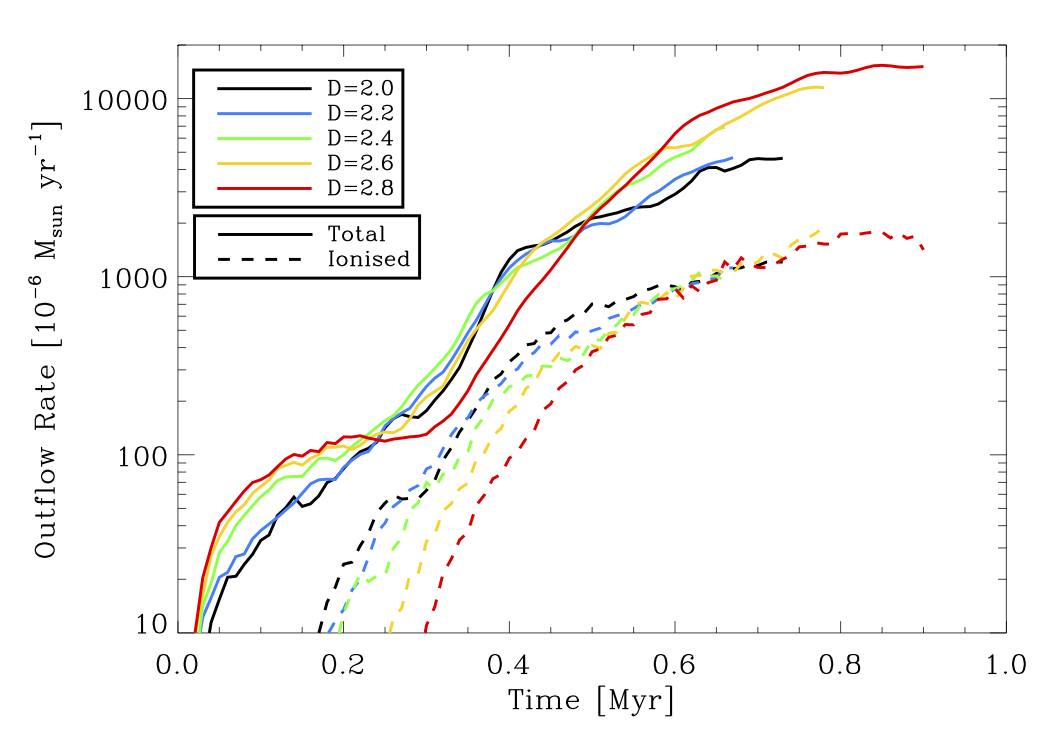
Fig. 6 shows the total rate at which mass flows out through the initial boundary of the cloud (at radius ), as well as the rate for the ionised gas only, both as functions of time. By , the total rate is , and of this is ionised gas. The dependence of on is rather weak.
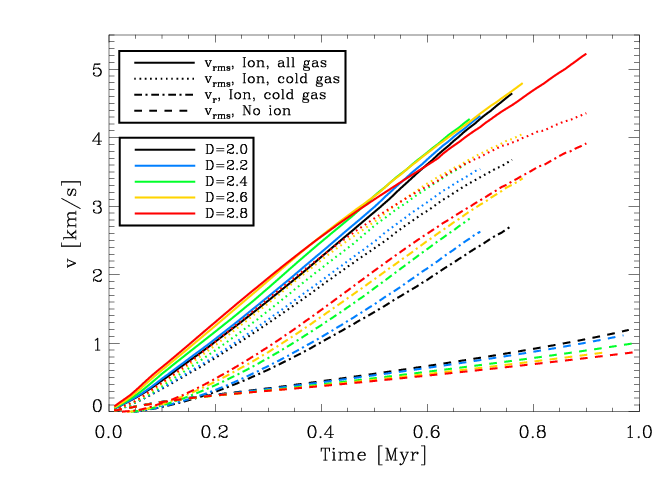
Fig. 7a shows the root-mean-square velocity for all the gas and for the neutral gas only, plus the mean radial velocity of the neutral gas, all as functions of time, , for the runs with an ionising star at the centre. By , the radial velocity of the neutral gas is approaching the escape speed from the cloud surface, and the ionised gas is travelling outwards even faster. We conclude that the cloud will be dispersed by , (where the longer time corresponds to lower ). Fig. 7a also shows the root-mean-square velocity for all the gas when there is no ionising source. In this case the velocities are generated by self-gravitational acceleration, and are much smaller. Therefore we can affirm that it is the action of the ionising star that dominates the cloud dynamics.


5 Turbulence driving & density evolution
5.1 Driving turbulence
The injection of bulk kinetic energy by expanding Hii regions may make a significant contribution to the driving of turbulence in molecular clouds. Gritschneder et al. (2009) have shown that ionising radiation is effective in driving turbulence in the surrounding ISM; in particular they find that the fraction of turbulent energy contained in compressional modes is enhanced relative to the equipartition value of . The simulations presented here admit an even more unequivocal opportunity to evaluate the role of ionising radiation in driving turbulence, since there are no initial turbulent velocities, and therefore we do not need to take account of dissipation. The total kinetic energy must be attributed to ionising feedback or to self-gravity. By performing comparison simulations with no ionising source, we can estimate accurately the contribution from ionising feedback.
From Fig. 7a we see that, to a good approximation, the root mean square velocity increases linearly with time, both with (full curves) and without (dashed curves) ionising feedback. However, the rate without ionising feedback, , is much smaller than the rate with ionising feedback, . The corresponding rates of injection of kinetic energy, expressed per hydrogen nucleus, are without ionising feedback, and with ionising feedback; for comparison, the heating rate due to ionisation is – where we have normalised the density to the mean value in the initial cloud.
Fig. 7a also shows the root mean square velocity (dotted curves) and the radial velocity (dash-dot curves) for the neutral gas only, in the case where there is ionising feedback. We see that even the neutral gas acquires a large amount of bulk kinetic energy; and that a large part of this is invested in ordered expansion. The radial velocity is approaching at the end of the simulation, which is comparable to the bubble expansion velocity found in IC 1396, a shell-like HII region with a comparable radius (Patel et al., 1995). However, even if we discount the part invested in ordered expansion, the remaining random kinetic energy (”turbulence”) is injected into the neutral gas at a greater rate by ionising feedback (), than by gravity when there is no ionising feedback. Moreover, after the mean radial velocity of the neutral gas is approaching the escape velocity from the initial surface of the cloud (), and therefore the cloud is being effectively dispersed.
We note that some of the kinetic energy invested in ordered expansion could be transformed into turbulent energy when the expanding shell interacts with the surrounding interstellar medium. For instance, in their three-dimensional radiation-hydrodynamics simulations, studying the ionisation of turbulent clouds without self-gravity, Mellema et al. (2006) derive root-mean square velocities for the cold gas. In particular, they find that, after the initial yr, the difference between the one-dimensional rms velocity of the cold gas and the average expansion velocity of the cold gas is roughly constant at . Thus, the pre-existing turbulence of seems to be maintained and enhanced by the ionising feedback. Therefore, the amount of energy, which is found to be transformed into random motions is comparable to our simulations.
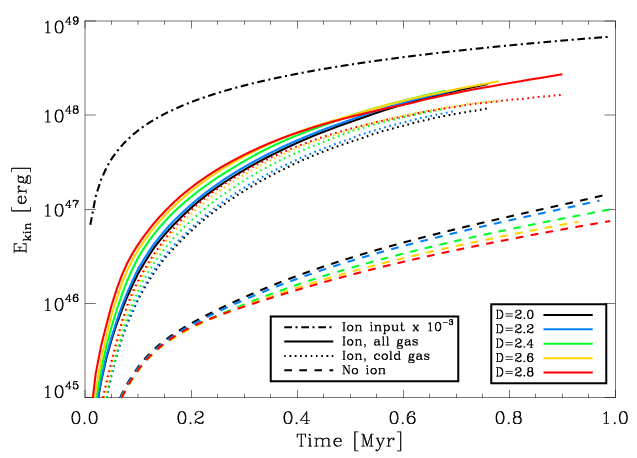
Fig. 7b shows the evolution of the bulk kinetic energy, both with (full curves) and without (dashed curves) ionising feedback; also plotted is the net energy input in the form of ionising radiation (dotted curve, scaled down by ). By , the total radiative energy injected by the ionising source is . A part of the injected energy is transformed into kinetic energy . In the run without ionisation, only gravitational potential energy may be transformed into kinetic energy. We find that this results in . Thus ionising feedback is much more effective than gravity at generating bulk kinetic energy, at least on this timescale (), but still very inefficient (). Similar results have been found by Dale et al. (2005), who model somewhat smaller, less massive clouds, having comparable mean densities; they do not place an ionising source at the center, but instead evolve a molecular cloud with turbulent initial conditions to form a massive star self-consistently. In radiation-magneto-hydrodynamic simulations Gendelev & Krumholz (2012) have recently shown that the inclusion of a magnetic field may enhance the input of kinetic energy to the surrounding clouds, especially if the ionising star forms at the edge of a molecular cloud and generates a blister-type Hii region. However, the energy only increases by a factor of in this case, so the efficiency is still .
 |
 |
5.2 Timescales for spontaneous star formation
Since no star formation occurs in the comparison simulations during the first , we can infer that, up to this point, all star formation in the simulations with ionising feedback is triggered. To understand this result, consider the free-fall time in gas with density ,
| (9) | |||||
and the sound crossing time for a cloud of neutral gas with radius ,
| (10) | |||||
| (11) |
Spontaneous (i.e. untriggered) star formation cannot occur before , unless there are coherent lumps of gas with and . The first condition requires lumps with density , and the second condition requires coherent lumps with radius . From inspection of the density PDFs in Fig. 1, it is clear that there is very little gas at such high densities, and what there is is unlikely to be in sufficiently large coherent lumps.
| without ionisation | with ionisation |
 |
 |
| without ionisation | with ionisation |
 |
 |


|
5.3 Density evolution
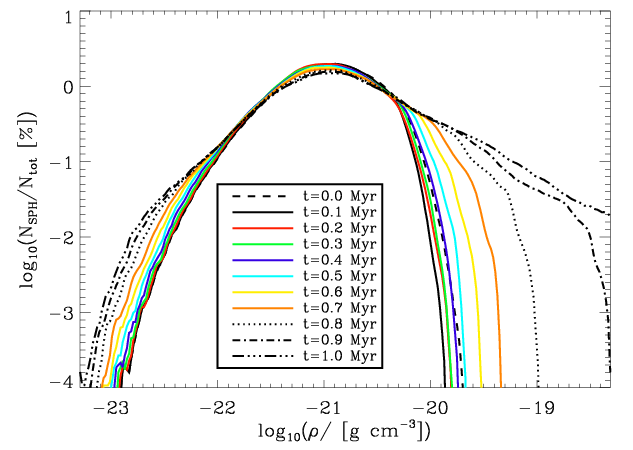
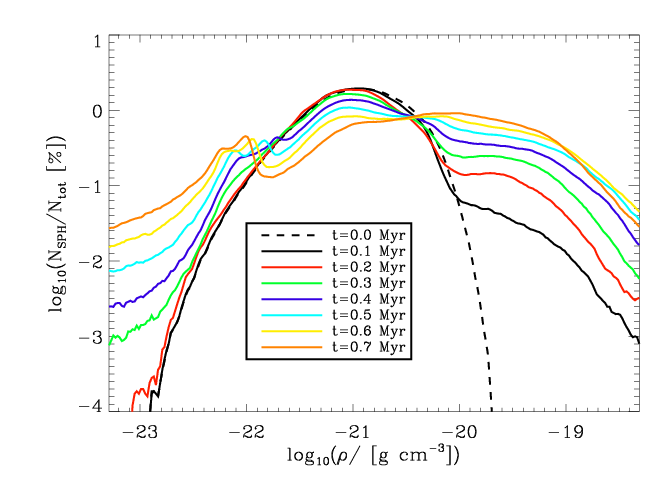
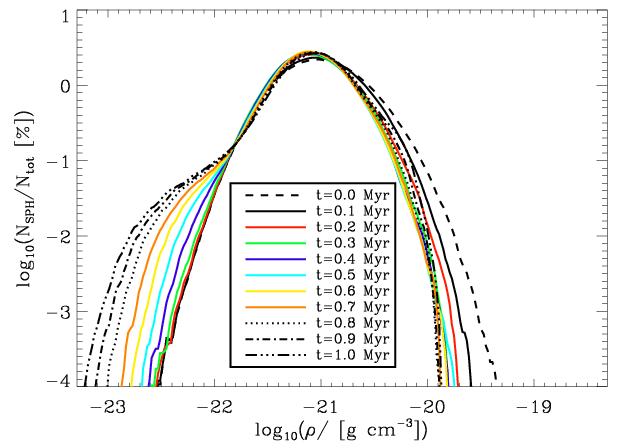
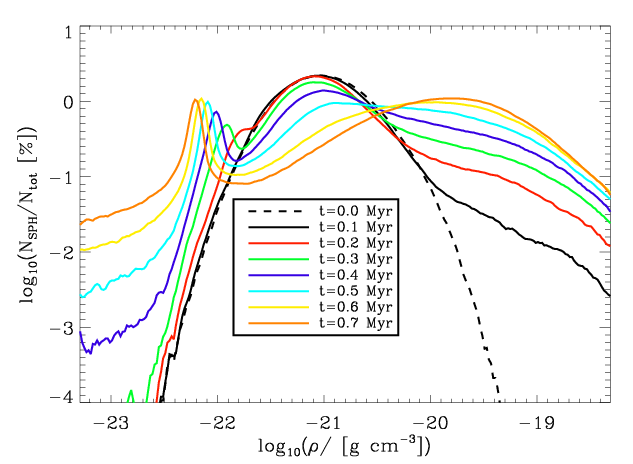
Density PDFs can be used to characterise the structure of molecular clouds (e.g. Padoan & Nordlund, 2002). Fig.8 demonstrates the influence of ionising feedback on the density PDFs of the molecular clouds with and .
Without ionising feedback the evolution is very moderate, and simply involves a gradual broadening of the PDF, until the time approaches . At this juncture a high-density tail suddenly develops, for , signalling the onset of collapse and spontaneous star formation. This is in good agreement with recent observational (Kainulainen et al., 2009, 2011; Lombardi et al., 2010) and theoretical (Kritsuk et al., 2011; Girichidis et al., 2012) findings.
With ionising feedback, the evolution of the density PDF is much more rapid and distinctive. A narrow low-density peak develops at densities , representing an expansion wave driven by hot ionised gas escaping into the surrounding ISM. At the same time a much broader high-density peak forms at densities , corresponding to neutral gas compressed by the overpressure of the Hii region; this neutral gas is the material for triggered star formation.
5.4 Mass evolution
Fig. 9 shows the total mass in very low-density gas, , and in very high-density gas, , as a function of time, for . Here very low density means the escaping ionised gas in the expansion wave with , and very high density means gas which is sufficiently dense to couple thermally to the dust, , since this gas is very likely to condense into new stars.
Without ionising feedback, the mass in low-density gas increases with time as the density substructure relaxes, especially for clouds with high . After , approaches for all . is negligible in all runs until , when, for low , it increases rapidly, signalling the onset of spontaneous star formation.
With ionising feedback rises even more rapidly than without ionising feedback, as gas is blown out into the surrounding ISM, and the cloud is dispersed. By Myr, has already reached , and by , has passed . At the same time, increases rapidly up to , and then saturates at , for all . is the mass that is available to form stars during the next ; note that it does not include the mass that is already in sinks.
Thus, although ionising feedback triggers star formation, it also disperses the cloud on a comparable timescale. Consequently, triggered star formation only accounts for a few percent of the cloud’s mass. Any other star formation must occur spontaneously, promptly after the ionising star switches on.
6 Conclusions
We have used high-resolution 3D SPH simulations to explore the effect of a single O7 star emitting photons at and located at the centre of a molecular cloud with mass and radius . We focus on the shell structure and the dynamical impact of the ionising radiation on the surrounding molecular cloud as a function of its fractal dimension, . We find that, although the shell morphology is strongly dependent on , global parameters like the total outflow rate, the mass in high and low density gas, the injected kinetic energy, and the average bubble radius are in general almost independent of .
Concerning the structures of the evolving Hii regions, there is a morphological transition as is increased from low to high values. Clouds with low are dominated by extended density structures. Consequently, when the ionising star switches on they develop (i) large holes, through which ionised gas escapes into interstellar space, and (ii) between the holes, extended, rather smooth, shell-like structures where the ionisation front is bound by high density gas. We call these clouds shell-dominated. Conversely, clouds with high are dominated by compact density structures. Consequently, when the ionising star switches on, they develop (i) a rather uniform network of small holes through which the ionised gas can escape into the surrounding interstellar medium, and (ii) between these small holes there are numerous pillar-like structures protruding into the Hii region. Therefore, we call these clouds pillar-dominated. The transition between shell-dominated and pillar-dominated Hii regions occurs for clouds with fractal dimension , which is close to the mean observed fractal dimension in Galactic molecular clouds. The Hii region forming in a cloud with nicely resembles observed Hii regions (Walch et al., 2011). We note that the presence of pillars is a sign of there having been small scale density structures in the parental molecular cloud; these might, for example, have been generated by turbulence.
We discuss the influence of ionising feedback on the kinetic energy budget, and on the density structure of the clouds. Overall, the conversion of the energy of ionising radiation into kinetic energy is extremely inefficient, . However, on the short timescale before the cloud is dispersed, with , ionising feedback is much more effective at injecting kinetic energy than self-gravity; in comparison, for simulations without ionising feedback, the amount of kinetic energy injected after is 40 times smaller. The kinetic energy injected by ionising feedback should not be termed turbulent, since much of it is invested in the ordered expansion that disperses the cloud.
Thus, ionising feedback is very effective at triggering star formation, in the sense of accelerating the rate of star formation, but it also terminates star formation by blowing the cloud apart, on a timescale . Consequently, triggered star formation is rather short-lived, and only converts a few percent of the cloud’s mass into stars, thus limiting the total star formation efficiency of a molecular cloud. Any other young stars formed in the cloud must therefore have been formed before or promptly after the ionising feedback switched on.
Acknowledgments
We thank Dr. Thorsten Naab for valuable discussion of the manuscript. SW acknowledges support by the Marie Curie RTN CONSTELLATION and the DFG Priority Programme No. 1573. The simulations have been performed on the Cardiff Arcca Cluster. APW gratefully acknowledges the support of a rolling grant from STFC. The work of TGB was funded by STFC grant STH0017941. RW acknowledges support from the Czech Science Foundation grant 209121795. DAH is funded by a Leverhulme Trust Research Project Grant (F/00 118/BJ).
References
- Arthur et al. (2011) Arthur S. J., Henney W. J., Mellema G., de Colle F., Vázquez-Semadeni E., 2011, MNRAS, 414, 1747
- Ballesteros-Paredes et al. (2011) Ballesteros-Paredes J., Hartmann L. W., Vázquez-Semadeni E., Heitsch F., Zamora-Avilés M. A., 2011, MNRAS, 411, 65
- Ballesteros-Paredes et al. (2011) Ballesteros-Paredes J., Vázquez-Semadeni E., Gazol A., Hartmann L. W., Heitsch F., Colín P., 2011, MNRAS, 416, 1436
- Balsara (1995) Balsara D. S., 1995, Journal of Computational Physics, 121, 357
- Barnes & Hut (1986) Barnes J., Hut P., 1986, Nature, 324, 446
- Bate & Burkert (1997) Bate M. R., Burkert A., 1997, MNRAS, 288, 1060
- Bergin & Tafalla (2007) Bergin E. A., Tafalla M., 2007, ARAA, 45, 339
- Bisbas et al. (2009) Bisbas T. G., Wünsch R., Whitworth A. P., Hubber D. A., 2009, A&A, 497, 649
- Bisbas et al. (2011) Bisbas T. G., Wünsch R., Whitworth A. P., Hubber D. A., Walch S., 2011, ApJ, 736, 142
- Bodenheimer et al. (1979) Bodenheimer P., Tenorio-Tagle G., Yorke H. W., 1979, ApJ, 233, 85
- Bonnell & Bate (2002) Bonnell I. A., Bate M. R., 2002, MNRAS, 336, 659
- Churchwell (2008) Churchwell E., 2008, in de Koter A., Smith L. J., Waters L. B. F. M., eds, Mass Loss from Stars and the Evolution of Stellar Clusters Vol. 388 of Astronomical Society of the Pacific Conference Series, Bubbles, Bubbles Everywhere Bubbles. p. 309
- Churchwell et al. (2006) Churchwell E., Povich M. S., Allen D., Taylor M. G., Meade M. R., Babler B. L., Indebetouw R., Watson C. e. a., 2006, ApJ, 649, 759
- Dale & Bonnell (2011) Dale J. E., Bonnell I., 2011, MNRAS, 414, 321
- Dale et al. (2005) Dale J. E., Bonnell I. A., Clarke C. J., Bate M. R., 2005, MNRAS, 358, 291
- Dale et al. (2012) Dale J. E., Ercolano B., Bonnell I. A., 2012, ArXiv e-prints
- Deharveng et al. (2008) Deharveng L., Lefloch B., Kurtz S., Nadeau D., Pomarès M., Caplan J., Zavagno A., 2008, A&A, 482, 585
- Deharveng et al. (2010) Deharveng L., Schuller F., Anderson L. D., Zavagno A., Wyrowski F., Menten K. M., Bronfman L., Testi L., Walmsley C. M., Wienen M., 2010, A&A, 523, A6
- Deharveng et al. (2009) Deharveng L., Zavagno A., Schuller F., Caplan J., Pomarès M., De Breuck C., 2009, A&A, 496, 177
- Elmegreen (1998) Elmegreen B. G., 1998, in Woodward C. E., Shull J. M., Thronson Jr. H. A., eds, Origins Vol. 148 of Astronomical Society of the Pacific Conference Series, Observations and Theory of Dynamical Triggers for Star Formation. p. 150
- Elmegreen (2002) Elmegreen B. G., 2002, ApJ, 564, 773
- Elmegreen (2011) Elmegreen B. G., 2011, in C. Charbonnel & T. Montmerle ed., EAS Publications Series Vol. 51 of EAS Publications Series, Triggered Star Formation. pp 45–58
- Elmegreen & Falgarone (1996) Elmegreen B. G., Falgarone E., 1996, ApJ, 471, 816
- Elmegreen et al. (1995) Elmegreen B. G., Kimura T., Tosa M., 1995, ApJ, 451, 675
- Elmegreen et al. (2002) Elmegreen B. G., Palouš J., Ehlerová S., 2002, MNRAS, 334, 693
- Ercolano & Gritschneder (2011) Ercolano B., Gritschneder M., 2011, MNRAS, 413, 401
- Falgarone et al. (1991) Falgarone E., Phillips T. G., Walker C. K., 1991, ApJ, 378, 186
- Fall et al. (2010) Fall S. M., Krumholz M. R., Matzner C. D., 2010, ApJLetters, 710, L142
- Federrath et al. (2008) Federrath C., Klessen R. S., Schmidt W., 2008, ApJLetters, 688, L79
- Federrath et al. (2009) Federrath C., Klessen R. S., Schmidt W., 2009, ApJ, 692, 364
- Franco et al. (1990) Franco J., Tenorio-Tagle G., Bodenheimer P., 1990, ApJ, 349, 126
- Gendelev & Krumholz (2012) Gendelev L., Krumholz M. R., 2012, ApJ, 745, 158
- Girichidis et al. (2011) Girichidis P., Federrath C., Banerjee R., Klessen R. S., 2011, MNRAS, 413, 2741
- Girichidis et al. (2012) Girichidis P., Federrath C., Banerjee R., Klessen R. S., 2012, MNRAS, 420, 613
- Gritschneder et al. (2010) Gritschneder M., Burkert A., Naab T., Walch S., 2010, ApJ, 723, 971
- Gritschneder et al. (2009) Gritschneder M., Naab T., Walch S., Burkert A., Heitsch F., 2009, ApJLetters, 694, L26
- Haworth & Harries (2012) Haworth T. J., Harries T. J., 2012, MNRAS, 420, 562
- Hegmann & Kegel (2003) Hegmann M., Kegel W. H., 2003, MNRAS, 342, 453
- Heitsch et al. (2009) Heitsch F., Ballesteros-Paredes J., Hartmann L., 2009, ApJ, 704, 1735
- Hopkins et al. (2012) Hopkins P. F., Quataert E., Murray N., 2012, MNRAS, 421, 3522
- Hubber et al. (2011) Hubber D. A., Batty C. P., McLeod A., Whitworth A. P., 2011, A&A, 529, A27+
- Hubber et al. (2012) Hubber D. A., Walch S. K., Whitworth A. P., 2012, MNRAS, p. submitted to MNRAS
- Kainulainen et al. (2011) Kainulainen J., Beuther H., Banerjee R., Federrath C., Henning T., 2011, A&A, 530, A64
- Kainulainen et al. (2009) Kainulainen J., Beuther H., Henning T., Plume R., 2009, A&A, 508, L35
- Klessen (2001) Klessen R. S., 2001, ApJ, 556, 837
- Koenig et al. (2008) Koenig X. P., Allen L. E., Gutermuth R. A., Hora J. L., Brunt C. M., Muzerolle J., 2008, ApJ, 688, 1142
- Kritsuk et al. (2011) Kritsuk A. G., Norman M. L., Wagner R., 2011, ApJLetters, 727, L20
- Krumholz & Matzner (2009) Krumholz M. R., Matzner C. D., 2009, ApJ, 703, 1352
- Krumholz et al. (2006) Krumholz M. R., Matzner C. D., McKee C. F., 2006, ApJ, 653, 361
- Krumholz et al. (2007) Krumholz M. R., Stone J. M., Gardiner T. A., 2007, ApJ, 671, 518
- Larson (1981) Larson R. B., 1981, MNRAS, 194, 809
- Lee (2004) Lee Y., 2004, Journal of Korean Astronomical Society, 37, 137
- Lombardi et al. (2010) Lombardi M., Lada C. J., Alves J., 2010, A&A, 512, A67
- Mac Low et al. (2007) Mac Low M.-M., Toraskar J., Oishi J. S., Abel T., 2007, ApJ, 668, 980
- Mackey & Lim (2011) Mackey J., Lim A. J., 2011, MNRAS, 412, 2079
- Matzner (2002) Matzner C. D., 2002, ApJ, 566, 302
- Mazurek (1980) Mazurek T. J., 1980, A&A, 90, 65
- McKee (1989) McKee C. F., 1989, ApJ, 345, 782
- Mellema et al. (2006) Mellema G., Arthur S. J., Henney W. J., Iliev I. T., Shapiro P. R., 2006, ApJ, 647, 397
- Miao et al. (2006) Miao J., White G. J., Nelson R., Thompson M., Morgan L., 2006, MNRAS, 369, 143
- Miville-Deschênes et al. (2010) Miville-Deschênes M.-A., Martin P. G., Abergel A., Bernard J.-P., Boulanger F., Lagache G., Anderson L. D., André P. e. a., 2010, A&A, 518, L104
- Monaghan (1992) Monaghan J. J., 1992, ARAA, 30, 543
- Monaghan & Gingold (1983) Monaghan J. J., Gingold R. A., 1983, Journal of Computational Physics, 52, 374
- Murray et al. (2010) Murray N., Quataert E., Thompson T. A., 2010, ApJ, 709, 191
- Ossenkopf et al. (2008) Ossenkopf V., Krips M., Stutzki J., 2008, A&A, 485, 917
- Padoan & Nordlund (2002) Padoan P., Nordlund Å., 2002, ApJ, 576, 870
- Patel et al. (1995) Patel N. A., Goldsmith P. F., Snell R. L., Hezel T., Xie T., 1995, ApJ, 447, 721
- Peters et al. (2011) Peters T., Banerjee R., Klessen R. S., Mac Low M.-M., 2011, ApJ, 729, 72
- Peters et al. (2010) Peters T., Mac Low M.-M., Banerjee R., Klessen R. S., Dullemond C. P., 2010, ApJ, 719, 831
- Preibisch et al. (2011) Preibisch T., Schuller F., Ohlendorf H., Pekruhl S., Menten K. M., Zinnecker H., 2011, A&A, 525, A92
- Preibisch & Zinnecker (2007) Preibisch T., Zinnecker H., 2007, in Elmegreen B. G., Palous J., eds, IAU Symposium Vol. 237 of IAU Symposium, Sequentially triggered star formation in OB associations. pp 270–277
- Sánchez et al. (2010) Sánchez N., Añez N., Alfaro E. J., Crone Odekon M., 2010, ApJ, 720, 541
- Sánchez et al. (2005) Sánchez N., Alfaro E. J., Pérez E., 2005, ApJ, 625, 849
- Sánchez et al. (2007) Sánchez N., Alfaro E. J., Pérez E., 2007, ApJ, 656, 222
- Schneider et al. (2011) Schneider N., Bontemps S., Simon R., Ossenkopf V., Federrath C., Klessen R. S., Motte F., André P., Stutzki J., Brunt C., 2011, A&A, 529, A1
- Shadmehri & Elmegreen (2011) Shadmehri M., Elmegreen B. G., 2011, MNRAS, 410, 788
- Shu (1991) Shu F., 1991, Physics of Astrophysics, Vol. II: Gas Dynamics. University Science Books
- Smith et al. (2010) Smith N., Povich M. S., Whitney B. A., Churchwell E., Babler B. L., Meade M. R., Bally J., Gehrz R. D., Robitaille T. P., Stassun K. G., 2010, MNRAS, 406, 952
- Springel et al. (2001) Springel V., Yoshida N., White S. D. M., 2001, New Astronomy, 6, 79
- Stamatellos et al. (2011) Stamatellos D., Whitworth A. P., Hubber D. A., 2011, ApJ, 730, 32
- Stutzki et al. (1998) Stutzki J., Bensch F., Heithausen A., Ossenkopf V., Zielinsky M., 1998, A&A, 336, 697
- Sugitani et al. (2002) Sugitani K., Tamura M., Nakajima Y., Nagashima C., Nagayama T., Nakaya H., Pickles A. J., Nagata T., Sato S., Fukuda N., Ogura K., 2002, ApJLetters, 565, L25
- Tenorio-Tagle (1979) Tenorio-Tagle G., 1979, A&A, 71, 59
- Tenorio-Tagle et al. (2003) Tenorio-Tagle G., Silich S., Muñoz-Tuñón C., 2003, ApJ, 597, 279
- Thompson et al. (2011) Thompson M. A., Urquhart J. S., Moore T. J. T., Morgan L. K., 2011, ArXiv e-prints
- Urquhart et al. (2009) Urquhart J. S., Morgan L. K., Thompson M. A., 2009, A&A, 497, 789
- Vázquez-Semadeni et al. (2010) Vázquez-Semadeni E., Colín P., Gómez G. C., Ballesteros-Paredes J., Watson A. W., 2010, ApJ, 715, 1302
- Vogelaar & Wakker (1994) Vogelaar M. G. R., Wakker B. P., 1994, A&A, 291, 557
- Walch et al. (2010) Walch S., Naab T., Whitworth A., Burkert A., Gritschneder M., 2010, MNRAS, 402, 2253
- Walch et al. (2011) Walch S., Whitworth A., Bisbas T., Hubber D. A., Wuensch R., 2011, ArXiv e-prints
- Walch et al. (2012) Walch S., Whitworth A. P., Girichidis P., 2012, MNRAS, 419, 760
- Whitworth (1979) Whitworth A., 1979, MNRAS, 186, 59
- Whitworth & Francis (2002) Whitworth A. P., Francis N., 2002, MNRAS, 329, 641
- Williams & McKee (1997) Williams J. P., McKee C. F., 1997, ApJ, 476, 166
- Yorke et al. (1989) Yorke H. W., Tenorio-Tagle G., Bodenheimer P., Rozyczka M., 1989, A&A, 216, 207
- Zavagno et al. (2006) Zavagno A., Deharveng L., Comerón F., Brand J., Massi F., Caplan J., Russeil D., 2006, A&A, 446, 171
- Zavagno et al. (2010) Zavagno A., Russeil D., Motte F., Anderson L. D., Deharveng L., Rodón J. A., Bontemps S., Abergel A., Baluteau J.-P., Sauvage M., André P., Hill T., White G. J., 2010, A&A, 518, L81