Unusual linewidth dependence of coherent THz emission measured from intrinsic Josephson junction stacks in the hot-spot regime
Abstract
We report on measurements of the linewidth of THz radiation emitted from intrinsic Josephson junction stacks, using a Nb/AlN/NbN integrated receiver for detection. Previous resolution limited measurements indicated that may be below 1 GHz – much smaller than expected from a purely cavity-induced synchronization. While at low bias we found to be not smaller than 500 MHz, at high bias, where a hotspot coexists with regions which are still superconducting, turned out to be as narrow as 23 MHz. We attribute this to the hotspot acting as a synchronizing element. decreases with increasing bath temperature, a behavior reminiscent of motional narrowing in NMR or ESR, but hard to explain in standard electrodynamic models of Josephson junctions.
pacs:
74.50.+r, 74.72.-h, 85.25.CpTerahertz generation utilizing stacks of intrinsic Josephson junctions (IJJs) in the high-transition-temperature (high-Tc) cuprate Bi2Sr2CaCu2O8+δ (BSCCO) has been a hot topic in recent years, both in terms of experiment Ozyuzer et al. (2007); Wang et al. (2009); Minami et al. (2009); Guénon et al. (2010); Wang et al. (2010); Tsujimoto et al. (2010); Koseoglu et al. (2011); Benseman et al. (2011); Yamaki et al. (2011); Kashiwagi et al. (2012); Tsujimoto et al. (2012) and theory Bulaevskii and Koshelev (2007); Koshelev and Bulaevskii (2008); Koshelev (2008); Lin and Hu (2008); Krasnov (2009); Klemm and Kadowaki (2010); Hu and Lin (2009); Nonomura (2009); Tachiki et al. (2009); Koyama et al. (2009); Pedersen and Madsen (2009); Grib and Seidel (2009); Savel’ev et al. (2010); Hu and Lin (2010); Lin and Hu (2010); Zhou et al. (2010); Katterwe et al. (2010); Krasnov (2010); Koshelev (2010); Tachiki et al. (2011); Tachiki and Uchida (2011); Yurgens (2011); Yurgens and Bulaevskii (2011); Lin et al. (2011); Koyama et al. (2011); Slipchenko et al. (2011); Krasnov (2011); Asai et al. (2011). Typical emission frequencies are 0.4 – 1 THz, with a maximum output power of tens of W emitted into free space Kashiwagi et al. (2012). The IJJ stacks are usually patterned as mesas on top of BSCCO single crystals and contain 500 – 2000 IJJs. A large fraction of these IJJs oscillate coherently. There are good indications that the synchronization has to do with electric fields utilizing the mesa as a cavity: (i) increases inversely proportional to the junction width Ozyuzer et al. (2007); Kashiwagi et al. (2012) or fulfills the resonance condition for cylindrical mesas Tsujimoto et al. (2010); Guénon et al. (2010), (ii) Low-temperature scanning-laser microscopy imaged standing waves at bias points close to THz emission maxima Wang et al. (2009, 2010); Guénon et al. (2010). On the other hand, (iii) the linewidth of THz radiation – so far mostly resolution limited to some GHz – is much lower than the estimated linewidth of the cavity resonances Wang et al. (2010); Krasnov (2011) and thus one cannot simply assume that the IJJs are slaved by the cavity; (iv) in some cases THz emission lines were fairly tunable or they occurred at positions not compatible with cavity resonances Kashiwagi et al. (2012). A recent mixing experiment Kashiwagi et al. (2012) has revealed a as low as 0.5 GHz at low bias, rising even more questions about the mechanism of synchronization.
In the IJJ stacks, operated at a bath temperature well below , there are two emission regimes. At moderate input power (“low-bias regime”) there is only little heating, and the temperature distribution in the mesa is roughly homogeneous and close to . At high input power (“high-bias regime”) a hotspot (an area heated to above ) forms inside the mesa, leaving the “cold” part of the mesa for THz generation by the Josephson effect. The hotspot seems to take part in synchronization Wang et al. (2010); Guénon et al. (2010); Yurgens (2011); Tachiki et al. (2011).
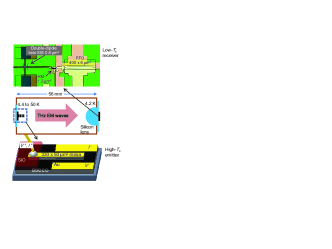
To measure and thus to gain more insight into the mechanism of synchronization, we have used a Nb/AlN/NbN superconducting integrated receiver (SIR)Koshelets and Shitov (2000) for detecting THz emission from an IJJ mesa containing 600 junctions, cf. Fig. 1.
The m2 wide and 0.9 m thick mesa was patterned on a BSCCO single crystal ( 82 K), as described elsewhere Wang et al. (2009, 2010); Guénon et al. (2010). Mesa and base crystal were contacted by Au wires fixed with silver paste. Contact resistances ( 1 ) have been subtracted in the data discussed below. “Conventional” THz emission measurements were performed in Tsukuba, using a Fourier spectrometer and a Si bolometer, as described in Wang et al. (2010). Measurements with the SIR were performed in Moscow. The SIR comprises on a single chip a planar antenna combined with a superconductor-insulator-superconductor (SIS) mixer, a superconducting flux-flow oscillator (FFO) acting as local oscillator (LO) and a SIS harmonic mixer (HM) for the FFO phase locking. The frequency of the LO is continuously tunable from 350 to 750 GHz, while the SIS mixer is effectively matched to the planar antenna between 450 and 700 GHz, limiting the SIR operation range. A frequency resolution of the SIR well below 100 kHz has been confirmed Koshelets et al. (2010).
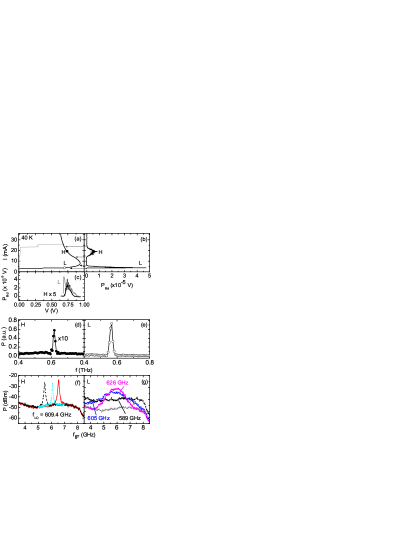
Fig. 2 shows a typical set of data at = 40 K. The current-voltage curve (IVC) of the mesa is shown in Fig. 2(a). Upon increasing bias current , near 25 mA, one observes jumps (grey line of IVC) where the IJJs switch into their resistive state. When lowering from 40 mA (black line) all junctions are resistive. Switch-back occurs below 3.65 mA. The outermost branch, where the emission data are taken, exhibits the typical back-bending arising from strong heating Yurgens (2011). The high-bias regime embraces the region of negative differential resistance on this branch. Figs. 2(b),(c) show the broadband THz emission power , simultaneously detected with the IVC by a bolometer, vs. (b) current and (c) voltage across the mesa. In (b) one observes a broad (with respect to ) emission peak in the high-bias regime and a sharper one at low bias which, for this particular mesa, was more intense than the high-bias peak. vs. , Fig. 2(c), shows a smooth peak for the high-bias regime, with a full-width-at-half-maximum in voltage of about 75 mV (black line). By contrast the low-bias signal (grey line) seems to exhibit structure, indicating different groups of oscillating IJJs. Emission spectra, measured using a Fourier spectrometer, are shown in Figs. 2(d), (e). Spectrum (d) has been taken at point H in (a) where = 736 mV, = 19.43 mA. The emission peak is at = 618 GHz, corresponding to 576 oscillating IJJs. is the flux quantum. The (resolution limited) linewidth of the emission peak is GHz. Fig. 2 (e) shows a spectrum for bias point L where = 697 mV, = 3.76 mA. The emission peak, having a width which is also near the resolution limit, is at = 594 GHz, corresponding to 567.
The SIR measurements, showing the emitted radiation at the IF frequency, were performed near points H (Fig. 2(f)) and L (Fig. 2(g)). In Fig. 2(f) the LO frequency of the SIR is = 609.4 GHz. We show three measurements made for slightly ( 0.6 mV) different values of . There is a single emission peak which shifts with increasing voltage. of the two outermost peaks is 60 MHz, while the center one is even sharper, 40 MHz. By contrast, the linewidths seen in the low bias regime, cf. Fig. 2 (g), are much larger and often exceeded the 6 GHz bandwidth of the IF amplifier. The lowest values are 0.5 GHz, in agreement with previous measurements Kashiwagi et al. (2012).
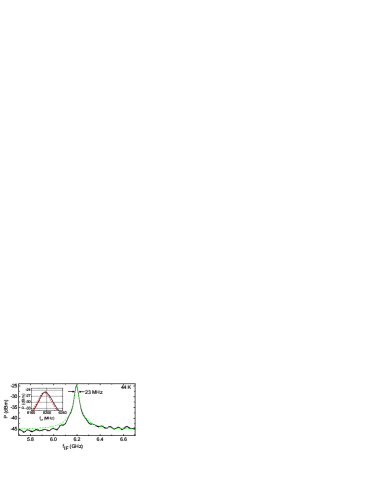
Fig. 3 shows the most narrow line ( = 23 MHz) we have obtained in the high-bias regime. Data were taken at = 44 K, = 16.3 mA and = 0.721 V. From = 605.75 GHz and = 6.2 GHz we find = 611.95 GHz and 570. This value for is already quite close to the limit value that can be phase-locked by a regular room temperature semiconductor phase-locked-loop (PLL) system with regulation bandwidth of about 20 MHz, presently limited by the delay in the cable between the oscillator inside the cryostat and the PLL system (this limitation can be overridden by use of a cryogenic PLL system with regulation bandwidth 40 MHz Khudchenko et al. (2009)). We also investigated the stability of the THz emission line. The inset of Fig. 3 shows two measurements, taken at a 3 min. interval. The 3 MHz drift observed was smooth and unidirectional and even lower than the typical 3 min. drift ( 10 MHz) of a free-running Nb based FFO. We also note that the emission lines observed at high bias have Lorentzian shape, cf. dashed line in Fig. 3. Recent 3D simulations Asai et al. (2011) based on the sine-Gordon equation and taking a hotspot into account yielded an asymmetric Fano shape in contrast to our experimental data.
If of the high-bias THz emission signal were set by a cavity resonance, its quality factor would have to amount some , which is more than unrealistic for an IJJ stack Katterwe et al. (2010); Krasnov (2011); Katterwe and Krasnov (2011). At least for small mesas, cavity resonances become overdamped for T 60 K Katterwe and Krasnov (2011). For 40 K we expect . The low value of implies, that, when changing the bias current in Fig. 2(c), a sharp emission line “moves” through the = 75 mV wide emission peak. The ratio of this peak would indeed be compatible with the notion of a cavity resonance.
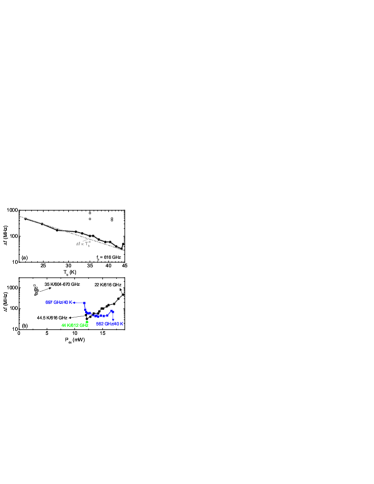
In Fig. 4 (a) we show by black circles vs. . Strikingly, decreases with increasing by about a factor 15 and, roughly, , cf. grey line in Fig. 4(a). For comparison we have also added for two temperatures low-bias data for near 616 GHz. In this regime it was difficult to obtain systematic data points, because at most temperatures only a broadband ( 6 GHz) signal appeared in the SIR output. This further indicates that at low bias phase-lock is incomplete. Noting that may not be the best variable for our system, in Fig. 4 (b) we also show vs. the dc input power , where for we have used the measured value, not corrected for contact resistance. Low-bias data are shown by open squares. The black circles show the same high-bias data as Fig. 4(a); increases with increasing . Note that the smallest is at high and the highest is at the lowest . This does, however, not imply that the sample is hotter at low . Simulations of the temperature distribution, performed analogous to the calculations in Yurgens (2011), yielded temperatures of the cold part of the mesa which are some 10–15 K above , but still increase with increasing . For the hot part we find peak temperatures in the range 80–110 K, with the highest value indeed at the lowest value of . For comparison we show by solid squares in Fig. 4(b) out of a measurement series, where we have fixed to 401 K and varied . Within this curve varies monotonically from 697 GHz to 562 GHz. In contrast to the curve, is about constant at intermediate values of and increases outside of this regime. Thus there seems to be no systematic dependence of on . Further note, that a slight increase of at low is visible both on the and the curve. Here, the bias is close to the hotspot nucleation point and it is possible that the hot part of the stack already is close to or even below , i.e. we approach the low-bias regime.
We next compare the high-bias data to theoretical predictions. We decompose into a sum of two contributions and , as it has been done in an analysis of the radiation linewidth of the FFO Golubov et al. (1996). arises from fluctuations of the quasiparticle current (Nyquist noise) and represents additional fluctuations of – at this point – unspecified origin. For a current biased lumped junction , where is the junction resistance, is the differential resistance of the IVC at the bias point and is the junction temperature Dahm et al. (1969); Jain et al. (1984). For a phase-locked 1D array of junctions the linewidth is expected to decrease Jain et al. (1984). In our case, in the high-bias regime the hot part of the IJJ stack is an excellent candidate for a shunting network causing phase-locking Guénon et al. (2010); Wang et al. (2010); Yurgens (2011); Tachiki et al. (2011). Our IJJ stacks are not lumped and also not only differs from but also varies strongly within the stack. Nonetheless an analysis of may give some indication whether or not vs. can be explained via Nyquist noise. We first look at the cold part of the mesa only. The out-of-plane resistance of BSCCO has a negative temperature coefficient (roughly ) and thus . We cannot infer from the IVC, since varies strongly along this curve. However, from small mesas it is known that is smaller but not very different from . Thus, an unrealistic would be required to explain the data. We also considered a hot resistor (resistance , temperature ), representing the hotspot, in parallel to a cold one (resistance , temperature ), as it has been analyzed in Larkin and Ovchinnikov (1968) for a single junction, with the result that should be replaced by and by . follows from the measured IVC. With and we get and, with , one obtains an almost temperature independent 250 MHz. Dividing this by yields a linewidth which not only has the wrong temperature dependence but also is much lower than the measured .
The second contribution to , , may arise from moving fluxons. This is the case for the FFO where, however, was found Golubov et al. (1996). Recently, THz generation in IJJ stacks by bound fluxon-antifluxon pairs (breathers) oscillating near a cavity resonance was proposed. Whether or not this mechanism leads to the observed depencence of is unclear, although we would expect an increase with , as for the case of the FFO. Also, more conventional simulations based on 1D-coupled-sine-Gordon equations yielded a which increased with temperature Tachiki and Uchida (2011).
Another hint may be, that at low the in-plane thermal gradient in the stack is larger than at high . However, we cannot translate this to the observed vs. dependence.
Let us thus also look at other effects in physics that cause a decrease of with increasing temperature. Motional narrowing in NMR or ESR are prominent examples Kumar and Sinha (1966); Hendrickson and Bray (1973). It is tempting to speculate about an analogous effect in the IJJ stacks. In a nutshell, motional narrowing occurs when some spatially varying field, causing line broadening, is reduced on average due to temporal fluctuations. In our case this could be due to a time-dependent hotspot. Generally, it is possible that the hotspot oscillates Gurevich and Mints (1987). We have searched for such oscillations for frequencies in the kHz and MHz range but could not find any. Still, the temperatures of the hot and cold parts of the stack may fluctuate, causing fluctuations of the hotspot edge position and as a result also variations in junction parameters such as critical current and resistance. Suppose that the static spread in these parameters is too large to achieve complete phase-lock. Temporally fluctuating parameters could lead to a situation, where for some time these parameters are in the synchronization window, causing improved phase-locking.
To conclude: At low bias the best values for are on the order of 0.5 GHz, consistent with previous measurements Kashiwagi et al. (2012). However, the irregular lineshape and the strongly varying linewidth indicate that not all junctions are phase-locked and a superposition of several lines is observed. In the high-bias regime we observe much lower values of down to 23 MHz. The improved linewidth compared to the low-bias regime suggests that the hotspot acts as a shunting element providing phase-lock. , measured at fixed emission frequency, decreases with increasing temperature, reminiscent on motional narrowing observed in NMR or ESR. This temperature dependence is hard to explain within standard models for the linewidth of oscillating Josephson junctions. In any case, the narrow emission line observed in the high-bias regime makes intrinsic Josephson junction stacks interesting for, e.g., THz spectroscopy.
Acknowledgements.
We gratefully acknowledge financial support by the JST/DFG strategic Japanese-German International Cooperative Program, the Grants-in-Aid for scientific research from JSPS and RFBR projects 12-02-00882, 11-02-12195-ofi-m, 11-02-12213-ofi-m, Grants 2456.2012.2 and 02.740.11.0795.References
- Ozyuzer et al. (2007) L. Ozyuzer, et al., Science 318, 1291 (2007).
- Wang et al. (2009) H. B. Wang, et al., Phys. Rev. Lett. 102, 017006 (2009).
- Minami et al. (2009) H. Minami, et al., Appl. Phys. Lett. 95, 232511 (2009).
- Guénon et al. (2010) S. Guénon, et al., Phys. Rev. B 82, 214506 (2010).
- Wang et al. (2010) H. B. Wang, et al., Phys. Rev. Lett. 105, 057002 (2010).
- Tsujimoto et al. (2010) M. Tsujimoto, et al., Phys. Rev. Lett. 105, 037005 (2010).
- Koseoglu et al. (2011) H. Koseoglu, et al., J. Supercond. Nov. Magn. 24, 1083 (2011).
- Benseman et al. (2011) T. M. Benseman, et al., Phys. Rev. B 84, 064523 (2011).
- Yamaki et al. (2011) K. Yamaki, et al., Optics Express 19, 3193 (2011).
- Kashiwagi et al. (2012) T. Kashiwagi, et al., J. J. Appl. Phys. 51, 010113 (2012).
- Tsujimoto et al. (2012) M. Tsujimoto, et al., Phys. Rev. Lett. 108, 107006 (2012).
- Bulaevskii and Koshelev (2007) L. N. Bulaevskii and A. E. Koshelev, Phys. Rev. Lett. 99, 057002 (2007).
- Koshelev and Bulaevskii (2008) A. E. Koshelev and L. N. Bulaevskii, Phys. Rev. B 77, 014530 (2008).
- Koshelev (2008) A. E. Koshelev, Phys. Rev. B 79, 174509 (2008).
- Lin and Hu (2008) S. Lin and X. Hu, Phys. Rev. Lett. 100, 247006 (2008).
- Krasnov (2009) V. M. Krasnov, Phys. Rev. Lett. 103, 227002 (2009).
- Klemm and Kadowaki (2010) R. A. Klemm and K. Kadowaki, J. Phys. Cond. Mat. 22, 375701 (2010).
- Hu and Lin (2009) X. Hu and S. Z. Lin, Phys. Rev. B 80, 064516 (2009).
- Nonomura (2009) Y. Nonomura, Phys. Rev. B 80, 140506 (2009).
- Tachiki et al. (2009) M. Tachiki, S. Fukuya, and T. Koyama, Phys. Rev. Lett. 102, 127002 (2009).
- Koyama et al. (2009) T. Koyama, et al., Phys. Rev. B 79, 104522 (2009).
- Pedersen and Madsen (2009) N. Pedersen and S. Madsen, IEEE Trans Appl. Supercond. 19, 726 (2009).
- Grib and Seidel (2009) A. Grib and P. Seidel, Phys. Stat. Sol.-Rapid Research Lett. 3, 302 (2009).
- Savel’ev et al. (2010) S. Savel’ev, et al., Rep. Prog. Phys. 73, 026501 (2010).
- Hu and Lin (2010) X. Hu and S. Z. Lin, Supercond. Sci. Technol. 23, 053001 (2010).
- Lin and Hu (2010) S. Z. Lin and X. A. Hu, Phys. Rev. B 82, 020504 (2010).
- Zhou et al. (2010) W. Zhou, C. Wang, and Q.-H. Chen, Phys. Rev. B 82, 184514 (2010).
- Katterwe et al. (2010) S. O. Katterwe, et al., Phys. Rev. B 82, 214519 (2010).
- Krasnov (2010) V. M. Krasnov, Phys. Rev. B 82, 134524 (2010).
- Koshelev (2010) A. E. Koshelev, Phys. Rev. B 82, 174512 (2010).
- Tachiki et al. (2011) M. Tachiki, et al., Phys. Rev. B 83, 014508 (2011).
- Tachiki and Uchida (2011) T. Tachiki and T. Uchida, Physica C 471, 1206 (2011).
- Yurgens (2011) A. A. Yurgens, Phys. Rev. B 83, 184501 (2011).
- Yurgens and Bulaevskii (2011) A. A. Yurgens and L. N. Bulaevskii, Supercond. Sci. Technol 24, 015003 (2011).
- Lin et al. (2011) S. Lin, X. Hu, and L. N. Bulaevskii, Phys. Rev. B 84, 104501 (2011).
- Koyama et al. (2011) T. Koyama, et al., Supercond. Sci. Technol. 24, 085007 (2011).
- Slipchenko et al. (2011) T. M. Slipchenko, et al., Phys. Rev. B 84, 224512 (2011).
- Krasnov (2011) V. M. Krasnov, Phys. Rev. B 83, 174517 (2011).
- Asai et al. (2011) H. Asai, M. Tackiki, and K. Kadowaki, Phys. Rev. B 85, 064521 (2011).
- Koshelets and Shitov (2000) V. P. Koshelets and S. Shitov, Supercond. Sci. Technol. 13, R53 (2000).
- Koshelets et al. (2010) V. P. Koshelets, et al., Proc. SPIE 7854, 78540J (2010).
- Khudchenko et al. (2009) A. Khudchenko, et al., Supercond. Sci. Technol. 22, 085012 (2009).
- Katterwe and Krasnov (2011) S. O. Katterwe and V. M. Krasnov, Phys. Rev. B 84, 024517 (2011).
- Golubov et al. (1996) A. A. Golubov, B. A. Malomed, and A. V. Ustinov, Phys. Rev. B 54, 3047 (1996).
- Dahm et al. (1969) A. J. Dahm, et al., Phys. Rev. Lett. 22, 1416 (1969).
- Jain et al. (1984) A. K. Jain, et al., Phys. Rep. 109, 309 (1984).
- Larkin and Ovchinnikov (1968) A. I. Larkin and Y. I. Ovchinnikov, Sov. Phys. JETP 26, 1219 (1968).
- Kumar and Sinha (1966) N. Kumar and K. P. Sinha, Z. Phys. 197, 26 (1966).
- Hendrickson and Bray (1973) J. R. Hendrickson and P. J. Bray, J. Mag. Res. 9, 341 (1973).
- Gurevich and Mints (1987) A. V. Gurevich and R. G. Mints, Rev. Mod. Phys. 59, 941 (1987).