Disentangling the electronic and phononic glue in a high- superconductor
Abstract
Unveiling the nature of the bosonic excitations that mediate the formation of Cooper pairs is a key issue for understanding unconventional superconductivity. A fundamental step toward this goal would be to identify the relative weight of the electronic and phononic contributions to the overall frequency () dependent bosonic function, . We perform optical spectroscopy on Bi2Sr2Ca0.92Y0.08Cu2O8+δ crystals with simultaneous time- and frequency-resolution; this technique allows us to disentangle the electronic and phononic contributions by their different temporal evolution. The strength of the interaction (1.1) with the electronic excitations and their spectral distribution fully account for the high critical temperature of the superconducting phase transition.
Lattice vibrations Kresin and Wolf (2009) and excitations of electronic origin, like spin or electric polarizability fluctuationsMonthoux et al. (2007) and loop currentsVarma (2006), are generally considered potential mediators of Cooper-pairing in the copper-oxide high-temperature superconductors (cuprates). The generic interaction of fermionic quasiparticles (QPs) with bosonic excitations is accounted for by the bosonic function (usually indicated as for phonons and for spin fluctuations), a dimensionless function that depends on the density of states of the excitations and the strength of their coupling to QPs. Because both the energy dispersion and lifetime of QPs are strongly affected by the interactions, signatures of QP-boson coupling have been observed in experiments that probe the electronic properties at equilibrium. The ubiquitous kinks in the QP dispersion at 70 meV, measured by angle-resolved photoemission spectroscopy (ARPES)Damascelli et al. (2003), have been interpreted in terms of coupling to either optical Cu-O lattice modesLanzara et al. (2001); Devereaux et al. (2004) or spin excitationsDahm et al. (2009). Inelastic neutron and X-ray scattering experiments found evidence for both QP-phonon anomaliesReznik et al. (2006) and bosonic excitations attributed to spin fluctuationsDahm et al. (2009); Tacon et al. (2011) and loop currentsLi et al. (2010). Dip features in tunnelling experiments have been used to alternatively support the scenarios of dominant electron-phonon interactionsLee et al. (2006) or antiferromagnetic spin fluctuationsAhmadi et al. (2011). The frequency-dependent dissipation of the Drude optical conductivity, , measured by equilibrium optical spectroscopies, has been interpretedNorman and Chubukov (2006); Hwang et al. (2007); van Heumen et al. (2009) as the coupling of electrons to bosonic excitations, in which the separation of the phononic and electronic contributions is impeded by their partial coexistence on the same energy scale (90 meV).
We disentangle the electronic and phononic contributions to through a non-equilibrium optical spectroscopy, in which the femtosecond time-resolution is combined with an energy-resolution smaller than 10 meV, over a wide photon energy range (0.5-2 eV).
Our approach is based on the widely-used assumptionPerfetti et al. (2007); Carbone et al. (2008) that, after the interaction between a superconductor and a short laser pulse (1.55 eV photon energy), the effective electronic temperature () relaxes toward its equilibrium value through energy exchange with the different degrees of freedom that linearly contribute to . In a more formal description, the total bosonic function is given by =++ where refers to the bosonic excitations of electronic origin at the effective temperature , to the small fraction of strongly-coupled phonons (SCPs) at Perfetti et al. (2007) and to all other lattice vibrations at . As the term that couples the rate equationssup for and (with =,,) is ( being the functional described in sup and the specific heat of the bosonic population ), each subset of the bosonic excitations is characterized by different relaxation dynamics on the femtosecond timescale. The most convenient systems for such an experiment are the hole-doped cuprates close to the optimal dopant concentration needed to attain the maximum critical temperature , in which the total is maximumvan Heumen et al. (2009). Despite the magnitude of , vertex corrections beyond Eliashberg theory can be reliably neglectedvan Heumen et al. (2009); Tacon et al. (2011) in this doping regime.
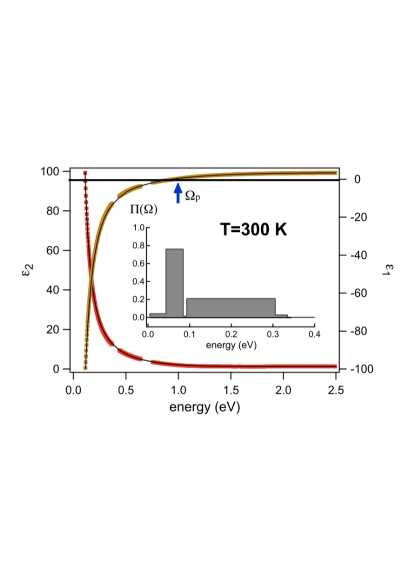
The total bosonic function is directly determined by fitting an extended Drude modelsup and a sum of Lorentz oscillators accounting for the interband optical transitions in the visible regionGiannetti et al. (2011) to the equilibrium dielectric function of optimally doped Bi2Sr2Ca0.92Y0.08Cu2O8+δ (Y-Bi2212) high-quality crystalsEisaki et al. (2004) (=96 K), measured at =300 K by conventional spectroscopic ellipsometryvan der Marel et al. (2003). Assuming a histogram-like formsup (see Fig. S1) and imposing an upper limit of 1 eV, the extracted is characterized by: i) a low-energy part (up to 40 meV) compatible with the coupling to acoustic phononsJoh and Raman-active optical phonons involving -axis motion of the Cu ionsKovaleva et al. (2004); ii) a narrow, intense peak centered at 60 meV, attributed to the anisotropic coupling to either out-of-plane buckling and in-plane breathing Cu-O optical modesDevereaux et al. (2004) or bosonic excitations of electronic origin such as spin fluctuationsDahm et al. (2009); iii) a broad continuum extending up to 350 meV Norman and Chubukov (2006); Hwang et al. (2007); van Heumen et al. (2009), i.e., well above the characteristic phonon cut-off frequency (90 meV).
The key point to extend this analysis to non-equilibrium experiments is that the electron self-energy, , entering in the calculation of sup , can be factorized intoKaufmann et al. (1998):
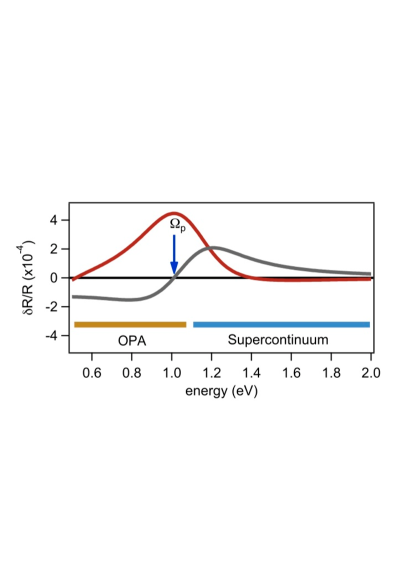
where is a material-independent kernel function accounting for the thermal activation of the bosonic excitations and of the QPs. The kernel function = - +++---+, where is the Digamma function obtained by integrating the Fermi-Dirac functions and the Bose distribution at temperature , can be decomposed into different terms depending on the electronic () and bosonic () temperatures. The independent variation of is expected to induce different modifications of the dielectric function. Figure 1 shows the expected relative variation of the reflectivity, i.e., = -, in the quasi-thermal (=0) and non-thermal (0, =0) scenarios. Phenomenologically, in the first case the reflectivity variation is dominated by the increase of the QP-boson scattering, corresponding to a broadening of the Drude peak, while in the second case the decoupling between the QP and bosonic distributions can be rationalized in terms of a small increase of the plasma frequency without any change in the scattering rate. The difference between the two cases is more significant in the spectral region close to the dressed plasma frequency, 1 eV, i.e., an energy scale much higher than the energy scale of the bosonic function.
Time-resolved reflectivity measurements in the 0.5-2 eV photon-energy range Cilento et al. (2010) have been performed at =300 K on the same crystalsEisaki et al. (2004) (OP96) used for the equilibrium optical spectroscopy. The two-dimensional matrix is reported in Fig. 2A and B, along with the time-traces at 1.5 and 0.7 eV photon energies (white curves). After the pump excitation at =0, the temporal dynamics above and below are very similar, exhibiting a relaxation dynamics of about 200 fs, generally attributed to the thermalization of electrons with SCPsPerfetti et al. (2007), and a slower decay on the ps timescale, related to the thermalization with all other lattice vibrations. In Fig. 2C the energy-resolved traces at fixed delay (=100 fs) are reported. Comparing the measured on OP96 to the relative variation of the reflectivity calculated in the non-thermal and quasi-thermal cases (Fig. 1), we come to the major point of our work: on a timescale faster than the electron-phonon thermalization the electrons are already thermalized with some bosonic excitations participating to . The fast timescale (100 fs) of this thermalization implies a very large coupling and a relatively small specific heat. These overall observations strongly suggest that this process involves bosonic excitations of electronic origin.
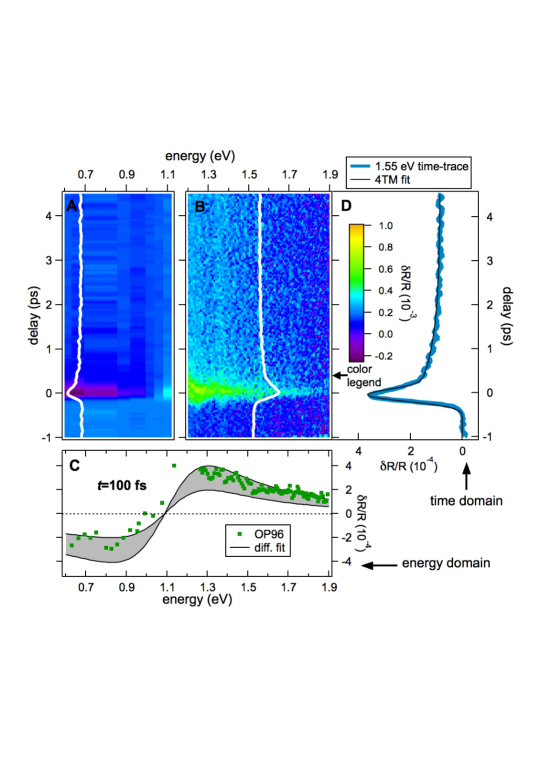
The relative strengths of determineAllen (1987) both the temporal evolution of the temperatures , through the four-temperature model (4TM)sup , and the intensity of the reflectivity variation, through Eq. 1. As a consequence, the simultaneous fit of the calculated to the data reported in Fig. 2 in the time- and frequency domain, significantly narrows the phase-space of the parameters of the model, as compared to single-color measurements. The fit proceduresup allows us to unambiguously extract the different contributions to and to estimate and .
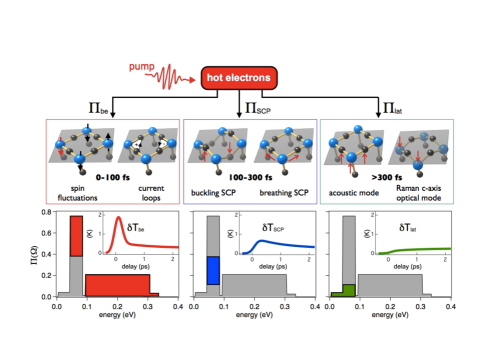
Figure 3 summarizes the main results of this work. The 10 J/cm2 pump pulse gently increases the electronic temperature by 2 K. The entire high-energy part and 46 of the peak (red areas) instantaneously thermalize with electrons at a temperature . The spectral distribution and the value of the specific heat of these excitations (0.1) demonstrate their electronic origin. On a slower timescale (100-200 fs), the electrons thermalize with the SCPs that represent 20 of the phonon density of states (=0.2), but are responsible for 34 of the coupling (blue area) in the peak of the bosonic function at 40-75 meV, corresponding to 17 of the total bosonic function. Prominent candidates as SCPs are the buckling and breathing Cu-O optical modes. The third and last measured timescale is related to the thermalization with all other lattice modes (80 of the total) that include all acoustic modes and the IR- and Raman-active modes involving c-axis motion of the Cu ions and provide 20 of the coupling (green area) in the peak of .
These results have important implications for the identification of the pairing mechanism in cuprates.
The electron-boson coupling = is calculated for each subset b of the bosonic excitations, considering the experimental uncertainties. In the strong-coupling regime (1.5), the critical temperature can be estimatedsup through an extended version of the Mc Millan’s equationAllen and Dynes (1975), containing the logarithmic-averaged frequency () and the portion of that contributes to the -wave pairingMillis et al. (1988). The maximal critical temperature attainable is calculated assuming that each entirely contributes to the -wave pairing. The coupling with SCPs (=0.40.2) is in complete agreement with the values measured on similar materials via different techniques, such as time-resolved photoemission spectroscopyPerfetti et al. (2007), time-resolved electron diffractionCarbone et al. (2008) and single-color high-resolution time-resolved reflectivityGadermaier et al. (2010). Although this value is rather close to the threshold of the strong-coupling regimeMishchenko and Nagaosa (2004); Sangiovanni et al. (2006), the small value of gives =2-30 K, that is far from being able to account for the high-temperature superconductivity of the system. The coupling of electrons with all other lattice vibrations is even smaller in strength (=0.20.2) and provides an upper bound of the critical temperature of 12 K. Finally, the large coupling constant (=1.10.2) and the larger value of the electronic excitations give =105-135 K and hence accounts alone for the high-critical temperature. We remark that, while and are expected to be temperature-independent, increases as new magnetic excitations emerge when approaching , particularly in the pseudogap phaseLi et al. (2010). Therefore, the use of determined at =300 K to estimate the QP-boson coupling and underestimates the electronic contribution to the pairing, further supporting our conclusion of a dominant electronic mechanism in the superconductivity of cuprates. All the values, maximum attainable critical temperatures, and important parameters for each subset of the total bosonic function are reported in the Table S2.
The measured values of , and and the spectral distribution of the bosonic excitations strongly indicate that the antiferromagnetic spin fluctuationsDahm et al. (2009); Tacon et al. (2011) and the loop currentsVarma (2006) are the most probable mediators for the formation of Cooper pairs. An isotope effect in the dispersion of nodal QPs has been recently reported on optimally-doped Bi2212, by ARPES measurementsIwasawa et al. (2008). These data have been carefully analyzedSchachinger et al. (2009), demonstrating that the nodal isotope effect can be explained assuming that the QP-phonon coupling represents about 10 of the total contribution of other bosonic excitations. From Figure 3, we estimate that the contribution of SCP is less than 20 of the total bosonic function. This demonstrates that our results fully explain the observed isotope effect, eventually providing a consistent interpretation of the most important experimental results about the QP-boson coupling in cuprates.
We remark that our conclusions are rather independent of the assumption of the histogram-like form of and robust against modifications of the details of the equilibrium dielectric function. In fact, the outcome of this work strongly supports the factorization of the self-energy at =300 K into a temperature-dependent kernel function and the glue function (see Eq. 1), even under non-equilibrium conditions. Although we do not exclude a-priori that the upper limit used in the determination of the bosonic function can hide possible contributions to even above 1 eV and that the electron-phonon coupling may cooperate in driving the superconducting phase transition, we demonstrate that bosonic excitations of electronic origin are the most important factor in the formation of the superconducting state at high temperatures in the cuprates.
The present findings pave the way for the investigation of the electron-boson coupling in a variety of complex materials, ranging from transition-metal oxides to iron-based superconductors.
We acknowledge discussions and suggestions from M. Capone and A. Chubukov. F.C., G.C., and F.P. acknowledge the support of the Italian Ministry of University and Research under Grant Nos. FIRBRBAP045JF2 and FIRB-RBAP06AWK3. The crystal growth work was performed in M.G. s prior laboratory at Stanford University, Stanford, CA 94305, USA, and supported by DOE under Contract No. DE-AC03-76SF00515. The work at UBC was supported by the Killam, Sloan Foundation, CRC, and NSERC s Steacie Fellowship Programs (A. D.), NSERC, CFI, CIFAR Quantum Materials, and BCSI. D. v.d.M. acknowledges the support of the Swiss National Science Foundation under Grant No. 200020-130052 and MaNEP.
References
- Kresin and Wolf (2009) V. Kresin and S. Wolf, Rev. Mod. Phys. 81, 481 (2009).
- Monthoux et al. (2007) P. Monthoux, D. Pines, and G. Lonzarich, Nature 450, 1177 (2007).
- Varma (2006) C. Varma, Phys. Rev. B 73, 155113 (2006).
- Damascelli et al. (2003) A. Damascelli, Z. Hussain, and Z.-X. Shen, Rev. Mod. Phys. 75, 473 (2003).
- Lanzara et al. (2001) A. Lanzara, P. V. Bogdanov, X. J. Zhou, S. A. Kellar, D. L. Feng, E. D. Lu, T. Yoshida, H. Eisaki, A. Fujimori, K. Kishio, et al., Nature 412, 510 (2001).
- Devereaux et al. (2004) T. Devereaux, T. Cuk, Z.-X. Shen, and N. Nagaosa, Phys. Rev. Lett. 93, 117004 (2004).
- Dahm et al. (2009) T. Dahm, V. Hinkov, S. V. Borisenko, A. Kordyuk, V. Zabolotnyy, J. Fink, B. Büchner, D. Scalapino, W. Hanke, and B. Keimer, Nature Physics 5, 217 (2009).
- Reznik et al. (2006) D. Reznik, L. Pintschovius, M. Ito, S. Iikubo, M. Sato, H. Goka, M. Fujita, K. Yamada, G. D. Gu, and J. M. Tranquada, Nature 440, 1170 (2006).
- Tacon et al. (2011) M. L. Tacon, G. Ghiringhelli, J. Chaloupka, M. M. Sala, V. Hinkov, M. Haverkort, M. Minola, M. Bakr, K. J. Zhou, S. Blanco-Canosa, et al., Nature Physics 7, 725 (2011).
- Li et al. (2010) Y. Li, V. Balédent, G.Yu, N. Bariić, K. Hradil, R. A. Mole, Y. Sidis, P. Steffens, X. Zhao, P. Bourges, et al., Nature 468, 283 (2010).
- Lee et al. (2006) J. Lee, K. Fujita, K. McElroy, J. A. Slezak, M. Wang, Y. Aiura, H. Bando, M. Ishikado, T. Masui, J.-X. Zhu, et al., Nature 442, 546 (2006).
- Ahmadi et al. (2011) O. Ahmadi, L. Coffey, J. F. Zasadzinski, N. Miyakawa, and L. Ozyuzer, Phys. Rev. Lett. 106, 167005 (2011).
- Norman and Chubukov (2006) M. Norman and A. Chubukov, Phys. Rev. B 73, R140501 (2006).
- Hwang et al. (2007) J. Hwang, T. Timusk, E. Schachinger, and J. Carbotte, Phys. Rev. B 75, 144508 (2007).
- van Heumen et al. (2009) E. van Heumen, E. Muhlethaler, A. B. Kuzmenko, H. Eisaki, W. Meevasana, M. Greven, and D. van der Marel, Phys. Rev. B 79, 184512 (2009).
- Perfetti et al. (2007) L. Perfetti, P. A. Loukakos, M. Lisowski, U. Bovensiepen, H. Eisaki, and M. Wolf, Phys. Rev. Lett. 99, 197001 (2007).
- Carbone et al. (2008) F. Carbone, D.-S. Yang, E. Giannini, and A. H. Zewail, Proc. Natl. Acad. Sci. 105, 20161 (2008).
- (18) Materials and methods are available as supporting material on Science Online.
- Giannetti et al. (2011) C. Giannetti, F. Cilento, S. D. Conte, G. Coslovich, G. Ferrini, H. Molegraaf, M. Raichle, R. Liang, H. Eisaki, M. Greven, et al., Nature Communications 3, 253 (2011).
- Eisaki et al. (2004) H. Eisaki, N. Kaneko, D. L. Feng, A. Damascelli, P. K. Mang, K. M. Shen, Z.-X. Shen, and M. Greven, Phys. Rev. B 69, 064512 (2004).
- van der Marel et al. (2003) D. van der Marel, H. J. A. Molegraaf, J. Zaanen, Z. Nussinov, F. Carbone, A. Damascelli, H. Eisaki, M. Greven, P. H. Kes, and M. Li, Nature 425, 271 (2003).
- (22) S. Johnston et al. Evidence for forward scattering and coupling to acoustic phonon modes in high-Tc cuprate superconductors. arXiv:1101.1302v1 (2011).
- Kovaleva et al. (2004) N. Kovaleva, A. Boris, T. Holden, C. Ulrich, B. Liang, C. Lin, B. Keimer, C. Bernhard, J. Tallon, D. Munzar, et al., Phys. Rev. B 69, 054511 (2004).
- Kaufmann et al. (1998) H. J. Kaufmann, E. G. Maksimov, and E. K. H. Salje, J. Supercond 22, 755 (1998).
- Cilento et al. (2010) F. Cilento, C. Giannetti, G. Ferrini, S. D. Conte, T. Sala, G. Coslovich, M. Rini, A. Cavalleri, and F. Parmigiani, Appl. Phys. Lett. 96, 021102 (2010).
- Allen (1987) P. B. Allen, Phys. Rev. Lett. 59, 1460 (1987).
- Allen and Dynes (1975) P. B. Allen and R. Dynes, Phys. Rev. B 12, 905 (1975).
- Millis et al. (1988) A. Millis, S. Sachdev, and C. Varma, Phys. Rev. B 37, 4975 (1988).
- Gadermaier et al. (2010) C. Gadermaier, A. Alexandrov, V. Kabanov, P. Kusar, T. Mertelj, X. Yao, C. Manzoni, D. Brida, G. Cerullo, and D. Mihailovic, Phys. Rev. Lett. 105 (2010).
- Mishchenko and Nagaosa (2004) A. Mishchenko and N. Nagaosa, Phys. Rev. Lett. 93, 036402 (2004).
- Sangiovanni et al. (2006) G. Sangiovanni, O. Gunnarsson, E. Koch, C. Castellani, and M. Capone, Phys. Rev. Lett. 97 (2006).
- Iwasawa et al. (2008) H. Iwasawa, J. Douglas, K. Sato, T. Masui, Y. Yoshida, Z. Sun, H. Eisaki, H. Bando, A. Ino, M. Arita, et al., Phys. Rev. Lett. 101, 157005 (2008).
- Schachinger et al. (2009) E. Schachinger, J. Carbotte, and T. Timusk, Europhys. Lett. 86, 67003 (2009).
Materials and methods
Time-resolved spectroscopy
The dynamics of the non-equilibrium optical response is probed by ultrashort supercontinuum light pulses obtained by focusing the output beam of a cavity-dumped Ti:sapphire oscillator in a photonic crystal fiber (25). The spectral window explored by the white pulses (1.2-2 eV) is extended in the infrared region down to 0.5 eV, using an Optical Parametric Amplifier (OPA), seeded by a 250 kHz amplified Ti:sapphire oscillator. The pump fluence is always set to 103 J/cm2. The temporal resolution of the probe pulses varies with the wavelength from 180 fs at 800 nm to 100 fs at 2000 nm. The diameters of the pump and probe beams on the sample are 382 and 203 m (Full-Width-at-Half-Maximum).
Critical temperature
In the strong-coupling formalism, the critical temperature for -wave pairing in a Fermi liquid with pseudopotential =0 is approximately given by (27, 28):
where ln=2/, = is the electron-boson coupling constant and [0,1] is a parameter that accounts for the -wave nature of the superconducting gap. The upper bound =1 corresponds to the case in which entirely contributes to the -wave pairing.
| Bosonic glue | (meV) | Tc (K) | ||
|---|---|---|---|---|
| SCPs | 0.40.2 | 60 | 0.2 | 2-30 |
| Lattice | 0.20.2 | 47 | 0.8 | 0-12 |
| Electronic | 1.10.2 | 87 | 0.1 | 105-135 |
| Total | 1.7 | 69 | 137 |
Four temperatures model
A four-temperatures model can be used to represent the following physical processes: a short laser pulse, with power density (absorbed) , impulsively increases the effective electronic temperature of the electrons with a specific heat = (=), being the number of cells in the sample and the density of states of both spins per unit cell). will then relax through the energy exchange with all the coupled degrees of freedom that linearly contribute to the total =++. The rate of the energy exchange among the different populations is given by (26):
where
with =,, and =()-1 the Bose-Einstein distribution at the temperature . The specific heat () of SCPs is proportional to their density of states and is taken as a fraction of the total specific heat, i.e., =.
We pinpoint that the 4TM used does not contain any term for the anharmonic decay of SCP (16), that directly couples Eqs. S4 and S5. Including this term, which is of difficult evaluation, would eventually lead to a smaller value of and a larger value of .
The four temperature model relies on the assumption that quasi-thermal electronic and bosonic distributions, thermodynamically defined by the effective temperatures and (with =,,), are rapidly established. This corresponds to assume that the electron-electron scattering time () is much smaller than the electron-phonon scattering time (). The evaluation of in strongly-correlated systems and in cuprates, in particular, is a subtle and open problem, since the applicability of arguments based on the Fermi-liquid theory is questionable (34). In Refs. (31, 35) an analytical approach, based on the Boltzmann equation and free from any quasi-equilibrium approximation, has been used to extract the electron-phonon coupling from single-color time-resolved measurements, obtaining results fully compatible with our conclusions (0.5 in La1.85Sr0.15CuO4 and 0.25 in YBa2Cu3O6.5). Using the solution of the Boltzmann equation, the authors of (31) demonstrated that the quasi-thermal models overestimate of a factor 8/5, in the extreme case /. In our case, the fit of the 4 temperature model to the time-resolved data gives =0.37 that, divided by 8/5, becomes 0.23, well within the error bars (=0.40.2) reported in our work. In conclusion, the large error bars associated to the values of and include: i) the experimental uncertainty in the pump fluence; ii) the possibility of adding to the 4TM a term that accounts for the anharmonic coupling of and the lattice; iii) the possibility of the failure of the 4TM in the extreme case .
Equilibrium dielectric function
Figure S1 reports the ab-plane reflectivity, as measured at 300 K on optimally doped Bi2Sr2Ca0.92Y0.08Cu2O8+δ (Y-Bi2212) high-quality crystals (Tc=96 K), by conventional spectroscopic ellipsometry (21). The dielectric function has been obtained by applying the Kramers-Kronig relations to the reflectivity for 50 cm-1/26000 cm-1 and directly from ellipsometry for 1500 cm-1/236000 cm-1. This combination allows a very accurate determination of in the entire combined frequency range. Due to the off-normal angle of incidence used with ellipsometry, the ab-plane pseudo-dielectric function had to be corrected for the c-axis admixture.
The solid black line in the Fig. S1 is the fit to the data of an extended Drude model, describing the strong coupling of the free carriers with the bosonic excitations, and a sum of Lorentz oscillators accounting for the interband optical transitions in the visible region (19).
Within the extended Drude model, a simplified expression of is obtained (32) in terms of the one-particle self-energy, by omitting the vertex corrections (Migdal approximation):
where is the plasma frequency and the Fermi distribution at temperature . and are the electron and hole self-energies (obtained by averaging over the Fermi surface and assuming a constant density of states) (24):
where is a material-independent kernel function accounting for the thermal excitations of the glue and the QPs.
The normal-incidence reflectivity is calculated from Eq. S7 through the relation:
is directly determined fitting the reflectivity obtained from Eq. S7-S9 to the optical spectra reported in the Fig. S1.
Differential fitting procedure
The relative reflectivity variation, i.e. , is a functional of (=,,) (see Eqs. S7, S9) and of , that are the parameters determining the temporal evolution of through the four-temperature model described in the previous section of the Methods. The different contributions to are extracted fitting to the time- and frequency-resolved reflectivity data, reported in Figure 2.
Considering that the energy distribution of phonons is limited to 90 meV, we assume that, for 90 meV, . Within this assumption, the functional dependence of on is simplified as a parametric dependence on the coefficients , where =90 meV)+90 meV), =90 meV) and =90 meV).
Considering the constraints given by the relations = ( being the generic function expressing the dependence on the parameters contained in Eqs. S7-S9) and = ( being the total glue function reported in the Figure 2), the free parameters of the fitting are four. From the fit to the rise time of the time-resolved signal, it is possible to obtain an upper limit to the value of the specific heat of the electronic excitations, i.e., 0.1. Fixing the values /==10-4 Jcm-3K-2 and =2.27 Jcm-3K-1, we are able to simultaneously perform the fit to the data reported in the Figure S1 in the time and frequency domain with only two free parameters, i.e. and any of the . Furthermore, the small influence of the variations of on the fit results (i.e. ), significantly narrows the parameters phase-space of the model, allowing to unambiguously haul out the different contributions to .
To carry out a quantitative and reliable analysis of the results, both the finite lateral dimension of the probe beam and the inhomogeneous excitation of the pump pulse, related to the finite penetration depth, have been accounted for. Considering a pump pulse of energy and a probe pulse with gaussian shapes in the radial coordinate, the measured reflectivity variation is given by:
=FWHM/2 being the lateral size of the probe(pump) beam. As compared to the reflectivity variation calculated for a homogeneous excitation with a surface density of 4/FWHM2, the measured is suppressed of a factor ln2FWHMpu2/(FWHMpu2+FWHMpr2).
The role of the finite penetration depth of the pump pulse (=160 nm @ 1.55 eV) is accounted for numerically calculating through a transfer matrix method, when a graded index of the variation of the refractive index with exponential profile, i.e. = ( being the penetration depth of the pump pulse), is assumed.
Supplementary References
34. D. Fournier et al. Nature Physics 6, 905 (2010).
35. V.V Kabanov and A.S. Alexandrov, Phys. Rev. B 78, 174514 (2008).