All-sky search for gravitational-wave bursts in the second joint LIGO-Virgo run
Abstract
We present results from a search for gravitational-wave bursts in the data collected by the LIGO and Virgo detectors between July 7, 2009 and October 20, 2010: data are analyzed when at least two of the three LIGO-Virgo detectors are in coincident operation, with a total observation time of 207 days. The analysis searches for transients of duration s over the frequency band 64–5000 Hz, without other assumptions on the signal waveform, polarization, direction or occurrence time. All identified events are consistent with the expected accidental background. We set frequentist upper limits on the rate of gravitational-wave bursts by combining this search with the previous LIGO-Virgo search on the data collected between November 2005 and October 2007. The upper limit on the rate of strong gravitational-wave bursts at the Earth is 1.3 events per year at 90% confidence. We also present upper limits on source rate density per year and for sample populations of standard-candle sources. As in the previous joint run, typical sensitivities of the search in terms of the root-sum-squared strain amplitude for these waveforms lie in the range Hz-1/2 to Hz-1/2. The combination of the two joint runs entails the most sensitive all-sky search for generic gravitational-wave bursts and synthesizes the results achieved by the initial generation of interferometric detectors.
pacs:
04.80.Nn, 07.05.Kf, 95.30.Sf, 95.85.Sz∗The LIGO Scientific Collaboration and †The Virgo Collaboration
I Introduction
Astrophysical sources of transient gravitational waves (duration of 1 s) Cutler and Thorne (2002) include merging compact binary systems consisting of black holes and/or neutron stars Pretorius (2009); Etienne et al. (2008), core-collapse supernovae Ott (2009), neutron star collapse to black holes Baiotti et al. (2007), star-quakes associated with magnetar flares Mereghetti (2008) or pulsar glitches Andersson and Comer (2001), cosmic string cusps Damour and Vilenkin (2001), and other violent events in the Universe. Since many classes of gravitational-wave (GW) bursts cannot be modeled well – if at all – a search for those sources must be sensitive to the widest possible variety of waveforms.
This paper reports on a search for GW bursts occurring during the second joint observation run of the LIGO Abbott et al. (2009a) and Virgo Acernese et al. (2006) detectors, which took place in 2009–2010. This search makes no prior assumptions on source sky location, signal arrival time, or the waveform itself. Event rate upper limits from long-term searches of this category have been derived with networks of resonant bar detectors with spectral sensitivity limited to around 900 Hz in 1997–2000 Allen et al. (2000); Astone et al. (2003) and in 2005–2007 Astone et al. (2007, 2010). Networks of interferometric detectors set more stringent upper limits for GW bursts on a wider bandwidth using the LIGO detectors in 2005–2006 Abbott et al. (2007, 2009b, 2009c) and during the first joint observation of LIGO and Virgo detectors in 2007 Abadie et al. (2010a).
This second joint LIGO-Virgo search for GW bursts analyzed the frequency band spanning 64–5000 Hz. We achieved a frequency-dependent sensitivity comparable to or better than that of the first joint run, and accumulated days of observation time interlaced with periods of installing or commissioning major hardware upgrades. Moreover, for the first time a low-latency analysis was run with the goal of providing triggers for electromagnetic follow-ups of candidates by robotic optical telescopes The LIGO Scientific Collaboration et al. (2011), radio telescopes, and the Swift satellite Gehrels et al. (2004, 2005). In this paper we focus on the final results of the GW stand-alone search, which found no evidence for GW bursts.
This paper is organized as follows. In Section II we describe the second joint scientific run: we report on the LIGO and Virgo instrumental upgrades with respect to the first run and on data quality studies. In Section III we give a brief overview of the search: the search algorithm, background estimation, the simulations and the calibration uncertainties. The signal models (GW waveforms and source populations) we tested are described in Section III.3. The results of the search are presented in Section IV, and astrophysical implications are discussed in Section V. The Appendices provide additional details on data characterization and analysis methods.
II Second LIGO-Virgo Science Run
The network of detectors used in this search comprises the two LIGO 4 km interferometers, denoted “H1” (located in Hanford, WA) and “L1” (Livingston, LA), as well as the Virgo 3 km interferometer, denoted “V1” (close to Pisa, Italy) 111The 2 km detector at the Hanford site (H2) was decommissioned before the second joint LIGO-Virgo run. During previous runs, the latter detector was mainly used to enforce additional event selection criteria by taking advantage of the special relationship for GW signals from the co-located interferometers H1 and H2. .
The LIGO detectors operated from July 7, 2009 to October 20, 2010 in their sixth science run (S6). The Virgo detector operated from July 7, 2009 to January 8, 2010 in its second science run (VSR2) and again from August 11 to October 20, 2010 in its third science run (VSR3).
As in the first joint LIGO-Virgo run Abadie et al. (2010a, b), the operation of three differently oriented and widely separated detectors allows for reasonably complete coverage of the sky for at least one gravitational-wave polarization component as well as the recovery of some source characteristics such as sky location Klimenko et al. (2011); The LIGO Scientific Collaboration et al. (2011); Schutz (2011).
II.1 Detector Upgrades
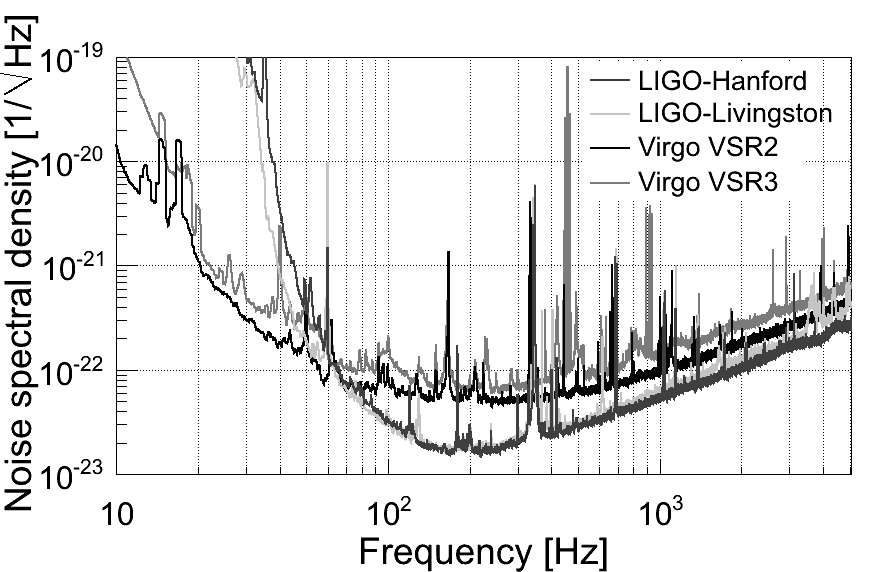
Before the beginning of the runs, several detector hardware upgrades were implemented in order to prototype new subsystems planned for the next generation of detectors, referred to as “advanced detectors” Harry and the LIGO Scientific Collaboration (2010); Acernese et al. (2009), expected to start observations in 2015. The upgrades of the LIGO detectors for S6 include a higher power laser, the implementation of a DC readout system, a new output mode cleaner, and an advanced LIGO seismic isolation table Adhikari et al. (2006). The upgrades of the Virgo detectors were achieved in two steps. For VSR2, Virgo operated with a more powerful laser and a thermal compensation system. Virgo then went offline to undertake a major upgrade of its suspensions, mainly in the installation of new test masses consisting of mirrors hung from fused silica fibers Lorenzini (2010). Virgo resumed observations in August 2010 with VSR3. Best sensitivities, in terms of noise spectral densities, of the LIGO and Virgo detectors achieved during their second joint run (henceforth defined as S6-VSR2/3), as a function of signal frequency, are shown in Figure 1.
II.2 Data Quality
To mitigate the consequences of new hardware installations and detector commissioning during this run, significant effort has been made to identify and characterize instrumental or data acquisition artifacts, periods of degraded sensitivity, or an excessive rate of transient noise due to environmental conditions Abadie et al. . During such times, the data were tagged with Data Quality Flags (DQFs). Following the same approach used in previous searches Abbott et al. (2009b, c); Abadie et al. (2010a), these DQFs are divided into three categories depending on their impact on the search and on the understanding of the behavior of the detector. A further description of DQF categories is presented in Appendix A.
After DQFs have been applied, the total analyzable time for the S6-VSR2/3 run is 242.8 days for H1, 220.2 days for L1, and 187.8 days for V1.
III Search overview
In this analysis, we considered all four available detector network configurations: the three detector network, H1L1V1, and the three combinations of detector pairs, H1L1, H1V1 and L1V1. We decided a priori to search for GW bursts in the entire available time of three-fold observation and in the remaining exclusive times of the two-fold networks. Table 1 reports the total (non-overlapping) coincident observation time for each configuration of detectors searched for GW signals. Information about distinct sub-periods of the run may be found in Appendix C.
Due to the commissioning breaks and installation activities described in Section II, the total observation time is dominated by 2-fold configurations.
| network | H1L1V1 | H1L1 | L1V1 | H1V1 | total |
| observation time [days] | 52.2 | 84.5 | 28.9 | 41.0 | 206.6 |
The useful frequency band is limited to 64–5000 Hz by the sensitivity of the detectors and by the valid range of data calibration. For computational reasons, the event search was performed separately in two suitable bands, 64–2048 Hz and 1600–5000 Hz, overlapping to preserve sensitivity to events with spectral power at intermediate frequencies. The analysis of the events (including the tuning of the search) was performed independently on each configuration of detectors and on three sub-bands, namely 64–200 Hz, 200–1600 Hz and 1600–5000 Hz, by classifying the found events according to their reconstructed central frequency. The motivation for this band splitting is to tune the search within event sets of homogeneous glitch behaviour.
III.1 Search Algorithm
This search is based on the coherent WaveBurst (cWB) algorithm Klimenko et al. (2008), which has been used since LIGO’s fourth science run in various searches for transient GWs Abbott and et. al. (2008); Abbott et al. (2009b, c); Abadie et al. (2010a).
The cWB analysis is performed in several steps. First, detector data is decomposed into a time-frequency representation and then whitened and conditioned to remove narrow-band noise features. Events are identified by clustering time-frequency pixels with significant energy which is coherent among detectors and characterized using test statistics derived from the likelihood (which is also a measure of the signal energy detected in the network and is calculated as described in Abbott et al. (2009b)). The primary statistics are the network correlation coefficient , which is a measure of the degree of correlation between the detectors, and the coherent network amplitude , which is proportional to the signal-to-noise ratio and is used to rank events within a homogeneous sub-period.
Both of these statistics are described in detail in Abbott et al. (2009b). The application of the event selection criteria is thoroughly described in Abadie et al. (2010a); Pankow et al. (2009).
Any gravitational-wave candidate event detected by cWB is subject to additional data-quality vetoes based on statistical correlations between the GW data channel and environmental and instrumental auxiliary channels; a significant correlation indicates the event may have been produced by local noise. Further details can be found in Appendix B .
III.2 Background Estimation and Search Tuning
A sample of “off-source” (background) events is required to determine the selection thresholds to reject noise-induced events contaminating the “on-source” (foreground) measurement. We estimate the distribution of background events by performing the analysis on time-shifted data, typically in s steps. The shifts minimize the chance of drawing an actual GW into the background sample. To accumulate a sufficient sampling, this shifting procedure is performed hundreds or thousands of times without repeating the same relative time shifts among detectors. Background events corresponding to times which are flagged by data quality studies are discarded, just as an event candidate from the foreground would be.
Due to the different characteristics of the background noise for the various sub-periods between commissioning breaks and for the different frequency bands and networks, the thresholds on and are tuned separately for each homogeneous sub-period. Moreover, we consider the action of conditional DQFs (Category 3 DQFs, see Appendix A) on the event significance, by introducing a new ranking scheme which assigns lower significance to events flagged by such DQFs. More details on this procedure are reported in Appendix D.
The thresholds reported in Table 7 are selected to require a false alarm rate (FAR) 1/(8 yr) or lower per frequency band (to be considered as a “warning threshold”), as described in Appendix D. By considering the union of all searches performed (network configurations, sub-periods, and frequency bands) we estimate an overall false alarm probability (FAP) of .
The method to measure the statistical significance of any “on-source” candidate GW event which passes the aforementioned false alarm thresholds was decided a priori, namely performing additional independent time slides to increase the statistics of the background estimates.
III.3 Simulated Signals and Detection Efficiencies
In order to test the sensitivity of our search to gravitational-wave bursts, we add (“inject”) various ad-hoc software signals, both polarized and un-polarized, to the detector data and measure the detection efficiencies of the search. The injected waveforms can be parametrized as:
| (1) |
where is the amplitude, the ellipticity 222For binary sources, the ellipticity is the cosine of the source inclination angle, i.e. the angle between the source rotational axis and the line of sight to Earth. and are the waveforms for the two independent polarizations. In this search, we investigated elliptically polarized signals (i.e. uniformly chosen in ), as well as sets of only linearly or circularly polarized waves ( fixed to or , respectively). A variety of GW signal morphologies spanning a wide range of signal durations, frequencies and amplitudes were tested. See Figure 2 for a sample of representative waveforms from various families and Tables 2, 3, 4 for the chosen waveform parameters.

The injected waveform families include:
-
•
Sine-Gaussian:
(2) (3) where . We consider waveforms of this type with central frequencies chosen between 70 to 5000 Hz and quality factors . Sine-Gaussian waveforms with a few cycles are qualitatively similar to signals produced by the mergers of two black holes Pretorius (2009).
-
•
Gaussian:
(4) (5) where the duration parameter is chosen to be one of 0.1, 1.0, 2.5, or 4.0 ms.
-
•
Ring-down waveforms:
(6) (7) We use several central frequencies from 1590 Hz to 3067 Hz, and decay times s or . Ring-downs can occur in the end stages of black hole binary mergers. Longer duration ring-downs are also similar to signals predicted from the excitation of fundamental modes in neutron stars Benhar et al. (2004).
-
•
Band-limited white noise signals:
The polarization components are bursts of uncorrelated band-limited white noise, time shaped with a Gaussian profile; and have — on average — equal RMS amplitudes and symmetric shape about the central frequency (see Figure 2). -
•
Neutron star collapse waveforms:
For a comparison with previous searches Abbott et al. (2009c); Abadie et al. (2010a), we considered numerical simulations by Baiotti et al. Baiotti et al. (2007), who modeled neutron star gravitational collapse to a black hole and the subsequent ring-down. As in previous searches, we chose the models D1 (a nearly spherical 1.67 M⊙ neutron star) and D4 (a 1.86 M⊙ neutron star that is maximally deformed at the time of its collapse into a black hole) to represent the extremes of the parameter space in mass and spin considered in the aforementioned work. Both waveforms are linearly polarized ( = 0) and their emission is peaked at a few kHz.
The simulated signals were injected with many amplitude scale factors to trace out the detection efficiency as a function of signal strength. The amplitude of the signal is expressed in terms of the root-sum-square strain amplitude () arriving at the Earth, defined as:
| (8) |
The signal amplitude at a detector is modulated by the detector antenna pattern functions, expressed as follows:
| (9) |
where and are the antenna pattern functions, which depend on the orientation of the wavefront relative to the detector, denoted here in terms of the sky position (), and on the polarization angle . The sky positions of simulated signals are distributed isotropically and polarization angles are chosen to be uniformly distributed. The detection efficiency is defined as the fraction of signals successfully recovered using the same selection thresholds and DQFs as in the actual search. The detection efficiency of the search depends on the network configuration and the selection cuts used in the analysis.
Detection efficiencies for the H1L1V1 network for selected waveforms as a function of signal amplitude and as a function of distance (for the D1 and D4 waveforms from Baiotti et al. Baiotti et al. (2007)) are reported in Figures 3 and 4 , respectively. As in the previous joint run, typical sensitivities for this network in terms of for the selected waveforms lie in the range Hz-1/2 to Hz-1/2; typical distances at detection efficiency for neutron star collapse waveforms lie in the range pc to pc.
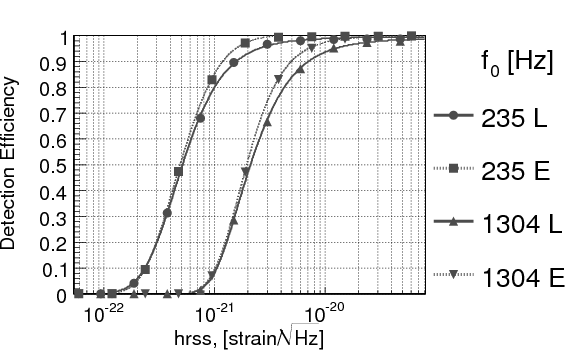
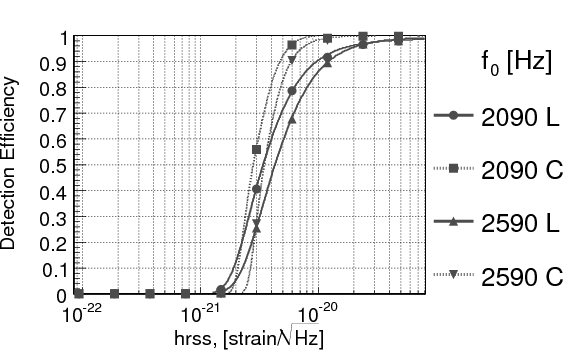
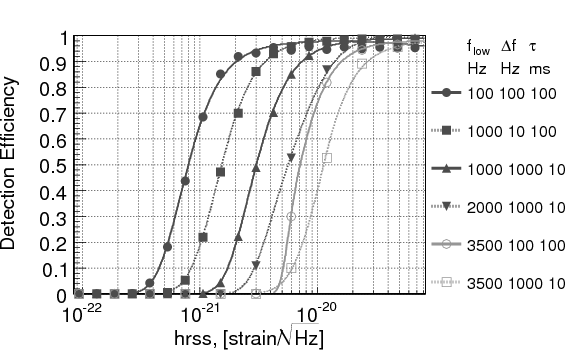
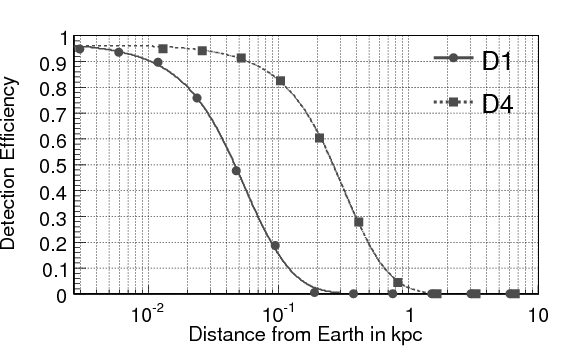
Two convenient characterizations of the sensitivity, the at 50% and 90% detection efficiency ( and respectively) are obtained from fitting the efficiency curves and are reported in Tables 2, 3, and 4 for the various families. Notice that the 3-fold network, H1L1V1, has a better sensitivity than the weighted average over all networks: 2-fold networks have of the analyzed live time, but feature a lower sensitivity.
| H1L1V1 | all networks | ||||||
|---|---|---|---|---|---|---|---|
| Linear | Elliptical | Linear | Elliptical | ||||
| Hz | |||||||
| 70 | 3 | 18.9 | 18.0 | 28.4 | 311.9 | 23.2 | 92.7 |
| 70 | 9 | 21.5 | 20.4 | 31.6 | 269.4 | 25.8 | 91.7 |
| 70 | 100 | 24.2 | 21.4 | 34.4 | 484.9 | 27.4 | 131.9 |
| 100 | 9 | 10.5 | 9.6 | 15.6 | 156.6 | 12.6 | 57.6 |
| 153 | 9 | 6.7 | 5.8 | 10.3 | 105.4 | 8.0 | 35.2 |
| 235 | 3 | 5.7 | 5.5 | 8.5 | 45.3 | 7.4 | 24.4 |
| 235 | 9 | 5.2 | 4.9 | 7.7 | 39.7 | 6.6 | 20.7 |
| 235 | 100 | 4.6 | 4.4 | 7.2 | 37.6 | 6.0 | 19.0 |
| 361 | 9 | 8.6 | 8.7 | 12.4 | 67.8 | 11.1 | 32.7 |
| 554 | 9 | 8.9 | 8.4 | 13.1 | 69.4 | 11.1 | 35.2 |
| 849 | 3 | 15.1 | 14.4 | 20.8 | 128.7 | 18.4 | 56.6 |
| 849 | 9 | 14.1 | 13.3 | 19.7 | 116.0 | 17.2 | 52.0 |
| 849 | 100 | 12.3 | 11.4 | 17.4 | 88.7 | 14.8 | 44.9 |
| 1053 | 9 | 16.9 | 17.5 | 24.2 | 133.5 | 21.9 | 63.9 |
| 1304 | 9 | 21.1 | 19.7 | 30.4 | 177.9 | 25.3 | 78.6 |
| 1615 | 3 | 41.6 | 54.5 | 349.8 | |||
| 1615 | 9 | 35.2 | 46.3 | 259.9 | |||
| 1615 | 100 | 28.3 | 38.8 | 219.3 | |||
| 1797 | 9 | 26.8 | 35.4 | 206.0 | |||
| 2000 | 3 | 41.6 | 51.8 | 322.9 | |||
| 2000 | 9 | 30.8 | 38.7 | 229.1 | |||
| 2000 | 100 | 27.4 | 36.0 | 181.8 | |||
| 2226 | 9 | 36.6 | 47.2 | 272.1 | |||
| 2477 | 3 | 51.6 | 61.2 | 425.9 | |||
| 2477 | 9 | 44.3 | 55.2 | 307.3 | |||
| 2477 | 100 | 34.6 | 46.3 | 233.5 | |||
| 2756 | 9 | 44.2 | 56.8 | 389.8 | |||
| 3067 | 3 | 74.1 | 81.7 | 600.0 | |||
| 3067 | 9 | 64.6 | 78.0 | 499.6 | |||
| 3067 | 100 | 41.1 | 53.8 | 278.2 | |||
| 3413 | 9 | 65.7 | 80.0 | 510.4 | |||
| 3799 | 9 | 81.7 | 99.3 | 719.9 | |||
| all networks | |||||
| Linear | Circular | ||||
| Hz | ms | ||||
| 2000 | 1.0 | 47.3 | 288 | 34.8 | 78.9 |
| 2090 | 200 | 42.9 | 218 | 31.7 | 66.0 |
| 2590 | 200 | 52.2 | 255 | 39.1 | 79.5 |
| 3067 | 0.65 | 91.9 | 546 | 72.9 | 569 |
| H1L1V1 | all networks | ||||
| Hz | Hz | ms | |||
| 100 | 100 | 100 | 8.1 | 11.5 | 91.2 |
| 250 | 100 | 100 | 7.5 | 10.5 | 43.1 |
| 1000 | 10 | 100 | 15.5 | 22.5 | 93.6 |
| 1000 | 1000 | 10 | 30.5 | 39.7 | 130 |
| 1000 | 1000 | 100 | 76.8 | 76.7 | 492 |
| 2000 | 100 | 100 | 35.7 | 40.3 | 193 |
| 2000 | 1000 | 10 | 55.6 | 63.1 | 211 |
| 3500 | 100 | 100 | 71.8 | 90.3 | 332 |
| 3500 | 1000 | 10 | 114 | 125 | 371 |
III.4 Systematic Uncertainties
The most relevant systematic uncertainty in the astrophysical interpretation of our results is due to the calibration error on the strain data produced by each detector Abadie et al. (2010d); Accadia et al. (2011). The effect of calibration systematics on network detection efficiency has been estimated by dedicated simulations of GW signals in which the signal amplitude and phase at each detector is randomly jittered according to the modeled distribution of calibration errors for that detector. The resulting network detection efficiency marginalizes the effect of the systematic uncertainties over the observation time. The main effect can be parametrized as an overall shift of the detection efficiency curves along the signal strength axis. The largest effect over the injected signal waveforms was a increase of the amplitude at fixed detection efficiency 333Note that, due to an incomplete knowledge of the actuation resonances in [3000,4000] Hz band of the Hanford detector, very conservative assumptions have been made on calibration uncertainties; the networks including H1 in that frequency band feature a large efficiency loss due to calibration systematics of . . To produce the astrophysical limits shown in Section IV, we use the reduced detection efficiency curves obtained by shifting the original fits from Subsection III.3 and the results in Tables 2, 3, and 4 to larger values.
IV Search Results
The on-source data have been analyzed following the procedures tuned through the investigation of the off-source background sample, as described in Appendix D. No on-source event has been found above the threshold false alarm rate of once in 8 years per frequency band, and the distribution of on-source events is in agreement with the measured background. Table 5 lists the five most significant on-source events, as ranked by their Inverse False Alarm Rate (IFAR = 1/FAR), and taking into account the trial factor due to the three independent searches performed on the disjoint frequency bands.
In addition to the events reported in Table 5, this search also detected an on-source event showing a chirping waveform compatible with a compact binary coalescence at a signal-to-noise ratio in the H1L1V1 network. This event was first identified by a low-latency burst search within minutes of its occurrence on September 16, 2010 and was thoroughly investigated in follow-up studies. Its Inverse False Alarm Rate was estimated at 1.1 yr from comparison with the burst reference background over all trials. After the completion of the analysis, this event was revealed to be a blind hardware injection Open web page intended as an end-to-end test of the search for transient signals 444 Signal injections were performed via direct excitation of the interferometer mirror test masses. Some of these hardware injections were intended to mimic a coherent GW excitation across the network and to provide an end-to-end verification of the detector instrumentation, the data acquisition system and the data analysis software. In addition to those, a blind injection challenge was realized consisting of injecting a few simulated signals at times not announced to the collaborations. This was done for the purpose of testing the data analysis pipelines and event validation protocols.. As such, the event was removed from the final results.
| IFAR [yr] | freq. band | network | SNR | FAP |
|---|---|---|---|---|
| 0.64 | 0.2-1.6 kHz | H1L1 | 11 | 0.59 |
| 0.36 | 64-200 Hz | H1L1V1 | 19 | 0.47 |
| 0.28 | 0.2-1.6 kHz | H1L1 | 12 | 0.33 |
| 0.19 | 0.2-1.6 kHz | H1L1 | 10 | 0.35 |
| 0.17 | 1.6-5 kHz | H1V1 | 9 | 0.24 |
IV.1 Upper Limits
The new null result can be combined with the previous ones from the latest scientific runs by LIGO and Virgo Abbott et al. (2009b, c); Abadie et al. (2010a) to complete the results achieved by initial generation interferometric detectors.
Assuming a Poisson distribution of astrophysical sources and in the special case of no surviving candidate events, the 90% confidence upper limit is computed as
| (10) |
where 2.3 = - log(1 - 0.9), and are respectively the detection efficiency and the observation time of the different network configurations in homogeneous sub-periods of observation Sutton (2010), including all available LIGO and LIGO–Virgo observations since November 2005 Abbott et al. (2009b, c); Abadie et al. (2010a).
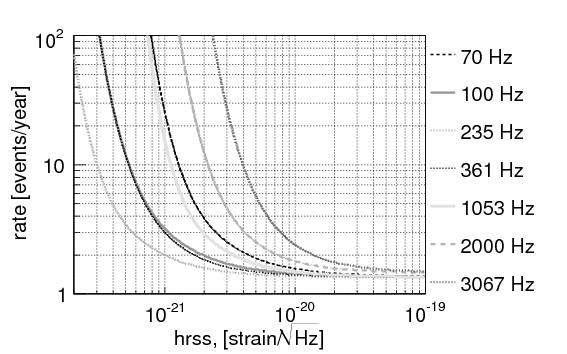
Figure 5 shows the upper limits on the rate of gravitational-wave bursts at the Earth as a function of signal strength () for selected sine-Gaussian waveforms. The second joint LIGO–Virgo run increases the previous total observation time by roughly 50%, totaling . Therefore, the resulting 90% upper limit on the rate for strong signals (asymptotic behaviour for ) decreases from to for the 64 – 1600 Hz band (from to for the band above 1.6 kHz).
The results can also be interpreted as limits on the rate density of GW bursts (number per year and per ) assuming a standard-candle source, isotropically distributed, as previously reported in Abadie et al. (2010a). Denoting by the average value of the GW squared amplitude at a fiducial distance from the source, the energy converted to GWs is
| (11) |
where is the central frequency of GW emission.
Considering a population of standard-candle sources randomly oriented with respect to the Earth and at a distance , we can interpret the as the average GW squared amplitude impinging on the Earth (e.g. averaged over source parameters such as inclination angle). Equation 11 can then be used to estimate and in particular sets the inverse proportionality between the average at Earth and source distance : . Assuming a uniform distribution in the sky and in time of these standard-candle sources, the expected rate of detections is
| (12) | |||||
where is the rate density of the standard-candle sources, the overall observation time, and the detection efficiency as measured by our simulations.
Hence, the 90% confidence upper limit on rate density of such standard-candle sources is
| (13) |
The resulting is dominated by the part of the detection efficiency curve at small GW amplitude . Due to the relative orientations of the LIGO-Virgo detectors, detection efficiency curves for linearly polarized sine-Gaussian waveforms are approximately the same of those for elliptically polarized ones; the numerical values of are close within a few percent for both source models.
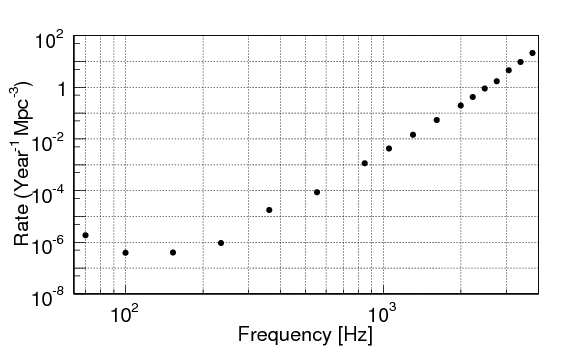
Figure 6 shows the rate density upper limits of sources as a function of frequency. This result can be interpreted in the following way: given a standard-candle source with a characteristic frequency and energy , the corresponding rate limit is .
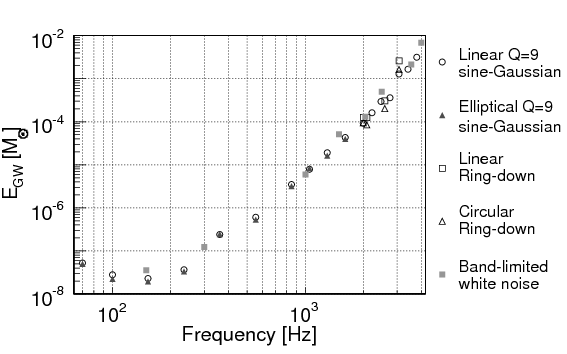
The typical GW energy in units of solar masses for LIGO-Virgo observation is shown in Figure 7 computed with Equation 11 using the measured at 50% detection efficiency for the tested waveforms assuming a standard candle source emitting at a distance of 10 kpc. The mass scales with the square of the fiducial distance and the results are robust over the very wide class of waveforms tested. As expected, the GW energy is strongly dependent on the spectral sensitivity of the network, with a negligible dependence on the specific waveform characteristics.
V Summary and Discussion
This paper reports the results achieved by the LIGO and Virgo detectors in the search for GW transients of duration s, without assumptions on the signal waveform, polarization, direction or arrival time.
Three detectors were operating at the Hanford, Livingston and Pisa sites during the second joint observation of LIGO and Virgo in 2009-2010. The detectors implemented hardware upgrades in order to prototype new subsystems planned for the upcoming advanced detectors. The resulting sensitivities to GWs were comparable to those achieved during the first LIGO-Virgo run. The main contribution of the second run is a increase in accumulated observation time.
No event candidates were found in this search. We set better upper limits on the rate of gravitational-wave bursts at Earth and on the rate density of burst sources per unit time and volume. These limits combine all available information from the LIGO–Virgo joint runs and set the state-of-the-art on all-sky searches for transient gravitational waves of short duration.
The reported amplitude of the GW at Earth can be converted into the energy emitted by a source at some fiducial distance assuming a simple model as in Equation 11. For example, the energy emitted in gravitational waves in units of solar masses at a distance of 10 kpc and considering measured at 50% detection efficiency (Table 2) is for signal frequencies near 150 Hz ( at 16 Mpc). These GW energies, though obviously depending on the signal frequency, are approximately constant over different polarization models of the GW emission, including linearly polarized sources, circularly polarized sources and un-polarized emission with random polarization amplitudes (see Tables 2, 3, and 4).
The long baseline interferometric detectors LIGO and Virgo are currently being upgraded to their advanced configurations, and the next joint observation is planned for 2015. Another advanced detector, LCGT Uchiyama et al. (2004); Kuroda (2010), is being built in Japan, and there are proposals to realize an additional advanced LIGO detector outside the USA. These advanced detectors should achieve strain sensitivities a factor of ten better than the first-generation detectors. For example, at design sensitivity these detectors should detect a typical core-collapse supernova anywhere in the galaxy Yakunin et al. (2010) and will be able to put constraints on extreme scenarios for core collapse supernovae within the Local Group Ott (2009); Fryer and New (2011). Other possible short duration sources, such as the merger of very high mass stellar black hole binaries, could be visible at distances exceeding 1 Gpc. During advanced detector observations, gravitational-wave detections are predicted to occur on a regular basis Abadie et al. (2010e), thus greatly expanding the field of gravitational-wave astrophysics.
Acknowledgements.
The authors gratefully acknowledge the support of the United States National Science Foundation for the construction and operation of the LIGO Laboratory, the Science and Technology Facilities Council of the United Kingdom, the Max-Planck-Society and the State of Niedersachsen/Germany for support of the construction and operation of the GEO 600 detector, and the Italian Istituto Nazionale di Fisica Nucleare and the French Centre National de la Recherche Scientifique for the construction and operation of the Virgo detector. The authors also gratefully acknowledge the support of the research by these agencies and by the Australian Research Council, the Council of Scientific and Industrial Research of India, the Istituto Nazionale di Fisica Nucleare of Italy, the Spanish Ministerio de Educación y Ciencia, the Conselleria d’Economia Hisenda i Innovació of the Govern de les Illes Balears, the Foundation for Fundamental Research on Matter supported by the Netherlands Organisation for Scientific Research, the Polish Ministry of Science and Higher Education, the FOCUS Programme of Foundation for Polish Science, the Royal Society, the Scottish Funding Council, the Scottish Universities Physics Alliance, the National Aeronautics and Space Administration, the Carnegie Trust, the Leverhulme Trust, the David and Lucile Packard Foundation, the Research Corporation, and the Alfred P. Sloan Foundation. This document has been assigned LIGO Laboratory document number LIGO-P1100118-v16.Appendix A Data Quality Flags
Data Quality Flags (DQFs) are intended to indicate periods of data taking which suffer from environmental and instrumental effects inducing noise into the data Abadie et al. . We followed the DQF strategy used in previous searches Abbott et al. (2009b, c); Abadie et al. (2010a), organizing DQFs into 3 categories. The different categories reflect the level of understanding of the detectors’ performances as well as of the relation between disturbances in the data set and environmental or instrumental causes.
Category 1 DQFs mark segments of time (typically more than tens of seconds) when disturbances make analysis unfeasible. Data segments remaining after their application are used in the analysis.
Category 2 DQFs are connected to well-understood short duration (typically a few seconds) periods of noise transients. Data segments flagged by this category can be used for data conditioning and noise property estimation, but events emerging from these periods are discarded as very likely originating from the detector environment.
Finally, Category 3 DQFs denote periods that are only weakly correlated to environmental and instrumental monitors. Such cuts are not reliable enough to be used as unconditional cuts. When applied to events generated by the search algorithm, they would reject a significant fraction (in extreme cases up to 15-20%) of data. Their use is limited to significance calculations using the MIFAR statistic (see Appendix D).
Appendix B Event-by-event vetoes
Often, GW candidate events identified in the on-source time can be linked to disturbances propagating through the detector from the environment or within the detector itself. Our procedure for identifying such event-by-event vetoes in S6 and VSR2/3 follows that used in S5 and VSR1 Abbott et al. (2009b); Abadie et al. (2010a). The GW channel and a large number of auxiliary channels are processed with the Kleine-Welle Chatterji et al. (2004) algorithm, which looks for excess power transients. A hierarchical method Smith et al. (2011) is used to rank the statistical relationship between the transients found in the auxiliary channels and those found in the detector output. Based on these rankings, vetoes are defined for suspected noise events. Another veto used was based on significant statistical association of events observed in the GW channel and the auxiliary channels Isogai et al. (2010) .
An additional set of Category 3 vetoes Ballinger (2009) are applied to events emerging from networks including Virgo; vetoes from this set are based on detector read-out channels which are known to be insensitive to gravitational waves.
Procedurally, the event-by-event vetoes are applied with the same conditions as their corresponding Category of data quality flags described in Appendix A.
Appendix C Detector networks and live times
The total observation time for the analysis has been divided into four sub-periods (labeled A, B, C and D), separated by planned commissioning and upgrade breaks which changed the performance of the detectors. Table 6 shows the observation time of each network configuration after the application of Category 1 and 2 DQFs. These times are not overlapping. During the period from January to June 2010 (sub-period C), Virgo did not participate in the run because of hardware upgrades.
| detectors | A [days] | B [days] | C [days] | D [days] | TOT [days] |
| H1L1V1 | 10.6 | 16.7 | - | 24.9 | 52.2 |
| H1L1 | - | 6.2 | 51.4 | 26.8 | 84.5 |
| L1V1 | 10.2 | 10.7 | - | 8.1 | 28.9 |
| H1V1 | 12.6 | 21.3 | - | 7.1 | 41.0 |
| TOT | 33.4 | 54.8 | 51.4 | 66.9 | 206.6 |
Appendix D Modified Inverse False Alarm Rate (MIFAR)
We introduce the Modified Inverse False Alarm Rate (MIFAR) to account for the effect of Category 3 DQFs on the background.
Category 3 DQFs indicate a weak statistical correlation of the GW data with environmental and instrumental noise sources, and thus were used only as a cautionary tag when examining an event in candidate follow-ups. Moreover, the effectiveness of these flags is not constant between different sub-periods, network configurations or frequency bands. The use of Category 3 data quality as a tag allows us to produce two sets of events: the “raw” set (polluted to some extent by noise glitches) and the subset of those events that are not tagged, the “clean” set (with reduced observation time).
In order to account for the difference in background distributions when assessing the significance of candidate GW events from the raw and clean sets, we use the following procedure:
-
1.
Within each homogeneous analysis (same detector’s configuration, same tuning of analysis, same frequency band), we rank events from the two sets separately by their coherent network amplitude ; i.e., if the event candidate is flagged by Category 3 data quality, it is ranked against the raw set of events, otherwise it is ranked against the clean set.
-
2.
Each event is then assigned a MIFAR as the inverse of the rate of higher-ranked background events in that set, i.e. the MIFAR is the IFAR of the event considering only that set.
-
3.
We merge the events from the raw and clean sets into a single list, sorted by the MIFAR. For events with equal MIFAR the one with larger is ranked higher. This ranking is performed separately for each homogeneous analysis.
-
4.
According to this merged ranking, we measure the IFAR of the events as the rate of the corresponding background event with equal MIFAR. This measured IFAR is used as our “universal” ranking for all events in all analyses.
-
5.
The final IFAR of any event over the entire search is just 1/3 of the value estimated in the previous step because of the trials factor: three independent analyses have been performed for the three disjoint frequency bands. No contribution to the trials factor comes from the analyses of different detectors’ configuration since these were performed on non-overlapped observation times.
In each homogeneous analysis, setting a threshold on IFAR corresponds to two thresholds on , one for the raw set and one for the clean data set. Table 7 reports the selected thresholds. These thresholds were tuned using the background and injection events, without considering the on-source events to avoid bias in candidate selection.
| Frequency Band [Hz] | ||||||||||
| network | 64–200 | 200–2000 | 2000–5000 | |||||||
| A | 0.70 | 5.9 | - | 0.70 | 6.0 | - | 0.65 | 4.6 | - | |
| H1L1V1 | B | 0.60 | 6.5 | 6.5 | 0.60 | 4.6 | 3.9 | 0.60 | 3.9 | - |
| D | 0.60 | 6.7 | 4.7 | 0.60 | 4.5 | 4.3 | 0.60 | 4.7 | 4.4 | |
| H1L1 | A | 0.65 | 32.0 | - | 0.65 | 7.4 | - | 0.65 | 5.8 | - |
| B | 0.60 | 8.5 | 8.1 | 0.60 | 5.5 | 5.5 | 0.60 | 4.7 | - | |
| C | 0.60 | 8.8 | 6.4 | 0.60 | 6.4 | 5.5 | 0.60 | 4.6 | - | |
| D | 0.60 | 8.9 | 8.9 | 0.60 | 12.9 | 9.9 | 0.60 | 4.7 | 4.6 | |
| 0.60 | 5.1 | 4.8 | ||||||||
| A | 0.65 | 16.8 | - | 0.65 | 6.0 | - | 0.65 | 5.5 | - | |
| L1V1 | B | 0.60 | 5.8 | 5.8 | 0.60 | 6.4 | 5.0 | 0.60 | 4.6 | - |
| D | 0.60 | 17.0 | 17.0 | 0.60 | 10.3 | 10.3 | 0.60 | 7.3 | 6.9 | |
| A | 0.65 | 10.2 | - | 0.65 | 5.2 | - | 0.65 | 5.4 | - | |
| H1V1 | B | 0.60 | 6.3 | 5.3 | 0.60 | 5.2 | 5.0 | 0.60 | 4.4 | - |
| D | 0.60 | 9.1 | 9.0 | 0.60 | 6.1 | 6.1 | 0.60 | 6.3 | 6.2 | |
References
- Cutler and Thorne (2002) C. Cutler and K. S. Thorne, in Proceedings of GR16, edited by N. T. Bishop and S. D. Maharaj (WorldScientific, Singapore, 2002), eprint gr-qc/0204090.
- Pretorius (2009) F. Pretorius, in Physics of Relativistic Objects in Compact Binaries: from Birth to Coalescence, edited by M. Colpi et al. (Springer Verlag, Canopus Publishing Limited, 2009), eprint arXiv:0710.1338.
- Etienne et al. (2008) Z. B. Etienne et al., Phys. Rev. D 77, 084002 (2008), eprint arXiv:0712.2460.
- Ott (2009) C. D. Ott, Class. Quantum Grav. 26, 063001 (2009).
- Baiotti et al. (2007) L. Baiotti et al., Class. Quantum Grav. 24, S187 (2007).
- Mereghetti (2008) S. Mereghetti, Astron. Astrophys. Rev. 15, 225 (2008).
- Andersson and Comer (2001) N. Andersson and G. L. Comer, Phys. Rev. Lett. 87, 241101 (2001).
- Damour and Vilenkin (2001) T. Damour and A. Vilenkin, Phys. Rev. D 64, 064008 (2001).
- Abbott et al. (2009a) B. Abbott et al. (LIGO Scientific Collaboration), Rept. Prog. Phys. 72, 076901 (2009a), eprint arXiv:0711.3041.
- Acernese et al. (2006) F. Acernese et al., Journal of Physics: Conference Series 32, 223 (2006), URL http://stacks.iop.org/1742-6596/32/i=1/a=033.
- Allen et al. (2000) Z. A. Allen et al. (International Gravitational Event Collaboration), Phys. Rev. Lett. 85, 5046 (2000).
- Astone et al. (2003) P. Astone et al. (International Gravitational Event Collaboration), Phys. Rev. D 68, 022001 (2003), eprint astro-ph/0302482.
- Astone et al. (2007) P. Astone, D. Babusci, L. Baggio, M. Bassan, M. Bignotto, M. Bonaldi, M. Camarda, P. Carelli, G. Cavallari, M. Cerdonio, et al. (IGEC-2 Collaboration), Phys. Rev. D 76, 102001 (2007), URL http://link.aps.org/doi/10.1103/PhysRevD.76.102001.
- Astone et al. (2010) P. Astone, L. Baggio, M. Bassan, M. Bignotto, M. Bonaldi, P. Bonifazi, G. Cavallari, M. Cerdonio, E. Coccia, L. Conti, et al. (IGEC-2 Collaboration), Phys. Rev. D 82, 022003 (2010), URL http://link.aps.org/doi/10.1103/PhysRevD.82.022003.
- Abbott et al. (2007) B. Abbott et al. (LIGO Scientific Collaboration), Class. Quantum Grav. 24, 5343 (2007), eprint arXiv:0704.0943.
- Abbott et al. (2009b) B. P. Abbott et al. (LIGO Scientific Collaboration), Phys. Rev. D 80, 102001 (2009b).
- Abbott et al. (2009c) B. P. Abbott et al. (LIGO Scientific Collaboration), Phys. Rev. D 80, 102002 (2009c).
- Abadie et al. (2010a) J. Abadie et al. (LIGO Scientific Collaboration and Virgo Collaboration), Phys. Rev. D 81, 102001 (2010a).
- The LIGO Scientific Collaboration et al. (2011) The LIGO Scientific Collaboration, Virgo Collaboration: J. Abadie, B. P. Abbott, R. Abbott, T. D. Abbott, M. Abernathy, T. Accadia, F. Acernese, C. Adams, R. Adhikari, et al., ArXiv e-prints (2011), eprint 1109.3498.
- Gehrels et al. (2004) N. Gehrels, G. Chincarini, P. Giommi, K. O. Mason, J. A. Nousek, A. A. Wells, N. E. White, S. D. Barthelmy, D. N. Burrows, L. R. Cominsky, et al., Astrophys. J. 611, 1005 (2004).
- Gehrels et al. (2005) N. Gehrels, G. Chincarini, P. Giommi, K. O. Mason, J. A. Nousek, A. A. Wells, N. E. White, S. D. Barthelmy, D. N. Burrows, L. R. Cominsky, et al., Astrophys. J. 621, 558 (2005).
- Abadie et al. (2010b) J. Abadie et al. (LIGO Scientific Collaboration and Virgo Collaboration), Phys. Rev. D 82, 102001 (2010b), eprint 1005.4655.
- Klimenko et al. (2011) S. Klimenko, G. Vedovato, M. Drago, G. Mazzolo, G. Mitselmakher, C. Pankow, G. Prodi, V. Re, F. Salemi, and I. Yakushin, Phys. Rev. D 83, 102001 (2011).
- Schutz (2011) B. F. Schutz, Classical and Quantum Gravity 28, 125023 (2011), URL http://stacks.iop.org/0264-9381/28/i=12/a=125023.
- Harry and the LIGO Scientific Collaboration (2010) G. M. Harry and the LIGO Scientific Collaboration, Classical and Quantum Gravity 27, 084006 (2010), URL http://stacks.iop.org/0264-9381/27/i=8/a=084006.
- Acernese et al. (2009) F. Acernese et al., Report No. VIR0027A09 (2009), URL https://pub3.ego-gw.it/itf/tds/file.php?callFile=VIR-0027A-09%.pdf.
- Adhikari et al. (2006) R. Adhikari, P. Fritschel, and S. Waldman, Tech. Rep. LIGO-T060156-v1, LIGO Project (2006), URL https://dcc.ligo.org/cgi-bin/DocDB/ShowDocument?docid=7384.
- Lorenzini (2010) M. Lorenzini, Classical and Quantum Gravity 27, 084021 (2010).
- (29) J. Abadie et al. (LIGO Scientific Collaboration and Virgo Collaboration) (in preparation).
- Klimenko et al. (2008) S. Klimenko et al., Class. Quantum Grav. 25, 114029 (2008), eprint arXiv:0802.3232.
- Abbott and et. al. (2008) B. Abbott and et. al., Class. Quant. Grav. 25, 245008 (2008).
- Pankow et al. (2009) C. Pankow, S. Klimenko, G. Mitselmakher, I. Yakushin, G. Vedovato, M. Drago, R. A. Mercer, and P. Ajith, Class. Quant. Grav. 26, 204004 (2009).
- Benhar et al. (2004) O. Benhar, V. Ferrari, and L. Gualtieri, Phys. Rev. D 70, 124015 (2004), eprint arXiv:astro-ph/0407529.
- Abadie et al. (2010d) J. Abadie et al. (LIGO Scientific Collaboration), Nucl. Instrum. Meth. A 624, 223 (2010d), eprint arXiv:1007.3937.
- Accadia et al. (2011) T. Accadia et al. (Virgo Collaboration), Class. Quantum Grav. 28, 025005 (2011), eprint arXiv:1009.5190.
- (36) Open web page, URL http://www.ligo.org/science/GW100916/index.php.
- Sutton (2010) P. J. Sutton, Class. Quantum Grav. 26, 245007 (2010), eprint 0905.4089v2.
- Uchiyama et al. (2004) T. Uchiyama, K. Kuroda, M. Ohashi, S. Miyoki, H. Ishitsuka, K. Yamamoto, H. Hayakawa, K. Kasahara, M. Fujimoto, S. Kawamura, et al., Classical and Quantum Gravity 21, S1161 (2004).
- Kuroda (2010) K. Kuroda, Classical and Quantum Gravity 27, 084004 (2010).
- Yakunin et al. (2010) K. N. Yakunin, P. Marronetti, A. Mezzacappa, S. W. Bruenn, C.-T. Lee, M. A. Chertkow, W. R. Hix, J. M. Blondin, E. J. Lentz, O. E. B. Messer, et al., Classical and Quantum Gravity 27, 194005 (2010).
- Fryer and New (2011) C. L. Fryer and K. C. B. New, Living Reviews in Relativity 14, 1 (2011).
- Abadie et al. (2010e) J. Abadie et al. (LIGO Scientific Collaboration and Virgo Collaboration), Class. Quantum Grav. 27, 173001 (2010e).
- Chatterji et al. (2004) S. Chatterji, L. Blackburn, G. Martin, and E. Katsavounidis, Classical and Quantum Gravity 21, 1809 (2004), eprint arXiv:gr-qc/0412119.
- Smith et al. (2011) J. R. Smith, T. Abbott, E. Hirose, N. Leroy, D. MacLeod, J. McIver, P. Saulson, and P. Shawhan, Classical and Quantum Gravity 28, 235005 (2011), eprint 1107.2948.
- Isogai et al. (2010) T. Isogai et al., in Journal of Physics: Conference Series (IOP Publishing, 2010), vol. 243, p. 012005.
- Ballinger (2009) T. Ballinger, Classical and Quantum Gravity 26, 204003 (2009).