1–12
Far Infrared Luminosity Function of Local
Galaxies in the AKARI Deep Field South
Abstract
We present the first far-infrared luminosity function in the AKARI Deep Field South, a premier deep field of the AKARI Space Telescope, using spectroscopic redshifts obtained with AAOmega. To date, we have found spectroscopic redshifts for 389 galaxies in this field and have measured the local () 90 m luminosity function using about one-third of these redshifts. The results are in reasonable agreement with recent theoretical predictions.
keywords:
galaxies: evolution, galaxies: luminosity function, infrared: galaxies1 AKARI Deep Field South
The AKARI Deep Field South (ADF-S) is centered on RA 4h 44m 00s, Dec -53o 20’ 00” (J2000), and is a low-cirrus (I100μm MJy sr-1) region of about 12 square degrees near the South Ecliptic Pole (Matsuhara et al. 2006). It has been extensively studied over the full area by the AKARI-FIS (at 60, 90, 140, and 160 m, Shirahata et al. 2008), Spitzer (24 and 70 m, Clements et al. 2011), BLAST (250, 350, 500 m, Valiante et al. 2010), and over part of the area by CTIO (UVBRI), AKARI-IRC (7 mid-infrared bands, Pearson et al. in preparation), ATCA (deep radio survey at 1.4 GHz, White et al. 2011), ASTE/AzTEC (1.1 mm, Hatsukade et al. 2011) and APEX/LABOCA (870 m, Khan et al. in preparation). Other work includes CIB detection (Matsuura et al. 2011) and cross-identification with public data and SEDs (Malek et al. 2010). A large part of the field is being mapped by Herschel as part of the HerMES project.
The 90 m catalogue from the AKARI Far Infrared Surveyor (FIS) deep survey lists 2,282 sources at a signal-to-noise ratio SNR (giving a minimum flux of 12.81 mJy). Since this wavelength is within the range at which the re-processed radiation received from dust in Star Forming Galaxies (SFGs) is expected to peak, the evolution of the 90 m luminosity function provides an excellent proxy for the study of star formation.
This poster (which is based on Sedgwick et al. 2011) describes the first luminosity function from this data, for galaxies, and combines this data with earlier ISO data from the ELAIS survey to provide the highest signal-to-noise deep luminosity function at this wavelength to date. We also compare our results with predictions from a recent backward galaxy evolution model, finding a reasonable agreement. Our aim is to provide a local benchmark against which to compare luminosity functions of more distant SFGs based on more detailed, deeper data which will become available in the near future.
2 AAOmega Spectroscopy
We have used AAOmega to obtain spectra of selected infrared and sub-millimetre sources with optical counterparts in 3.14 square degrees in the centre of the ADF-S. Data was obtained between October 2007 and November 2008 and redshifts identified for 389 sources, of which we have used 130 for our luminosity function.
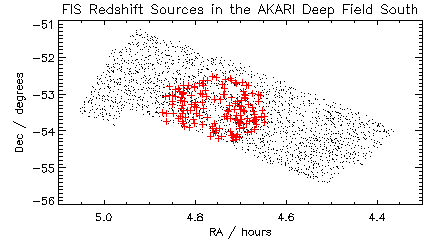
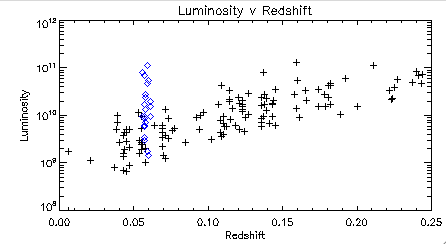
Redshifts were measured using the [NII]/H/[NII], and H/ [OIII]/[OIII] emission lines. Redshifts were only taken where one or other (or both) of these two triplets of emission lines were identified. Unless out of range, the [SII] doublet was also seen. The [OII] emission line resulting from the 3726, 3729 was often found at the same redshift to support the identifications. AGNs and SFGs were segregated using a BPT diagram. Figure 1 (left) shows the redshifts which were used for this paper.
As shown in the luminosity/redshift plot (Figure 1 right), we have identified a new cluster in this field at , centred on RA 4h 42m 12.5s, Dec -53o 30’ 46” which is discussed in Sedgwick et al. (2011) and excluded from the luminosity function.
3 Far-infrared Local Luminosity Function
In the absence of completeness as a function of flux based directly on AKARI data (under construction, Shirahata et al.), we have used the ultra-deep Spitzer 70 m observations of the GOODS-N field which reached down to a flux of 1.2 mJy. Frayer et al. (2006) showed that this is well fitted by the model of Lagache et al. (2004), which we used to generate number counts against which to measure AKARI completeness. We have adjusted for our 90 m case using the model described in Pearson (2001), scaling the fluxes by a factor of 0.673 on the basis of its prediction that N(S70μm Jy) = N(S90μm Jy). In addition, we have estimated spectroscopic completeness by comparing the magnitude distribution of AAOmega redshift sources with that of APM B-magnitude sources which have counterparts in the total ADFS-FIS catalogue. The area of the sample was re-normalised to account for large scale cosmic variance, using the number density of objects Jy in the 50 deg2 SWIRE survey (following the procedure in ELAIS, Serjeant et al. 2001). We calculated the 1/Vmax luminosity function (Schmidt 1968) following the methodology in Serjeant et al. (2004). K-corrections were made assuming the M82 star-forming spectral energy distribution. We have assumed cosmological parameter values of H0=72 kms-1Mpc-1, M=0.3 and Λ=0.7.
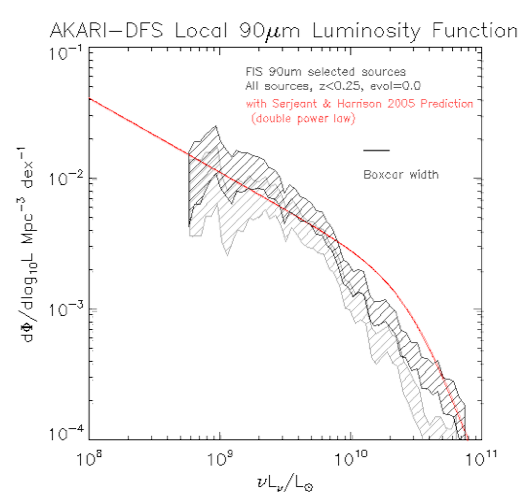
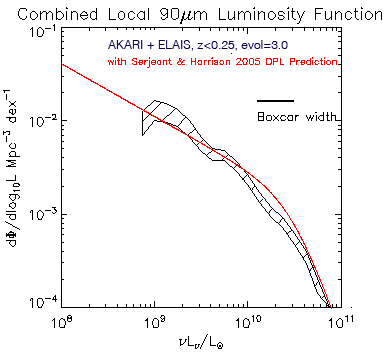
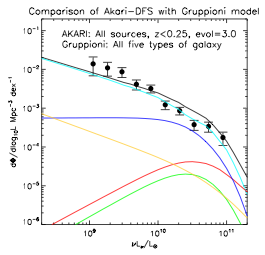
In Figure 2, the left panel shows our luminosity function assuming pure luminosity evolution of (1+z)3. We have combined our results with the 90 m luminosity function of the ELAIS-N fields presented in Serjeant et al. (2004) in the centre panel (as described in detail in Sedgwick et al. 2011), and in the right panel we show that our results are in reasonable agreement with the theoretical prediction for the 90 m luminosity function for galaxies from a new backward evolution model of Gruppioni et al. (2011) which includes separate evolution for five types of galaxy. The figure also shows that our result is close to the Serjeant & Harrison (2005) double power-law prediction, with a slight faint-end excess and a deficit just below L*, attributed to large-scale structure.
Acknowledgements. This research is based on observations with AKARI, a JAXA project with the participation of ESA. This work was funded in part by STFC (grant PP/D002400/1), the Royal Society (2006/R4-IJP), the Sasakawa Foundation (3108) and KAKENHI (19540250 and 21111004). We extend our thanks to Carlotta Gruppioni.
References
- [] Clements, D.L., Bendo, G., Pearson, C. et al. 2011, MNRAS, 411, 373
- [] Frayer, D.T., Huynh, M.T., Chary, R. et al. 2006, ApJ, 647, L9
- [] Gruppioni, C., Pozzi, F., Zamorani, G., Vignali, C. 2011, MNRAS, 416, 70
- [] Hatsukade, B., Kohno, K., Aretxaga, I. et al. 2011, MNRAS, 411, 102
- [] Lagache, G., Dole, H., Puget, J.-L., et al. 2004, ApJS, 154, 112
- [] Malek, K., Pollo, A., Takeuchi, T.T. et al. 2010, A&A, 514, 11
- [] Matsuhara, H., Wada, T., Matsuura, S. et al. 2006, PASJ, 58, 673
- [] Matsuura, S., Shirahata, M., Kawada, M. et al. 2011, ApJ, 737, 2
- [] Pearson, C. 2001, MNRAS, 325, 1511
- [] Schmidt, M. 1968, ApJ, 151, 393
- [] Sedgwick, C., Serjeant, S., Pearson, C. et al. 2011, MNRAS, 416, 1862
- [] Serjeant, S., Carraminana, A., Gonzales-Solares, E. et al. 2004, MNRAS, 355, 813
- [] Serjeant, S., Efstathiou, A., Oliver, S. et al. 2001, MNRAS 322, 262
- [] Serjeant, S. & Harrison, D. 2005, MNRAS, 356,192
- [] Shirahata, M., Matsuura, S., Takagi, T. et al. 2008, ASPC, 399, 290
- [] Valiante, E., Ade, P.A.R., Bock, J.J. et al. 2010, ApJS, 191, 222
- [] White, G.J., Hatsukade, B., Pearson, C. et al. 2011, MNRAS, submitted