Numerical computations of facetted pattern formation in snow crystal growth
Abstract
Facetted growth of snow crystals leads to a rich diversity of forms, and exhibits a remarkable sixfold symmetry. Snow crystal structures result from diffusion limited crystal growth in the presence of anisotropic surface energy and anisotropic attachment kinetics. It is by now well understood that the morphological stability of ice crystals strongly depends on supersaturation, crystal size and temperature. Until very recently it was very difficult to perform numerical simulations of this highly anisotropic crystal growth. In particular, obtaining facet growth in combination with dendritic branching is a challenging task. We present numerical simulations of snow crystal growth in two and three space dimensions using a new computational method recently introduced by the authors. We present both qualitative and quantitative computations. In particular, a linear relationship between tip velocity and supersaturation is observed. The computations also suggest that surface energy effects, although small, have a larger effect on crystal growth than previously expected. We compute solid plates, solid prisms, hollow columns, needles, dendrites, capped columns and scrolls on plates. Although all these forms appear in nature, most of these forms are computed here for the first time in numerical simulations for a continuum model.
keywords:
A1. Computer simulation , A1. Crystal morphology , A1. Dendrites , A1. Growth models , A1. Morphological stability , A1. Solidification , A2. Growth from vapourPACS:
81.10.Aj , 07.05.Tp , 81.30.Fb1 Introduction
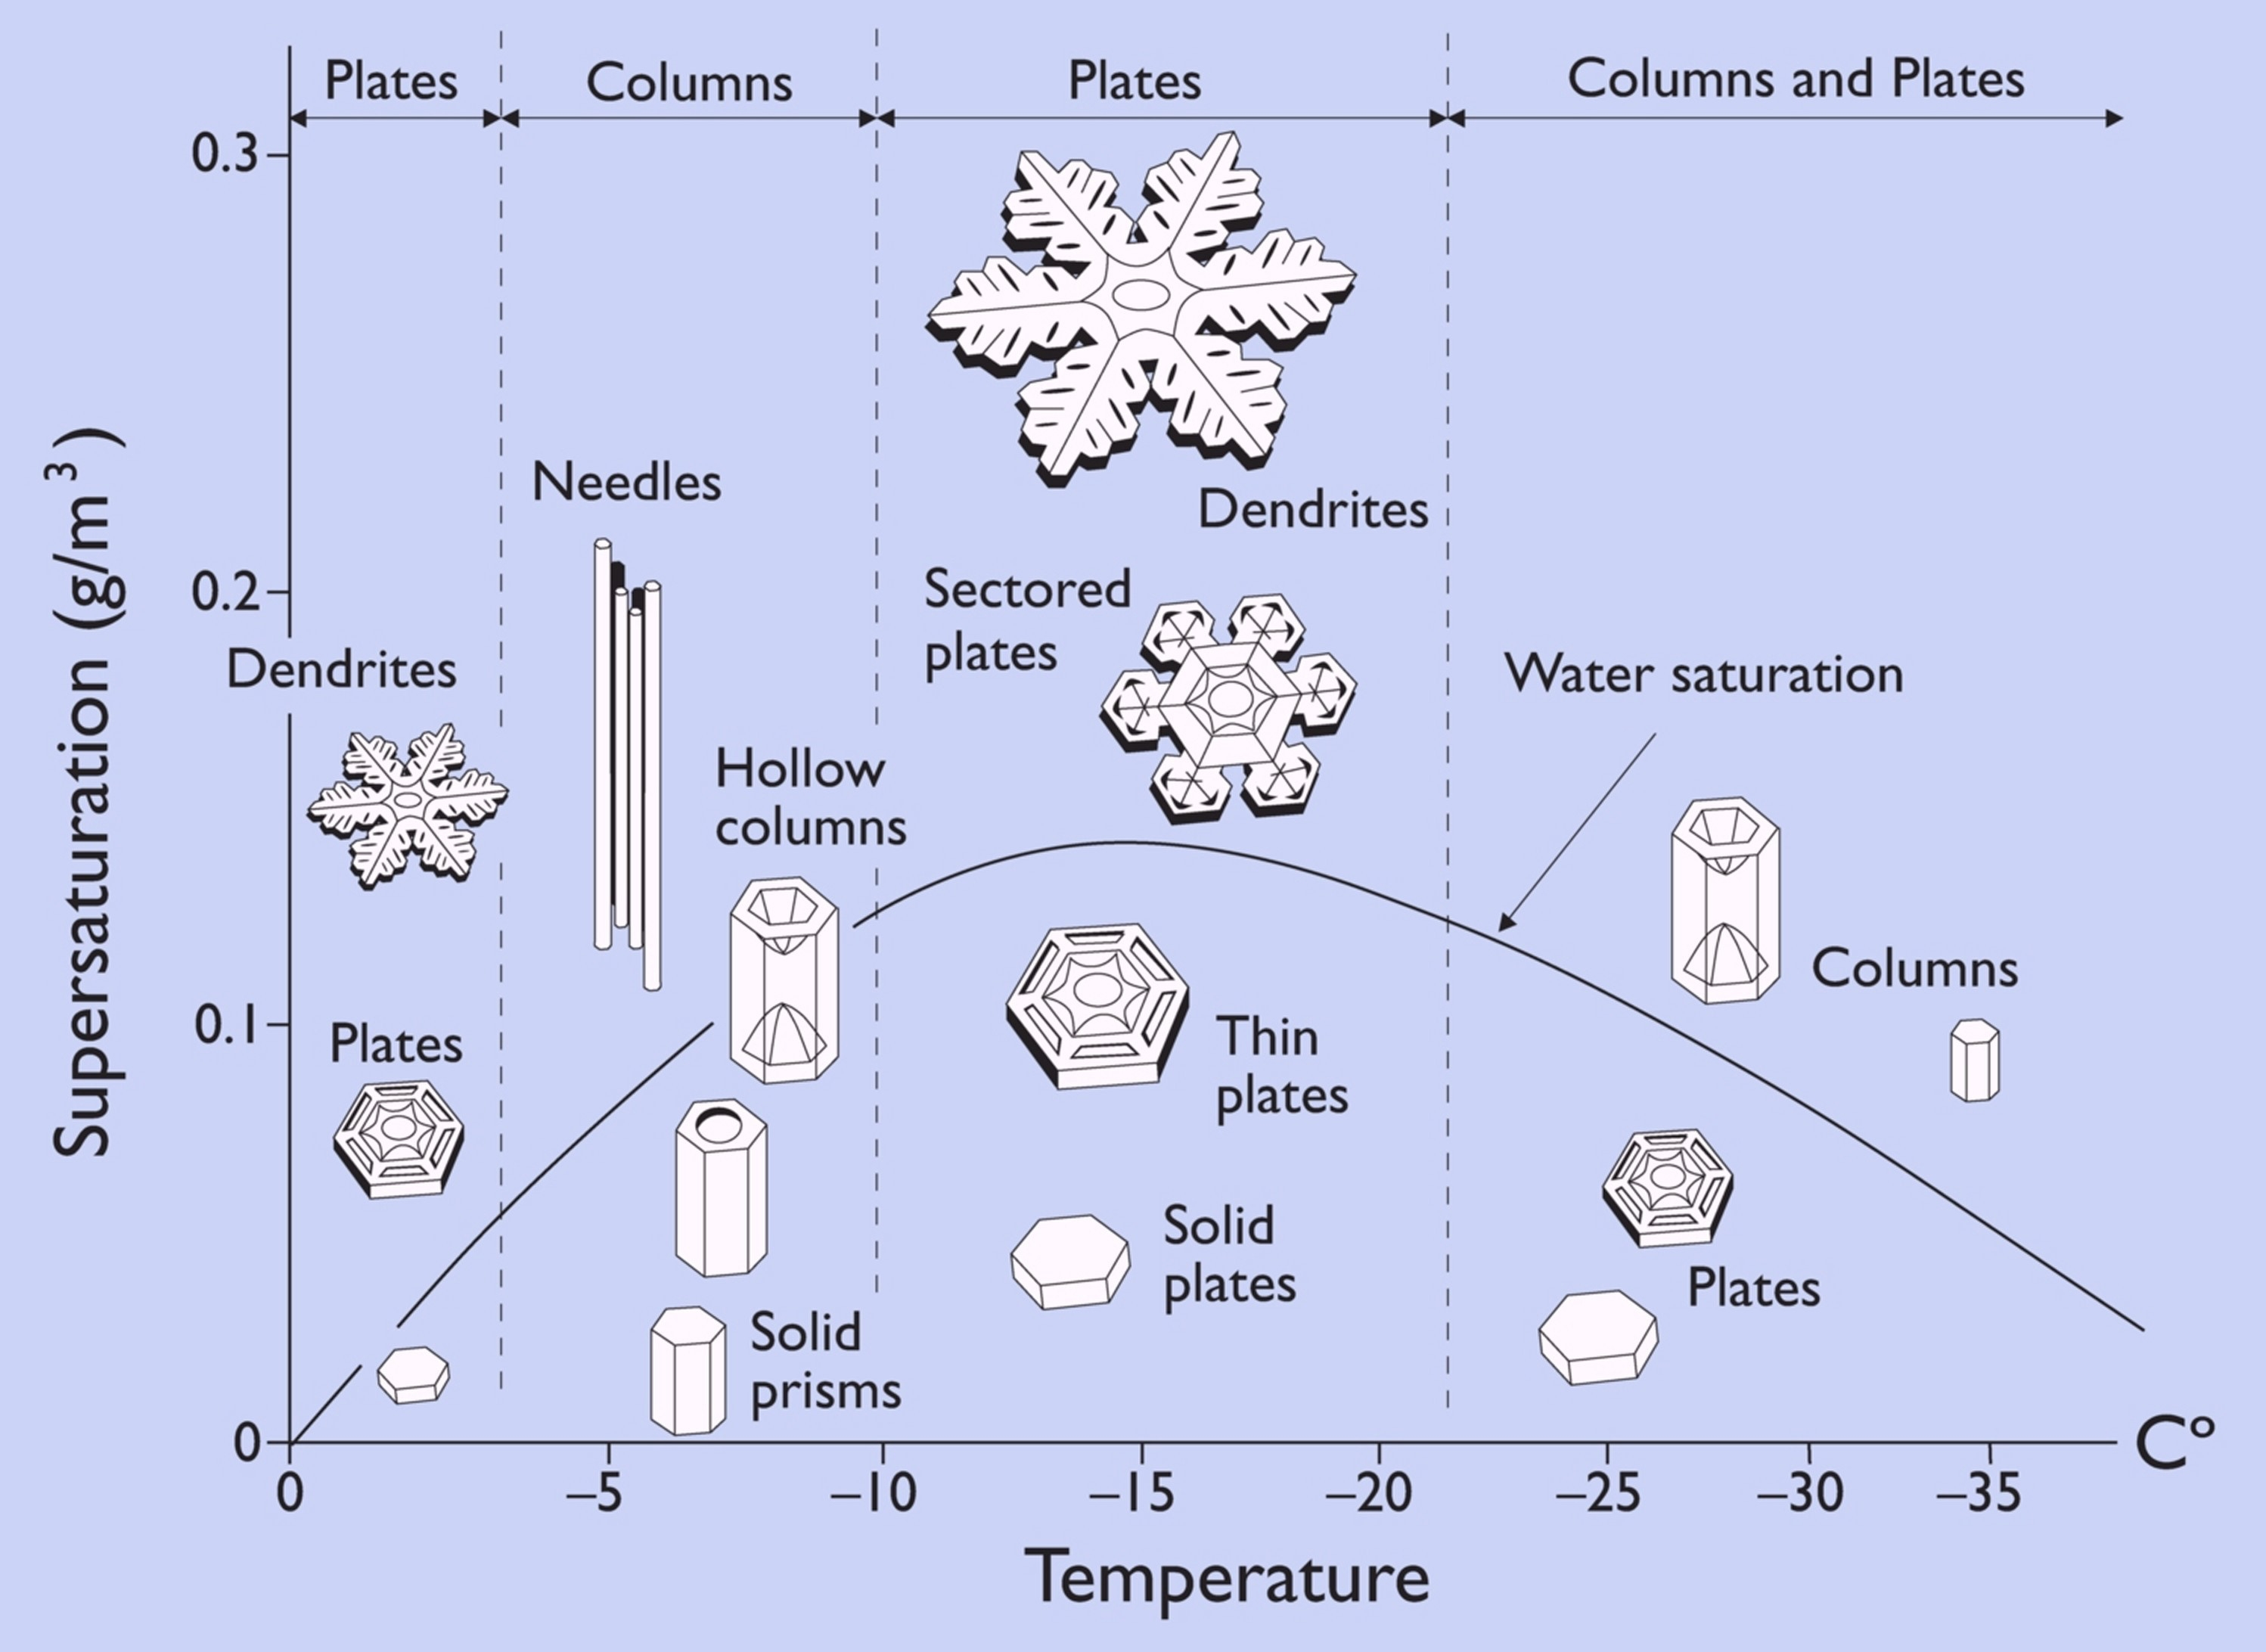
Snow crystals grown from a supersaturated vapour lead to a variety of complex and often very symmetric patterns. Crystallisation from vapour is a fundamental phase transition, and a good understanding is crucial for many applications. Numerous experiments have been performed, and compilations of photographs of artificial and natural snowflakes reveal their beauty and complexity, see [1] and the review [2]. The precise forms of snow crystals depend in a very subtle way on the temperature and the supersaturation. Nakaya [1] analysed these dependencies in detail and combined his observations in his now famous Nakaya snow crystal morphology diagram, see Figure 1. At temperatures just below the freezing temperature thick plates grow at lower supersaturations and plate-like dendritic forms appear at higher supersaturations. At temperatures around C solid prisms grow at lower supersaturations and hollow columns and needle-like crystals at higher supersaturations. If the temperature is decreased below C one observes thin solid plates at low supersaturations, whereas dendrites form at high supersaturations. Below C again columns form at high supersaturations. The results from Nakaya [1], which led to the snow crystal morphology diagram, have been confirmed by many subsequent experimental studies. Although the experiments give a rather clear picture, the physics behind the snow crystal morphology diagram are not yet understood.
A continuum mathematical modelling of snow crystal growth leads to a quasi-static diffusion problem for the diffusion of the vapour molecules. The diffusion equation has to be solved together with rather complex boundary conditions on the free boundary between vapour and solid. The conditions on this interface are given by the continuity equation relating the flux of vapour molecules onto the interface to the interface velocity, and an equation describing the attachment kinetics taking surface energy effects into account. In the latter condition the hexagonal anisotropy of snow crystals also enters. Due to being highly nonlinear, and since it is geometrically very involved, the complete free boundary problem is difficult to analyse theoretically. However, there exists a large literature on numerical computations for diffusion limited growth and the formation of dendrites, which we now briefly discuss.
Numerical approaches for crystal growth usually employ either sharp interface models, in which the solidification front is tracked explicitly, or phase field models, in which the solidification front is modelled by a thin diffusional layer. In sharp interface approaches the front is described with the help of a parameterisation, see [3, 4, 5, 6], or by using a level set function, see [7]. In a phase field method a new order parameter –the phase field– is introduced, which at the interface rapidly changes its value between two fixed values, which describe the different phases, see [8, 9, 10, 11]. A popular discrete model for the simulation of crystal growth are cellular automata, see [12, 13, 14]. Moreover, molecular dynamics simulations are used to understand the surface structure of ice [15]. Although many computations have been performed, a quantitative numerical description of facet growth in combination with dendritic branching is missing.
In recent research by the authors a new parametric approach for interface motion has been developed [16, 17]. The method has the feature that the mesh quality of the interface approximation, which is given by a polyhedral surface mesh, remains good during the evolution – most earlier approaches had to deal with mesh degeneracies, e.g. by re-meshing the interface approximation. In addition, the present authors were able to include anisotropy effects into curvature driven hypersurface evolution in a numerically stable way. This allows the method to compute in situations in which the anisotropy is facetted, see [18, 19, 20, 6].
It is the goal of this paper to demonstrate that with the numerical method introduced in [16, 17, 19, 6] it is possible to compute snow crystal growth in a qualitatively and quantitatively satisfactory way. We will present computations showing a significant number of different types of snow crystals, such as solid plates, solid prisms, hollow columns, needles, dendrites, capped columns and scrolls on plates.
In snow crystal growth models several parameters are not known to a sufficient precision. In particular, the surface energy density as a function of orientation is not known in detail. In addition, the condensation coefficient, which embodies the attachment kinetics of how water molecules are incorporated into the ice lattice, is not known in detail. For example, it is not known how the condensation coefficient depends on the crystal orientation, see [2] and the references therein for details.
Our numerical computations seem to suggest that the anisotropy in the surface energy density might have a more important impact on snow crystal growth morphologies than previously expected. Of course, numerical simulations alone cannot decide whether this is in fact the case, but a comparison of numerical computations with experiments might help to understand this issue better. In particular, it might be possible to obtain more precise estimates for the size of the condensation coefficient as a function of orientation.
We also present some quantitative results, which first of all show what the relatives sizes of the quantities entering the surface attachment kinetics are. In addition, we show that the tip velocity for a dendrite growing into a supersaturated vapour depends linearly on the supersaturation. This linear relationship has been already observed in experiments for growing needles, see [21], and our computations might help to relate parameters in the theoretical model to experiments.
2 A continuum model for snow crystal growth
We consider a continuum model for snow crystal growth, which consists of an ice crystal growing from water vapour, as discussed in e.g. [2, 22], and non-dimensionalize it. Let denote the water vapour number density in gas. The diffusion equation in the gas phase, see [2, Eq. (2)], is then
| (1) |
where is the domain occupied by the gas phase and is the corresponding diffusion constant. The mass balance at the gas/solid interface gives rise to
| (2) |
where is the number density for ice. In addition, is the unit normal to pointing into and is the velocity of in the direction . In [2, Eq. (3)] the term is neglected since . Furthermore, taking surface tension effects and attachment kinetics into account, we require, compare [2, Eq. (23)],
Here is the kinetic velocity, , where represents the typical order of the surface tension of ice, is the Boltzmann constant, is the temperature and is the equilibrium number density above a flat ice surface, which is dependent on temperature. In addition, is the anisotropic mean curvature which incorporates the hexagonal anisotropy of the surface energy density. Moreover, is the condensation coefficient, which is denoted by in [2], which depends on the orientation of the crystal via the normal . Finally, we complement (1) with the boundary condition
| (3) |
where describes the water vapour number density far away from the interface. Here, for convenience, we choose a domain , , with , that is large enough so that boundary effects can be neglected. Moreover, is related to the supersaturation by
| (4) |
with denoting the mass of a water molecule. We recall that the supersaturation appears on the vertical axis in Figure 1.
It remains to introduce the anisotropic mean curvature . Instead of a constant surface energy density, we choose to be dependent on the orientation of the interface. The effect of the underlying crystal structure is encoded into the surface energy by allowing , where as stated above, is the unit normal to the solid boundary pointing into the vapour region . The total surface energy of an interface is now given by the surface integral
It is convenient to extend to be a positively homogeneous function of degree one, i.e. we define for all and refer to as from now on. The first variation of the above energy can now be computed as
i.e. ; where is the tangential divergence on and is the gradient of , see e.g. [23, 24, 25], and also [19, 6].
We now non-dimensionalize the problem. As a length scale we choose , which we set to be m for snow crystal growth. As a time scale we choose
In addition, we non-dimensionalize the concentration by introducing
| (5) |
Then, in terms of the new independent variables and , we obtain (on dropping the notation for the new variables for ease of exposition) the equations
| (6) | |||||
| (7) |
where and . Since , we simplify the first equation to
| (8) |
We will choose and of order one, and hence it will be important to specify the order of magnitude of the quantities and in (7). Taking the values of and from the table in [2, p. 866] into account, we observe that
independently of the temperature . Moreover, for the time scale , which depends on , and hence on , we obtain a range from 100 s at C to 1300 s at C. These time scales seem to be realistic when comparing with the experiments reported in [2, 26].
For the diffusion constant of water vapour in air we take , see Libbrecht [2, p. 866], which is valid at a pressure of atm. With the values of and mentioned further above we obtain
| (9) |
If not otherwise stated, we will always choose these parameters in all the snow crystal growth computations described in Section 4. For the boundary condition we set, on recalling (3) and (5),
| (10) |
With the help of the table in [2, p. 866] we compute several exemplary values for the fraction in (10) for different values of the temperature and the supersaturation ; see Table 1.
| supersaturation (g/m3) | ||||||
| 0.01 | 0.02 | 0.05 | 0.1 | 0.2 | 0.3 | |
| C | ||||||
| C | ||||||
| C | ||||||
| C | ||||||
| C | ||||||
| C | ||||||
In effect, we appear to have reduced the two parameter variation of the diagram in Figure 1 to the single parameter in (10). However, in our numerical simulations of snow crystal growth we will vary both and the kinetic coefficient . Although in reality not much is known about the possible shapes and dependencies of , it is known that strongly depends on . Thus varying in our numerical computations may be interpreted as simulating different (yet unknown) temperature regimes.
3 Numerical method and anisotropies
For the numerical results in this paper we employ the finite element approximation introduced by the authors in [6, 27] in order to approximate solutions of (6), (7), (8), (10). In the method a uniform time step is employed and the evolution of the crystal surface is tracked with the help of parametric meshes that are independent from the bulk meshes on which the approximation of is computed. The scheme uses an adaptive bulk mesh that has a fine mesh size around and a coarse mesh size further away from it. Here and are given by two integer numbers , where we assume from now on that . The initial parametric mesh consists of vertices, and this mesh is locally refined, where elements become too large during the evolution.
In order to successfully model the evolution of anisotropic interface evolution laws the authors introduced a stable discretization in [19, 6]. We now discuss how and have to be chosen in order to model situations with a hexagonal anisotropy. In this paper, we choose surface anisotropies of the form
| (11) |
where , for , are symmetric and positive definite matrices, and denotes a vector in . We remark that anisotropies of the form (11) admit a formulation of in (7) which can be discretized in a simple and stable way, see [19, 6]. We will now demonstrate that these forms of also allow one to model a hexagonal surface energy in a simple way. To this end, let for .
Then a hexagonal anisotropy in can be modelled with the choice
| (12) |
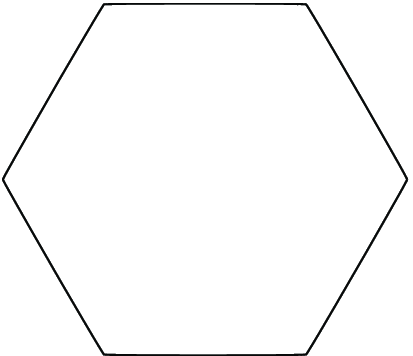
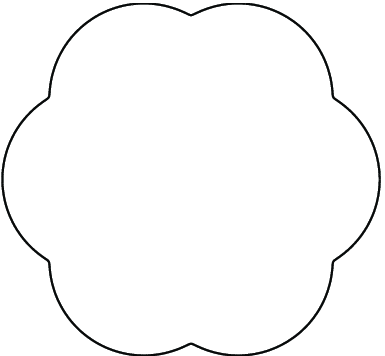
where denotes a clockwise rotation through the angle and is a parameter that rotates the orientation of the anisotropy in the plane. The Wulff shape of (12) for and is shown in Figure 2, together with its polar plot . For more details on Wulff shapes and polar plots we refer to [25, 28].
In order to define anisotropies of the form (11) in , we introduce the rotation matrices and . In this paper, we consider
| (13) |
which is relevant for the simulation of snow crystal growth. Its Wulff shape for is shown in Figure 3, together with its polar plot.
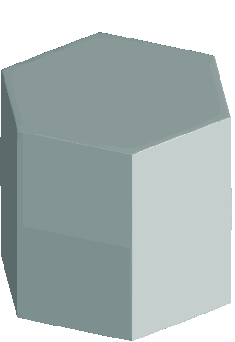
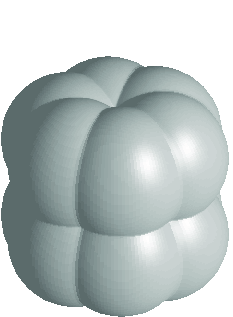
We note that the Wulff shape of (13) for approaches a prism, where every face has the same distance from the origin. In other words, for (13) the surface energy densities in the basal and prismal directions are the same. We remark that if denotes the Wulff shape of (13) with , then the authors in [14] used the scaled Wulff shape as the building block in their cellular automata algorithm. In addition, we observe that the choice (13) agrees well with data reported in e.g. [29, p. 148], although there the ratio of basal to prismal energy is computed as . In order to be able to model this situation as well, we generalise the choice (13) to
| (14) |
so that now .
A more generalized form of (12) and (13), which also fits into the framework (11), is given by
| (15) |
where is a fixed parameter. For the case we show the Wulff shape of (15) for and in Figure 4.
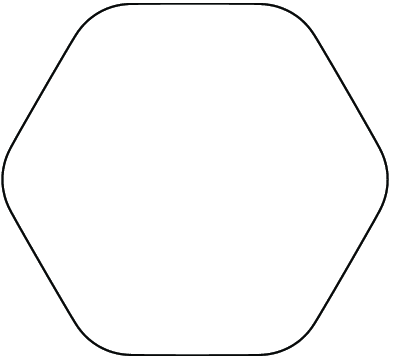
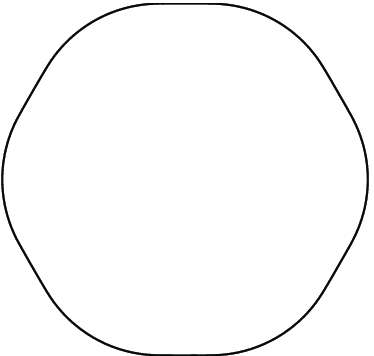
We note that for (15) with and , both in the case and in the case , the corresponding Wulff shape still has flat parts, but is now smooth with no corners and, if , with no edges. Equilibrium crystal shapes with these characteristics can be found in certain metals [30], and it is conjectured that they may be relevant for snow crystals as well [31].
As discussed in [2], and the references therein, the precise values of as a function of the normal are not known. Hence one issue in our computations is to understand how different choices of influence the overall evolution. First choices for the anisotropy in the kinetic coefficient are and . It was discussed in [2] that the value of is expected to change with temperature and can vary quite drastically as a function of the orientation. Denoting by the condensation coefficient of the basal directions and by the condensation coefficient in the prismal directions, it is for example expected that the growth of thin plates at C is only possible if is large.
In order to be able to vary the kinetic coefficient significantly, in the case we define for later use
| (16) |
and
| (17) |
with . We note that in practice there is hardly any difference between the numerical results for a kinetic coefficient that is isotropic in the -plane, such as and , and one that is anisotropically aligned to the surface energy density, such as e.g. . Hence in all our three dimensional numerical simulations we always choose coefficients that are isotropic in the -plane, e.g. (16) or (17).
In addition, it might be the case that the condensation coefficient is considerably lower in the directions normal to the facets. In order to model this we choose
| (18) |
where we fix and , and where
We note that for the 2d anisotropy (12) it holds that and . For more details on the numerical method and the anisotropies we refer to [6, 18, 19, 27].
4 Numerical computations
4.1 Snow crystal growth in two dimensions
In all computations for (6), (7), (8), (10) in this subsection we will, if not otherwise stated, use the parameters (9) and choose the surface energy anisotropy defined by (12) with and . The rotation in the definition of the anisotropy is used, so that the dominant growth directions are not exactly aligned with the underlying bulk meshes . Moreover, the radius of the circular initial crystal seed, , is always chosen to be .
First of all we study what influence the curvature and the velocity terms in (7), and the supersaturation in (10) have on the evolution of the crystal. We choose the supersaturation and show the results in Figure 5. One observes that the hexagonal structure of the crystal forms quickly and that the facets become unstable and break after they reached a certain size – a phenomenon which is observed in experiments as well, see [2].


In Figures 6–8 we plot computations with larger supersaturations, . One clearly observes dendritic growth, which is more enhanced at larger supersaturations. In addition, the evolution is much faster due to the fact that more water vapour molecules are available.
It is also of interest to compare the size of the terms appearing in (7). To this end, we compare the numerical approximations of the terms
where denotes the observed tip velocity, i.e. the velocity of the part of the interface furthest away from the origin, is the average of on the interface and is the maximum of . For a computation with , and we plot these values in Figure 9. It clearly can be seen that the curvature contribution is larger than the velocity term. In our other computations we only observed for supersaturations around and larger that the velocity term is larger than the average curvature term .


In Figure 10 we set the velocity term to zero in the left computation, i.e. , and we set the curvature term to zero in the right computation, i.e. . We observe that leaving out the velocity term only has a very minor impact on the crystal evolution. On the other hand, leaving out the curvature term has a drastic effect – the front becomes very unstable. This can be explained as follows. Growth from supersaturated vapour is unstable and while the velocity term in (7) without the curvature term can dampen the unstable modes, they are still unstable on all wavelengths. Whereas, the curvature term will stabilise the small wavelengths and will select a fastest growing wavelength, irrespective of the velocity term.
We now study the influence of the anisotropy on the evolution. On the left of Figure 11 we present an evolution with a hexagonal anisotropy for and an isotropic . In the same figure on the right we take isotropic and hexagonal. One clearly observes that anisotropy in the surface energy seems to be important to obtain facetted growth.


This is underlined by the next computation, where we choose (15) for the anisotropy , and let . In Figure 12 we present evolutions for and . These computations show how important the facetted anisotropy in the Wulff shape is in order to obtain facetted snow crystals, recall Figure 4.
It was suggested to the authors by Prof. Libbrecht that the difference of as a function of might be large with a minimum in the the directions of the facet normals. We hence took and in Figure 13. One observes that the anisotropy in the condensation coefficient is large enough to lead to a six folded branching structure. But it is also clearly visible that the anisotropy in does not lead to facetted growth.
Next we study how the tip velocity in a growing dendritic crystal depends on the supersaturation. So far nothing is known theoretically for this dependence in the case of facetted growth, see [2, §4], even though for simpler problems, i.e. in the absence of facetting, a vast literature exists, see e.g. [25] and the references therein. As can be seen in Figure 9, the tip velocity after some time becomes basically time-independent. This is true also for our other computations with different supersaturations. We observe a linear dependence between the supersaturation and the tip velocity that the evolution eventually settles on. To underline this qualitative behaviour, we numerically determine the value for the nearly constant tip velocity for several values of , see Figure 14 for a plot of these velocities. We also show the best linear fit to this data, which is given by a linear function with slope . We remark that a similar linear relationship between velocity and supersaturation has been observed experimentally for needles, see [21].
We end this subsection with some computations, where we use a time dependent choice for . This models changing physical conditions. In particular, in the first computation we set
| (19) |
while in the second computation we set
| (20) |
see Figure 15 for the results. In the last computation we use a widely varying . We set for , then till , then till , then till , then till , then till , and then until the end, see Figure 16 for the results.
4.2 Snow crystal simulations in three space dimensions
Also in three space dimensions we use the physically relevant parameters introduced in Section 2, see in particular (9), and choose, if not stated otherwise, the three-dimensional variant of , see (13), with and . In all computations with the exception of Figure 17 the initial crystal seed was spherical with radius . Similarly to our computations in two space dimensions, we observe in our three dimensional numerical computations that the surface energy anisotropy is important in order to obtain facetted growth. If we do not choose the surface energy strongly facetted, then we do not observe facetted growth of the crystal.
One issue in three dimensions is to understand how the parameter leads to either horizontal flat growth or to columnar vertical growth, which may yield e.g. solid prisms or needles, respectively. First of all, we attempt to compute a self-similar hexagonal evolution, i.e. a crystal where the basal and prismal facets grow with the same velocity. This is motivated by a theoretical result in [32], in which the existence of self-similar evolutions of crystals, where the Wulff shape is a cylinder, was shown. We choose , , as in (14), vary the ratio and observe that, upon starting the evolution with being a scaled Wulff shape, for the evolution is self-similar up to discretization errors. See Figure 17 for a computation with .
For the remainder of the computations we fix , i.e. we choose as in (13), and use the physically relevant parameters in (9). For the first such computation we set and , see Figure 18. We can clearly see that the facets of the growing crystal are aligned with the Wulff shape of . We also note that facet breaking occurs both in the prismal and in the basal directions. In this context we refer to [26], where similar facet breaking was observed in experiments.


It is well known that the condensation coefficient varies strongly for different orientations, depending on the meteorological environment. In particular, the value of can differ quite drastically between directions which correspond to basal facet normals and ones which correspond to prismal facet normals, see [2]. We hence perform different numerical computations for the condensation coefficients and defined in (16) and (17).
We begin with a repeat of the simulation in Figure 18, but now choose as kinetic coefficient and ; see Figures 19 and 20. In comparison to the evolution in Figure 18 one observes that the smaller condensation coefficient in basal directions leads to flat crystals. This is related to shapes in the Nakaya diagram for temperature between C and C and between C and C.
A computation with a supersaturation and can be seen in Figure 21. In this case the condensation coefficient is larger in the basal direction and we obtain a solid prism, which can be found in the Nakaya diagram at temperatures between C and C and at low supersaturations.


At higher supersaturations we obtain for the results shown in Figure 22.


We also give some plots of the rescaled water vapour density in Figure 23. We observe Berg’s effect [33], which states that the concentration is largest at the edges and decreases towards the centre of the facet. It is believed that facet breaking occurs when the concentration becomes too non-uniform on the facets [34]. In Figure 22 we observe facet breaking for the basal and prismal directions, although the breaking predominantly occurs on the basal facets.


Choosing the condensation coefficient even larger in the basal directions leads to Figure 24. We observe hollow columns as in the Nakaya diagram between C and C at low, but not too low, supersaturations. Increasing the condensation coefficient in the basal directions even further, i.e. choosing , leads to the evolution depicted on the left of Figure 25. On the right we also display a computation on a coarser grid. Both results in Figure 25 lead to needle growth, which also appears in the Nakaya diagram. We remark that the shape on the right of Figure 25 is caused by numerical noise and rounding errors. However, the same effect, on even the most refined meshes, can be achieved by adding random fluctuations to the model. In real life such fluctuations and changes in physical parameters are experienced by the growing snow crystal, as it moves through the atmosphere towards the earth.


A numerical simulation with supersaturation with is displayed in Figure 26. In this case capped columns appear, which can also be observed in nature; see [2, 35].
We end this subsection with computations, where we use a time dependent choice for . In particular, we set
| (21) |
See Figure 27 for the results.


First a plate forms and then, due to the fact that the supersaturation increases, the plate becomes unstable and new plate-like shapes grow at the corners of the plate.
Finally, we perform two simulations, where we vary in time. In the first such example, we choose
| (22) |
In a second example, we choose
| (23) |
Results for these choices of and for can be seen in Figure 28.


5 Conclusions
We have demonstrated that an approach introduced by the authors in [19, 6, 27] provides a powerful computational tool to investigate pattern formation in crystal growth in a qualitative and quantitative way. The method makes it possible to simulate facetted and dendritic growth simultaneously. We also observe the instability of crystals leading to facet breaking. Many parameters in models for crystal growth are not known. The presented numerical method in combination with a comparison to experiments can make it possible to estimate the relative sizes of parameters. In particular, by varying the condensation coefficient we were able to observe either plate-like growth or columnar growth.
Let us finally summarise the results.
-
1.
Surface energy effects taking anisotropy into account have been included in the model and, despite their small size, they turned out to totally change the character of the interfacial dynamics. In our computations anisotropic surface energy is required in the interfacial dynamics to produce facetted dendritic growth.
-
2.
The influence of the anisotropy in the condensation coefficient, at least at small supersaturations, is not sufficient for facetted growth.
-
3.
For small supersaturations the influence of the velocity term in (7) is small in comparison with the curvature term.
-
4.
The velocity at the tip of growing crystals depends in a linear way on the supersaturation.
-
5.
Macroscopic models for crystal growth which are based on a diffusion equation in the gas phase, a mass balance on the vapour crystal interface and a modified Gibbs–Thomson law, taking attachment kinetics into account, are able to model a variety of phenomena in crystal growth, such as the appearance of solid plates, solid prisms, hollow columns, needles, dendrites, capped columns and scrolls on plates.
Acknowledgement. The authors wish to express their deep thanks to Prof. K. G. Libbrecht of the California Institute of Technology for many fruitful discussions and for providing Figure 1.
References
- Nakaya [1954] U. Nakaya, Snow Crystals: Natural and Artificial, University Press, Cambridge, 1954.
- Libbrecht [2005] K. G. Libbrecht, The physics of snow crystals, Rep. Progr. Phys. 68 (2005) 855–895.
- Roosen and Taylor [1991] A. Roosen, J. E. Taylor, Simulation of crystal growth with facetted interfaces, Mater. Res. Soc. Symp. Proc. 237 (1991) 25–36.
- Yokoyama [1993] E. Yokoyama, Formation of patterns during growth of snow crystals, J. Cryst. Growth 128 (1993) 251–257.
- Schmidt [1996] A. Schmidt, Computation of three dimensional dendrites with finite elements, J. Comput. Phys. 195 (1996) 293–312.
- Barrett et al. [2010] J. W. Barrett, H. Garcke, R. Nürnberg, On stable parametric finite element methods for the Stefan problem and the Mullins–Sekerka problem with applications to dendritic growth, J. Comput. Phys. 229 (2010) 6270–6299.
- Sethian and Strain [1992] J. A. Sethian, J. Strain, Crystal growth and dendritic solidification, J. Comput. Phys. 98 (1992) 231–253.
- Kobayashi [1993] R. Kobayashi, Modeling and numerical simulations of dendritic crystal growth, Phys. D 63 (1993) 410–423.
- Wheeler et al. [1993] A. A. Wheeler, B. T. Murray, R. J. Schaefer, Computation of dendrites using a phase field model, Phys. D 66 (1993) 243–262.
- Karma and Rappel [1998] A. Karma, W.-J. Rappel, Quantitative phase-field modeling of dendritic growth in two and three dimensions, Phys. Rev. E 57 (1998) 4323–4349.
- Debierre et al. [2003] J.-M. Debierre, A. Karma, F. Celestini, R. Guérin, Phase-field approach for faceted solidification, Phys. Rev. E 68 (2003) 041604–1–13.
- Reiter [2005] C. A. Reiter, A local cellular model for snow crystal growth, Chaos Soliton. Fract. 23 (2005) 1111–1119.
- Libbrecht [2008] K. G. Libbrecht, Physically derived rules for simulating faceted crystal growth using cellular automata, 2008. http://arxiv.org/abs/0807.2616.
- Gravner and Griffeath [2009] J. Gravner, D. Griffeath, Modeling snow-crystal growth: A three-dimensional mesoscopic approach, Phys. Rev. E 79 (2009) 011601–1–18.
- Furukawa and Nada [1997] Y. Furukawa, H. Nada, Anisotropic surface melting of an ice crystal and its relationship to growth forms, J. Phys. Chem. B (1997) 6167–6170.
- Barrett et al. [2007] J. W. Barrett, H. Garcke, R. Nürnberg, A parametric finite element method for fourth order geometric evolution equations, J. Comput. Phys. 222 (2007) 441–462.
- Barrett et al. [2008a] J. W. Barrett, H. Garcke, R. Nürnberg, On the parametric finite element approximation of evolving hypersurfaces in , J. Comput. Phys. 227 (2008a) 4281–4307.
- Barrett et al. [2008b] J. W. Barrett, H. Garcke, R. Nürnberg, Numerical approximation of anisotropic geometric evolution equations in the plane, IMA J. Numer. Anal. 28 (2008b) 292–330.
- Barrett et al. [2008c] J. W. Barrett, H. Garcke, R. Nürnberg, A variational formulation of anisotropic geometric evolution equations in higher dimensions, Numer. Math. 109 (2008c) 1–44.
- Barrett et al. [2010] J. W. Barrett, H. Garcke, R. Nürnberg, Finite element approximation of coupled surface and grain boundary motion with applications to thermal grooving and sintering, European J. Appl. Math. 21 (2010) 519–556.
- Libbrecht et al. [2002] K. G. Libbrecht, T. Crosby, M. Swanson, Electrically enhanced free dendrite growth in polar and non-polar systems, J. Cryst. Growth 240 (2002) 241–254.
- Ben-Jacob [1993] E. Ben-Jacob, From snowflake formation to growth of bacterial colonies. Part I. Diffusive patterning in azoic systems, Contemp. Phys. 34 (1993) 247–273.
- Cahn and Hoffman [1974] J. W. Cahn, D. W. Hoffman, A vector thermodynamics for anisotropic surfaces – II. Curved and faceted surfaces, Acta Metall. 22 (1974) 1205–1214.
- Taylor et al. [1992] J. E. Taylor, J. W. Cahn, C. A. Handwerker, Geometric models of crystal growth, Acta Metall. Mater. 40 (1992) 1443–1474.
- Davis [2001] S. H. Davis, Theory of Solidification, Cambridge Monographs on Mechanics, Cambridge University Press, Cambridge, 2001.
- Gonda and Yamazaki [1982] T. Gonda, T. Yamazaki, Morphological stability of polyhedral ice crystals growing from the vapor phase, J. Cryst. Growth 60 (1982) 259–263.
- Barrett et al. [2012] J. W. Barrett, H. Garcke, R. Nürnberg, Finite element approximation of one-sided Stefan problems with anisotropic, approximately crystalline, Gibbs–Thomson law, 2012. http://arxiv.org/abs/1201.1802v1.
- Gurtin [1993] M. E. Gurtin, Thermomechanics of Evolving Phase Boundaries in the Plane, Oxford Mathematical Monographs, The Clarendon Press Oxford University Press, New York, 1993.
- Pruppacher and Klett [1997] H. R. Pruppacher, J. D. Klett, Microphysics of Clouds and Precipitation, Kluwer Acad. Publ., Dordrecht, 1997.
- Bonzel [2003] H. P. Bonzel, 3D equilibrium crystal shapes in the new light of STM and AFM, Phys. Rep. 385 (2003) 1–67.
- Libbrecht [2012] K. G. Libbrecht, (private communication), 2012.
- Giga and Rybka [2004] Y. Giga, P. Rybka, Existence of self-similar evolution of crystals grown from supersaturated vapor, Interfaces Free Bound. 6 (2004) 405–421.
- Berg [1938] W. F. Berg, Crystal growth from solutions, Proc. Roy. Soc. London Ser. A 164 (1938) 79–95.
- Giga and Rybka [2003] Y. Giga, P. Rybka, Berg’s effect, Adv. Math. Sci. Appl. 13 (2003) 625–637.
- Libbrecht [2006] K. G. Libbrecht, Field Guide to Snowflakes, Voyageur Press, 2006.
- Magono and Lee [1966] C. Magono, C. W. Lee, Meteorological classification of natural snow crystals, J. Fac. Sci., Hokkaido Univ., Ser. VII 2 (1966) 321–335.