Theoretical analysis of oxygen vacancies in layered sodium cobaltate NaxCoO2-δ
Abstract
Sodium cobaltate with high Na content is a promising thermoelectric material. It has recently been reported that oxygen vacancies can alter the material properties, reducing its figure of merit. However, experimental data about the oxygen stoichiometry are contradictory. We therefore studied the formation of oxygen vacancies in NaxCoO2 with first principles calculations, focusing on =0.75. We show that a very low oxygen vacancy concentration is expected at the temperatures and partial pressures relevant for applications.
I Introduction
Layered sodium cobaltate NaxCoO2 ( 1)
has in recent years attracted
considerable attention because of its remarkable electronic and magnetic
properties. Most of the interesting physical properties of this material
come from its quasi 2-dimensional CoO2 layers where cobalt
exists as Co3+ and Co4+ ions, surrounded by intercalating Na+
ions Hinuma et al. (2008); Zandbergen et al. (2004); Meng et al. (2008).
Understanding how the oxide layer is affected by temperature and sample
composition is therefore crucial when interpreting the physical properties.
By changing the sodium content, one can continuously tune the
oxidation state of the cobalt ions.
In NaCoO2 () all cobalt atoms are found in a Co3+ state
and the material is an insulator, whereas for
< 1, negatively charged sodium vacancies are introduced.
NaxCoO2 is known to be a -type conductor with metallic
conduction behavior in which itinerant electron holes give rise to
a particularly high thermoelectric effectTerasaki et al. (1997); Wang et al. (2003).
The influence of point defects other than Na vacancies on
sodium cobaltate is still debated.
Their concentrations are linked through the electroneutrality requirement
and will thus vary depending on Na content, temperature and oxygen activity
giving rise to a complex scenario.
Among the possible defects, it has been recently reported that oxygen vacancies
could have an interesting two-fold effect on the
thermoelectric properties in this material.
Firstly, they can affect the cobalt oxidation state,
i.e. reducing the charge carrier concentration and
increasing the thermopower.
Unfortunately, such defects also modify phonon scattering so that the
overall effect is a reduction of the figure of merit of
NaxCoO2-δ with increasing the defect
concentration () Tsai et al. (2010).
Experimental data about the concentration of vacancies in
sodium cobaltate are contradictory, especially at .
While some groups have identified an oxygen non-stoichiometry
up to = 0.16
Shu et al. (2010); Zhang et al. (2011); Stokłosa et al. (1985); Tsai et al. (2010); Bañobre-Lopez
et al. (2005); Chou et al. (2005),
others found no vacancies within the experimental
error Mukhamedshin and Alloul (2011); Viciu et al. (2006); Choi and Manthiram (2006).
In order to clarify this, we have in this work studied
the oxygen vacancy formation in Na0.75CoO2 by first principles
density functional theory (DFT) calculations. From these results we
computed free energies of formation, at various temperatures and
oxygen partial pressures. We found that oxygen vacancies have high
free energies of formation even at high temperature, suggesting that the
experimentally observed weight losses attributed to oxygen vacancies
may have a different origin.
II Theoretical Model
We assumed the following reaction (using Kröger-Vink notation):
| (1) |
The Gibbs’ free energies of formation for oxygen vacancies at a pressure and temperature were accordingly computed fromZhang and Northrup (1991)
| (2) |
In Eq.2 and are the Gibbs’
free energy of the defective and pristine supercells respectively,
is the charge state per defect, and
is the chemical potential of the species .
Thermal contributions of the solid were considered as
negligible ()
with respect to those of the oxygen gas, whose chemical
potential was calculated from
| (3) |
where is the Boltzmann constant and is the change in the chemical potential when moving from =0 to at constant pressure = 1 bar, taken from thermodynamic tables. Enthalpies at standard pressure and T=0 K, , were taken as the calculated DFT total energies and the corresponding concentrations of defects were then computed following:
| (4) |
where is the number of oxygen atoms per formula unit.
The system charge was simulated by adjusting the total number of electrons
in the supercell and at the same time adding a compensating jellium
background to avoid diverging Coulomb contributions.
The contribution of the background charge
to the defect formation energy was taken into account by
a correction term , here considered as the shift in the average
electrostatic potentials at a bulk-like lattice site far from the vacancy
in the defective () and pristine () supercellvan de Valle and Martin (1987)
| (5) |
Then, this correction was included in the electron chemical potential, determined by the NaxCoO2 Fermi energy Mattila and Zunger (1998).
| (6) |
Periodic DFT as implemented in the VASP package Kresse and Hafner (1994)
was used throughout this work.
A spin polarized gradient corrected Perdew-Burke-Ernzerhof (PBE)
functional Perdew et al. (1996) was used with a plane wave energy cutoff of 600 eV.
Core electrons were included through the projector augmented wave (PAW)
method Blöchl (1994).
Where needed we included an on-site Coulomb interaction (GGA+)
in order to localize cobalt electronsLiechtenstein et al. (1995). The parameters for
this system (=5.0 eV and =0.965 eV) were taken from ref.Okabe et al. (2004)
and are very similar to those used in other studies of the electronic structure
of CoO2-based oxides Zhang et al. (2004); Hinuma et al. (2008); Zou, Wang and Zeng (1996).
The reciprocal space was sampled by a -centered -point grid
in which the maximum distance between points is 0.15 /.
Ionic positions were relaxed until the maximum
force was lower than 0.03 eVÅ-1. Simultaneous relaxation of the
lattice parameters was performed for the defect free structures.
To sample the many possible sodium ordered structures
we adopted three different models for Na0.75CoO2. They are
shown in Fig. 1 and named
diamond, filled honeycomb (FHC) and zigzag.
They are based on a tetragonal supercell
consisting of 16 formula units Balsys and Davis (1996) and they
represent different relative concentrations
of the two inequivalent Na crystallographic sites, Na1
and Na2 (Na1/Na2=1, 1/2, and 1/5).
The three models are based on the experimental structure reported
by Zandbergen et al.Zandbergen et al. (2004)
(diamond), and on
the theoretical study of Meng et al.Meng et al. (2005, 2008)
(FHC and zigzag).
These were chosen as a representative selection of simple
periodic models from
the large manifold of structures, suitable for a first principles study.
Nevertheless, Na self-diffusion is an efficient process already at
room temperature Weller et al. (2009),
so we expect a strong Na disorder at high .
III Results and Discussion
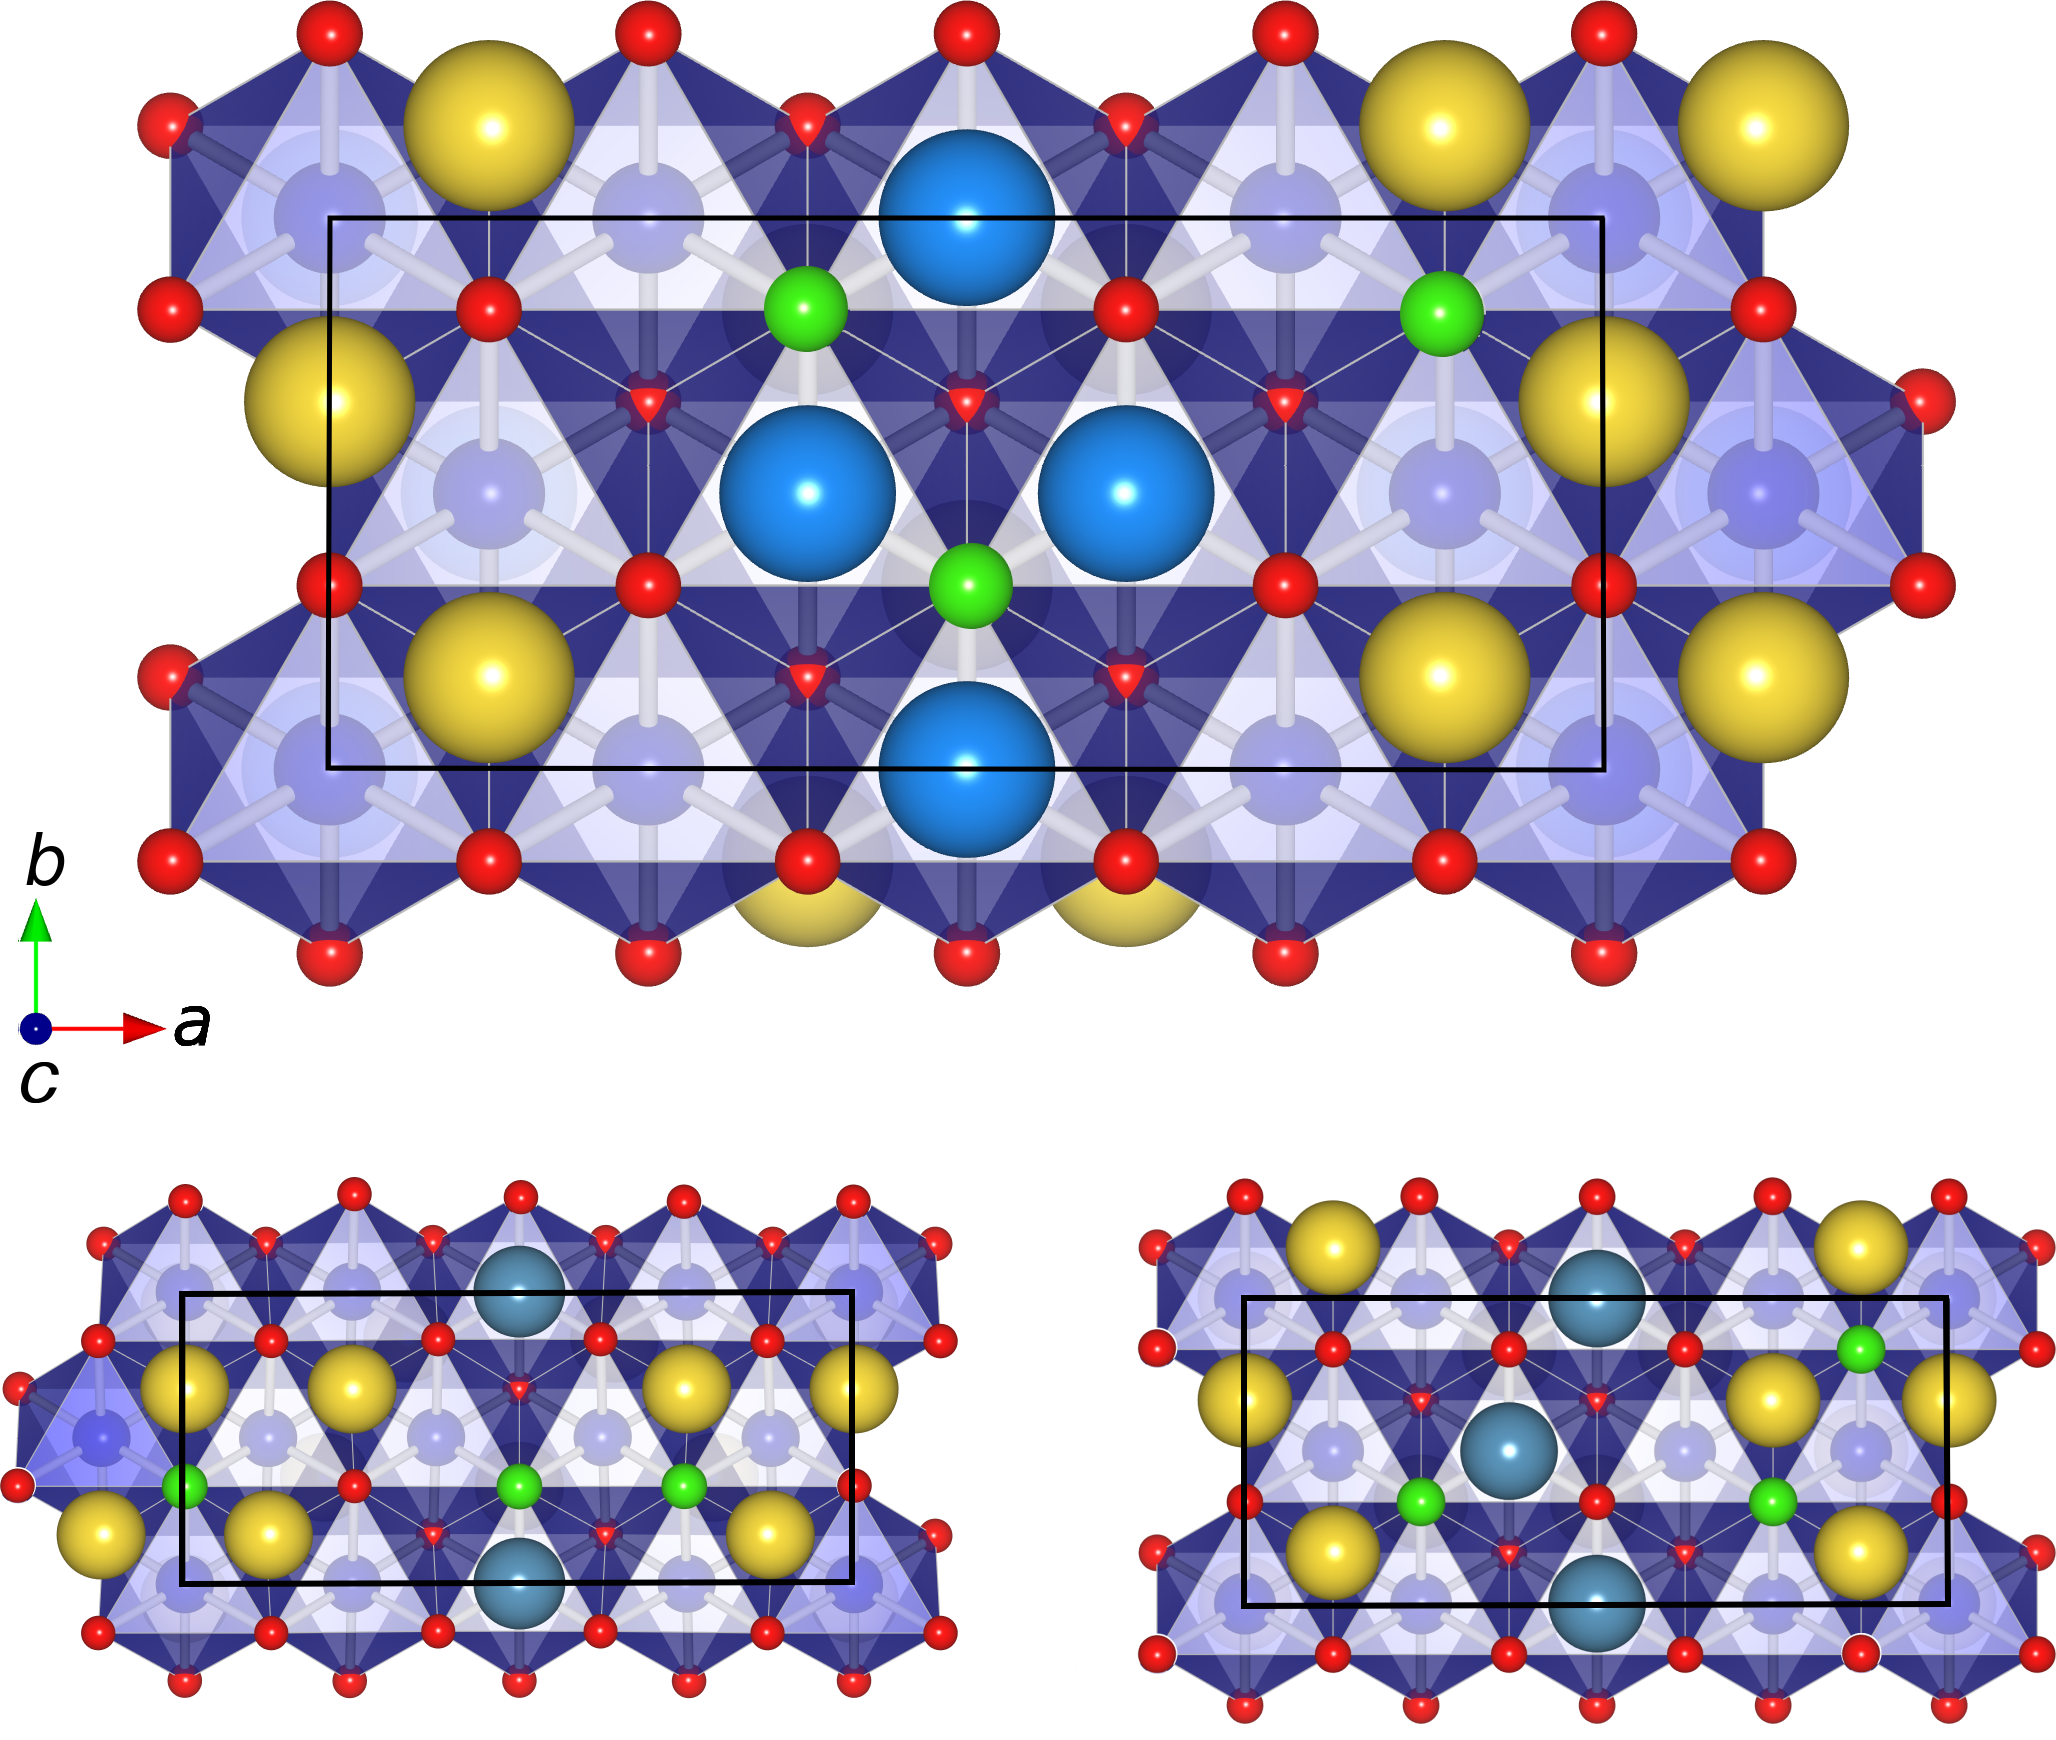
The three supercells used as staring points for creating oxygen vacancies are shown in Figure 1. The corresponding lattice parameters of our relaxed models (=11.45, =4.99, =10.88 Å) and the buckling of the CoO2 layer (0.05 )Roger et al. (2007) are in good agreement with those determined by neutron diffraction experiments (=11.37, =4.92, =10.81 Å)Huang et al. (2004).
Oxygen vacancies were considered in their
neutral, +1 and +2 charge states (V, V
and V in Kröger-Vink notation), created at
three different positions for each of the structural models.
Oxygen atoms were removed from the sites shown
as green balls in Fig.1, then the whole lattice structure
was relaxed to its equilibrium geometry.
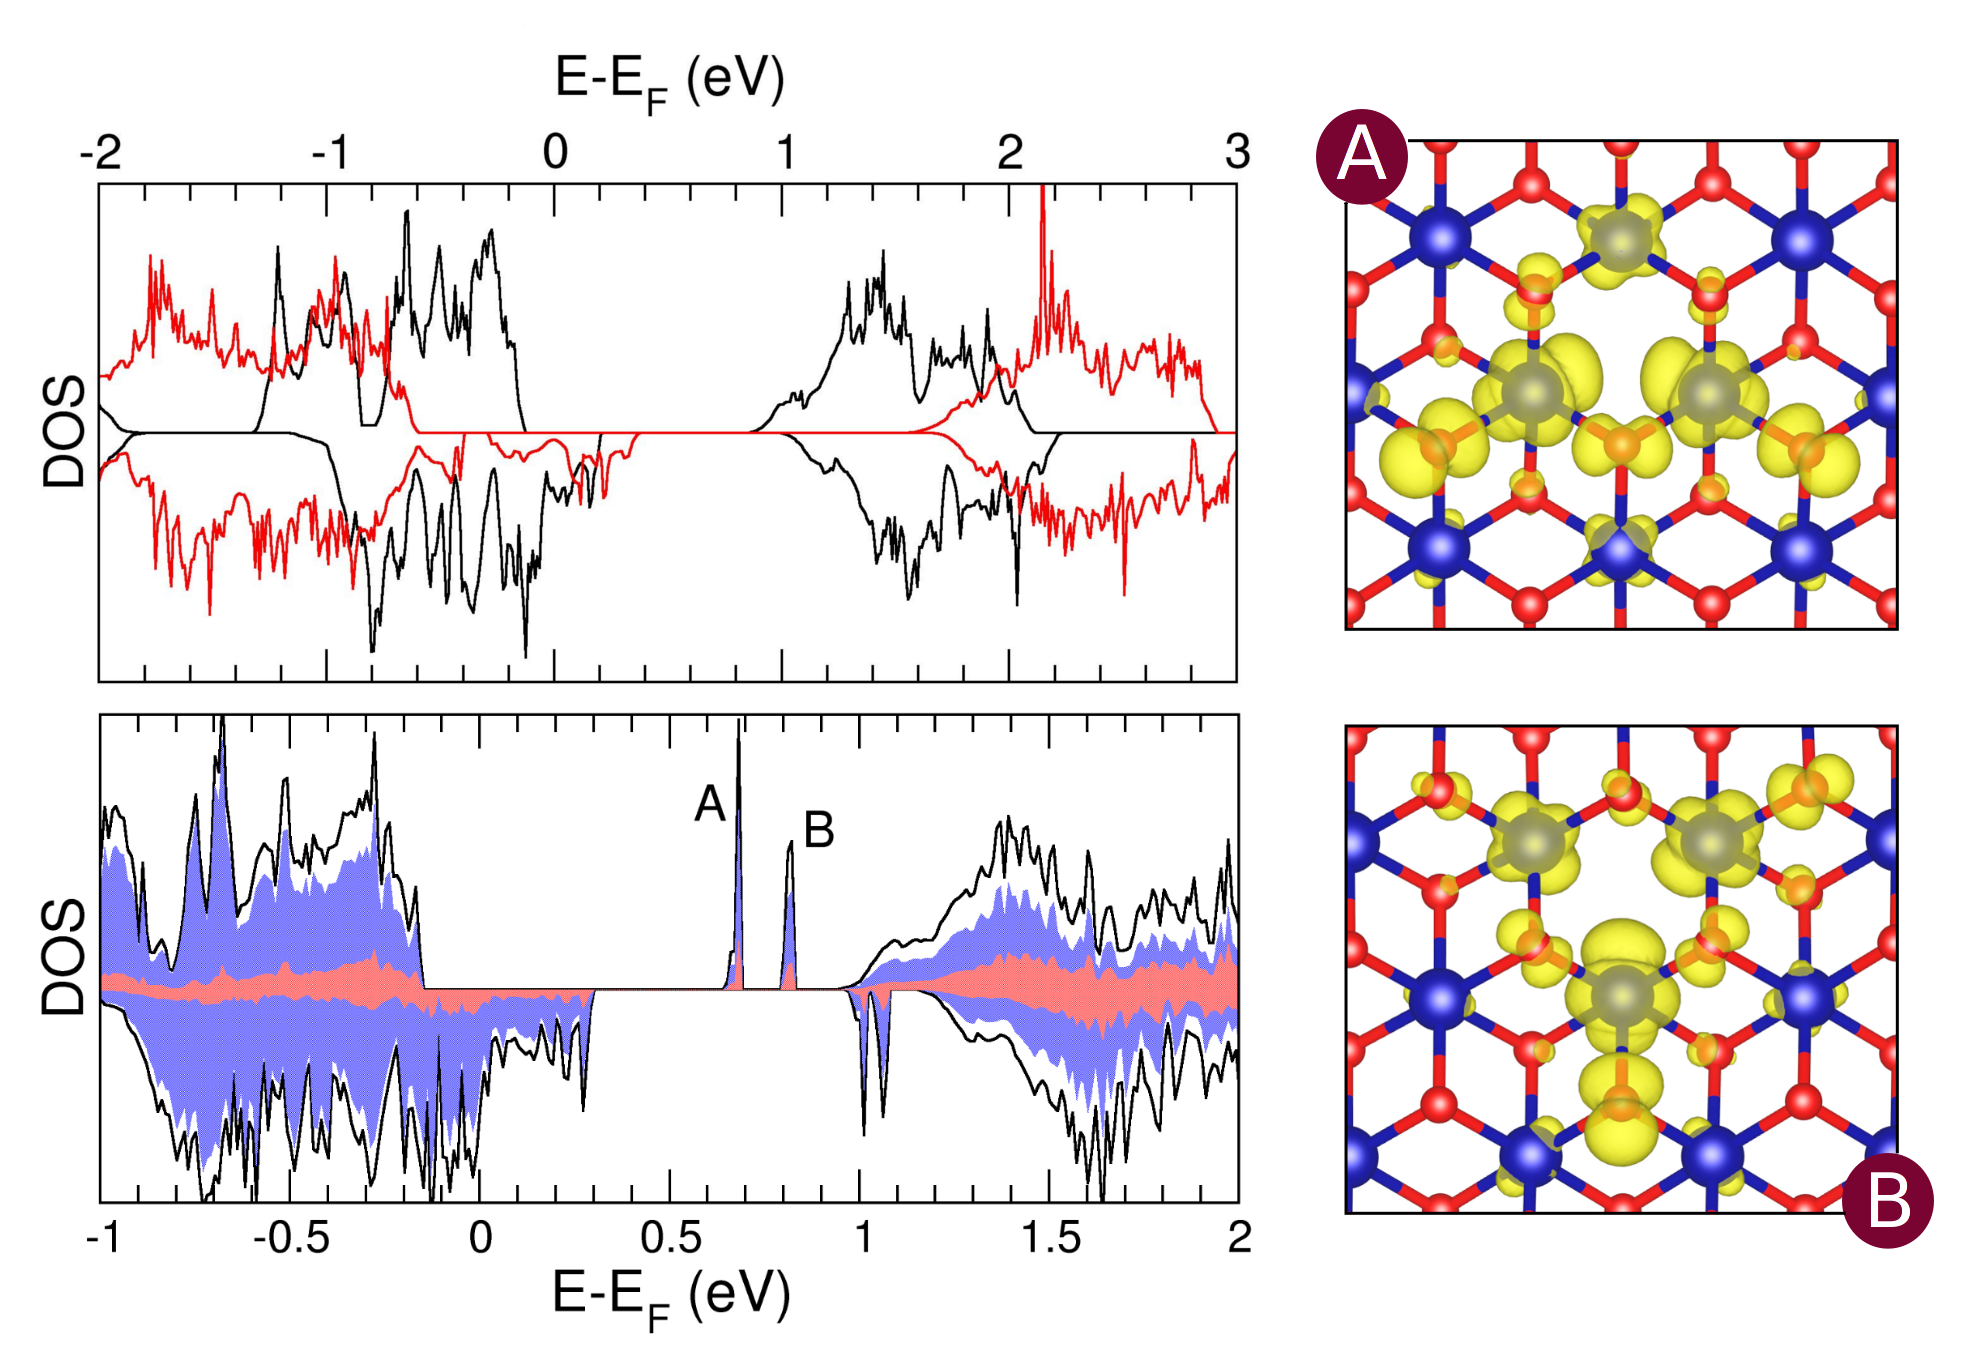
The electronic structure (density of states, DOS) of the perfect and
defective Na0.75CoO2 (diamond structure) is shown in Figure
2.
Firstly we note that the electronic structures we computed are half-metallic,
both for perfect and defective lattices, and independent of
using GGA or GGA+, in agreement with similar studiesZhang et al. (2004); Zou, Wang and Zeng (1996).
The various sodium ion orderings and vacancy positions we have considered
did not give any qualitative or quantitative differences in the DOS.
Indeed Na states are found only at much more negative energies in the
valence
band, confirming that the intercalating ions simply provide charge carriers
to the CoO2 layers.
For the pristine structure the dominant contributions to the DOS
close to the Fermi level come from
cobalt and oxygen states in the oxide layer, split by the distorted
octahedral crystal field into
manifoldsLandron and Lepetit (2008).
Applying Bader charge analysis to our GGA results
we found that all the Co ions in the
pristine structures are neither in a +3 or +4 state, but rather
that holes are delocalized on all the transition metal atoms.
When the term is considered, the holes are instead localized on
few Co ions, which states are pushed to lower energies into the
valence band, so that oxygen states are now dominant at the
Fermi energy (Fig.2).
However, the Hubbard-like term is an arbitrary parameter
used to correct GGA by applying an energy penalty to double
occupation of orbitals,
for which many different values have been proposed ranging from
4.0 eV Wang and Ni (2009) to 5.5 eVZhang et al. (2004).
While GGA+ was proven to localize holes in this class of materials
it is not known how reliable the ground state energies
(and their differences) are, in particular for metallic or half-metallic
systems. Recently, Hinuma
et al. showed that GGA+ performs worse than GGA in
reproducing experimental data for NaxCoO2 when 0.6,
in particular its lattice parameters and the formation energy of different
Na-ordered ground states Hinuma et al. (2008).
Moreover, we note that
within our approach the free energy of formation (Eq.2 and 6)
is dependent on the position of the Fermi level of Na0.75CoO2.
By introduction of the Hubbard-like term,
the valence band edge (hence the Fermi
level) shifts to lower energies, making the calculated free energy
of formation strongly dependent on the arbitrarily chosen value of .
In GGA, the homogeneous oxidation state of Co ions
is due to the self-interaction error that
tends to over-delocalize the electron density. Still this scenario is
compatible with recent NMR measurements which predict holes
delocalization in Na rich cobaltaltes rather than localized Co+4
sitesJulien et al. (2008); Lang et al. (2008). It is also known that at low temperature
different Na orderings establish
patterns of Co3+/Co4+
which may modulate the formation energies of vacancies in
neighbouring oxygen sites, and this effect would not be correctly
represented
within our computational approach. Nevertheless, at high temperature
the sodium sublattice is liquid-likeWeller et al. (2009) and fast diffusing Na ions
would average out this effect.
We then expect our GGA approach to be appropriate for
representing qualitatively the high
phase, while it may fail
representing the fine modulation induced by the spin states of
cobalt ions at low temperature. Therefore, in this work we chose to
rely only on free energies of formation computed with GGA, that are free
from any arbitrary term.
By looking at the GGA electronic structure of the defective system
in Figure 2 we notice an enlargement of the band gap (of
about 25 for the spin majority component),
in which two sharp defect states lying at about 0.12 eV
from each other are found.
Charge density isosurfaces corresponding to the defect states are very
similar in shape, and mostly localized on the vacancy nearest neighbors.
Using a simple tight-binding argument for the bipartite CoO2 lattice it is
possible to predict how the removal of two orbitals at the oxygen site,
i.e. upon vacancy formation, as many degenerate states
(known as midgap states) localize on the Co
sublatticeInui et al. (1994); Lieb (1989).
In this case we suggest
that the difference in symmetry and energy of the two defect levels may be
caused by the Coulomb potential generated by the Na ions, which modulates
the on-site energies of Co and O sitesMarianetti and Kotliar (2007).
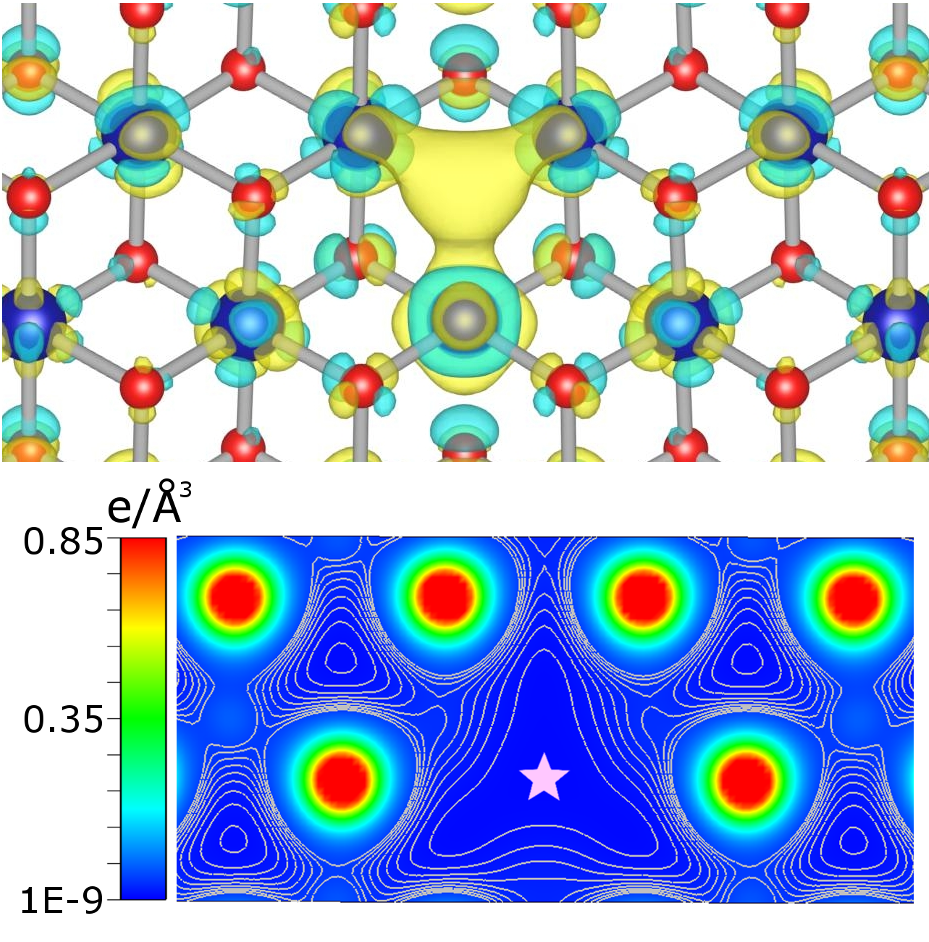
The analysis of the ground state electronic structure
revealed that in the neutral defect calculation
V, electron density accumulates at the vacancy site and
on the three nearest neighbouring Co ions.
The difference in electron
density for the neutral and doubly charged system is shown in
Figure 3.
This difference in charge is too small
to give a perfectly neutral defect site, but rather a partially positively
charged vacancy surrounded by three Co ions which are
reduced by 0.2 electrons each.
We note here that GGA+U gives qualitatively the same results.
The charge density at the vacancy site is removed by progressively
increasing the system charge, resulting in an effectively doubly
positively charged oxygen vacancy V, as expected.
The same analysis showed that Co neighbors
have been reduced by 0.05 /atom when increasing the system charge
to .
Gibbs’ free energies of formation () for oxygen vacancies
are shown in Table I
for the high temperature regime ( K) relevant for applications as
thermoelectric material.
Results are reported for the three different models in
both a and supercell,
corresponding to Na0.75CoO2-δ with
and , respectively.
The table values were based on the Fermi energy of the perfect
material and atm.
| (eV) | ||||||||
|---|---|---|---|---|---|---|---|---|
| =0.031 | =0.016 | |||||||
| V | V | V | V | V | V | |||
| diam1 | 2.19 | 2.26 | 2.30 | 2.27 | 2.27 | 2.28 | ||
| diam2 | 2.31 | 2.34 | 2.36 | 2.32 | 2.34 | 2.36 | ||
| diam3 | 2.29 | 2.33 | 2.36 | 2.35 | 2.37 | 2.39 | ||
| zigzag1 | 2.35 | 2.37 | 2.37 | 2.36 | 2.37 | 2.39 | ||
| zigzag2 | 2.32 | 2.37 | 2.39 | 2.39 | 2.40 | 2.40 | ||
| zigzag3 | 2.37 | 2.42 | 2.44 | 2.41 | 2.43 | 2.45 | ||
| FHC1 | 2.46 | 2.44 | 2.48 | 2.40 | 2.39 | 2.42 | ||
| FHC2 | 2.37 | 2.39 | 2.41 | 2.38 | 2.37 | 2.39 | ||
| FHC3 | 2.19 | 2.24 | 2.26 | 2.20 | 2.23 | 2.25 | ||
Overall, the defect formation energies shown in Table I are quite high, ranging from 2.19 to 2.48 eV at K and atm, implying a very low concentration of vacancies. Formation energies are distributed in a narrow range of 0.2 eV, with no clear preference for any of the structural models.
This suggests that the Na
ordering only plays a minor role for the vacancy formation
energy. As well, the difference in the for neutral and charged
defects is also small at both the concentrations considered,
and lower than 0.1 eV in most of the cases.
This suggests that the Coulomb potential
generated by the charged defect is efficiently screened already at the
length scale of the shortest lattice parameter, i.e. 5.0 Å.
Nevertheless, it appears that the doubly charged defect
V is
slightly favored compared to the other two possible charges, suggesting a
non-perfect dielectric screening. This small energy difference is a result of
Na0.75CoO2-δ being a -type conductor,
with unfilled valence states.
These states lay at energies only slightly above the Fermi level
(see Fig.2), and are readily filled by the extra electron(s)
accompanying the singly charged and neutral oxygen vacancies.
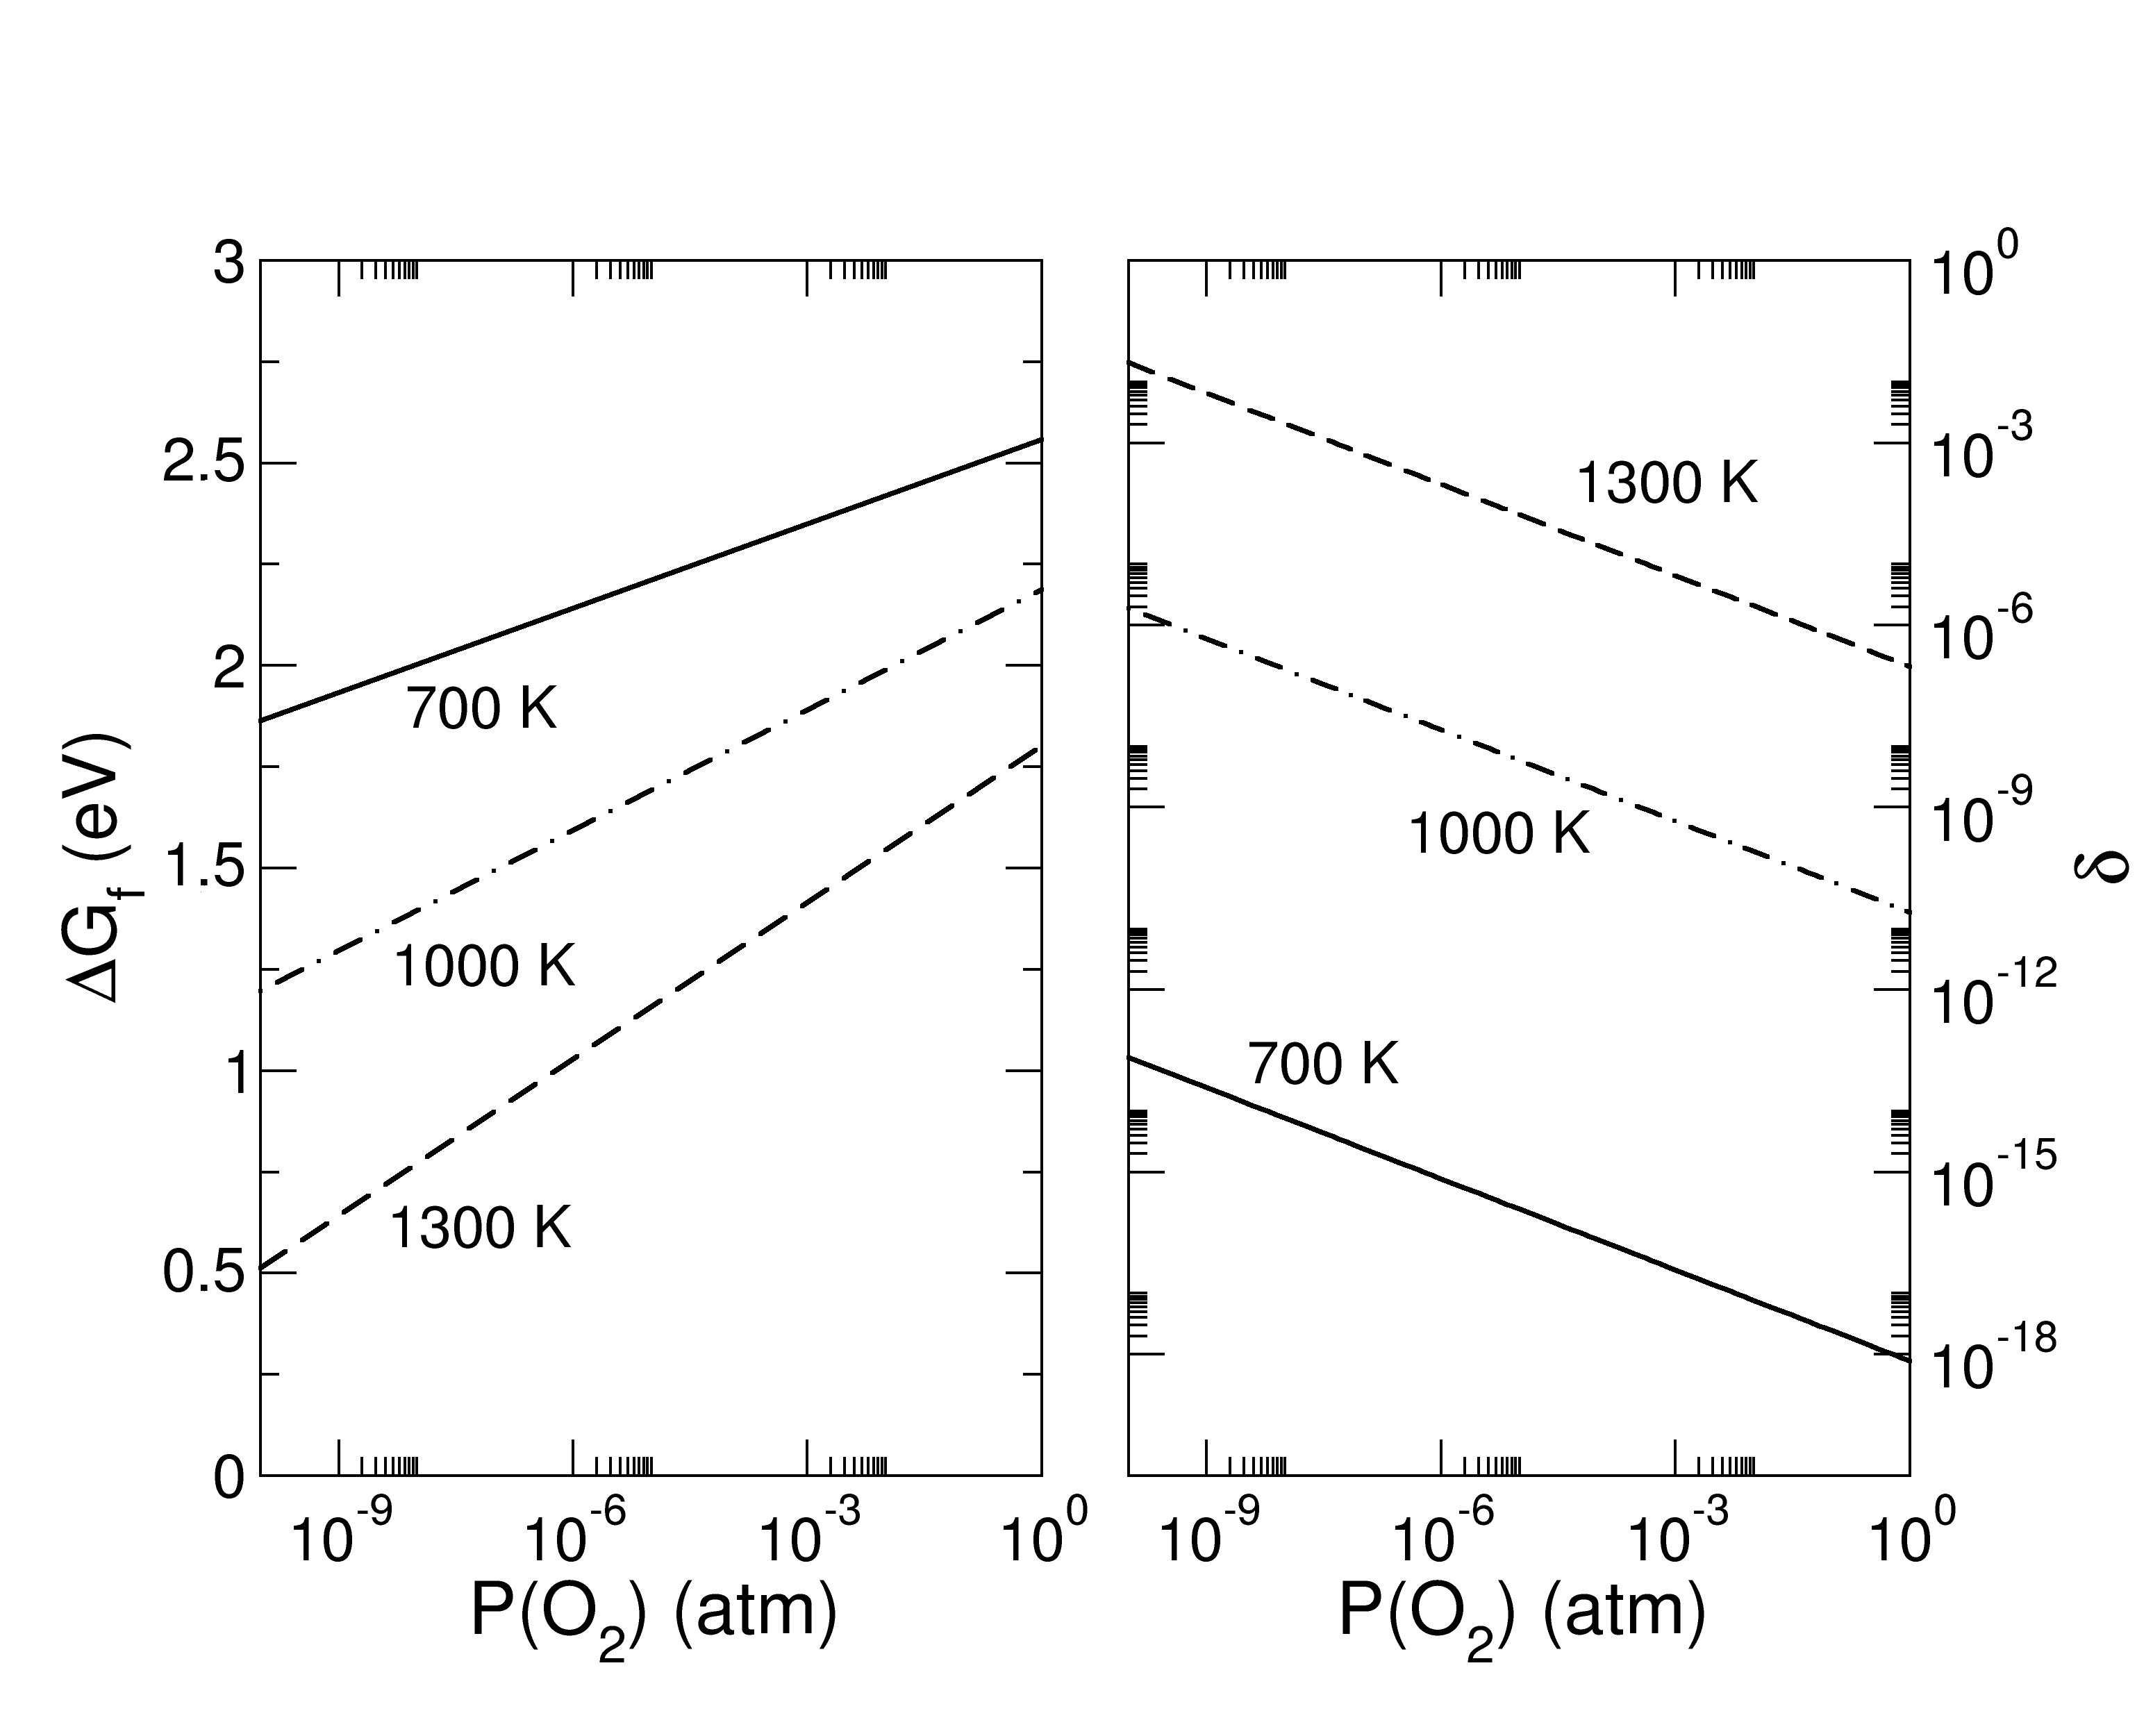
In order to quantify the concentration of vacancies under relevant
experimental conditions we calculated for at
different temperatures for the structure with the lowest free energy of
formation (2.19 eV) in Table 1. Results are shown in
the left panel of Figure 4 for three
different temperatures (700, 1000 and 1300 K) as a function of
.
In the right panel we show the corresponding concentration of vacancies per
formula unit, . We also note that
our formation energies are in good agreement with those recently
reported by Yoshiya et al. Yoshiya et al. (2010) for and .
It is clear that the oxygen vacancy free energy of formation is very high
at relevant temperatures and oxygen partial pressures.
Even at extreme experimental conditions
such as K (close to the homogeneous melting pointPeng and Lin (2009))
and atm the vacancy concentration would be as
little as .
If more common experimental conditions are chosen, e.g. K and
atm, we obtain . This is several
orders of magnitude lower than reported in some previous publications,
e.g. Ref. Tsai et al. (2010).
Having ruled out the Na ordering as the main influence on the vacancy
formation
energy we now test the role of sodium vacancies, thus indirectly that of
the Co oxidation state.
To do this we modify the sodium content , as it is known
to determine directly the magnetic behaviour
(hence the oxidation state)
of Co ions by supplying electrons to the oxide layersLang et al. (2008).
We therefore studied the V
defect formation for a range of Na concentrations, in order to
span as much as
possible the possible cobalt charges, from +4 ( 0)
to +3 ( 1).
Two different Na orderings were generated for each value starting from the
diamond structure,
and the oxygen vacancy was created at three different sites in
each of those.
Averaged GGA results for all the structures considered
are shown in Fig.5, using the same
and (O2) conditions as
in Table 1.
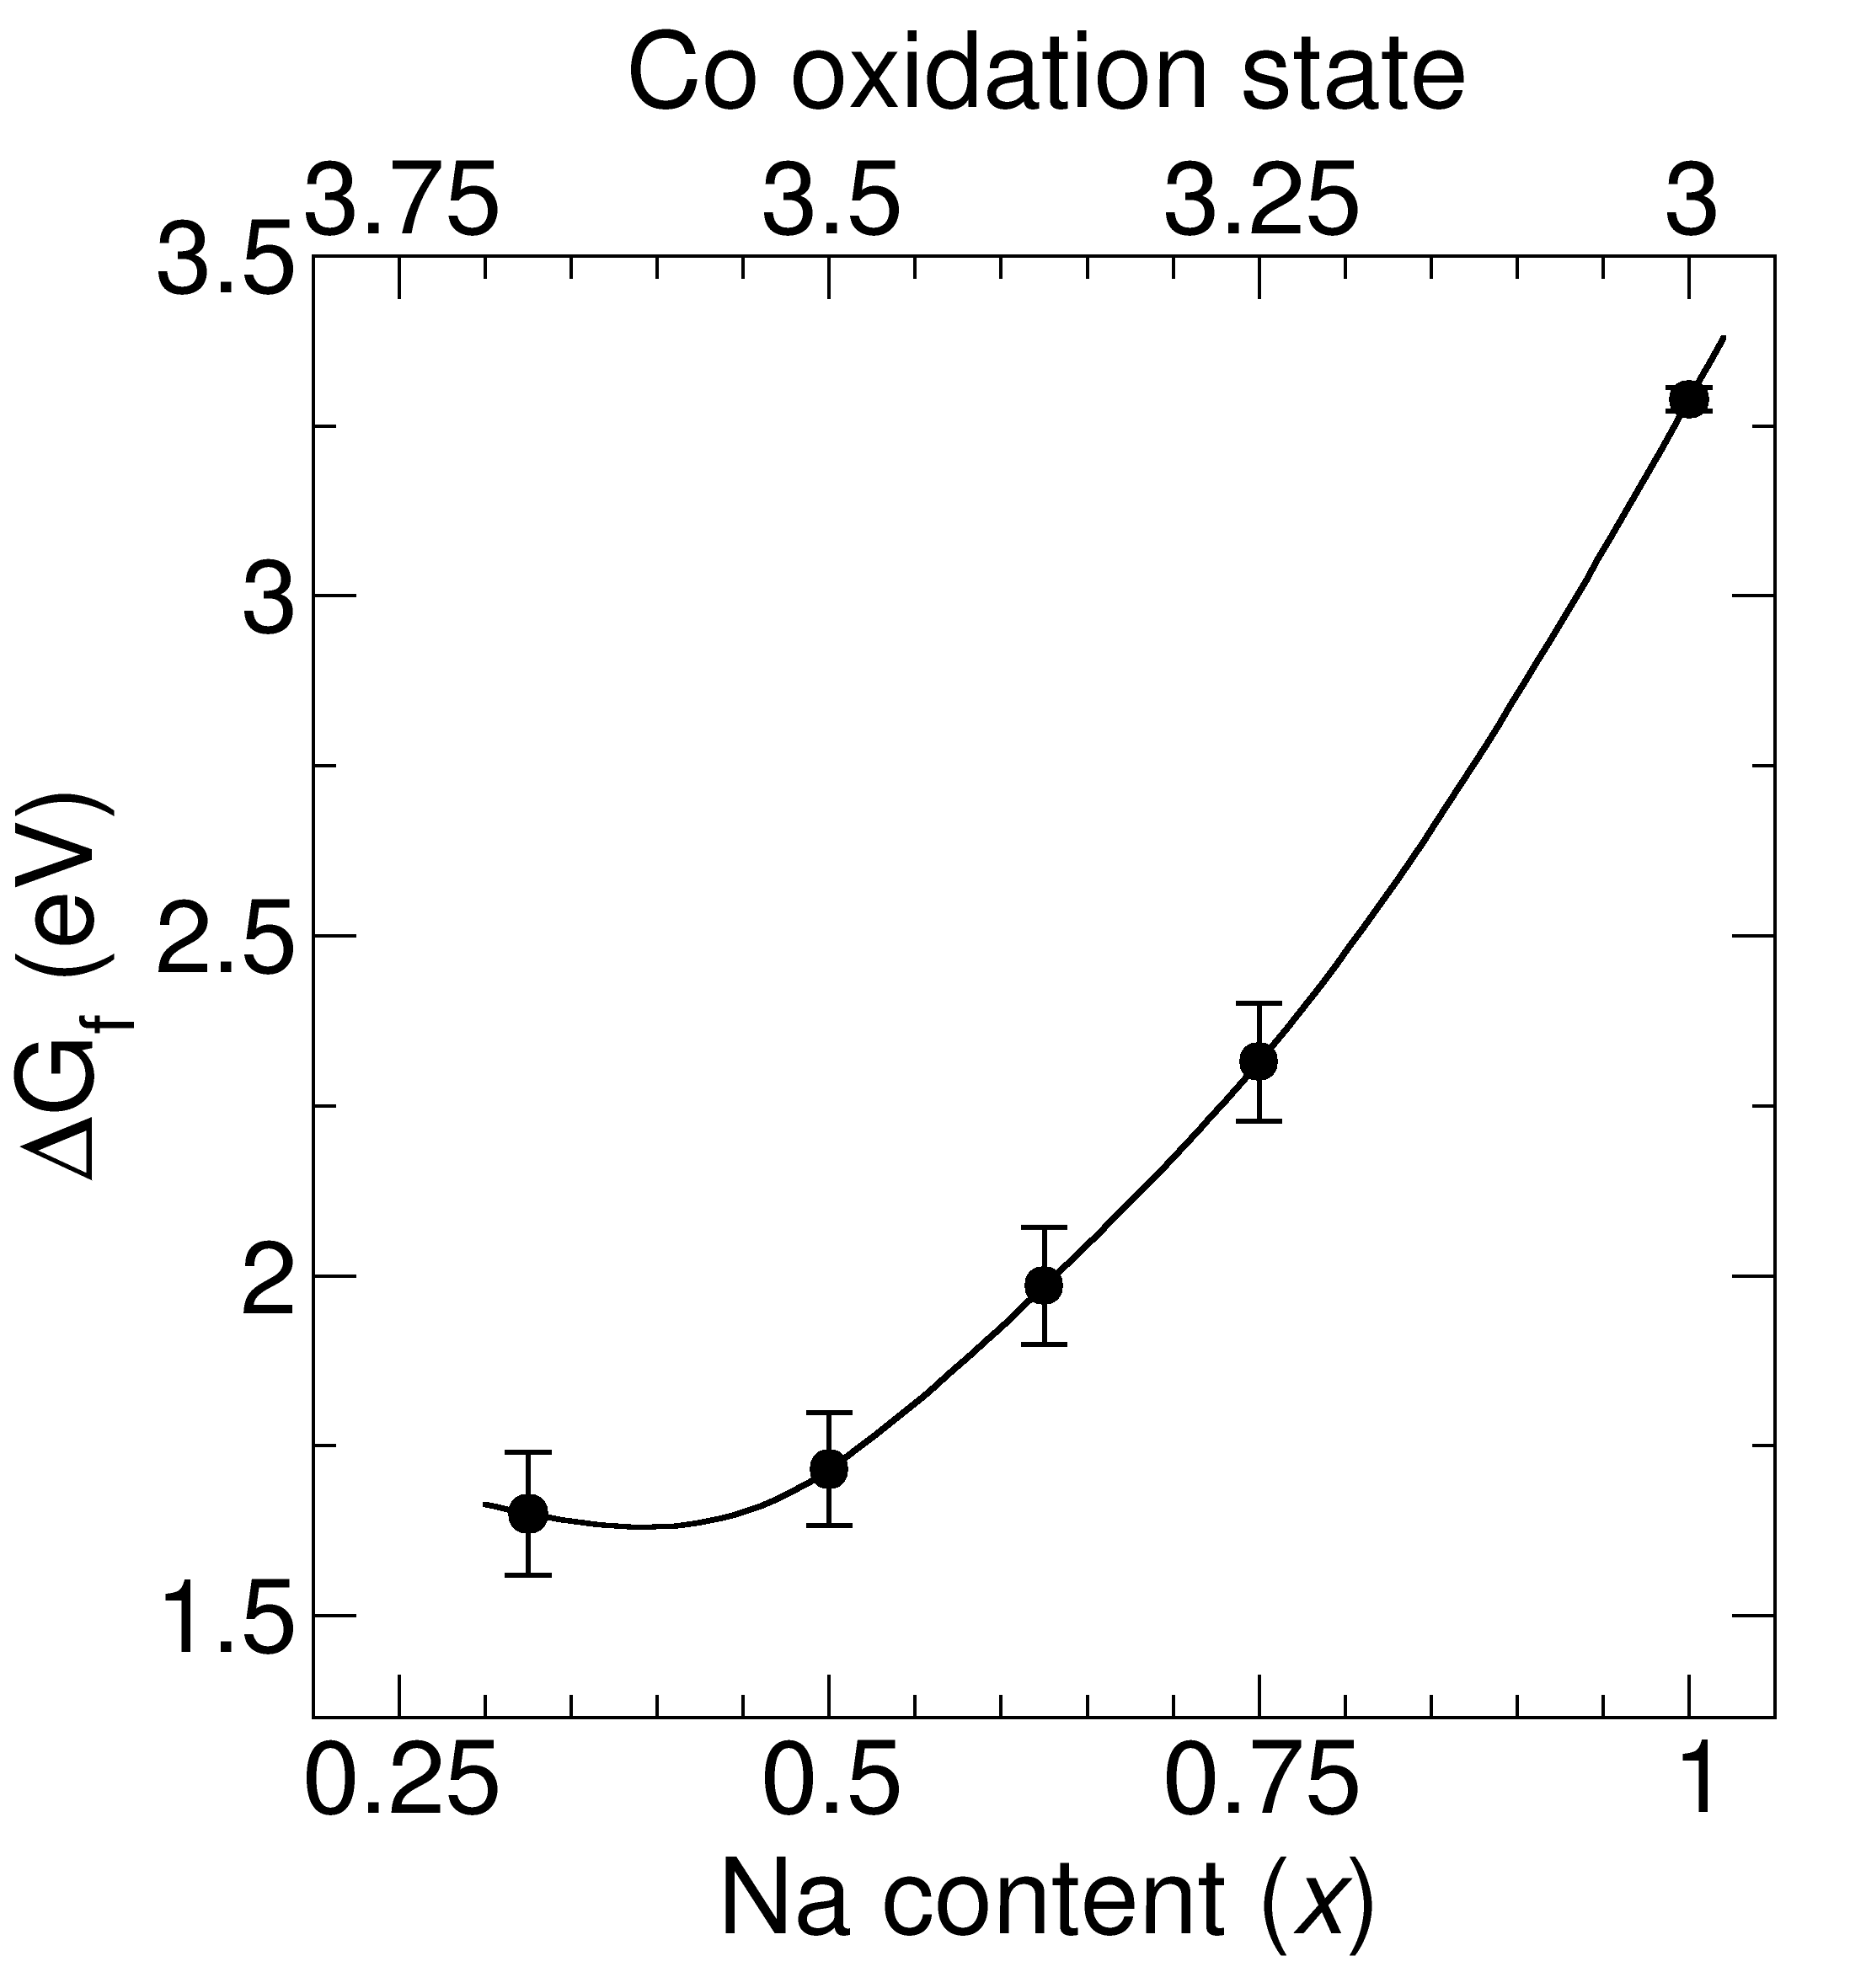
For Na rich structures, the change in the formation energies with
is substantial, but the absolute energies are still very large.
When the Na content is reduced, lowers almost linearly down to
=0.50, where it reaches a plateau of about 1.70 eV, suggesting
that Co4+ ions favor the formation of O vacancies.
However, the magnitude of the free energy of formation
is still high, so that even at low sodium content (0.5)
the concentration of oxygen vacancies under relevant experimental
conditions is expected to be very low.
A detailed analysis of the effect of oxygen vacancies on the Co oxidation
state or vice versa goes beyond the scope of this study.
IV Conclusions
In conclusion, we have shown that the equilibrium concentration
of oxygen vacancies in sodium cobaltate is very low at conditions
relevant for applications
as thermoelectric material.
Our results may help to settle the disagreement
between experimental reports on the oxygen
stoichiometry in NaxCoO2. At high sodium content,
concentrations of vacancies ranging from
= 0.05 to 0.16 have been
reportedShu et al. (2010); Bañobre-Lopez
et al. (2005); Chou et al. (2005); Tsai et al. (2010), but
other studies have concluded that the oxygen concentration is
indeed stoichiometricViciu et al. (2006); Choi and Manthiram (2006); Mukhamedshin and Alloul (2011).
Our results are clearly consistent with the latter ones.
We can here only speculate on the reason for this discrepancy.
One possible explanation is existence of secondary phases in some of the
experiments, where these phases are responsible for the oxygen weight
loss upon reduction of oxygen partial pressure.
Other possibilities comprise Na evaporation,
the presence of other defects than considered here,
or unintended interaction between the sample and experimental setup.
V Acknowledgments
We acknowledge Tor Svendsen Bjørheim for
helpful suggestions, the Research Council of Norway
(Renergi project THERMEL-143386) for economic support,
and the NOTUR consortium for providing access to their computational
facilities.
References
- Hinuma et al. (2008) Y. Hinuma, Y. S. Meng, and G. Ceder, Phys. Rev. B 77, 224111 (2008).
- Zandbergen et al. (2004) H. W. Zandbergen, M. Foo, Q. Xu, V. Kumar, and R. J. Cava, Phys. Rev. B 70, 024101 (2004).
- Meng et al. (2008) Y. S. Meng, Y. Hinuma, and G. Ceder, J. Chem. Phys. 128, 104708 (2008).
- Terasaki et al. (1997) I. Terasaki, Y. Sasago, and K. Uchinokura, Phys. Rev. B 56, 12685 (1997).
- Wang et al. (2003) Y. Wang, N. S. Rogado, R. J. Cava, and N. P. Ong, Nature 423, 425 (2003).
- Tsai et al. (2010) P. H. Tsai, T. Norby, T. T. Tan, R. Donelson, Z. D. Chen, and S. Li, Appl. Phys. Lett. 96, 141905 (2010).
- Shu et al. (2010) G. J. Shu, W. L. Lee, F.-T. Huang, M.-W. Chu, P. A. Lee, and F. C. Chou, Phys. Rev. B 82, 054106 (2010).
- Zhang et al. (2011) L. Zhang, X. N. Ying, and Z. C. Xu, J. Alloys Compd. 509, 4622 (2011).
- Stokłosa et al. (1985) A. Stokłosa, J. Molenda, and D. Than, Solid State Ionics 15, 211 (1985).
- Bañobre-Lopez et al. (2005) M. Bañobre-Lopez, F. Rivadulla, F. C. M. A. Lopez-Quintela, J. Rivas, and J. B. Goodenough, Chem. Mater. 17, 1965 (2005).
- Chou et al. (2005) F. C. Chou, E. T. Abel, J. C. Cho, and Y. S. Lee, J. Phys. Chem. Solids 66, 155 (2005).
- Mukhamedshin and Alloul (2011) I. R. Mukhamedshin and H. Alloul, Phys. Rev. B 84, 155112 (2011).
- Viciu et al. (2006) L. Viciu, Q. Wang, and R. J. Cava, Phys. Rev. B 73, 212107 (2006).
- Choi and Manthiram (2006) J. Choi and A. Manthiram, Phys. Rev. B 74, 205114 (2006).
- Zhang and Northrup (1991) S. B. Zhang and J. E. Northrup, Phys. Rev. Lett. 67, 2339 (1991).
- van de Valle and Martin (1987) C. G. van de Valle and R. M. Martin, Phys. Rev. B 35, 8154 (1987).
- Mattila and Zunger (1998) T. Mattila and A. Zunger, Phys. Rev. B 58, 1367 (1998).
- Kresse and Hafner (1994) G. Kresse and J. Hafner, Phys. Rev. B 49, 14251 (1994).
- Perdew et al. (1996) J. P. Perdew, K. Burke, and M. Ernzerhof, Phys. Rev. Lett. 77, 3865 (1996).
- Blöchl (1994) P. E. Blöchl, Phys. Rev. B 50, 17953 (1994).
- Liechtenstein et al. (1995) A. I. Liechtenstein, V. I. Anisimov, and J. Zaane, Phys. Rev. B. 52, R5467 (1995).
- Okabe et al. (2004) H. Okabe, M. Matoba, T. Kyomen, and M. Itoh, J. Appl. Phys. 95, 6831 (2004).
- Zhang et al. (2004) P. Zhang, W. Luo, V. H. Crespi, M. L.. Cohen, and S. G. Louie, Phys. Rev. B 70, 085108 (2004).
- Zou, Wang and Zeng (1996) L.-J. Zou, J.-L. Wang, and Z. Zeng, Phys. Rev. B 69, 132505 (2004).
- Balsys and Davis (1996) R. J. Balsys and R. L. Davis, Solid State Ionics 93, 279 (1996).
- Meng et al. (2005) Y. S. Meng, A. van der Ven, M. K. Y. Chan, and G. Ceder, Phys. Rev. B 72, 172103 (2005).
- Weller et al. (2009) M. Weller, A. Sacchetti, H. R. Ott, K. Mattenberger, and B. Batlogg, Phys. Rev. Lett. 102, 056401 (2009).
- Roger et al. (2007) M. Roger, D. J. P. Morris, D. A. Tennant, M. J. Gutmann, J. P. Hoff, J. U. Hoffmann, R. Feyerherm, E. Dudzik, D. Parbhakaran, A. T. Boothroyd, N. Shannon, B. Lake, and P. P. Deen, Nature 445, 631 (2007).
- Huang et al. (2004) Q. Huang, M. L. Foo, R. A. Pascal, J. W. Lynn, M. L. Toby, T. He, H. W. Zandbergen, and R. J. Cava, Phys. Rev. B 70, 184110 (2004).
- Landron and Lepetit (2008) S. Landron and M. B. Lepetit, Phys. Rev. B 77, 125106 (2008).
- Wang and Ni (2009) Y. L. Wang and J. Ni, Phys. Rev. B 76, 094101 (2007).
- Julien et al. (2008) M.-H. Julien, C. de Vaulx, H. Mayaffre, C. Berthier, M. Horvati, V. Simonet, J. Wooldridge, G. Balakrishnan, M. R. Lees, D. P. Chen, et al., Phys. Rev. Lett. 100, 096405 (2008).
- Lang et al. (2008) G. Lang, J. Bobroff, H. Alloul, G. Collin, and N. Blanchard, Phys. Rev. B 78, 155116 (2008).
- Inui et al. (1994) M. Inui, S. A. Trugman, and E. Abrahams, Phys. Rev. B 49, 3190 (1994).
- Lieb (1989) E. H. Lieb, Phys. Rev. Lett. 62, 1201 (1989).
- Marianetti and Kotliar (2007) C. A. Marianetti and G. Kotliar, Phys. Rev. Lett. 98, 176405 (2007).
- Yoshiya et al. (2010) M. Yoshiya, T. Okabayashi, M. Tada, and C. A. J. Fisher, J. Elect. Mater. 39, 1681 (2010).
- Peng and Lin (2009) J. B. Peng and C. T. Lin, J. Cryst. Growth 311, 291 (2009).