Thermoelectric efficiency of topological insulators in a magnetic field
Abstract
We study the thermoelectric properties of three-dimensional topological insulators in magnetic fields with many holes (or pores) in the bulk. We find that at high density of these holes in the transport direction the thermoelectric figure of merit, , can be large due to the contribution of the topologically protected conducting surfaces and the suppressed phonon thermal conductivity. By applying an external magnetic field a subgap can be induced in the surface states spectrum. We show that the thermoelectric efficiency can be controlled by this tunable subgap leading to the values of much greater than . Such high values of for reasonable system parameters and its tunability by magnetic field make this system a strong candidate for applications in heat management of nanodevices, especially at low temperatures.
Introduction. Topological insulators (TIs) recently attracted a lot of attention as potential candidates for spintronics applications. Hasan and Kane (2010) This interest is based on the remarkable properties of TIs, Qi and Zhang (2010); Fu et al. (2007); Hsieh et al. (2008); Chen et al. (2009) namely, the fact that their surfaces (for three-dimensional TIs) or edges (for two-dimensional TIs) possess topologically protected conducting states. In this paper we argue that these unique properties of TIs can also be employed to make very efficient thermoelectrics. Takahashi and Murakami (2010); Ghaemi et al. (2010); Tretiakov et al. (2010, 2011)
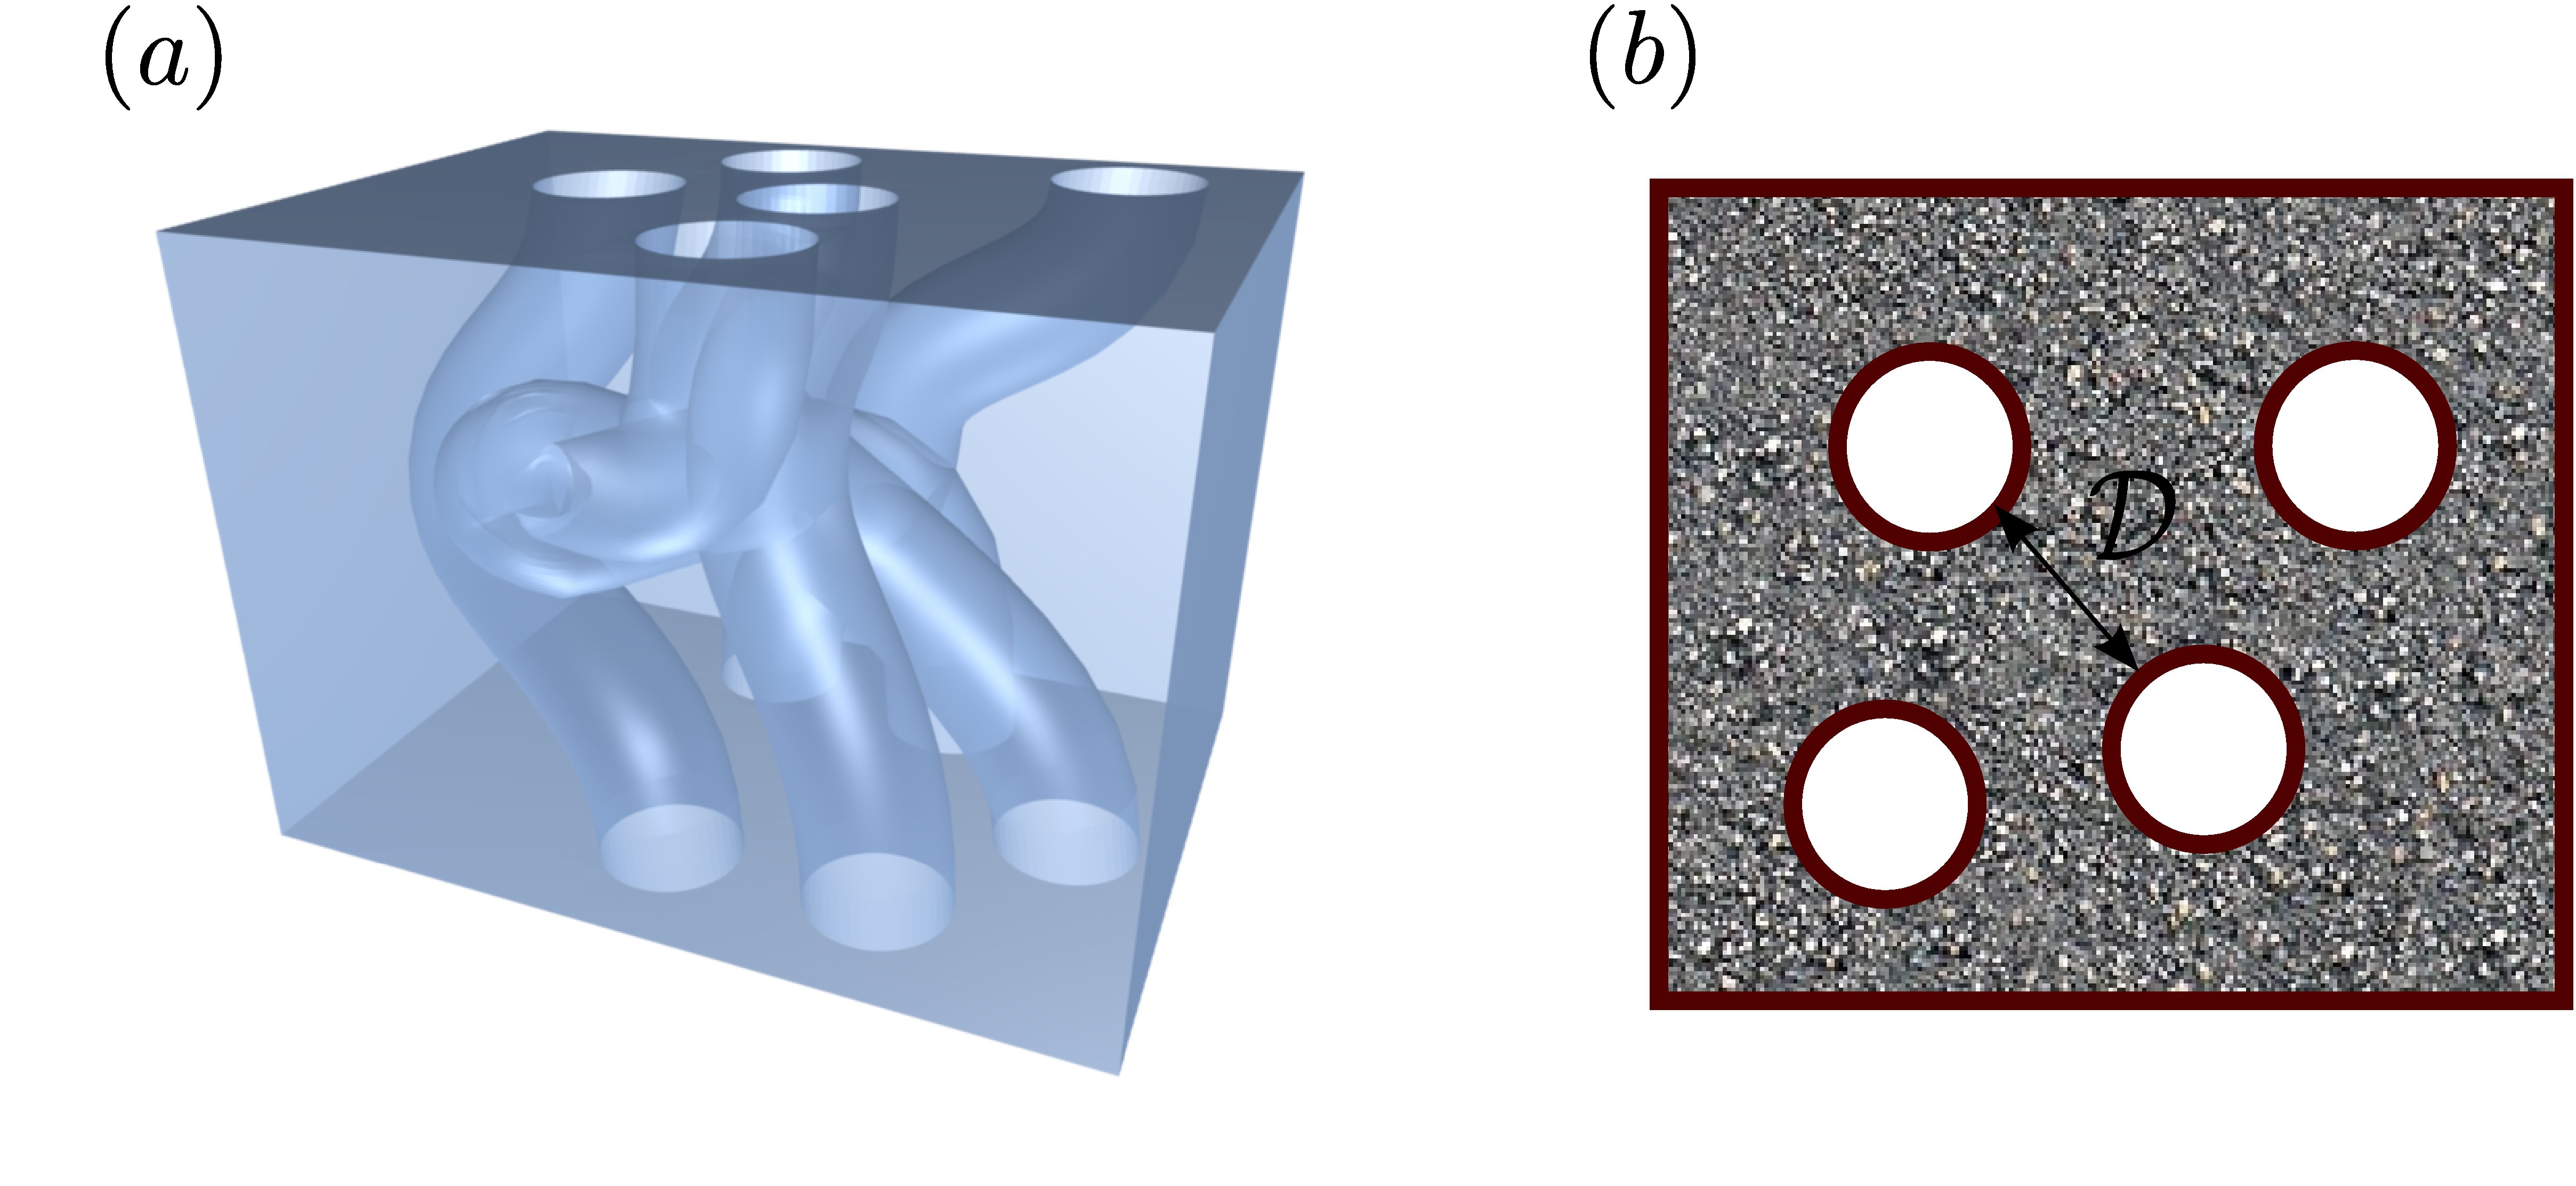
Good thermoelectric materials Snyder and Toberer (2008); Tritt (1999); Hicks and Dresselhaus (1993); Lyeo et al. (2004); Mukerjee and Moore (2007); Markussen et al. (2009); Dubi and Di Ventra (2011); Shahil et al. (2010); Venkatasubramanian et al. (2001); Zhang et al. (2010); Teweldebrhan et al. (2010, 2010) are characterized by a low thermal conductivity and high thermopower and electric conductivity. The large thermopower requires steep dependence of the electronic density of states on energy, which can be achieved by having the chemical potential close to the bottom of a band. The relatively high conductivity demands the gap to be low. These combined requirements point to semiconductors with heavy elements as the best candidates for the thermoelectric materials. Some of these semiconductors were recently rediscovered as TIs. We show that by making holes in these TI materials (see Fig. 1) and inducing subgap in their surface states by means of applied magnetic fields or proximity of ferromagnets one can significantly enhance their thermoelectric efficiency. The high density of holes in the direction of transport has two positive effects: 1) to trap phonons and thus reduce the thermal conductivity; 2) to increase the surface to bulk ratio and therefore effectively enhance the electric conductivity of the sample. The effect of the applied magnetic field is to increase the thermopower.

Thermoelectric figure of merit. The thermoelectric efficiency is defined as a ratio of an electric power generated to the total heat flux through the sample. Therefore, it is characterized by the dimensionless number
| (1) |
where is electric conductivity, is Seebeck coefficient (or thermopower), is temperature, and is thermal conductivity. The latter, in general, has contributions both from electrons () and from phonons ().
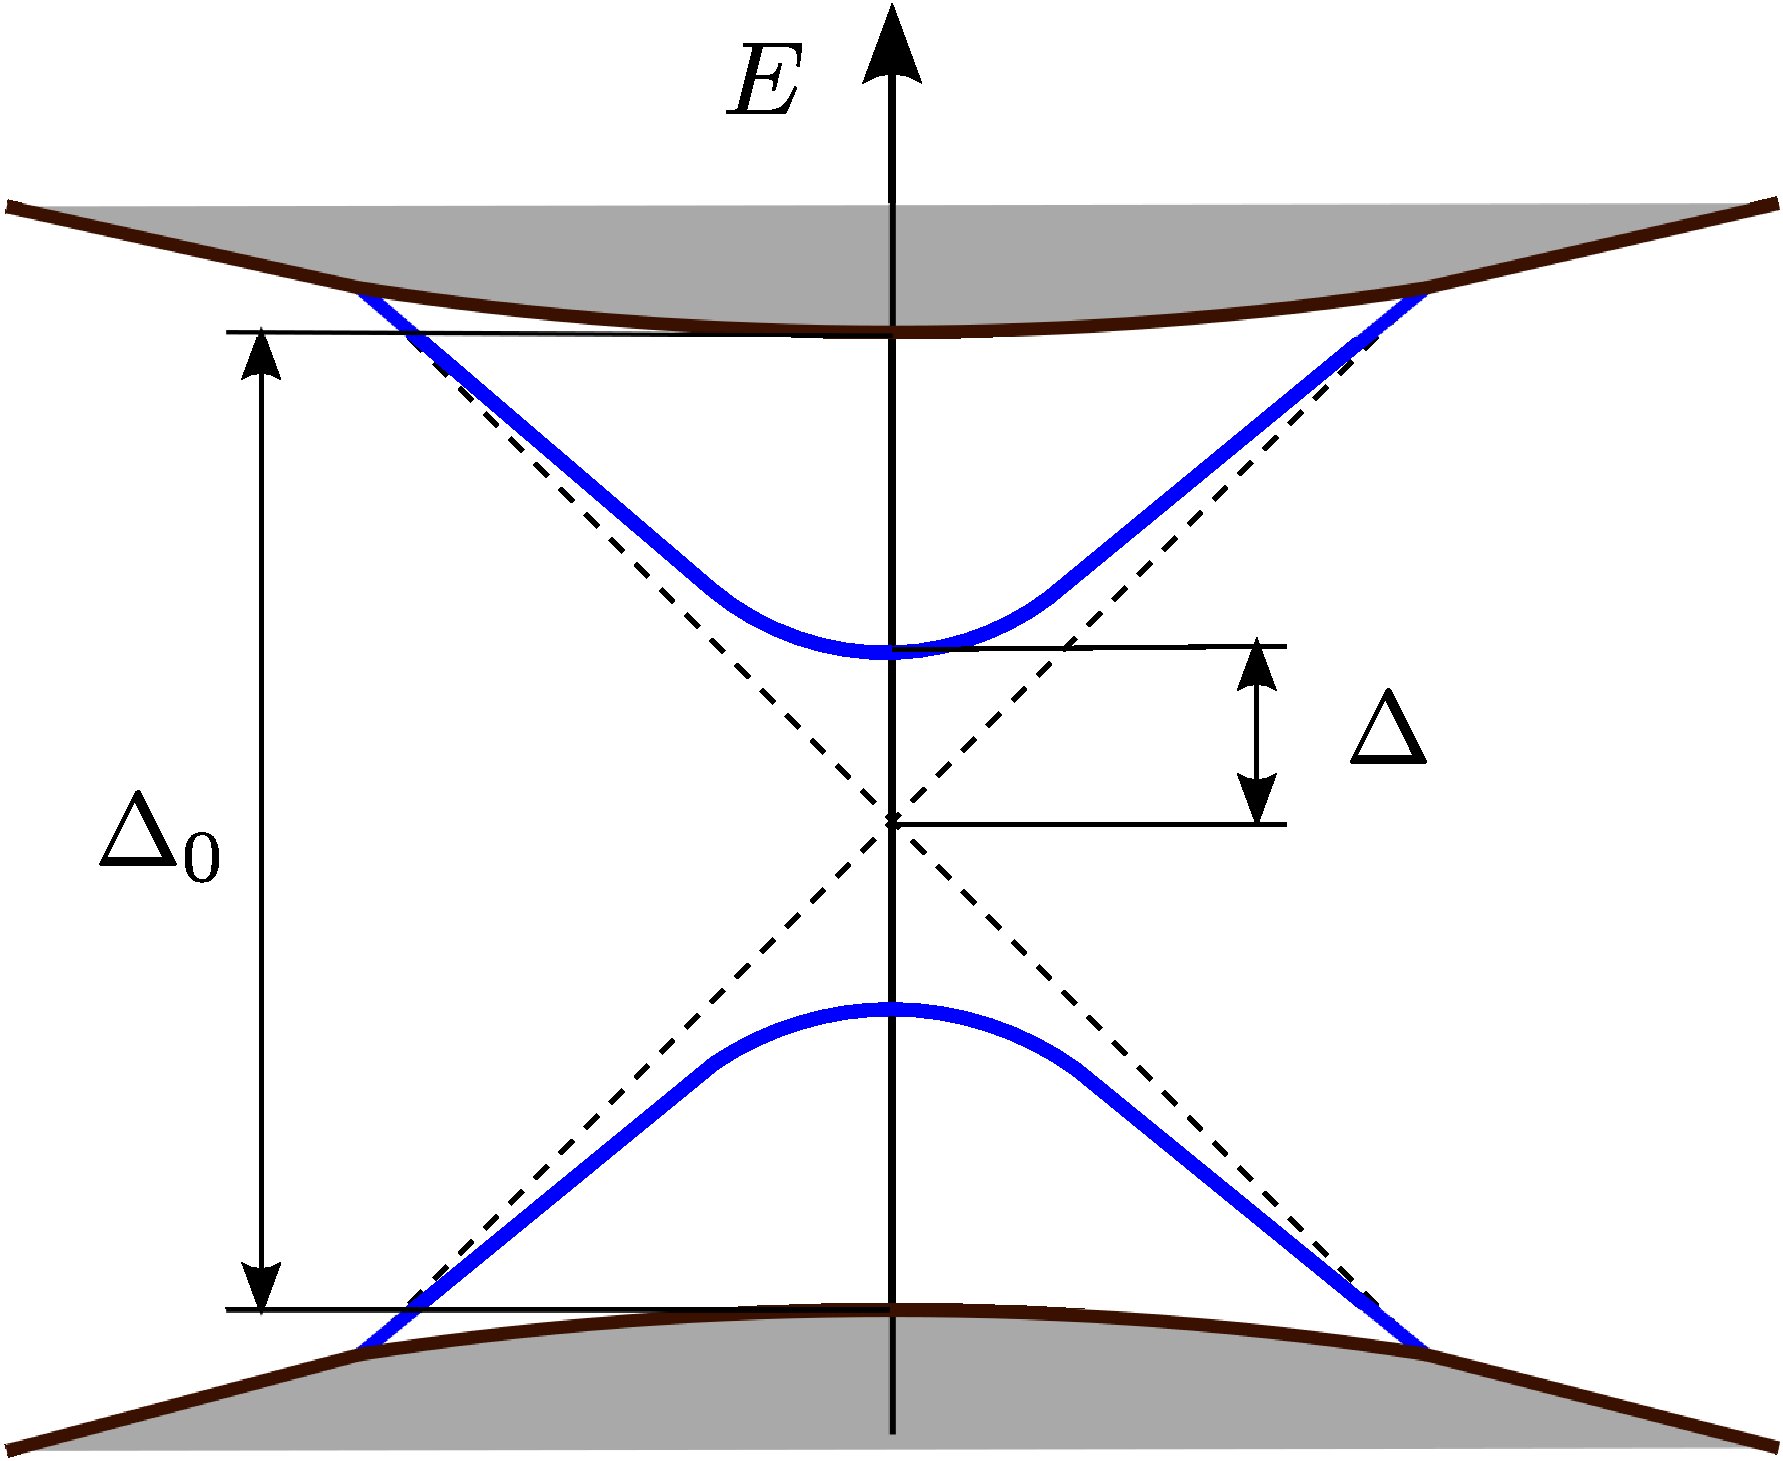
In the absence of magnetic field or magnetic impurities, the TIs have ungaped surface states. These propagating states are confined to the close proximity of the surfaces. Their existence is protected by the topology of the bulk band structure. These states have cone-like 2D Dirac spectrum, , where is the constant Dirac electron velocity. Application of a magnetic field, doping with magnetic impurities, or hybridization of these states due to close proximity of two surfaces can induced a Dirac subgap , Analytis et al. (2010); Linder et al. (2009); Lu et al. (2010) which in the case of magnetic field is . Then the surface spectrum takes the form , see Fig. 2. Generally this subgap is much smaller than the bulk gap, . For three-dimensional TIs ranges from eV to eV for such as and .
To study the thermal and electric transport in these materials we employ the linear response theory. Ashcroft and Mermin (1976) The electric () and thermal () currents are given by linear combinations of the temperature and chemical potential gradients:
| (2) | |||
| (3) |
where is the electron charge. Using Onsager relations, one can find from these equations the electrical conductivity , Seebeck coefficient , and electron thermal conductivity . The figure of merit, , can then be represented in terms of these linear coefficients as
| (4) |
In Eq. (4) it is assumed that the transport coefficients have bulk and surface contributions , where is the factor related to surface/bulk ratio (porosity) and has dimension of length. The holes in the sample does not have to form a periodic structure and can be placed randomly. The same idea applies to porous TI samples, see Fig. 3 (a). The parameter characterizes the average distance between the pores (holes) of the average radius , see Fig. 3 (b). Here is the phonon contribution to the thermal conductivity in the bulk (phonon contribution to the thermal conductivity for the surface TI states is much smaller than that in the bulk).

To estimate the surface contribution of TI to the transport coefficients we assume the bands to be Dirac-like with a subgap and use Boltzmann equation in the relaxation time approximation,
| (5) |
Here the sum is over the upper and lower bands, , and with being the Fermi distribution function. Then taking relaxation time to be independent of energy, we find
| (6) |
where is Planck constant, , and .

When the chemical potential is far below the bottom of the conduction band, , the contribution from the bulk to the transport coefficients is exponentially suppressed, , and can be neglected. The same argument works also for the valence band contribution when is far from the valence band edge. Thus, the thermoelectric transport is dominated by the surface states and the only sensible bulk contribution is to the phonon thermal conductivity . Then the figure of merit becomes
| (7) |
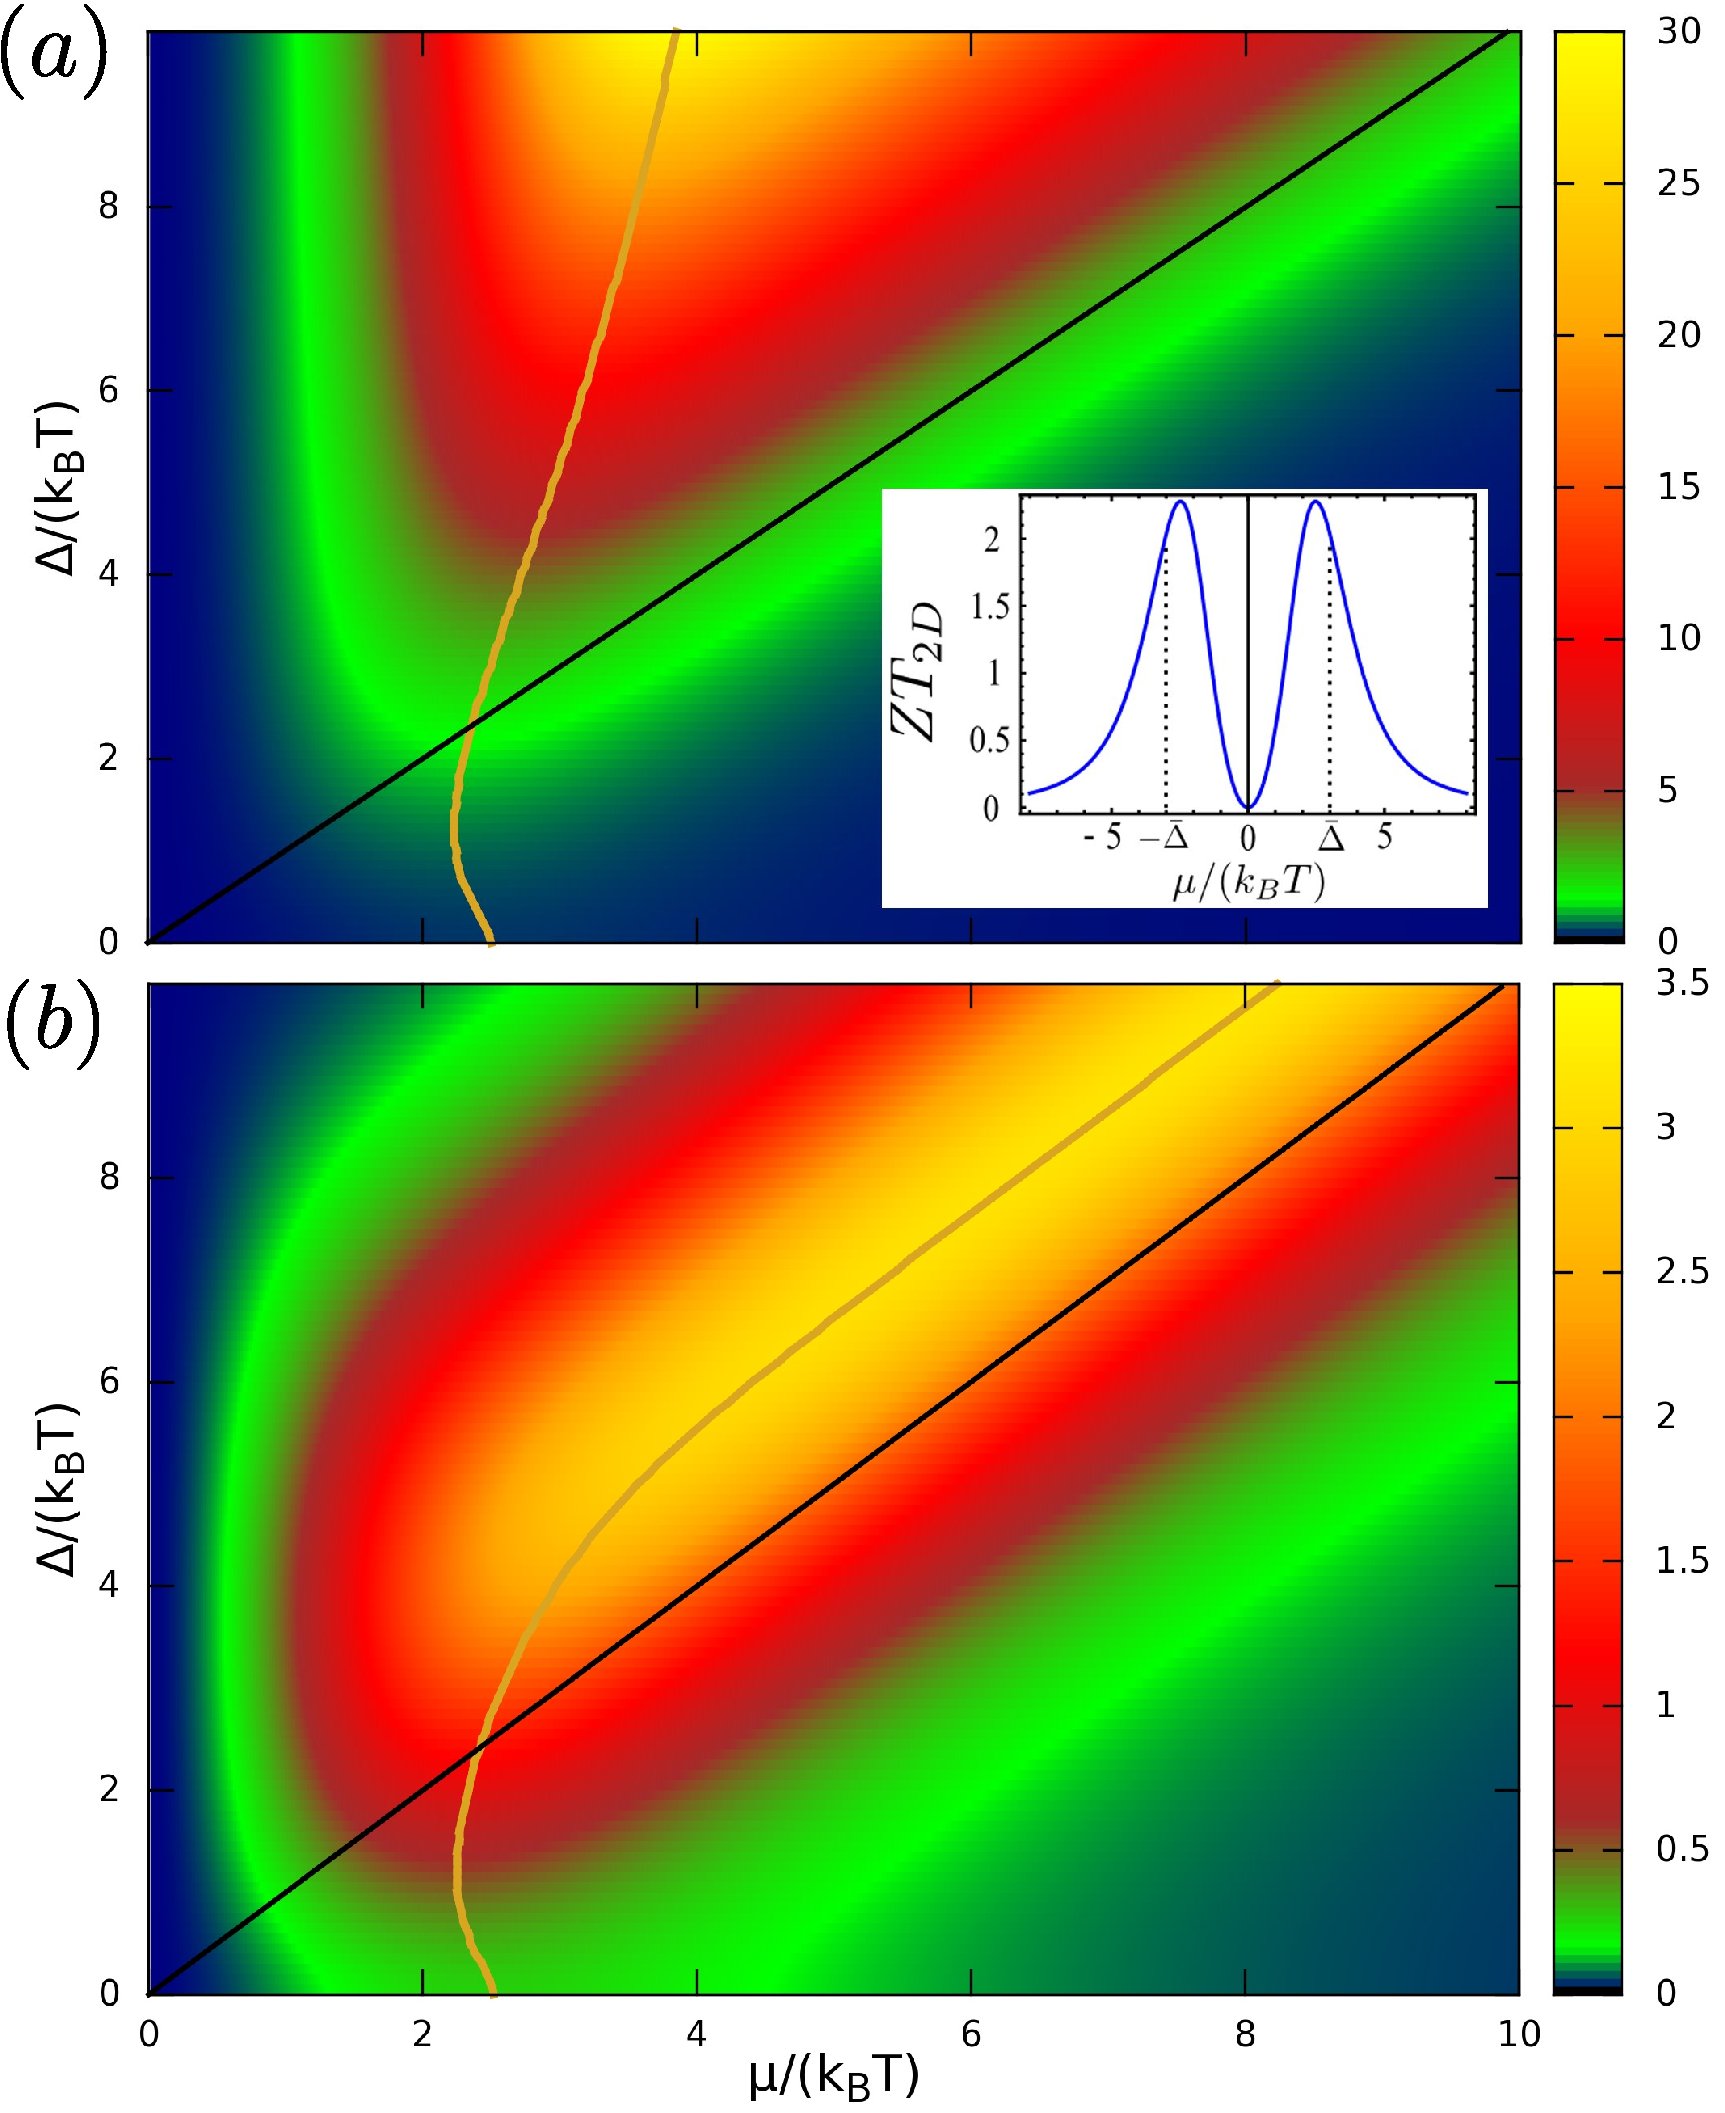
At small , the contribution to mostly comes from 2D surface states and in this limit is given by , which is shown as a function of the chemical potential in the inset of Fig. 4 (a) for . The color plot of as a function of the induced subgap and is shown in Fig. 4 (a). The maximum achievable by tuning the chemical potential for a fixed induced gap is shown by a golden line in Fig. 4. The very high values of in reality are not reachable since any small contribution from the phonon thermal conductivity reduces .

For the holey sample, the phononic contribution to the thermal conductivity can be characterized by the dimensionless parameter . Here the phonon thermal conductivity can be estimated to be (as for Bi2Te3) Goyal et al. (2010) and the average distance between the holes reaching nm. Taking the relaxation time s, at room temperatures we estimate for these rather conservative values of parameters. In Fig. 4 (b), estimated is shown as a function of and for the phononic bulk contribution characterized by the dimensionless parameter . Although reduced considerably from its pure 2D value, remains substantially larger than any value thus far achieved in these materials and can be tuned significantly by applied magnetic fields.
Summary. We have studied the thermoelectric properties of three-dimensional TIs in magnetic fields with high density of holes in the sample. By applying an external magnetic field a subgap can be induced in the surface states spectrum. We show that the thermoelectric efficiency can be controlled by this tunable subgap. We have find that the thermoelectric figure of merit in these materials can be much greater than . This is due to the high contribution of the topologically protected conducting surfaces and the suppressed phonon thermal conductivity. High values for reasonable system parameters and its tunability by magnetic field or magnetic impurities make this system a strong candidate for applications in heat management of nanodevices.
We thank M. Bakker, J. Heremans, C. Jaworski, J. E. Moore, O. Mryasov, and D. Pesin for insightful discussions. This work was supported by NSF under Grant No. DMR-1105512, 0757992, DMR-0820414, ONR-N000141110780, SWAN, and by the Welch Foundation (A-1678).
References
- Hasan and Kane (2010) M. Z. Hasan and C. L. Kane, Rev. Mod. Phys., 82, 3045 (2010).
- Qi and Zhang (2010) X.-L. Qi and S.-C. Zhang, Physics Today, 63, 33 (2010).
- Fu et al. (2007) L. Fu, C. L. Kane, and E. J. Mele, Phys. Rev. Lett., 98, 106803 (2007).
- Hsieh et al. (2008) D. Hsieh, D. Qian, L. Wray, Y. Xia, Y. S. Hor, R. J. Cava, and M. Z. Hasan, Nature, 452, 970 (2008).
- Chen et al. (2009) Y. L. Chen, J. G. Analytis, J.-H. Chu, Z. K. Liu, S.-K. Mo, X. L. Qi, H. J. Zhang, D. H. Lu, X. Dai, Z. Fang, S. C. Zhang, I. R. Fisher, Z. Hussain, and Z.-X. Shen, Science, 325, 178 (2009).
- Takahashi and Murakami (2010) R. Takahashi and S. Murakami, Phys. Rev. B, 81, 161302 (2010).
- Ghaemi et al. (2010) P. Ghaemi, R. S. K. Mong, and J. E. Moore, Phys. Rev. Lett., 105, 166603 (2010).
- Tretiakov et al. (2010) O. A. Tretiakov, A. Abanov, S. Murakami, and J. Sinova, Appl. Phys. Lett., 97, 073108 (2010).
- Tretiakov et al. (2011) O. A. Tretiakov, A. Abanov, and J. Sinova, Appl. Phys. Lett., 99, 113110 (2011).
- Snyder and Toberer (2008) G. J. Snyder and E. S. Toberer, Nat. Mater., 7, 105 (2008).
- Tritt (1999) T. M. Tritt, Science, 283, 804 (1999).
- Hicks and Dresselhaus (1993) L. D. Hicks and M. S. Dresselhaus, Phys. Rev. B, 47, 12727 (1993).
- Lyeo et al. (2004) H.-K. Lyeo, A. A. Khajetoorians, L. Shi, K. P. Pipe, R. J. Ram, A. Shakouri, and C. K. Shih, Science, 303, 816 (2004).
- Mukerjee and Moore (2007) S. Mukerjee and J. E. Moore, Appl. Phys. Lett., 90, 112107 (2007).
- Markussen et al. (2009) T. Markussen, A.-P. Jauho, and M. Brandbyge, Phys. Rev. Lett., 103, 055502 (2009).
- Dubi and Di Ventra (2011) Y. Dubi and M. Di Ventra, Rev. Mod. Phys., 83, 131 (2011).
- Shahil et al. (2010) K. M. F. Shahil, M. Z. Hossain, D. Teweldebrhan, and A. A. Balandin, Appl. Phys. Lett., 96, 153103 (2010).
- Venkatasubramanian et al. (2001) R. Venkatasubramanian, E. Siivola, T. Colpitts, and B. O’Quinn, Nature, 413, 597 (2001).
- Zhang et al. (2010) Y. Zhang, C. L. Hapenciuc, E. E. Castillo, T. Borca-Tasciuc, R. J. Mehta, C. Karthik, and G. Ramanath, Appl. Phys. Lett., 96, 062107 (2010).
- Teweldebrhan et al. (2010) D. Teweldebrhan, V. Goyal, and A. A. Balandin, Nano Lett., 10, 1209 (2010a).
- Teweldebrhan et al. (2010) D. Teweldebrhan, V. Goyal, M. Rahman, and A. A. Balandin, Appl. Phys. Lett., 96, 053107 (2010b).
- Analytis et al. (2010) J. G. Analytis, R. D. McDonald, S. C. Riggs, J. Chu, G. S. Boebinger, and I. R. Fisher, Nat. Phys., 6, 960 (2010).
- Linder et al. (2009) J. Linder, T. Yokoyama, and A. Sudbø, Phys. Rev. B, 80, 205401 (2009).
- Lu et al. (2010) H.-Z. Lu, W.-Y. Shan, W. Yao, Q. Niu, and S.-Q. Shen, Phys. Rev. B, 81, 115407 (2010).
- Ashcroft and Mermin (1976) N. W. Ashcroft and N. D. Mermin, Solid State Physics (Sauders College Publishing, Fort Worth, 1976).
- Goyal et al. (2010) V. Goyal, D. Teweldebrhan, and A. A. Balandin, Appl. Phys. Lett., 97, 133117 (2010).