Changed Relation Between Radio Flux And Some Solar Activity Indices During Cycles 21 - 23
E.A. Bruevicha and G.V. Yakuninab
Sternberg Astronomical Institute, Moscow State University,
Universitetsky pr., 13, Moscow 119992, Russia
e-mail: ared-field@yandex.ru, byakunina@sai.msu.ru
Abstract. A stable cyclicity of correlation coefficients for some solar activity indices versus 10,7 cm radio flux was found. We have analyzed the monthly averages values of the popular solar indices. These indices are: Wolf numbers, , 0,1-0,8 nm background, the total solar irradiance, Mg II UV-index (280 nm core-to-wing ratio) and counts of flares. The correlation coefficients of the linear regression of these solar indices versus were analyzed for every year in solar cycles 21, 22 and during the unusual cycle 23. We found out that the correlation coefficients for solar activity indices versus (which we determined for each year) show the cyclic variations with stable period equal to half length of 11-yr cycle (5,5 years approximately).
Key words. Solar cycle-observations-solar activity indices.
1 Introduction
We have studied monthly averaged values of six global solar activity indices during activity cycles 21, 22 and 23. Most of these observed data we used in our paper were published in Solar-Geophysical Data Bulletin and in Reports of National Geophysical Data Center Solar and Terrestrial Physics (2012). It’s known that the various activity indices which characterized the different aspects of the solar magnetic activity correlate quite well with the most popular solar index such as the sunspot numbers and with others indices over long time scales. Floyd (2005) showed that the mutual relation between sunspot numbers and also between three solar UV/EUV indices, the flux and the Mg II core-to-wing ratio (which is the well known chromospheric UV index, see (Viereck (2001), Viereck (2004)), remained stable for 25 years until 2000. At the end of 2001 these mutual relations dramatically changed due to a large enhancement which took place after actual sunspot maximum of the cycle 23. The subsequent relative quietness intermediate called the Gnevyshev gap has been the relatively large in the cycle 23.
All the indices studied in this paper are very important not only for analysis of solar radiation which comes from different altitudes of solar atmosphere. The most important for solar-terrestrial physics is the study of solar radiation influence on the different layers of terrestrial atmosphere (mainly the solar radiation in EUV/UV spectral range which effectively heats the thermosphere of the Earth and so affects to our climate).
We used in our study the monthly averages values for all the activity indices. Such averages allowed us to take into consideration the fact that the major modulation of solar indexes are the consequence of 27-28 days variations of radiative fluxes (these variations correspond to the mean solar rotation period). After monthly averaging we reduced the influence of the rotational modulation on the observational data.
The unusual cycle 23 was examined carefully: the rise, decline, minimum and maximum phases were studied separately. This study made us possible to determine that correlation coefficients of linear regression for some solar activity indices versus have the different values for different cycle’s phases.
Vitinsky (1986) analyzed solar cycles 18 - 20 and pointed out that correlation for spot numbers versus radio flux does not show the strong linear connection during all activity cycle.
Also it was emphasized the importance of statistical study in our solar activity processes understanding. To achieve to best agreement in approximation of spot numbers values by observations. Also it was emphasized the importance of statistical study for our solar activity processes understanding. To achieve to best agreement in approximation of spot numbers with help of observations Vitinsky (1986) proposed to approximate the dependence W - by two linear regressions: the first one - for the low solar activity (where less than 150) and the second one - for the high activity ( more than 150).
In our paper we found out that the linear correlation was violated not only for maximums of solar activity cycles but for minimums of the cycles too.
We also analyzed the yearly determined correlation coefficients for relations of five solar activity indices versus .
The magnetic activity of the Sun is called the complex of electromagnetic and hydrodynamic processes in the solar atmosphere and in the underphotospheric convective zone, see Rozgacheva and Bruevich (2002) The analysis of active regions (plages and spots in the photosphere, flocculae in the chromosphere and prominences in the corona) requires to study the magnetic field of the Sun and the physics of magnetic activity. This task is of fundamental importance for astrophysics of the Sun and the stars. Its applied meaning is connected with the influence of solar active processes on the Earth’s magnetic field.
2 Global activity indices
Then we have to say a few words about solar indices studied in this paper.
The Wolf numbers (W) is a very popular, widely used solar activity index: the series of W observations continue more than two hundred years, see Figure 1.
The solar radio microwave flux at wavelengths 10,7 cm has also the longest running series of observations started in 1947 in Ottawa, Canada and maintained to this day at Penticton site in British Columbia. This radio emission comes from high part of the chromosphere and low part of the corona. radio flux has two different sources: thermal bremsstrahlung (due to electrons radiating when changing direction by being deflected by other charged participles) and gyro-radiation (due to electrons radiating when changing direction by gyrating around magnetic fields lines). These mechanisms give rise to enhanced radiation when the temperature, density and magnetic fields are enhanced. So is a good measure of general solar activity. data are available at http://radbelts.gsfc.nasa.gov.
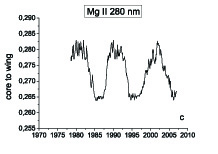
The Mg II 280 nm is important solar activity indicator of radiation, derived from daily solar observations of the core-to-wing ratio of the Mg II doublet at 279,9 nm provides a good measure of the solar UV variability and can be used as a reliable proxy to model extreme UV (EUV) variability during the solar cycle Scupin (2005). The Mg II observation data were obtained from several satellite’s (NOAA, ENVISAT) instruments. NOAA started in 1978 (during the , and the first part of the solar activity cycles), ENVISAT was launched on 2002 (last part of the solar activity cycle). Comparison of the NOAA and ENVISAT Mg II index observation data shows that both the MgII indexes agree to within about 0,5%. We used both the NOAA and ENVISAT Mg II index observed data from Solar-Geophysical Data Bulletin and Scupin (2005). Viereck (2001) showed an extremely good fit between the 30,4 nm emission (the main component of EUV-emission) and the NOAA Mg II index. Viereck (2001), Floyd et al. (2005) have noted the linear relationship between the Mg II index and total solar irradiance.
Solar irradiance is the total amount of solar energy at a given wavelength received at the top of the earth’s atmosphere per unit time. When integrated over all wavelengths, this quantity is called the total solar irradiance (TSI) previously known as the solar constant. Regular monitoring of TSI has been carried out since 1978. From 1985 the total solar irradiance was observed by Earth Radiation Budget Satellite (EBRS).
We use the TSI data set from NGDC web site http://www.ngdc.noaa.gov and combined observational data from National Geophysical Data Center Solar and Terrestrial Physics (2012). The importance of UV/EUV influence to TSI variability (Active Sun/Quiet Sun) was pointed by Krivova & Solanki (2008). There were indicated that up to 63,3 % of TSI variability is produced at wavelengths below 400 nm. Towards activity maxima the number of sunspots grows dramatically. But on average the TSI is increased by about 0,1% from minimum to maximum of activity cycle. This is due to the increase amounts of bright features, faculae and network elements on the solar surface. The total area of the solar surface covered by such features rises more strongly as the cycle progresses than the total area of dark sunspots. Some physics-based models have been developed with using the combined proxies describing sunspot darkening (sunspot number or areas) and facular brightening (facular areas, Ca II or Mg II indices), see Frontenla (2004), Krivova (2003).
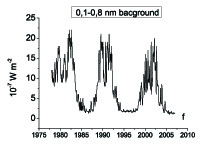
The observations of the X-ray 0,1-0,8 nm background were taken from Solar Geophysical Data bulletin. There were published the observational data of The Geostationary Satellite system (GOES), operated by the United States National Environmental Satellite, Data, and Information Service (NESDIS). This permanent 0,1-0,8 nm background monitoring of solar disk at the 0,1-0,8 nm range is a good indicator of solar corona activity without flares. Several GOES satellites are still in orbit. The regular background monitoring of solar disk at the 0,1-0,8 nm range was made with XRS - X-Ray Irradiance Sensors during GOES 3 - Goes 15 working at the orbit.
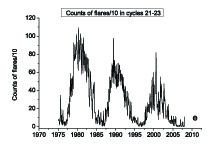
We also analyzed rapid processes on the Sun - monthly counts of grouped solar flares (according Solar-Geophysical Data Reports (2009)) the term ’grouped’ means observations of the same event by different sites were lumped together and counted as one).
3 Activity indices in the cycle 23
The recent solar cycle 23 was the outstanding cycle for authentic observed data from 1849 year. It lasted 12,7 years and was the longest one for two hundred years of direct solar observations. This cycle is the second component in the 22-year Hale magnetic activity cycle but the cycle was the first case of modern direct observations (from 1849 to 2008 years) when Gnevyshev-Ol’s rule was violated: activity indices in cycle 23 had their maximum values less then the values in cycle 22 (but according to Gnevyshev-Ol’s rule the cycle 23 must dominate), see Figure 1.


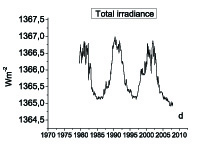
Ishkov (2009) pointed that in this unusual cycle 23 the monthly averages values for Wolf numbers during 8 months exceeded 113 and most of sunspot groups were less in size, their magnetic fields were less composite and characterized by the greater lifetime near the maximum in comparison with values near the maximum. In the cycle 23 the radio flux and the TSI have the lowest values from 2007 to 2009 (the beginning of the cycle 24) from all over of these indices observation period.
Figures 2 demonstrates that for all activity indices in the solar activity cycle one can see two maximums separated one from another on 1,5 year approximately. We see the similar double-peak structure in the cycle 22 but for the cycle 21 the double-peak structure is not so evident. We see that there are displacements in both maximum occurrence time of all these indices in the solar cycle.
We assume that the probable reason of such double-peak structures is a modulation of the 11-year fluxes variations by both of the quasi-biennial and 5,5 year cyclicities of solar magnetic activity, see Bruevich and Kononovich (2011), Bruevich and Ivanov-Kholodnyj (2011) . The different time of and maximums appearance may be caused by the difference in fluxes formation conditions (for our different activity indices) at different atmosphere’s altitudes of the Sun.
Figures 2 also shows that for all solar indices in the cycle 23 the cavity between two maximums has the relative depth of about .
When we have being studied our five activity indices in solar activity cycle we selected three intervals: the rise phase (from October 1997 to November 1997), the maximum phase (from November 1997 to July 2002) and the decline phase (from Jul 2002 to Jan 2006).
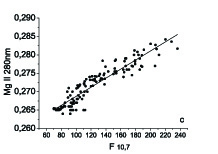
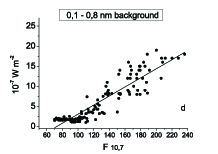
The results of correlation study of solar activity indices versus in the cycle 23 are presented in Table 1.
Table 1 demonstrates that the maximum values of correlation coefficients are reached during the rise and decline phases of the cycles. According to our calculations the highest values of correlation coefficients we see in connection between W and . Correlation coefficients between 0,1-0,8 nm background flux versus are minimal between all the correlation coefficients determined here. Figure 3 also illustrates the high level of interconnection between solar activity indices versus during the unusual cycle 23.


The cyclic variation of fluxes in different spectral ranges and spectral lines at the 11-year time scale are widely spread phenomenon for F, G and K stars (not only for the case of the Sun). The chromospheric activity indices (radiative fluxes at the centers of the H and K emission lines of Ca II - and nm respectively) for solar-type stars were studied during HK project by Baliunas at al. (1995) at Mount Wilson observational program during 45 years, from 1965 to the present time. Authors of the HK project supposed that all the solar-type stars with well determined cyclic activity about 25% of the time remain in the Maunder minimum conditions. Some scientists proposed that the solar activity in future cycle 24 will be very low similar to activity during the Maunder minimum period. Unlike this Volobuev (2009) predicted the main parameters of the new cycle will be similar to the usual activity cycle’s parameters (not similar to the cycle’s characteristics during the Maunder minimum). At Figure 1 we also see (if we continue the smoothed curve) the modulation of yearly observations with the so-called century cyclicity. So we can extrapolate the cycle’s that Wolf numbers maximum will be about 150-180.
| correlation between | rise phase | decline phase | maximum | all the |
|---|---|---|---|---|
| activity indices | (cycle 23) | (cycle 23) | (cycle 23) | cycle 23 |
| W - | 0.919 | 0.961 | 0.742 | 0.939 |
| MgII- | 0.963 | 0.964 | 0.757 | 0.879 |
| TSI - | 0.879 | 0.949 | 0.743 | 0.920 |
| 0,1-0,8nm - | 0.899 | 0.814 | 0.773 | 0.812 |
| counts fl./10 - | 0.905 | 0.895 | 0.785 | 0.890 |
4 Changed relation between activity indices and in the cycles 21-23


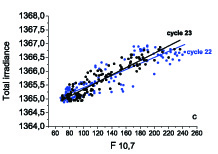
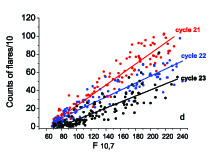
We analyzed the interconnection between activity indices W, Mg II core to wing ratio,TSI and counts of flares versus during the , the and the solar cycles. At Figure 4 we can see correlation between solar indices and radio flux in the cycles 21 - 23. The interconnection between activity indices corresponds to the linear regression equation:
| (1) |
were is our activity index,
is the intercept of linear regression,
is the slope of linear regression.
The results from Table 2 show that coefficients of linear regression ( and ) between solar activity indices and differ for different activity cycles (21 - 23). In Table 2 we present standard errors of the intercept and the slope values averaged for the cycles 21 - 23. Errors of the intercept and the slope values and differ negligible for these cycles. We see that the difference of regression coefficients of the linear regression for solar activity indices versus is the most significant for cycle 23, see also Figure 4.
Ishkov (2009) pointed that there was very high level of flared activity in the cycle 21 and very low level of flared activity in the cycle 23. The Sun’s flare activity is an important indicator of the general level of activity of the atmosphere is also described in other activity indices, in particular around the solar disk index and a locally varying flux in the H-alpha, see Bruevich (1995).
We see (Table 2) that the difference of and values from similar values, determined for the cycles 21 and 22, is the most significant among all the different cycle’s regression coefficients. Figure 4 also demonstrates that the flared activity in the cycle almost twice weaker (counts of flares versus ) in comparison to the flared activity in the cycle.
| indices | cycle 21 | cycle 22 | cycle 23 | errors () |
|---|---|---|---|---|
| a = - 66,4 | a = -56,43 | a = -67,27 | = 3,0 | |
| b = 1,11 | b = 1.012 | b = 1,001 | = 0,02 | |
| a = 0,257 | a = 0,256 | a = 0,257 | = 5,25E-04 | |
| b = 1,20E-04 | b = 1,09E-04 | b = 1,20E-04 | = 4,0E-06 | |
| - | a = 1364,312 | a = 1364,044 | = 0,058 | |
| - | b = 0,011 | b = 0,013 | = 4,4E-04 | |
| a = -35,38 | a = -21,33 | a = -25,88 | = 2,05 | |
| b = 0,58 | b = 0,39 | b = 0,33 | = 0,014 |
We have to point out that close interconnection between radiation fluxes characterized the energy release from different atmosphere’s layers is the widespread phenomenon among the stars of late-type spectral classes. Bruevich & Alekseev (2007) confirmed that there exists the close interconnection between photospheric and coronal fluxes variations for solar-type stars of F, G, K and M spectral classes with widely varying activity of their atmospheres. It was shown that the sum of areas of spots and the values of X-ray fluxes increase gradually from the Sun and HK project stars with the low spotted discs to the highly spotted K and M-stars for which Alekseev & Gershberg (1996) have constructed the zonal model of the spots distributed at the star’s disks. The variations of activity indices in the whole 11-yr cycle of the Sun are very similar to the cyclical variations of the chromospheric fluxes on the stars. So we can simulate the dependencies which describe the variations of the indices during the activity cycle for the stars as for the Sun, see Bruevich and Bruevich (2004).


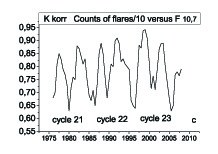
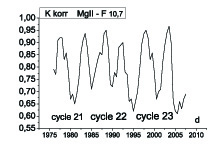
We’ve calculated yearly averaged values of linear regression between solar activity indices and during the cycles 21, 22 and 23. Yearly averaged values were determined for each year (we use the monthly averaged values for 12 months of the year with half-monthly time interval, 24 values for every year).
Figure 5 demonstrates the results of our correlation calculations between these solar activity indices and - variations during the cycles 21 - 23. We can see that all the values have the maximums at rise and at decline phases. It’s easy to estimate the value of period of cyclic variations as 5,5 years approximately. We assumed that this new cyclicity (characterized with period’s value equal to half length of 11-yr cycle) is important for the successful forecasts of the solar activity indices.
The cyclic behavior of can be explained by following assumption: we imagine that some activity index flux depends on time by the expression:
| (2) |
were is the background flux which is increased continuously with increasing of solar activity and is the additional flux to the overall flux from the active regions (AR).
The previous correlation study allows us to consider that and are the linear functions of the background and activity regions levels of solar activity. In our case we choose the radio flux as the best basic indicator of solar activity levels:
| (3) |
| (4) |
The coefficients and differ from and . For W this difference is small, but for 0,1 - 0,8 nm background and counts of flares the difference between , and , is more significant than for W and TSI.
During the rise and decline cycle’s phases the dependence versus is approximately linear because coefficients and from Table 2 (which describe whole cycle) are similar to and (see Figure 3 and Figure 4). In this case we can neglect the relative addition flux from active regions in respect to . So an additional flux from active regions cannot destroy a balance in the close linear correlation between and and respective values of reach their maximum from whole cycle.
During the minimum of activity cycle both values and are small, but the additional flux from active regions can’t be neglected in relation to background flux (which has the minimum values from all the activity cycle). Therefore values and from Table 2 can’t be described to a considerable degree by the linear regression in cycle’s minimum and values of have their minimum values in the cycle.
During the maximum of activity cycle the values often exceeds and disbalance in linear regression between activity indices increases. The values of have also their minimum values in the activity cycle.
5 Conclusions
We have shown that there are close links between the indices of solar activity. This can be successfully used for the forecasts of solar activity on different levels of the solar atmosphere. You need to take into account that (as we have shown above) such interconnections are the more powerful in the middle of the cycle and weaker in moments of maximums and minimums.
In this paper we found out the cyclic behavior of yearly values of correlation coefficients of linear regression for W, TSI, Mg II 280 nm and counts of flares versus during solar activity cycles 21,22 and 23 (see Figure 5). We showed that yearly values of have the maximum values at the rise and decline phases of the activity cycle. Thus the linear connection between indices is more strong in these cases. It means that the forecasts of solar indices, based on observations in our case, will be more successful during the rise and decline phases of the activity cycle.
We also determined that the yearly values of are characterized by cyclic variations with the period that is equal to half length of 11 - yr main solar cyclicity period (5,5 years about). Our study of linear regression between solar indices and confirms the fact that during the minimum and during the maximum phases of the cycles 21 - 23 the nonlinearity of interconnection between solar activity indices (characterized the energy release from different layers of solar atmosphere) increase.
Acknowledgements The authors thank the RFBR grant 12-02-00884 for support of the work.
References
- [1] National Geophysical Data Center Solar and Terrestrial Physics. 2012, http://www.ngdc.noaa.gov/stp/solar/solardataservices.html.
- [2] Solar-Geophysical Data Reports. 54 Years of Space Weather Data, 2009, http://www.ngdc.noaa.gov/stp/solar/sgd.html.
- [3] Floyd, L., Newmark, J., Cook, J., Herring, L. and McMullin, D. 2005, Journal of Atmospheric and Solar-Terrestrial Physics, 67, 3.
- [4] Viereck, R., Puga, L., McMullin, D., Judge, D., Weber, M. and Tobiska, K. 2001, J. Geophys. Res., 28(7), 1343.
- [5] Viereck, R.A., Floyd, L.E., Crane, P.C., Woods, T.N., Knapp, B.G., Rottman, G., Weber, M., Puga, L.C. and Deland, M.T. 2004, in Space Weather II, S10005.
- [6] Vitinsky, Yu., Kopezky, M., Kuklin G. 1986, The sunspot solar activity statistik. M. Nauka.
- [7] Rozgacheva I.K., Bruevich E.A. 2002, Astronomical and Astrophysical Transactions, 21, Issue 1, p. 27. DOI: 10.1080/10556790215583
- [8] Skupin, J., Weber, M., Bovensmann, H., Burrows J.P. 2005, in The 2004 Envisat and ERS Symposium (ESA SP-572), 6-10 September 2004, Salzburg, Austria. (eds) H. Lacoste, 55.
- [9] Krivova, N. A., Solaki, S. K. 2008, J. Astrophys. Astr., 29, 151.
- [10] Frontela, J.M., Harder, J., Rottman, G., Harder, J. 2006, Astrophys. J., 639, 441.
- [11] Krivova, N.A., Solanki, S.K., Fligge, M., Unruh, Y.C. 2003, Astron.Astrophys., 399, L1.
- [12] Ishkov, V.N. 2009, in 1st Workshop on the activity cycles on the Sun and stars, (eds) EAAO, St-Petersburg, 57.
- [13] Bruevich E.A. 1995, Astronomy Reports, 39, N1, 78-82.
- [14] Bruevich E.A., Kononovich E.V. 2011, Moscow University Physics Bulletin, 66, N1, 72-77. DOI: 10.3103/S0027134911010073
- [15] Bruevich E.A., Ivanov-Kholodnyj G.S.. 2011, eprint ArXiv:1108.5432
- [16] Baliunas, S.L., Donahue, R.A., Soon, W.H. 1995, Astrophys.J., 438, 269.
- [17] Volobuev, D. 2009, Solar Phys., 258, 319.
- [18] Bruevich, E.A., Alekseev, I.Yu. 2007, Astrophysics, 50, 187.
- [19] Bruevich P.V., Bruevich E.A. 2004, Astronomical and Astrophysical Transactions, 23, Issue 2, p. 165-172. DOI: 10.1080/10556790410001666319
- [20] Alekseev, I.Yu., Gershberg, R.E. 1996, Astron. Report, 73, 589.