ARA Collaboration
Design and Initial Performance of the Askaryan Radio Array
Prototype EeV Neutrino Detector at the South Pole
Abstract
We report on studies of the viability and sensitivity of the Askaryan Radio Array (ARA), a new initiative to develop a Teraton-scale ultra-high energy neutrino detector in deep, radio-transparent ice near Amundsen-Scott station at the South Pole. An initial prototype ARA detector system was installed in January 2011, and has been operating continuously since then. We report on studies of the background radio noise levels, the radio clarity of the ice, and the estimated sensitivity of the planned ARA array given these results, based on the first five months of operation. Anthropogenic radio interference in the vicinity of the South Pole currently leads to a few-percent loss of data, but no overall effect on the background noise levels, which are dominated by the thermal noise floor of the cold polar ice, and galactic noise at lower frequencies. We have also successfully detected signals originating from a 2.5 km deep impulse generator at a distance of over 3 km from our prototype detector, confirming prior estimates of kilometer-scale attenuation lengths for cold polar ice. These are also the first such measurements for propagation over such large slant distances in ice. Based on these data, ARA-37, the 200 km2 array now under construction, will achieve the highest sensitivity of any planned or existing neutrino detector in the eV energy range.
pacs:
95.55.Vj, 98.70.SaI Introduction
At PeV energies and above (1 PeV = eV), ultra-high energy (UHE) neutrinos can be most efficiently detected in dense, radio-frequency (RF) transparent media via the Askaryan effect Ask62 . The abundant cold ice covering the geographic South Pole, with its exceptional RF clarity, has been host to several pioneering efforts to develop this approach, including RICE RICE06 and ANITA ANITA2 ; ANITAinst , which trace their roots back to suggestions made in the mid-1980’s Gusev . Within the last year, a multi-phased experiment (the Askaryan Radio Array, or “ARA”) has been initiated at the South Pole whitepaper , designed to ultimately accumulate hundreds of GZK neutrinos: those neutrinos which arise from the cumulative interactions of ultra-high energy cosmic rays (UHECRs) throughout the universe, specifically through the Greisen-Zatsepin-Kuzmin, or GZK process Greisen ; ZK . Combining the drilling and logistics experience of IceCube, the in situ RF experience of RICE and the sub-nanosecond-scale data acquisition and triggering of ANITA, the singular goal of Phase 1 of ARA is to make the first definitive observation of the cosmogenic GZK neutrinos with a radio antenna array covering a roughly 200 km2 area, denoted here as ARA-37.
In the longer-term, the modularity of the ARA design will engender cost-effective growth of the array to the Teraton scale necessary to carry out an observatory-class UHE neutrino science program with broad intellectual merit, comprising basic particle physics, including neutrino flavor and cross-section studies in previously unprobed kinematic regimes; astrophysics such as tests of models of galactic evolution, as well as cosmic acceleration and propagation models relevant to ultra-high-energy cosmic ray (UHECR) observatories such as the Pierre Auger and Telescope Array Experiments.
A critical question for any radio-based instrument deployed at the South Pole is whether the local man-made radio interference will prevent such an instrument from reaching its science goals. In addition, in situ measurements of the radio noise floor, and the radio transmissivity of the ice, as well as its propagation characteristics, are necessary to assess the ultimate sensitivity of ARA.
To address these issues, we have deployed an initial ARA detector station in prototype form, which we also denote the ARA Testbed, with much of the functionality planned for the ARA-37 design. One of the features of the current ARA design is that each element of the large array comprises a standalone neutrino detector for its surrounding ice. Although multiple-station events are in no way excluded, they are not required for either triggering or reconstruction of the interaction vertex or neutrino direction. This is done to maximize the sensitivity of the array at the expense of some angular and energy resolution. Once UHE neutrino fluxes and first-order energy spectra are established with a discovery instrument, then future installations can be further optimized for resolution as well as sensitivity.
In our current design, a single array element, denoted as a station here, consists of a cluster with of order 16 embedded antennas, deployed up to 200 m deep in several vertical boreholes placed with tens-of-meter horizontal spacing to form a small sub-array. We report here on the initial deployment of our first station, and results of measurements over the first four months of its operation. In all aspects the environment and ice quality have exceeded our expectations, and the prospects for ARA-37 thus appear excellent.
II Instrument Design
The ARA stations must be designed to detect a highly linearly-polarized RF impulse arriving from any direction, either as an approximate plane wave (for distant sources) or a spherical wave for sources that are closer. The individual antennas that comprise a station must have response that is preferably dipole-like in angular extent, but the antenna array must also be sensitive in two orthogonal polarizations to avoid any bias against detecting arbitrary planes of polarization, since the RF impulses that arise from the Askaryan effect may be observed at an arbitrary angle with respect to the plane of polarization.
Because of practical limitations on drilling, the antennas should fit within a 15 cm diameter borehole, and they should be at a depth below the firn, the top layer of the ice sheet made of compacted snow of density lower than that of solid ice, and extending down typically 150 m at the South Pole. Antennas within the firn are subject to ray-bending within the refractive index gradient which complicates the triggering and reconstruction, and also leads to an effective inverted horizon, cutting off the detectability of more distance sources in the ice. Since South Polar ice has its highest RF clarity in the coldest ice, the antenna array response should be optimized for detection in the upper 1 to 1.5 km of ice, although deeper events will also be seen. Since drilling costs increase dramatically with the required depth of the hole, there is clear cost-benefit in making the holes no deeper than needed to achieve the science goals. The array must also guard carefully against any self-noise radio interference, that is: all data acquisition, power, and transmission lines must be electromagnetically shielded with extreme care.
| Specified parameter | ARA 2012++ planned | ARA 2010-2011 prototype |
| Number of Vpol antennas | 8 | 2 near-surface, 4 in ice |
| Vpol antenna type | bicone | bicone |
| Vpol antenna bandwidth (MHz) | 150-850 | 150-850 |
| Number of Hpol antennas | 8 | 2 near-surface, 6 in ice |
| Hpol antenna type | quad-slotted cylinder | bowtie-slotted-cylinder |
| Hpol antenna bandwidth (MHz) | 200-850 | 250-850 |
| Number of Surface antennas | 4 | 2 |
| Surface antenna type | fat dipole | fat dipole |
| Surface antenna bandwidth (MHz) | 30-300 | 30-300 |
| Number of signal boreholes | 4 | 6 |
| Borehole depth (m) | 200 | 30 |
| Vertical antenna configuration | H,V above H,V | V or H above H or V |
| Vertical antenna pair spacing (m) | 20 | 5 |
| Approximate geometry | trapezoidal | trapezoidal |
| Approximate radius (m) | 10 | 10 |
| Number of calibration antenna boreholes | 3 | 3 |
| Calibration borehole distance from center (m) | 40 (2), 750 (1) | 30 |
| Calibration borehole geometry | isosceles triangle | equilateral triangle |
| Calibration signal types | noise and impulse | impulse only |
| LNA noise figure (K) | ||
| LNA/amplifier dynamic range | 30:1 | 30:1 |
| RF amplifier total gain (dB) |
In Table I, we list the primary instrument specifications chosen for the ARA station design, giving key parameters such as the geometry and antenna requirements. The ARA prototype instrument shares much of the functionality of the planned complete ARA stations, with several notable differences, which are enumerated in the Table.
II.1 Overall system
A block diagram of the installed ARA testbed station is shown in Fig. 1. A variety of different antennas, both downhole and near-surface, are used. In each case a low-noise preamplifier is inserted in close proximity to the antenna to minimize insertion loss and associated thermal noise. Highly-shielded coaxial cables (Andrew Heliax or Times Microwave LMR-series cables) then lead the signals to a secondary receiver which boosts the signal with another 40 dB amplifier to bring the thermal noise levels (which are several V referenced to the LNA inputs) to several tens of mV RMS at the DAQ system. The signal is split for separate trigger and waveform recording paths. For each trigger, the RF waveforms and associated housekeeping (temperatures, threshold settings, antenna singles rates, etc.) are recorded locally by a single-board computer, then transmitted over twisted pair wires via an ethernet modem to a data receiving computer at the South Pole station. There the data is repackaged for transmission via satellite link to northern hemisphere computer archives. Future installations will use an optical fiber or wireless data link for the data transmission to and from the individual stations.

II.2 Antennas


Antenna designs for ARA are highly constrained by the need to fit into a borehole in the ice. Currently, ARA has demonstrated the ability to successfully drill 15 cm diameter boreholes of the required 200 m depth. This hot-water drilling operation requires pumping out of the drill water after completion of the hole, to avoid freeze-in of ARA equipment, at least in the early phases of array construction where recovery of downhole instrumentation when necessary helps to improve reliability. For our initial season, equipment for pumping the holes dry was not available yet, and thus the initial season’s boreholes were drilled only to a depth of order 30 m typically, where pooling of water prevented deeper drilling. However, the 15 cm diameter for these holes was maintained.
An additional issue for borehole antennas where there are multiple antennas along the hole, fed by cables from the surface, is that the conductive coaxial cables must pass through upper antennas to reach lower ones. This constraint forces the need for a central hole in the antenna to ensure a uniform azimuthal response, and these holes require re-design of the antenna feed region for many traditional borehole antenna designs. With the diameter constraint, antennas for vertical polarization are straightforward: a fat-dipole or related biconical designs will provide very broadband, well-matched antennas. With the additional cable-passthrough constraint, it is more difficult to find a design that retains azimuthal symmetry while still passing the signal cable, but we have settled on a hollow-center biconical design, where the feed region is annular around the passthrough cables, and is fed at multiple locations along the annulus, with appropriate impedance matching.
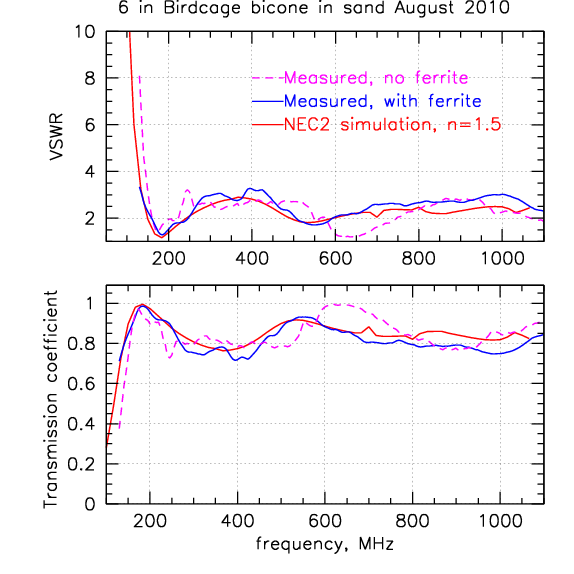
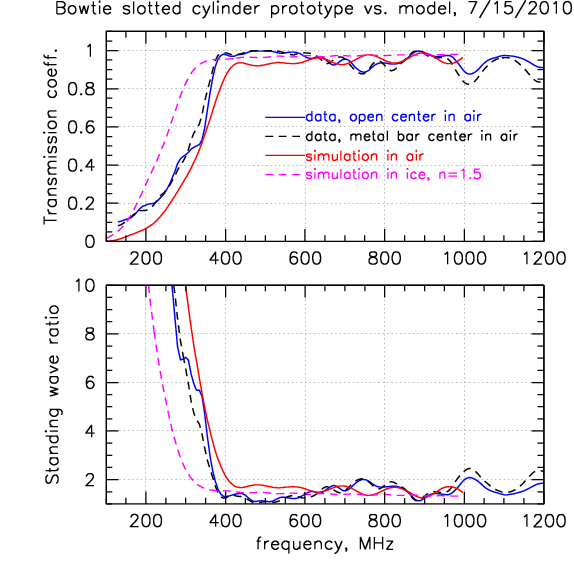
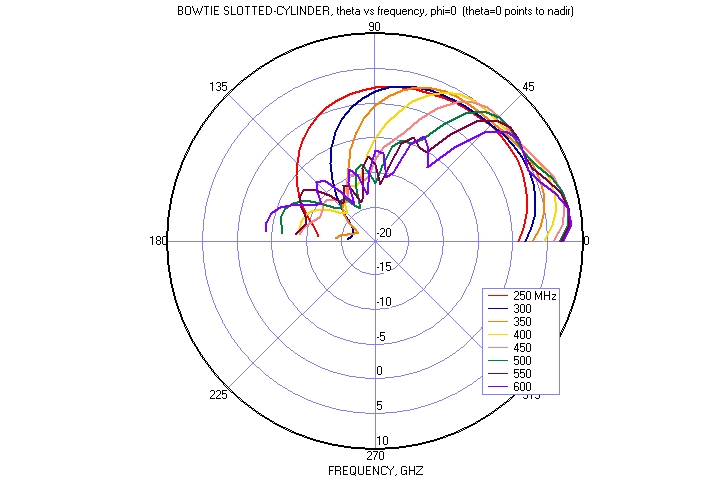
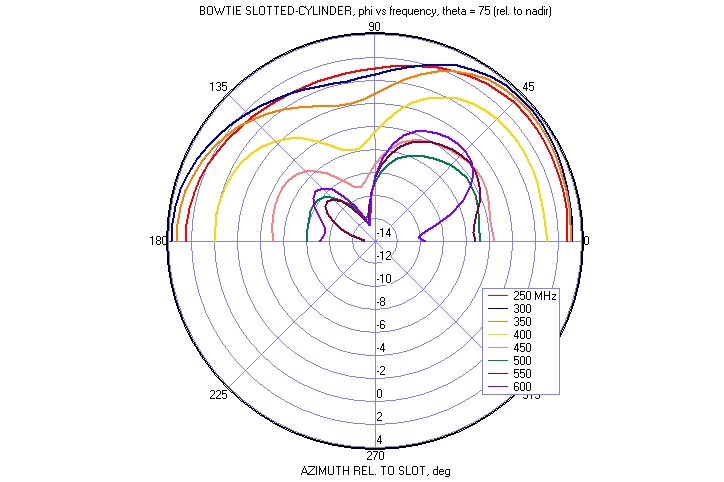
For a corresponding antenna with horizontal polarization (Hpol) two designs were implemented for testing in the ARA testbed: a bowtie-slotted-cylinder (BSC) antenna, and a quad-slotted-cylinder (QSC) antenna with internal ferrite loading to effectively lower its frequency response. The goal for both sets of antennas was to cover a frequency range from about 150 MHz to 850 MHz. This goal was achieved with the Vpol antennas, but the 15 cm diameter borehole constraint has proved challenging for the Hpol antennas, both of which have difficulty getting frequency response below about 200-250 MHz in ice. In addition, the BSC antenna, although it was found to have better efficiency than the QSC, suffers from some azimuthal asymmetry in its response, and thus the QSC, which has uniform azimuthal response, will be used for future ARA stations. In the current testbed station, we have primarily used the BSC antennas because of the ease of their manufacture for the 2011 season. Figure 2 shows photographs of the wire-frame bicone antennas and the BSCs as they were readied for deployment. Fig 3 shows a photo of one of the QSC prototypes (only one of the 4 slots is evident), along with simulated results for the gain patterns in elevation and azimuth, illustrating the uniformity, which was confirmed at several angles in laboratory measurements.
Figures 4 and 5 show the voltage standing wave ratio (VSWR), along with the power transmission coefficient for the primary borehole antennas used for the ARA-testbed. VSWR is related to the complex voltage reflection coefficient of the antenna via the relation
and the effective power transmission coefficient (either as a receiver or transmitter from antenna duality) is given by
and may be thought of as the effective quantum efficiency of the antenna vs. frequency although RF antennas in the VHF to UHF range never operate in a photon-noise limited regime.
In addition to the coupling efficiency of the antennas, the other important parameter for RF performance is the antenna directivity gain , often denoted as just gain, and related to the effective power collection area of the antenna via the fundamental relation
for the speed of light . is in turn related to the vector effective height of the antenna by
where is the radiation resistance of the antenna, is a unit vector representing the antenna axis, and is the impedance of the medium, in free space Kraus . For simple antennas such as dipoles, the induced voltage into a matched receiver load is given by , and for our borehole antennas , where is the local vertical direction. For our horizontally-polarized antennas which rely on coupling to a slot (the Babinet dual to a dipole), the coupling may either be thought of as a magnetic induction to the slot, or as electric coupling to an effective height which is toroidal, e.g. where is the azimuth unit vector in cylindrical coordinates. In either case, for our broadband antennas which have more complex frequency-dependence, detailed estimates of the antenna response wil require an integral over the frequency-dependent behavior. For antennas immersed in a dielectric, both the speed of light and impedance are affected. The dielectric generally lowers the frequency response of the antenna compared to air.
For our biconical antennas, we found the gain to be commensurate with that expected from a theoretical bicone, with a primary mode that behaves as of the polar angle, and extends for about 1 octave in frequency compared to the turn-on of the antenna. At higher frequencies, the response becomes multi-modal as expected from a dipole used at its higher-order resonance regions, but the frequency bandwidth of these modes is much larger than for a resonant dipole, due to the broadband biconical response. The QSC Hpol antenna gain behaves in a very similar manner to the bicones, except that its turn-on frequency is higher; this is consistent with the slot antennas performing as a Babinet complementary antenna to a dipole.
For the BSC antenna, the response is more like an inverted broadband monopole, as shown in Fig. 6. In the top pane, the polar angle response is shown. The antenna is oriented horizontally for this plot, but in the borehole it is placed vertically with the high-frequency response peaking down, giving the antenna higher sensitivity to upcoming RF at high frequencies. In azimuth there is also a front-to-back asymmetry which leads to better response for incoming RF for the side with the open slot.
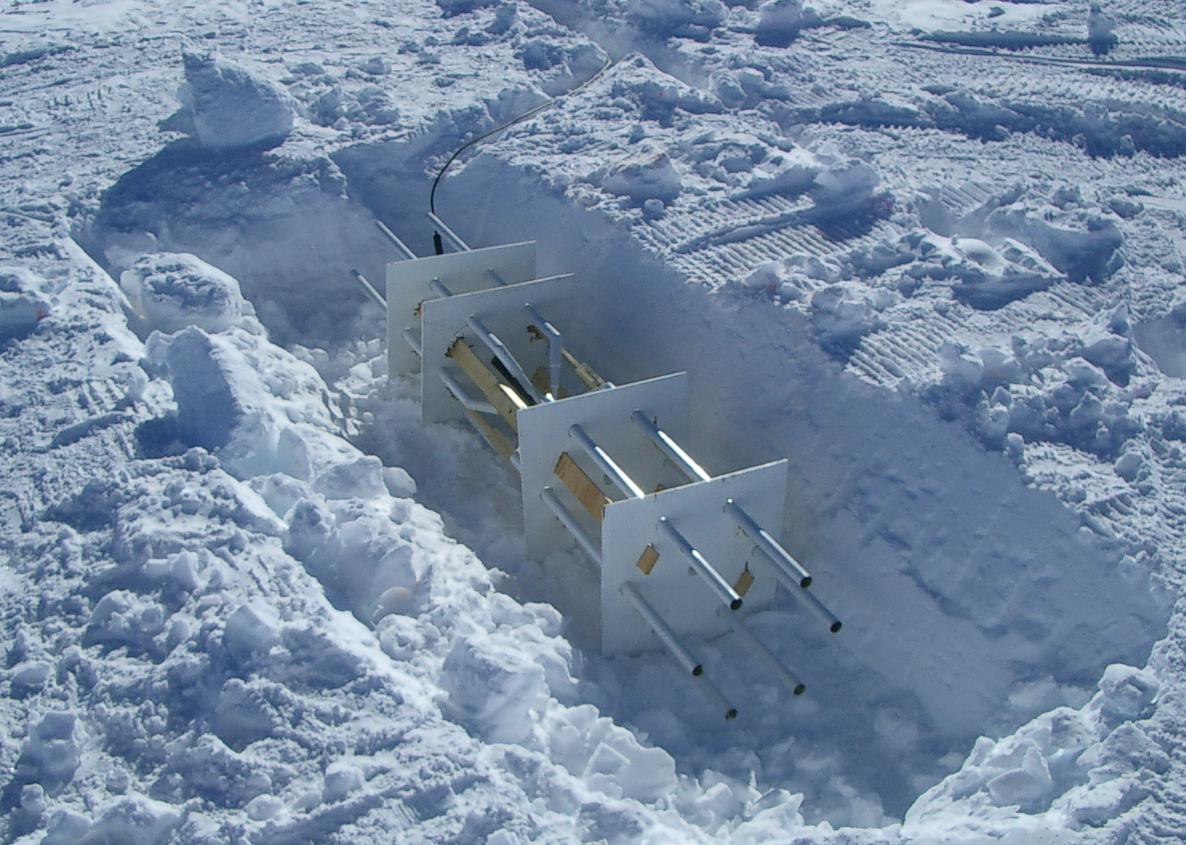
Several other antennas were employed in the ARA testbed. Several larger discone (Vpol) and batwing (Hpol) designs were submerged about 1 meter below the surface, and these performed well, but as they require a 40 cm diameter borehole they are impractical for future use. We also deployed two surface fat-dipole (SFD) antennas (Fig. 7 with a frequency response extending over a much lower range than our borehole antennas: 30-300 MHz. These were emplaced to assess the environment for detection of geosynchrotron RF emission from cosmic ray extensive air showers (EAS) which arrive from interactions in the atmosphere above the array. Such RF impulses have predominantly lower frequency content than Askaryan impulses ANITA-UHECRs , but have RF spectra which can extend to hundreds of MHz and thus will be detected in the deeper antennas as well. The SFDs in this case can function as a way to conclusively tag EAS radio events and distinguish them from other RF interference, if the backgrounds are low enough in the VHF band.
II.3 Preamplifiers and receivers
The ARA testbed preamplifier module consists of a front-end passband and notch filter designed to block any out-of-band signals and to notch one strong in-band signal from the South Pole communication system at about 450 MHz, and a low-noise amplifier (LNA). Any insertion loss in the front-end filter causes a loss of signal combined with an increase in thermal noise, and this filter was thus carefully designed to minimize in-band losses to a fraction of 0.5 dB or less. The notch and the out-of-band rejection of the filter are necessary to prevent unwanted anthropogenic noise from saturating the LNA and driving it into a nonlinear operating range where its gain would be compressed.
The combination of the front-end filter and LNA contributes about 80K of input-referenced noise to the signal path, and the external thermal noise of the ice at an ambient temperature of 230K (the average extends out to a volume of ice of order 1 attenuation length in radius), giving a resulting system noise of order 310K expected. This leads to an input power of about -85 dBm for the LNA. Once the signals are amplified by the LNA, they are transmitted to the top of the borehole where a 2nd stage receiver amplifier with gain of about 40 dB boosts the signals again to a range where they can be digitized.
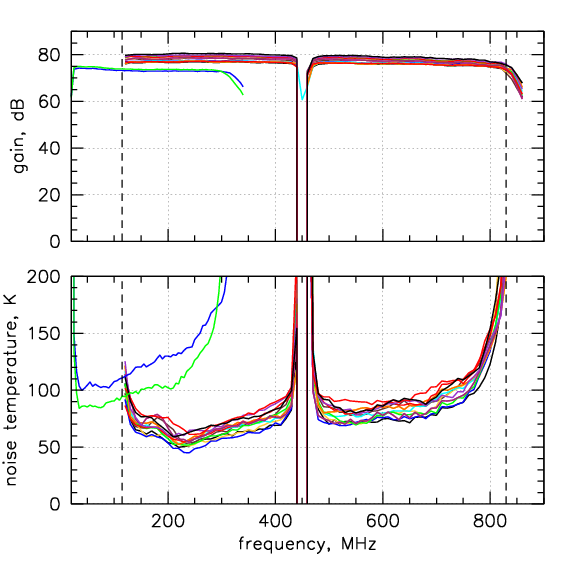
The gain and noise figure of the preamplifier+receiver signal chain was measured for all ARA testbed channels using an Agilent HP8970A noise figure meter with an NIST-traceable calibrated noise source. These measurements were done with the devices under test at an ambient temperature of about -15C. This is warmer than the expected temperatures in the ice and at the surface during the austral winter, and thus separate measurements were made in a freezer at -55C to determine the additional temperature scaling for the noise figure and gain.
The results for the noise figure and gain as a function of frequency are shown in Fig. 8. The complete system gain is close to 80 dB as expected, and the noise figure of the preamplifier modules is in the range of 70-90K over most of the band, except for the region of the notch at 450 MHz, and the high edge of the band where both cable and low-pass filter attenuation begins to dominate. Given that the ambient temperature of the ice is still the dominant contribution to the overall system noise, these results are well within the specifications.
II.4 Trigger, Digitizer, and Data harvesting

Although it is currently possible to continuously digitize RF signals and use these digital waveforms to assess the possible presence of impulsive events of interest, the power requirements for such a streaming trigger are still prohibitive for our design goals, which require that future ARA stations be ultimately able to function at remote locations far removed from large-scale power infrastructure. Thus we only digitize waveforms when a separate analog system determines that some interesting pattern of RF signals has crossed above an intensity threshold.
The ARA-testbed system uses coaxial tunnel diode detectors to provide a unipolar signal proportional to the instantaneous RF power over a few nanosecond time scale, and these pulses are fed into a discriminator implemented via a field-programmable gate array (FPGA) using low-voltage differential signal comparators. The FPGA then generates digital one-shot signals for each of the 16 input antennas, and these digital outputs can in turn be assessed via firmware logic to determine if a trigger condition is met. For our current system, the primary trigger is set so that when any 3 of the 8 primary Vpol and Hpol borehole antennas produce signals crossing threshold within a 100 ns window, the trigger condition is satisfied, and all waveforms are digitized and read out by the data acquisition system (DAQ) which is shown in block diagram form in Fig. 9.
The trigger condition of any 3 of the primary 8 borehole antennas crossing a pre-set threshold leads to a strong dependence of the overall global trigger rate on the individual threshold-crossing rates, or singles-rates , of each antenna, which in turn is determined both by the average power level in each antenna, and by the value and stability of the pre-set threshold. To first order the global trigger rate is given by:
| (1) |
and is the coincidence window, 100 ns in our case, and is the number of antennas that contribute to the coincidence. From this it is evident that the global rate depends on at least the cube of the singles rate. Since we are triggering on fluctuations in the antenna power which follow an exponential distribution, Goodman , and the global trigger rate will depend on the cube of an exponential of the voltage threshold, or the underlying power level, illustrating the degree of sensitivity to both thermal noise changes and threshold stability. For this reason, it is generally advisable to implement a noise-riding threshold, which servos (at a typical cadence below 1 Hz) the voltage thresholds to maintain approximately constant , while recording the thresholds used. This creates a nearly negligible change in overall sensitivity but leads to more stable operation. Such a noise-riding system was designed into our current trigger, but has not been yet implemented in the operating period we describe here. In fact we do see evidence of temperature-dependent drifts in global trigger rate in our current data, as will be shown in a later section.
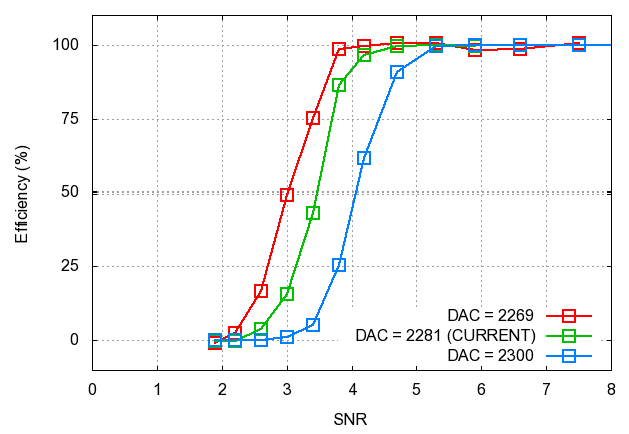
Our current DAQ system has a maximum sustained trigger rate of 25 Hz due to limitations of the readout system that will be improved substantially for future stations. However, rates above 10 Hz incur substantial deadtime for the system, so we currently set thresholds to keep the rate below a few Hz. This trigger level is quite sensitive, however, as shown by Fig. 10. Here the trigger efficiency is shown as a function of the SNR of the received signal relative to the thermal noise level of the system, which constitutes the ultimate noise floor. Our current system is 50% efficient for any incoming impulse which gives antenna voltage amplitude exceeding above thermal noise.
12-bit waveform analog-to-digital conversion is performed using the Large Analog Bandwidth Recorder and Digitizer with Ordered Readout (LABRADOR), an Application Specific Integrated Circuit (ASIC) developed at the Univ. of Hawaii Varner . In our implementation of the LABRADOR, eight of the channels are sampled at 2 Gigasamples/second effectively, with a 1 GHz Nyquist cutoff, and the remaining eight channels are sampled at 1 Gsample/sec with a 500 MHz Nyquist cutoff. The latter channels are primarily the surface and near-surface antennas. Near-future implementations of a new ASIC for ARA will extend the high-rate sampling and bandwidth to all 16 channels.
Once digitized, the data is transferred from the LABRADOR to a single-board computer and packetized. Data is then transferred via an ethernet extender over 1.8 km of twisted pair cable from the testbed DAQ computer to a server residing in a South Pole laboratory, where it is archived on disk. A selection of data is then packaged for transfer via a satellite link to northern hemisphere data servers.
II.5 In situ Calibration
To ensure that the triggering and data acquisition system are functioning properly, the trigger threshold is set such that we trigger at a low but quasi-continuous rate on thermal accidentals. This rate is typically 1 Hz or less. In addition, the system is software-triggered at 0.5 Hz to provide a continuing record of unbiased waveform samples of the RF background. Finally, a GPS-synchronized Rubidium clock triggers a local calibration pulser that sends ps impulse to antennas in a borehole about 30 m radius from the center of the testbed array, and this impulse is split and transmitted from both Vpol and Hpol antennas to provide an impulse calibration for the array. Arrival times for these impulses at each antenna help to determine residual inter-antenna delays for the array, and this in turn is used to model the local index of refraction of the ice.
II.5.1 Deep IceCube calibration pulser
To date all results of long-path ice transparency measurements for the Antarctic ice sheets have been made via transmission paths that are largely vertical through reflections off the basal interface at the bottom of the ice mass icepaper . Such measurements produce conservative lower limits to the average integrated ice attenuation length. If the bottom reflection coefficient is known, the resulting attenuation length measurement can be stated with higher confidence, although it still represents an average over a large range of ice temperatures. For South Pole ice, experiments in this vein have yielded several results on the ice attenuation that indicate km-scale attenuation lengths in the upper km of ice icepaper ; Ice08 ; Ice09 ; Ice2011 .
For ARA we are interested not just in near-vertical propagation, but propagation over a full range of angles, since neutrino interactions can take place throughout the ice target mass. To begin to address measurements that will support horizontal or slant propagation, we were able in the 2010-2011 season, with the help and cooperation of the IceCube project, to deploy a set of pulse generators and antennas at several locations near the ARA edge of the IceCube detector, at ice depths of up to 2450 m. These pulser systems used several kV-peak impulses transmitted through a vertically-polarized biconical antenna. Estimates of the signal strength received in the ARA-testbed using conservative values for the ice propagation were used to size the choice of transmitter amplitude, but with some risk that, if the ice were much more transparent than expected, the ARA-testbed might see saturation in the received signals. This risk was accepted since stations further away from IceCube would still receive signals within acceptable amplitude ranges. Results of these pulser tests are presented in a later section.
III Instrument performance
The ARA testbed installation was completed in the third week of January 2011, at a location approximately 1.8 km grid East of the IceCube detector, and has been operating nearly continuously since that time. The instrument’s internal Rubidium clock, stabilized to a GPS receiver, provides a 1 Hz pulse that is used to trigger the calibration pulser, and this in turns provides a stable repetitive RF trigger which can be used to monitor trigger and amplitude stability. The system also triggers on fluctuations of ambient RF thermal noise at quiescent rates of typically 0.5-1 Hz, and in addition we use the DAQ computer to force a trigger at 0.5 Hz to get unbiased waveforms of the ambient RF noise in each antenna channel. During the early part of the operation of the testbed in mid-January, we also took several dedicated runs where we turned on the IceCube RF pulsers; since that time we have not repeated these runs as it requires the presence of personnel who are not available during the winter months at South Pole. In the remainder of this section we report on various measures of the instrument performance for the first 4 months of 2011.
III.1 Environmental
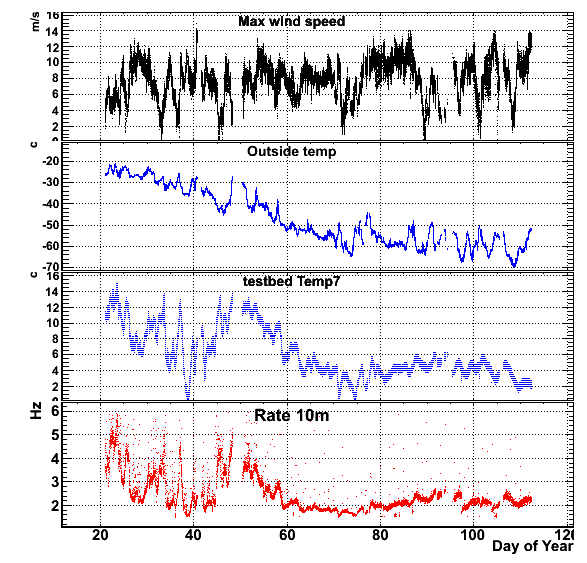
Fig. 11 shows a time series of several measured environmental conditions for the ARA testbed. We monitored the wind speed and outside temperature at locations near the South Pole station. Fig. 11 shows that the overall average trigger rate of our system has remained quite low for the duration of its operation so far, and shows no obvious correlation with wind speed. Possible correlation of RF thermal noise with blowing snow was a hypothesis we wished to check, since blowing snow is known to create static charge buildup on capacitive metal structures in polar regions where the humidity is extremely low. For the ARA-testbed, all surface equipment was deployed so that snow would drift in and bury it soon after it was deployed, to avoid having any remaining conductive structure on the surface. We have so far found no evident trigger-rate correlation with wind speeds.
In the current electronics version, the digital-to-analog converter (DAC) voltages that set the discriminator thresholds are held at fixed digital values, but due to temperature-dependence, the actual output voltages of the discriminator thresholds will drift slightly with temperature. Our operational software has the capability to allow the threshold to servo on the overall rates, but this was not implemented for the testbed yet, and thus we expect some correlation of the overall trigger rate with internal temperature, and in fact we see such correlation clearly in the data.
III.2 Thermal noise floor
An in situ estimate of the thermal noise floor for each of the antennas and receiver systems was made during the installation using a bootstrap method. As noted above, the receiver noise figures were measured separately, along with antenna transmissivity. During installation, the antenna was replaced by a load termination at the ambient temperature of the field site, and a series of noise sample waveforms were collected for the load as well as with the antenna replaced immediately afterwards. Because the termination gives only pure thermal Johnson noise compared to the antenna, any change in the waveforms RMS noise once the antenna is installed is due only to a change in the relative noise power, and this gives the antenna temperature as compared to the load temperature. In practice, the antenna temperatures observed in this calibration were all comparable to the load temperature within the standard errors of the measurement, which were of order 10%. This shows that the antenna temperatures are consistent with the ambient ice temperature. An exception in this procedure was observed for the two surface antennas, which were subject to the strong Galactic noise component below 100 MHz. Above 100 MHz the observed noise in these antennas was consistent with the thermal noise of the ice however.
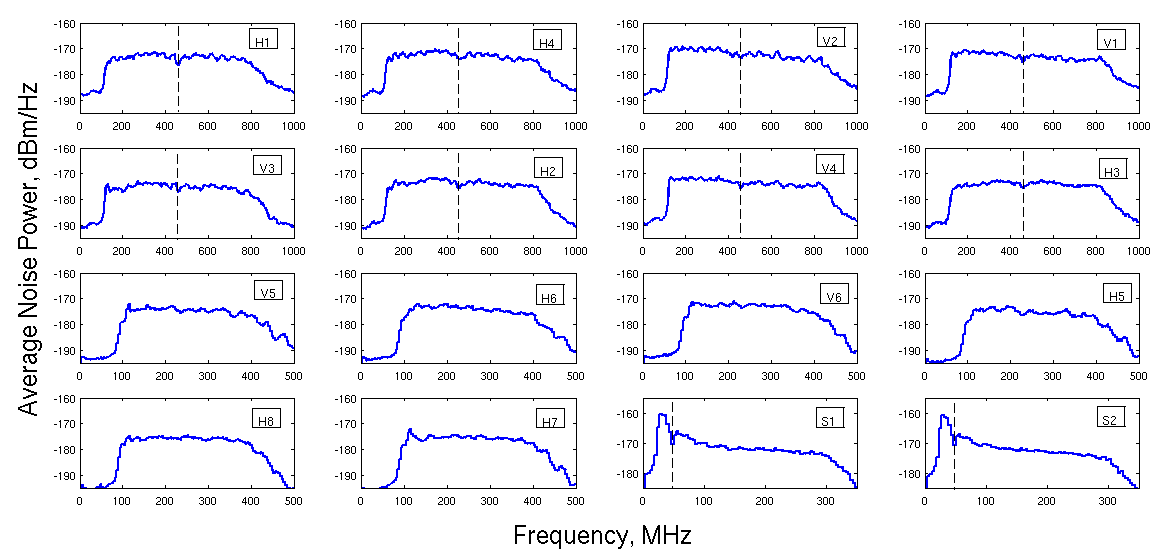
Figure 12 shows average Fourier power spectral density of the antenna+receiver thermal noise, taken for several hundred events which were selected as unbiased noise sample waveforms from data taken in late April 2011, run 2533. The thermal noise power level has been first-order calibrated, with a systematic error of about dB. Pure thermal noise at 290 K produces a noise power spectral density of -174 dBm/Hz, and in our case our average ice+receiver thermal noise is just above this, at about 325 K, about 0.5 dB above room temperature equivalent. In most cases the data match these expectations well, but in some cases our gain calibration appears to be offset.
There are several features apparent in these data that are worth noting. First, for each channel the passband filter response is evident. For the borehole antennas (upper eight), the passband is 130-850 MHz; for the next 6 of 8, the passband is 100-400 MHz; these antennas are near-surface antennas that are physically larger and thus respond down to lower frequencies, although their beam patterns are still designed to primarily view down into the ice. The last row contains two borehole Hpol antennas, the QSCs, and the two low-frequency surface fat dipole antennas. The QSCs do not turn on until about 200 MHz. Below their turn-on frequency they act as effective terminations, so the thermal noise power transitions over to Johnson noise. For the surface dipoles, their LNAs are ineffective above about 300 MHz, so they are lowpassed above that frequency.
Second, some channels show ripple of up to dB ( % in power) in the noise spectra; these are likely due to residual antenna impedance mismatches, which create low-level reflections between the antenna and LNA. Such effects can be mitigated with more careful matching which has been achieved in other antennas that do not show these effects. In practice this spectral ripple leads to very little distortion for pulse measurement since the reflection is causally late compared to the signal.
Third, in each of the borehole antennas (the upper eight spectra), a dashed vertical line marks the location of the notch filter, which is weakly visible in these spectra since some of the antenna power is blocked at 450 MHz frequency. In the lower antenna channels, the receivers had a 400 MHz lowpass filter so the spectra are plotted only up to the point where they turn off. In the two surface antennas (last two panes at lower left) there is another notch at 46.28 MHz to suppress a known radar frequency; this is also evident in the data. For these antennas, the rapid rise of Galactic noise below 50 MHz is also evident.
Galactic Noise
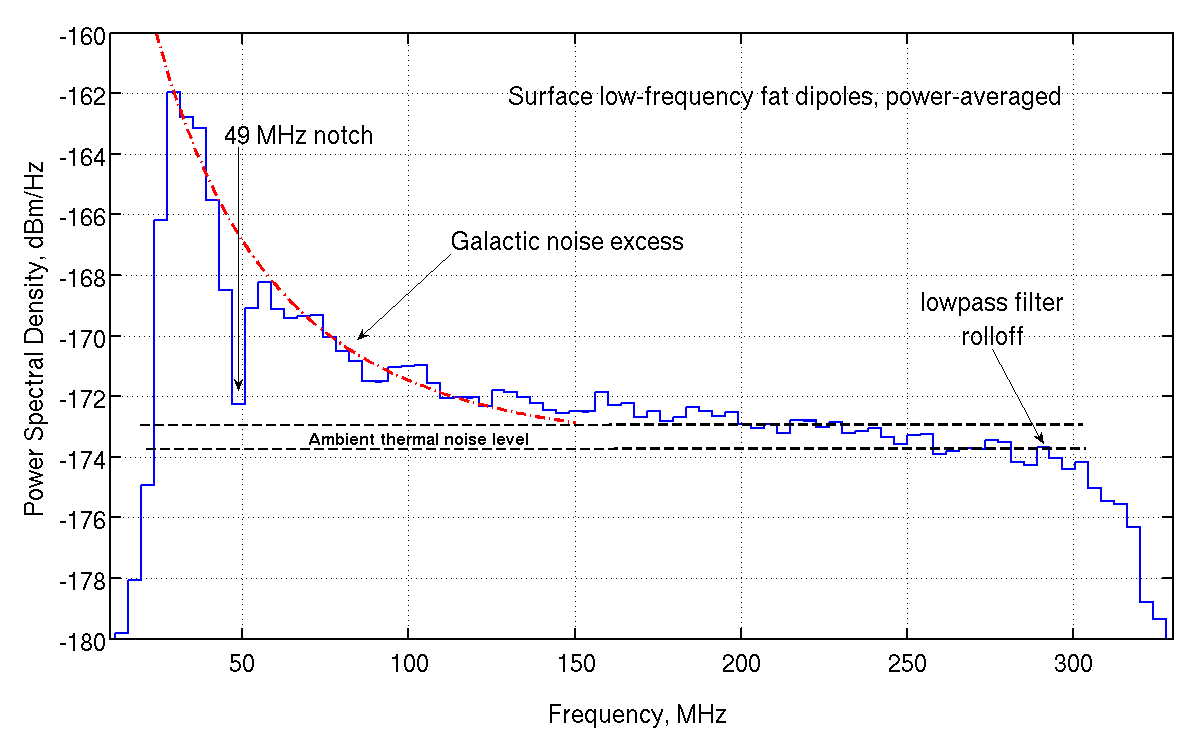
The average galactic radio noise begins to exceed that of the ambient ice at roughly 150 MHz, rising quickly with decreasing frequency as a power law with
| (2) |
Fig 13 shows the power spectral density for the average of the two low-frequency antennas, showing the excess due to Galactic noise at frequencies below 100 MHz. At 60 MHz, for example, the average sky temperature is about 3000 K, and we observe a noise temperature about 6 dB above our thermal noise. For these antennas, the LNAs had a receiver noise figure of about 100 K in this spectral range, and the dipole response of the antenna effectively averages the noise power from the sky above with that of the ice below with equal weight. Thus we expect an antenna temperature of about 1700 K, a factor of about 5 above the antenna+system temperature due to the ice and LNA, or 7 dB, consistent with expectations for galactic noise. The observed slope is also consistent with galactic noise; at 100 MHz we see an increase of about a factor of 2 over ambient ice+system temperature, consistent with equation 2 above.
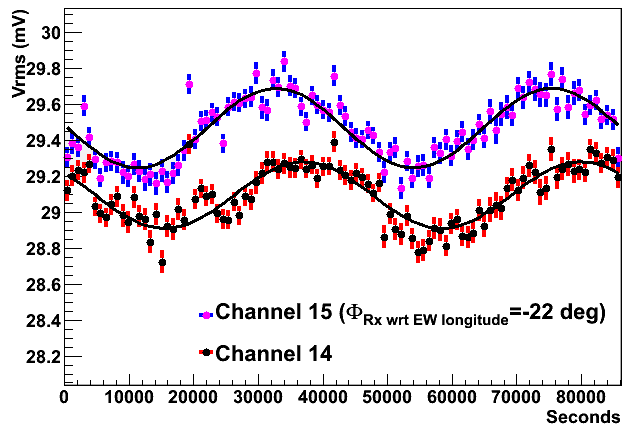
Because the two surface low-frequency antenna are horizontal dipoles, we can make use of the standard dipolar cosine response of the antenna beam pattern to test for modulation of the galactic noise on the time scale of a sidereal day. As the dipole beam rotates through the galactic plane, which has an inclination of with respect to the horizon at the South Pole, the dipolar response pattern alternately views the hotter galactic plane and the cooler polar regions. We have tested for this effect for three months of our testbed data, and these are folded together according to a sidereal period. This is shown in Fig. 14 for the two surface antennas, and there is clear sinusoidal modulation evident in the total power, which in this case has been low-pass filtered below 70 MHz to enhance the galactic noise component. The nominal azimuthal orientation of these antennas differs by about according to our as-built surveys, and we thus expect a phase shift between the two sinusoids. In fact we observe a phase difference, somewhat different than our expectations. However, given that there are coaxial cables running within several meters of one of the antennas, well-within the Fresnel zone of wavefront disturbance for these frequencies, we attribute the difference to a distortion of the main beam of one of the antennas. These results in any case lend confidence to our estimates of the system and antenna temperatures for the ARA-37 testbed.
III.2.1 Solar Radio burst of Feb. 13, 2011

On February 13, 2011, the Green Bank Solar Radio Burst Spectrometer detected a series of strong type II solar radio bursts in a broadband measurement spanning 10 MHz up to 1 GHz GBSRBS , as seen Fig. 15 (Bottom panels). Fig. 15(Top) shows the resulting ARA dynamic spectra for several of our antennas for the period of the burst. It is evident that the ARA testbed saw several components of the burst sequence clearly in several different frequency bands. The observed spectra in ARA must be deconvolved from the frequency-dependent response of the antennas to produce dynamic spectra with an absolute flux density calibration, and this is outside the scope of the current report, but the results demonstrate the sensitivity of the ARA system, and also the low background noise environment of the South Pole ARA site. Further work is underway to produce interferometric images of the Sun during this event. Fortunately, such events are relatively rare and will not pose a significant noise background to ARA observations.
III.3 Radio-frequency Interference
As we have noted above, understanding the radio-frequency interference environment of the South Pole locale is critical to the effective design and operation of a radio array in its vicinity. The ARA-testbed was deployed in the latter part of the austral summer, and operations at Amundsen-Scott station continued at full pace for some weeks after we began taking data, giving us a full exposure to the types of interference that are common during the austral summer season there, when most major science activities are conducted.

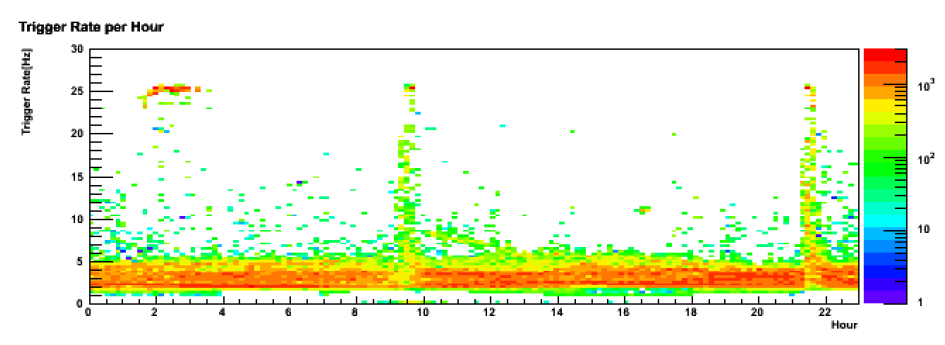
Figure 16 shows results of the trigger rates as a function of time for the ARA-testbed over the entire quarter of operation. Not surprisingly, the austral summer shows higher levels of sporadic interference. There are several specific periods where interference is strong enough to significantly impact our operation: during meteorological balloon launches, which are conducted twice daily until early March, when we observe the frequency reduced to once daily. These balloon launches utilize a MHz transponder for data telemetry, and this produces strong interference for us for about 1/2 hour in each flight. During that time, our system event rate is saturated, and the deadtime is nearly 100%, but this leads to a total loss of livetime of order 5% , and half of this in the later season where the launches are reduced to one per day.
The other significant cause of strong interference is incoming or departing aircraft which use a 129.3 MHz communication channel. In our current system, while our filters are rolling off at that frequency, they are not strong enough to suppress this signal below the level where it causes a high trigger rate, and again we experience 100% deadtime for a period of typically 20-30 minutes around the time of arrival or departure of the flights. During peak activity periods, several flights a day may land or depart, leading to an additional 5% per day loss of livetime on average.
Other than these two sources, there are occasional sporadic interference episodes associated with other activity, but these have had only a minimal effect on the livetime to date.
Figure 16 (top) also shows how the trigger rate has slowly declined since the summer peak; this is likely not due to decreasing interference, but rather the temperature dependence of the trigger thresholds, as discussed above. Overall the RFI environment in the locale near Amundsen-Scott station is quite acceptable for our requirements, and we estimate the yearly average loss of livetime due to interference at of order 3% at most.
In addition to assessing noise generated by equipment already in place at the station, we installed a wind turbine system at a distance of order 800 m from the ARA-testbed as part of a program to investigate autonomous long-term power sources (detailed in Appendix A) for ARA-37 and future arrays that are deployed further out from the existing South Pole infrastructure. We have searched our data for triggers which specifically reconstruct toward the direction of the wind turbine, and we find none, indicating that this technology will likely be acceptable for use for ARA.
III.4 Calibration Pulser
The local calibration pulser, which pulses at a repetition rate of 1 Hz during all periods when the ARA-testbed system is running, provides a continuous measure of the trigger functionality, and a stable timing and amplitude reference for monitoring of the ongoing performance of the system. An example of an individual calibration pulser event is shown in Fig. 17. Because the calibration pulser is located at nearly the same depth as most of the borehole antennas, the signal shape as seen by those antennas has the broadest bandwidth and thus tends to be very narrow and coherent in time. Because the radius of the calibration pulser borehole is only three times the m radius of the inner borehole array, an amplitude gradient across the array is quite evident in the data.
We also noted in these data that there is a second pulse, which we hypothesize is a reflection, appearing in the Hpol antennas only. Other tests done during deployment using different calibration locations saw no similar reflections, so it does not appear to be something intrinsic to these channels. The region where we deployed the ARA-testbed is still relatively close to the original station established in the 1950’s. The depth at which we deployed our antennas, typically 20-30 m, is in fact the depth at which the 1950 surface layer is found. Because many air-drops of equipment in the vicinity of the Pole were done during this period, and much equipment was left in the field, it is possible we have detected a horizontal metallic object within several meters of our boreholes, and we are investigating this further in the data.


One of the important functions of the calibration pulsers is to provide a stable reference signal that can be used to determine the geometry of the array in situ, via the relative delays between the received waveforms within the array. Fig. 18 shows a typical example of a histogram of the delays between Vpol borehole antennas V1 and V4 for an ensemble of about 2600 calibration pulser events. The delays for each event are extracted by cross-correlating the received waveforms for each event, and this delay distribution is shown in the plot, with a fitted Gaussian to the peak region giving a well-defined mean value (arbitrary in this case) with an estimated error of about 4.5 ps, and a Gaussian standard deviation of 136 ps. The standard error on the fitted mean represents the ultimate limit of the calibration pulser data for determining geometry within the array – in this case the 4.5 ps resolution corresponds to about 1 mm in ice. Thus the timing resolution is more than adequate for calibration; our reconstruction requirements for the geometry can easily tolerate few cm accuracy on locations.
The standard deviation of the fitted Gaussian for the pulser delay distribution also provides a calibration of the potential angular resolution for the system. A standard deviation of 136 ps in this case corresponds to about 2.7 cm in the ARA-testbed ice. Our angular reconstruction of signal arrival directions depends on the ratio of our standard error on the waveform arrival to the length of the projected baseline between two antennas, eg:
where is the baseline delay for wavefront arrival times and at antennas , and is the Poynting vector of the incoming wave, here assumed to be a plane wave for simplicity. For typical baseline lengths of 15 m or more, the implied angular resolution per baseline is of order for 136 ps timing error, again more than adequate for our requirements.

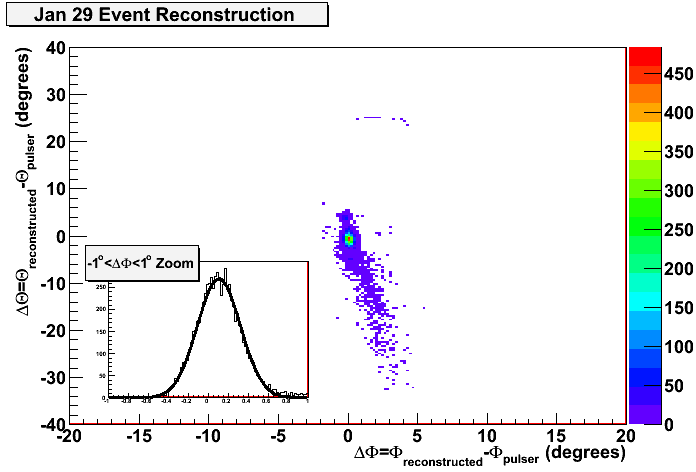
Fig. 19 shows the distribution of the reconstructed azimuthal direction of events observed on two separate typical days during the operation period. Events that RF-triggered the testbed during these periods were either thermal noise fluctuations, which can form random coincidences but do not reconstruct as plane- or spherical-waves when analyzed offline, or RF triggers from the calibration pulser, or from any other RF interference or backgrounds that may be present. The latter two types of events recur from fixed directions: the calibration pulser from a fixed azimuth; RFI can occur from a variety of directions but will be associated with the South Pole Station, and are likely to repeat, thus giving clusters of events in stable directions associated with human activity. It has also been hypothesized that wind-blown snow could create electrical discharges itself, or by depositing charge on structures which then discharge once they reach a high-enough potential. Thus we have looked for a background of random triggers that are associate with higher-than-normal winds, or structures such as our wind-turbine system.
We find that almost all RF trigger events observed have an azimuth consistent with that of the calibration pulser with respect to the center of the array. January 29, 2011 was a period of relatively high winds ( kt), which produces more opportunity for static discharge on any above-surface structures, and also yields higher power generation in the nearby wind turbine system. By contrast March 19 was a period of relatively calm wind. In neither case did we observe any significant number of events that reconstructed to any other direction, including the azimuth of the nearby wind turbine system, and other directions associated with the IceCube Laboratory and South Pole Station. Fig. 20 shows a two-dimensional map of the reconstructed events for the higher wind date, with an inset showing the azimuth distribution. A very small fraction of events misreconstruct in elevation angle as evident in the plot, but the vast majority of events are consistent with the calibration pulser only.
III.5 Deep pulser measurements
In our measurements, all of the IceCube pulsers show some degree of saturation in the received signals at the ARA-testbed. While this bodes well for future studies of long-range ice transmission for ARA, the saturated waveforms in the ARA-testbed complicate efforts at precision estimation ice transmission parameters.

In addition, the bicone antenna design for deployment concentric to the IceCube cables, and under the extreme high pressure of the re-freeze that occurs in the hot-water-filled IceCube boreholes, led to some challenges in the antenna construction that also came with risk. For example, the clam-shell jointing of the antennas to surround the IceCube cable must be done during a rapid deployment, and inadequate contact for the joint can lead to shunt-capacitance across the slot, and cause some radiation of Hpol as well as Vpol signals. Also, the long-wire vertical IceCube cable in close proximity to the antenna can lead to re-radiation and scattering of the signal. As a result of analysis of the signals and comparison with some prior lab measurements, we conclude that the transmitted pulse from the deep pulser was dispersed in time over typically a ns time window, although it appears that most of the pulse power was in fact contained withing this dispersed pulse.
Despite these difficulties, we have observed signals from these transmitters at up to a 3.2 km slant range from the source. The best example of this is shown in Fig. 21 which comes from the furthest and deepest of the deployed pulsers, installed in IceCube Hole #1 at a depth of 2450m and a horizontal distance of about 2 km from the ARA-testbed, for a total slant range of 3.16 km at an angle of about 40∘ from the vertical. Some of the observed signals still saturate our DAQ dynamic range even at this distance, and we do observe significant Hpol signal as well as Vpol; suggesting that the clam-shell coupling of the antenna was not complete. The Hpol signals also have higher frequency content than the Vpol signals on average, and are factors of 2-3 weaker in amplitude, which is consistent with radiation from partial slots along the antenna’s vertical joint. In several cases, receiving antennas are partially shadowed by antennas in the foreground with respect to the pulse arrival direction. The radius of the first Fresnel zone is the region around any obstruction within which a propagating wave is disturbed, and for the ARA-testbed antennas for a source at distance and the foreground antenna at distance from the receive antenna we have
| (3) |
For m, and m, m for m in ice, indicating that we would expect several of the antennas to suffer from significant shadowing, which we observe.
III.5.1 Attenuation length estimates
If we isolate our attention to the foreground Vpol antennas that are undisturbed, we may use the resulting amplitude to estimate the average attenuation length over the entire 3.16 km propagation path, along with our knowledge of the antenna and pulse parameters at the source. The attenuation length can be determined from the Friis equation Kraus , which relates the received power to the transmit power as a function of frequency:
| (4) |
where is the path distance through the ice, and are the receive and transmit antenna effective areas (including antenna coupling efficiency), which are in general also functions of frequency . Inverting this for the average attenuation length we have:
| (5) |
The quantity in this case is a weighted average, where the weights are determined by the vertical temperature profile of the ray paths, since the attenuation coefficient (in units of m-1) is , a strong function of the ice temperature .
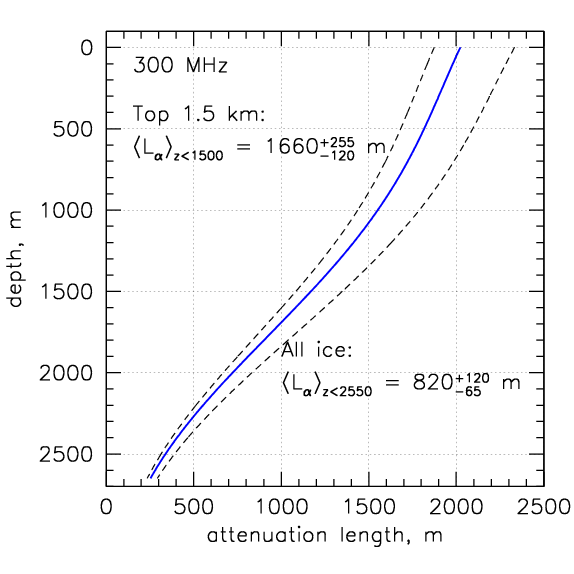
Accounting for the transmitted power, for the bicone transmitter antenna response, estimated insertion losses, antenna beam pattern, a first-order estimate of the signal saturation, and the receive antenna response, our estiamte of the attenuation length over the referenced to 300 MHz is plotted in Fig. 23 as a function of depth. The depth dependence is deconvolved from the total attenuation under the assumption that the depth dependence is dominated by the ice temperature profile, which has been determined quite well for South Polar ice. The average attenuation length for all depths, m is also given. The errors here are dominated by our systematics on the received amplitude and pulse shape. The resulting value is quite consistent with values derived from vertical bottom-bounce methods at the South Pole icepaper , and the systematics here are different from those in the bottom-bounce measurement in which the bottom reflection coefficient is unknown. Note that the attenuation length derived is dominated by the extended propagation distance in the relatively warm basal ice; considering the upper 1.5 km where the ice is much colder than the basal ice, the effective average attenuation length is nearly 1.7 km. This remarkably long field attenuation length of the ice in this extremely cold region of the cryosphere sets it apart from any other natural (and in fact most man-made) dielectrics as the most transparent solid medium on Earth. It is perhaps the single most important characteristic of the ice for enhancing the performance and viability of an array such as ARA.
III.5.2 Surface reflection

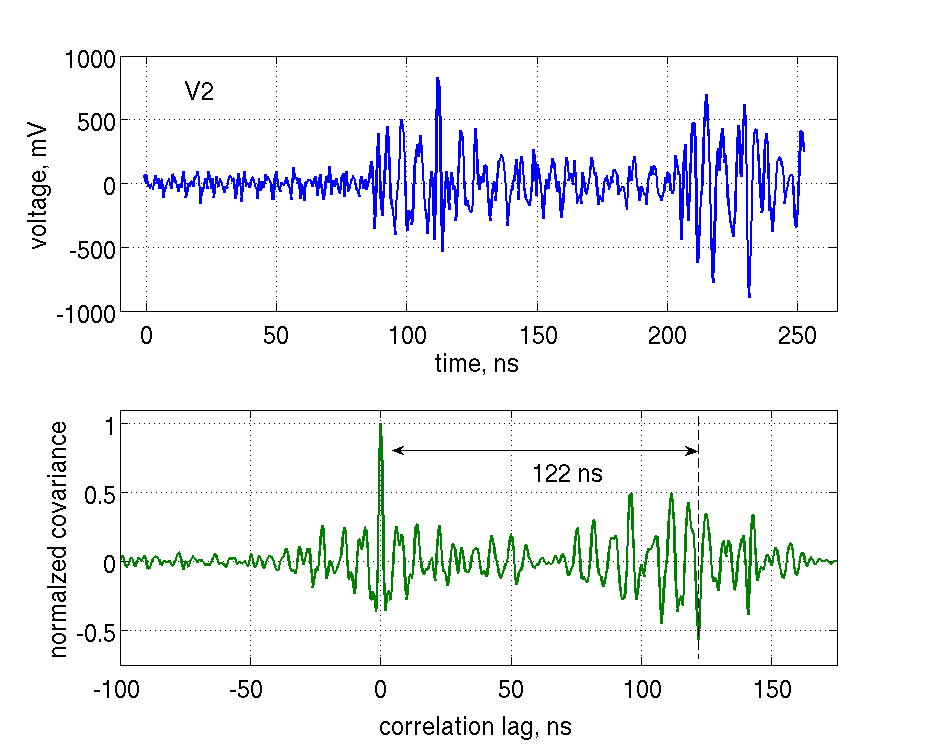
Another interesting feature observed in the deep pulser signals, which arrive at the ARA-testbed as a close approximation to a plane wave, is the surface reflection which is seen in several antennas, most clearly in borehole bicones V1 and V2. These differ in depths by several meters, leading to a different delay time before the reflection arrives. In antenna V2, the reflection is clearly phase-inverted compared to the primary signal; V1’s record cuts off too early to observe this clearly. To verify the presence of the reflection, the waveform (top) and a cross-covariance estimate (bottom) of the primary and secondary pulses with the primary pulse are shown in Fig. 22. The cross-covariance has its highest correlation with the primary pulse at a 122 ns delay, where the peak is a 60% anticorrelation, as seen in the Figure. V2’s signal amplitude for the reflection is also quite close to the direct signal amplitude, which is consistent with a total internal reflection off the top of the ice, as expected for the estimated incident angle of arrival with respect to the ice surface normal.
Fig. 24 shows numerical ray trace paths for this antenna from the IceCube deep pulser (top), and a zoom to the region of the reflection in the bottom pane. The numerical ray tracer uses the eikonal equation and a refractive index model developed based on radio index of refraction data from the RICE experiment at the South Pole, and returns both the ray path and total wave transit time along the ray. The delay observed in antenna V2’s waveform from the direct to inverted reflection is 120.0 ns. For the ray paths from Fig. 24, the direct path transit time is 18,724.53 ns, and the reflected ray path requires 18,669.92 ns to the surface, followed by 176.6 ns from the surface to the antenna, for a relative delay of 122 ns with respect to the direct path, a result identical to that observed in the data. This also independently confirms the precision of our index-of-refraction model.
It is a generic feature of a subsurface radio array that signals may be observed both directly and via the surface reflection, or even via near-reflections for rays that are curved back down near the surface; this effect is not yet incorporated into our simulations, but will improve the detection efficiency in general, and give some additional reconstruction power as well.
IV Expected Performance for ARA-37
We characterize the expected performance of ARA based on an extensive suite of Monte Carlo and other simulation and modeling tools developed over the last two decades. Several of the investigators on this proposal have been involved in radio methods for detection of UHE neutrinos since the mid-1990’s and thus the heritage of our simulation methodology is many generations deep and has been proven over a wide range of active and completed experiments, including the RICE RICE06 and AURA AURA experiments, which are direct pre-cursors to ARA, the Goldstone Lunar Ultra-high energy neutrino Experiment (GLUE) GLUE04 , and the ANITA experiment ANITA2 .

Our Monte Carlo tools include detailed ice attenuation modeling and raytracing to account for the gradient in the index of refraction of the ice vs. depth. They provide state-of-the-art modeling of the Askaryan radiation from showers via tested parametrizations, which have been validated by direct measurements of the Askaryan effect in ice at SLAC slac07 . Neutrino propagation through the earth and ice sheets is modeled in detail, and the particle physics of the interaction, including neutral and charged-current effects, fully-mixed neutrino flavors, and secondary shower production due to charged-current - and leptons are accounted for in the models. Finally, the detectors are also modeled with high fidelity, including the effects of Rician noise in the detection process, spectral response functions of the antennas, and full 3-D polarization propagation for the radio waves that interact with the detector. We thus have reason to report these performance estimates with some confidence.
IV.1 Station Spacing
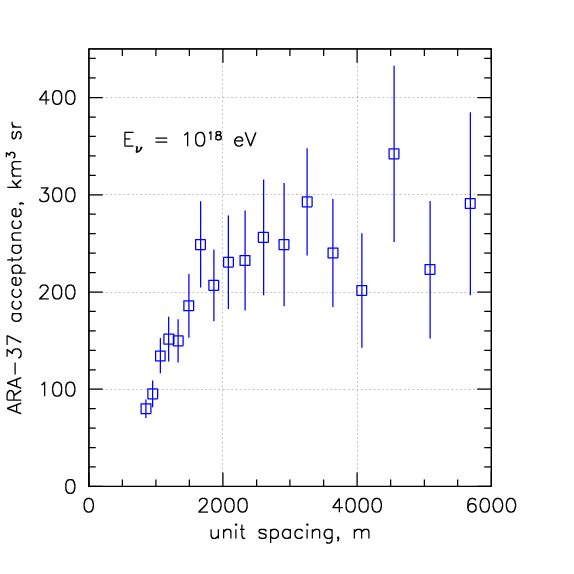
In initial studies of the ARA-37 array IceRay09 , we adopted a 1.33 km spacing between stations as a compromise which gave adequate sensitivity while still allowing for enough overlap between the stations’ effective target volumes to yield reasonable fraction of multi-station coincident events. However, in the interim, indications of possible heavier nuclear composition for the UHECRs have led to estimates for the cosmogenic neutrino flux which are significantly lower than for a pure proton spectrum, and thus in our current designs, we optimize the ARA-37 array for discovery potential, to maximize the number of detected events. Fig. 26 gives the results of a parametric study of the neutrino acceptance of the array as a function of the spacing for a neutrino energy of 1 EeV, which is an excellent proxy on average for the total number of detected events integrated over a typical cosmogenic neutrino spectrum.
We find that the acceptance grows rapidly with spacing starting with sub-kilometric sizes, and then becomes fully saturated at about 2-3 km. In our current design we have thus adopted 2 km as our baseline spacing; this choice reflects a good compromise between maximizing the sensitivity while still recognizing the potential logistical costs that grow with array size.
IV.2 Sensitivity
The primary metric for detection of cosmogenic neutrinos, which are presumed to arrive isotropically on the sky, is the volumetric acceptance , in units of km3 steradians. An equivalent parametrization is the areal acceptance (km2 sr) and the two are closely related by where is the interaction length of the neutrinos as a function of neutrino energy . The volumetric acceptance, divided by the instrumented target fiducial volume, gives a measure of the detection efficiency of neutrinos which interact within the fiducial volume of a detector. In the case of ARA-37, one realization of the simulation uses a cylindrical ice target volume of radius 10 km, and depth 2 km. Because of earth attenuation, neutrinos arrive almost exclusively from above the horizon, nominally giving steradians for the solid angle. The net target acceptance of the simulated ARA detector is thus just over 4000 km3 sr, and this represents the maximum neutrino volumetric acceptance the simulation could obtain. However, once the constraints given by the neutrino interaction cross section, the ice attenuation length, and the ray-tracing geometry of the ice, and the antenna response functions are imposed, the effective acceptance becomes an energy-dependent fraction of the initial target acceptance.
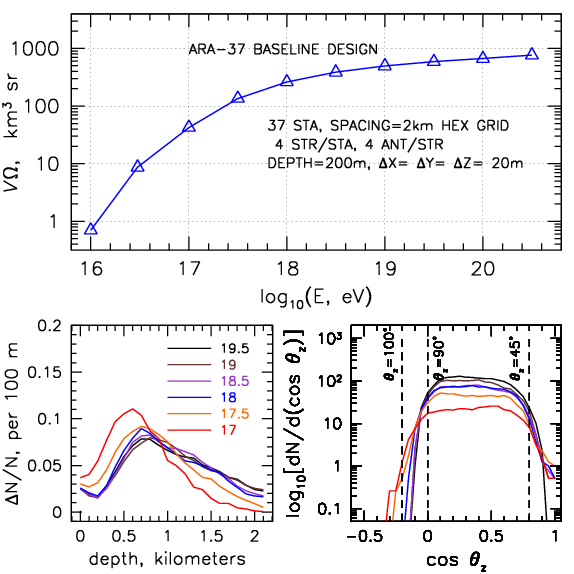
Fig. 27 shows the simulated results for our adopted baseline design, as a function of neutrino energy in the range of interest for the cosmogenic neutrino flux. The acceptance reaches the level of km3 sr at the mid-range of the cosmogenic neutrino flux, which has a broad plateau from about eV up to just over eV, and continues growing slowly up to the highest simulated energies, approaching a Teraton-steradian.
Fig. 27(bottom) gives a plot summary of some characteristics of the simulated data vs. neutrino energy. On the bottom left, the depth distribution of detected events is shown normalized to the event fraction per hundred meters. Events originating from below about 2 km depth tend to be suppressed, as the attenuation of the ice begins to grow quickly in the warmer basal ice icepaper . The estimated average attenuation length of our 2 km-deep fiducial volume is about 1.5 km, a factor of three better than ice in locations such as the Ross Ice Shelf, where the thickness is limited to several hundred m, and the attenuation lengths are comparable to this thickness scale. SP ice, especially in the upper 2 km of its depth, is the clearest solid dielectric medium on Earth in the radio range, and is the most compelling natural feature of the ARA site.
Fig. 27(bottom) also shows the arrival zenith angular distribution of neutrino events that were detected, showing that the neutrino angular acceptance spans a range from below the horizon to above the horizon, more than 6 steradians of solid angle.
| Model & references : | ANITA-II, | ARA, |
| (2008 flight) | 3 years | |
| Baseline cosmogenic models: | ||
| Protheroe & Johnson 1996 PJ96 | 0.6 | 59 |
| Engel, Seckel, Stanev 2001 Engel01 | 0.33 | 47 |
| Kotera,Allard, & Olinto 2010 Kotera2010 | 0.5 | 59 |
| Strong source evolution models: | ||
| Engel, Seckel, Stanev 2001 Engel01 | 1.0 | 148 |
| Kalashev et al. 2002 Kal02 | 5.8 | 146 |
| Barger, Huber, & Marfatia 2006 Barger06 | 3.5 | 154 |
| Yuksel & Kistler 2007 Yuksel07 | 1.7 | 221 |
| Mixed-Iron-Composition: | ||
| Ave et al. 2005 Ave05 | 0.01 | 6.6 |
| Stanev 2008 Stanev07 | 0.0002 | 1.5 |
| Kotera, Allard, & Olinto 2010 Kotera2010 upper | 0.08 | 11.3 |
| Kotera, Allard, & Olinto 2010 Kotera2010 lower | 0.005 | 4.1 |
| Models constrained by Fermi cascade bound: | ||
| Ahlers et al. 2010 Ahlers2010 | 0.09 | 20.7 |
| Waxman-Bahcall (WB) fluxes: | ||
| WB 1999, evolved sources WB | 1.5 | 76 |
| WB 1999, standard WB | 0.5 | 27 |
In Table 2 we give expected neutrino event totals from a wide range of currently allowed cosmogenic neutrino models for ARA in three years of operation, compared to recent published expectations for the best current limits to date, from the ANITA-II flight ANITA2 . It is evident that ARA-37 will extend in sensitivity above ANITA-2’s sensitivity by factors of two orders of magnitude or more. For strong-source-evolution and baseline models, ARA-37 detects between of order 50 to over 200 events in three years of operation, enough to establish the basic characteristics of the energy spectrum and source arrival directions.
There are also recent cosmogenic neutrino flux estimates which compute neutrino fluxes subject to constraints from the Fermi diffuse gamma-ray background Ahlers2010 , and which include a heavier nuclear composition (e.g., an admixture of iron) for the UHECRs Ave05 ; Stanev07 ; Kotera2010 . Over a 3-year timescale all of these models are detectable, but in some cases only marginally, and up to five years will be necessary to establish the flux. Over the planned instrument life of a decade or more, ARA-37 will thus be able to not only establish the flux levels for all of even the most conservative models, but to begin measurements of their energy spectral dependence as well.
IV.3 Resolution
Although not directly important for detection of neutrinos, the resolution of both the distance and angles to the neutrino interaction vertex, as well as the ability to reconstruct coarse neutrino incident directions on the sky, are important characteristics of our detector, and we have studied them in detail. This is especially important for our current realization of ARA-37, since the wider spacing will lead to very few multi-station coincident events, and thus each station must function as a stand-alone neutrino detector in both shower energy estimation and neutrino direction angular resolution.
To make these measurements, we have 16 antennas per station, and thus 16 waveform amplitudes and phases, as well as the frequency spectral components of the coherently-summed waveform which can be estimated to good precision once the arrival direction is fitted. From the Vpol and Hpol data we also fit the plane of polarization, and with precise timing we can measure the radius of curvature of the arriving wavefront.
Our measurement of the distance to the neutrino vertex is accomplished by the estimates of the wavefront curvature. This may be thought of as measuring the residuals when fitting the arrival times to a plane wave. For the angular measurements, the antenna array is analyzed as a correlation interferometer, and precise timing differences between the arrival times of the Askaryan radio impulse are determined for all of the pairs of antennas.
Complementing the precise timing measurements, we can also operate our cluster array as a radio intensity gradiometer and polarimeter. The gradiometric function comes through amplitude calibration of the received impulse, and the polarimetric information comes from ratios of the calibrated amplitudes of the Vpol and Hpol antennas.


All of these estimates are done in offline reconstruction routines. They are not necessary for the triggering of the array to record potential neutrino events, but they do make maximal use of the recorded information in the waveforms and arrival times of the events.
IV.3.1 Vertex Resolution
The critical parameter for vertex location is the intra-cluster timing precision. For this we have used actual measurements made with ANITA data, to which our collaboration has access. The ANITA payload, which uses waveform digitizers that are comparable to our planned digitizers, has demonstrated timing resolution as good as 30 ps rms for waveforms registered at the -level detection threshold of ANITA. These timing precisions come about from extensive in-flight calibration using ground-based impulse generators, and have proven robust in the ANITA analysis ANITAinst . For our simulations we have derated these values by a factor of 3.3 to account for our more limited radio bandwidth, the slower sampling rate we expect to use, and for possibly unknown systematics in our calibration.
Fig. 28(left,middle) shows the results of these simulations for both the range and pointing resolution to the vertex. The latter values are important for determining whether an event originates under the ice or from above the ice, and the former values, combined with our knowledge of the ice attenuation, will bear directly on our ability to perform calorimetry on the neutrino shower.
IV.3.2 Incident neutrino direction resolution
Estimating the neutrino vertex location in three dimensions does not immediately determine the arrival direction of the neutrino itself, and it may appear that the tight constraints of the cluster geometry would preclude determination of the neutrino direction, since this is normally done by imaging of the Cherenkov cone, at least in ring-imaging Cherenkov detectors. However, the richness of the radio wave information content does in fact allow for first order Cherenkov cone determination, using both the amplitude gradient of the cone, and the polarization vector, which lies in the plane containing the Poynting vector of the radiation and the shower momentum vector. Thus once the Poynting vector is determined via the vertex reconstruction, the plane of polarization combined with the local gradient in the cone amplitude is sufficient to constrain the neutrino direction on the sky.
To study the neutrino direction resolution, we have included first-order reconstruction algorithms in our Monte Carlo neutrino simulation. These do not yet perform a maximum likelihood minimization which would be very appropriate for this complex problem, but instead they perform a -grid search over variational parameters once the event has been detected in the simulation, which includes appropriate thermal noise backgrounds. These simulations are computationally intensive, and involve full 3D ray-tracing of the radio propagation through the ice for each tested grid-point. Fig. 28(right) shows the results for about 80 detected events in a simulation run at eV. The reconstruction for these events was about 80% efficient (that is, 20% of the events failed to reconstruct), but the reconstructed zenith angle distribution shown has a very acceptable standard error of , the simplicity of our reconstruction code notwithstanding.
IV.3.3 Energy Resolution
Once the event geometry has been reconstructed, the shower energy is determined via standard parametric equations ZHS ; Alv97 ; FORTE . For example, a parameterization due to Lehtinen FORTE gives the shower energy as a function of radio frequency as:
| (6) |
where is the shower distance, and are standard shower parameters relating to the excess charge and shower length, is the observer’s polar angle with respect to the shower (and neutrino) direction, is the wavenumber, the index of refraction of the ice; for typical dielectrics , and is the permeability of free space.
Using standard variational analysis the fractional shower energy () variation with range error is for small ice attenuation coefficient . The variation with uncertainty in is which is generally negligible since is of order at most. The corresponding variation with neutrino angular error is , where we evaluate the variation near the Cherenkov angle . Finally an estimate of the neutrino energy from shower energy must account for the large variance in the Bjorken--distribution, defined by for charged-current and all neutral-current events; electron neutrino events will be less affected by this, so our estimate is conservative. At neutrino energies of eV, numeric evaluations give , thus . Assuming these errors are uncorrelated, and using with a mean km, and , the root-sum-squared error is dominated by the Bjorken- uncertainty, giving for eV. This resolution will also be comparable for lower neutrino energies in the GZK neutrino spectral range. The -dominated uncertainty is generic for UHE neutrino experiments, but this energy resolution is wholly adequate for the first-order science goals of the ARA instrument.
IV.4 Comparison to Existing Instruments
Fig. 29 provides a comprehensive graphic summary of the comparison of our estimated ARA sensitivity to estimates for several operating experiments, along with 2006 limits from the ARA forerunner experiment RICE RICE06 . We have already noted the comparison of ARA to the published ANITA limits; here we use projections for ANITA’s reach after three flights, along with similar projections for IceCube and the Auger Observatory. GZK neutrino models are also included from a wide range of estimates Kal02 ; Kal02a ; PJ96 ; Engel01 ; WB ; Ave05 ; Aramo05 , including the pure-Iron UHECR composition model noted above.

ARA improves over any other current instrument by an order of magnitude within 3 years of operation, filling in an important gap in sensitivity in the heart of the cosmogenic neutrino spectral energy region. IceCube has excellent sensitivity to lower energies, up to the 10 PeV level, and ANITA has unmatched sensitivity at the higher energies, above 10 Eev. The Auger Observatory, while probing a similar energy range as ARA, does not have as high a neutrino sensitivity as it is primarily a UHECR instrument. ARA will complement these other instruments by making high sensitivity observations in the 0.1-10 EeV energy range, matching the peak of the expected cosmogenic neutrino fluxes.
V Conclusions
We have described the design and initial performance of a new ultra-high energy neutrino detector at the South Pole, the 16-antenna, self-triggering ARA-testbed, which is a high-fidelity prototype for future ARA detector stations. Our initial operation extending well into the the extreme thermal environment of the austral winter indicates that radio-frequency interference is infrequent and has only a slight impact on operation for our testbed detector, which is closest of any future ARA stations to the primary sources of interference at the South Pole station. Other than brief periods of sporadic interference, the baseline radio noise levels are dominated by the pure thermal noise floor of the ambient ice, and the thermal noise does not appear to be correlated to wind velocity. We have demonstrate the ability to maintain impulse trigger sensitivity at a level close to the thermal noise. We have demonstrated RF impulse propagation of more than 3 km slant range through the South Pole ice without significant loss of signal coherence. We have demonstrated inter-antenna pulse timing precision of order 100 ps, implying angular resolutions which are more than adequate for neutrino vertex reconstruction. We have presented simulations using characteristics projected from our measurements which give high confidence that our completed phase-I array, ARA-37, will achieve its goal of a robust detection of cosmogenic neutrinos, and will lay a clear foundation for an observatory-class instrument.
Acknowledgments
We thank the National Science Foundation for their generous support through Grant NSF OPP-1002483. We are very grateful to Raytheon Polar Services Corporation for their excellent field support at Amundsen-Scott Station, and the IceCube drillers and specialists who helped with our installation.
Appendix A ARA Autonomous Renewable Power Stations (AARPS)
As ARA moves farther from the station, the transition from station power to autonomous power sources will become increasingly important. The planned ARA footprint calls for three ARA stations to be powered from a single node, requiring about 300W from that node.
A variety of power sources were reviewed during 2010 including photovoltaic (PV) arrays, wind turbines, diesel generators, fuel cells, and Stirling engine generators. The first three remain in consideration with the renewable sources, PV and wind, to be attempted first. PV is well-known to be rugged and efficacious on the Antarctic plateau, so the 2010-2011 season was instead used to study wind power options for the Antarctic plateau.
The objectives in the first season of deployment were to:
-
•
Test wind turbine candidates for survivability and for power production. While several larger and several smaller turbines have been deployed on the plateau, there have been no known studies in the intermediate power range that ARA requires.
-
•
Measure wind speed as a function of height from the surface. This profile, determined by the turbulence produced by the surface upwind of the turbine, will dictate the required tower height.
-
•
Understand tower erection techniques suitable for the South Pole environment.
-
•
Fully instrument the system with sensors for temperature at various locations, power from turbines, wind speeds, etc. connected to a custom System Health Monitor (SHM). Those data are transmitted to the ICL.
-
•
Test a Power Instrument Box (PIB). The PIBs deployed are thermally insulated but do not have rf shielding; shielding is planned for future PIBs.
-
•
Test for electrical noise in the 200MHz to 800MHz band which could result from the turbine itself, the triboelectric effect on the tower, or emission from instrumentation.
-
•
Test low-power Zigbee communications.
The ARA effort to develop autonomous power stations at Pole began in the 2010-2011 season with the deployment of 3 small wind turbines, each with a rated power output of slightly over a kw:
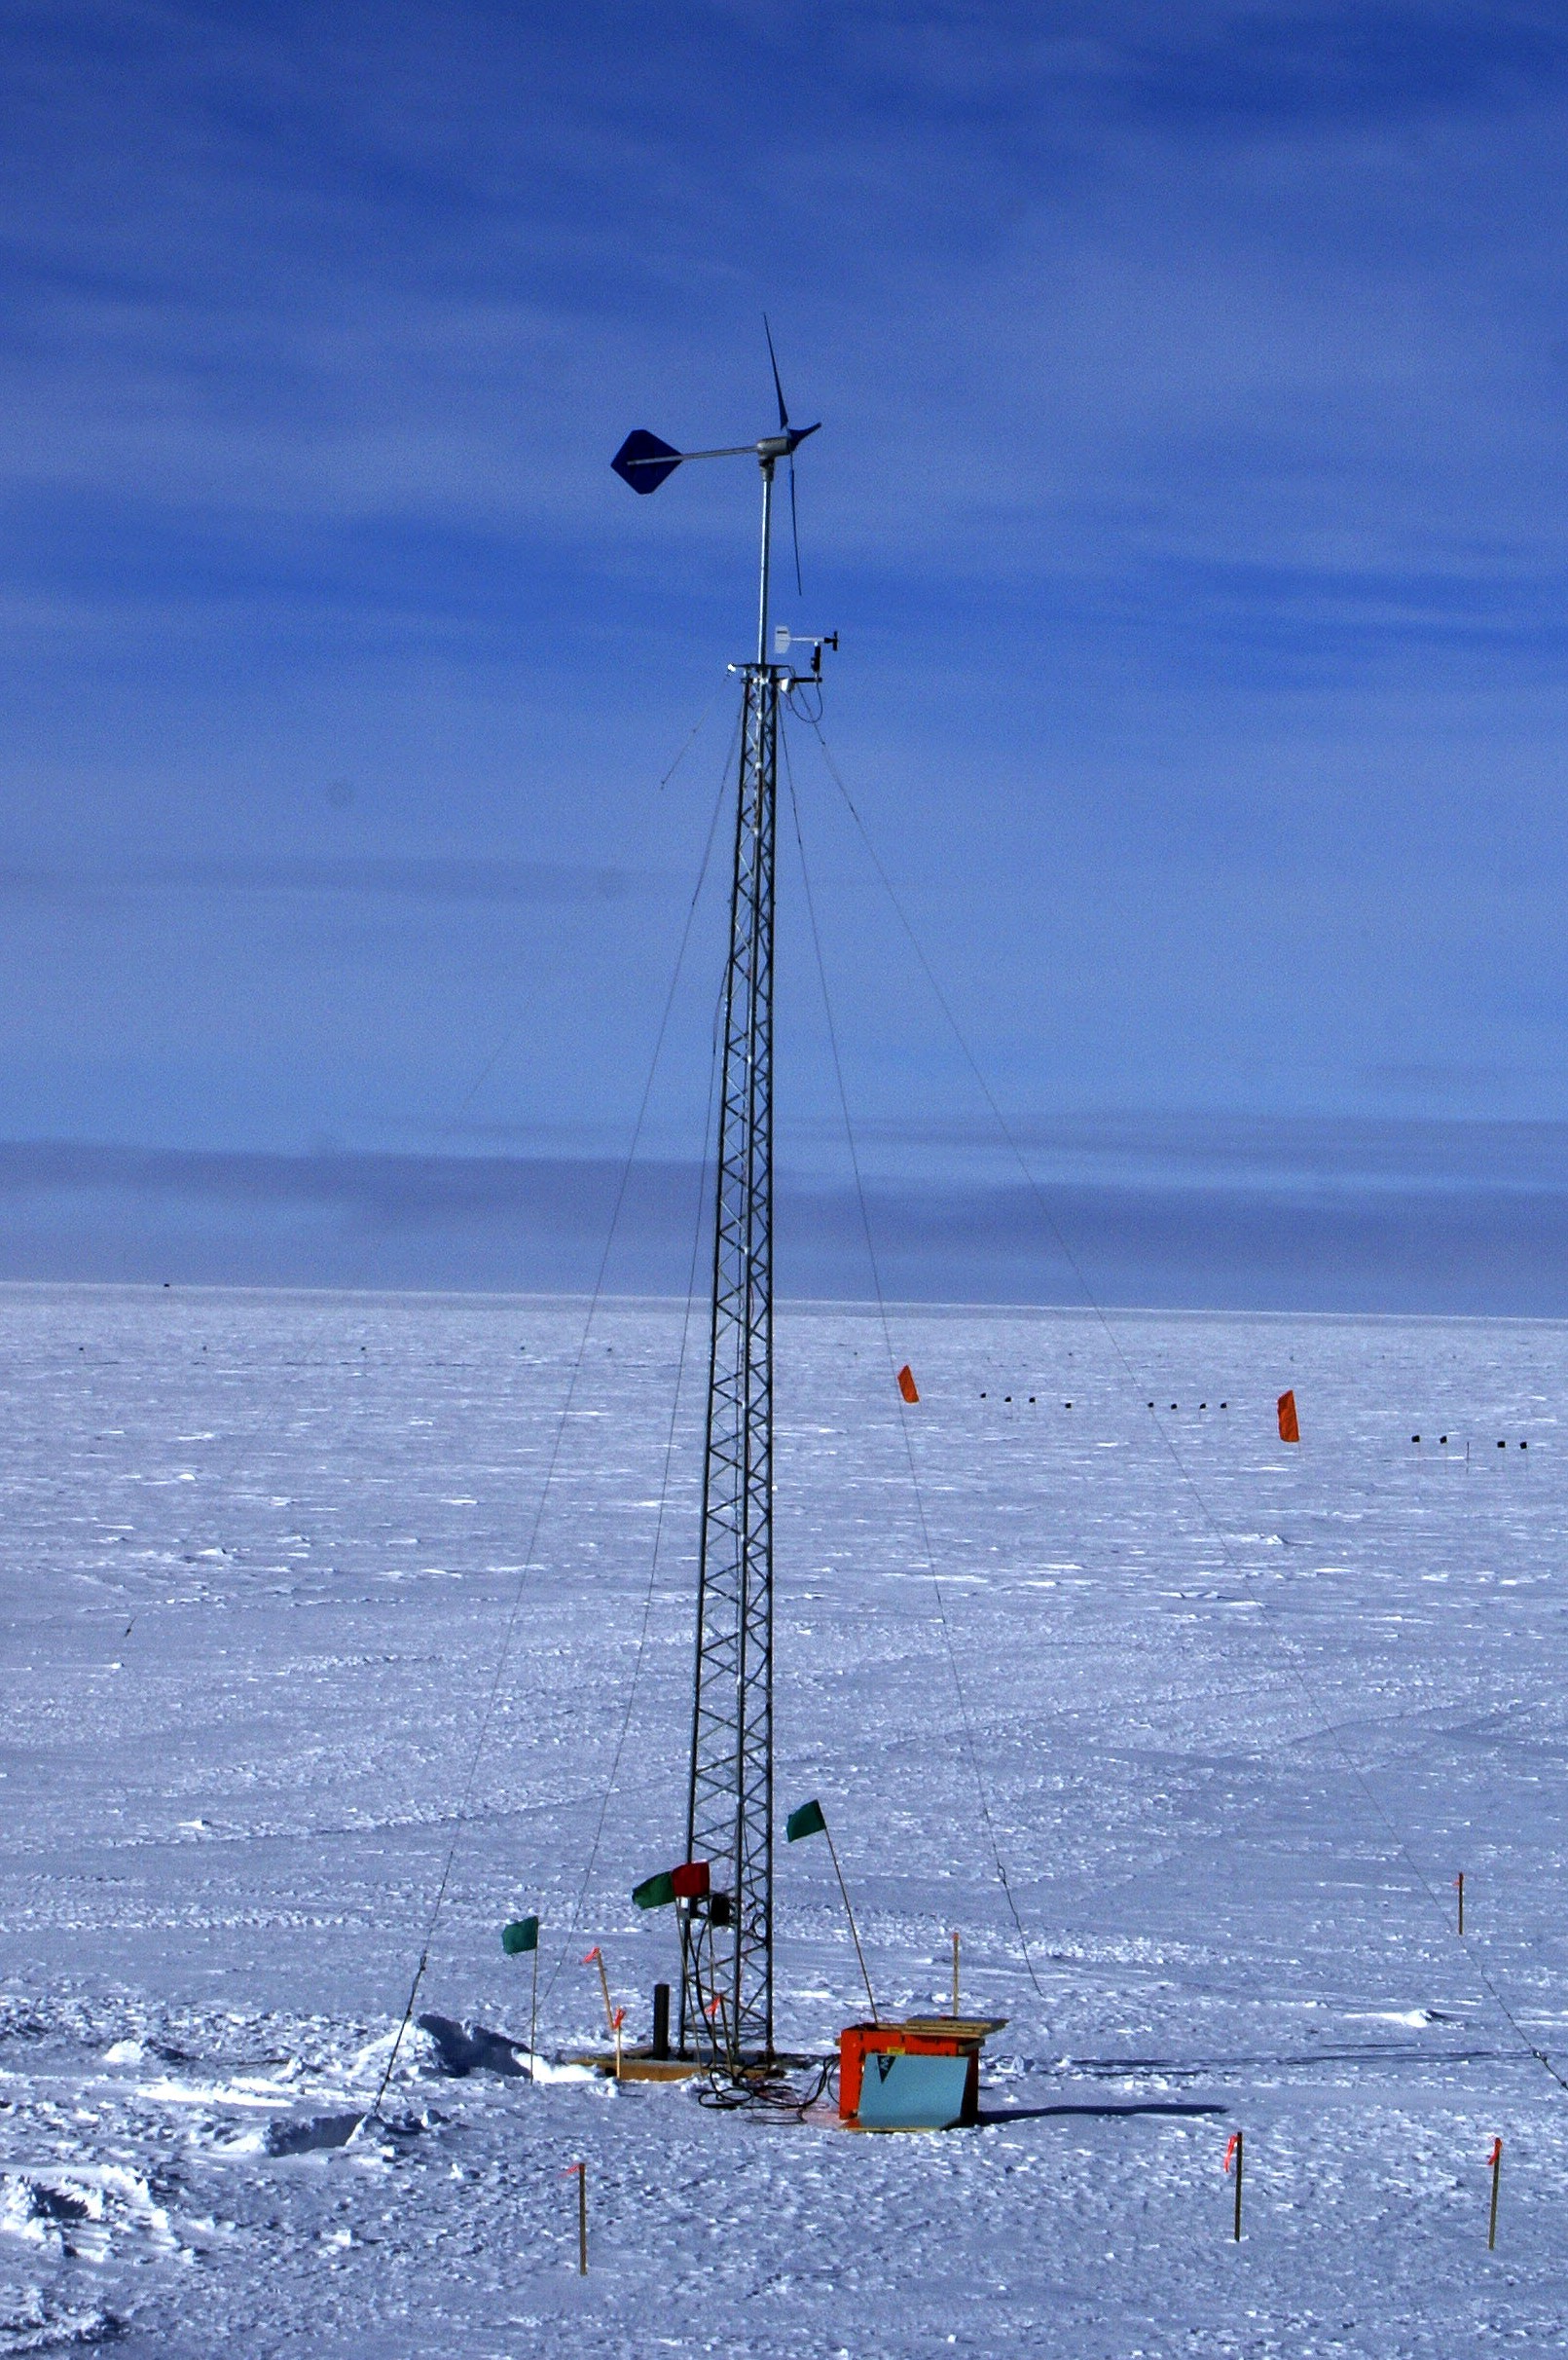
At Site 1, a Raum 1kw turbine (Fig. 30) was installed on a 50-ft lattice tower. It was raised on a tilt-up tower with a Pisten Bully and a fixed 10’ gin pole. Four guy wires are anchored by timbers placed as dead men in trenches in the ice. A single anemometer is mounted just below the turbine.
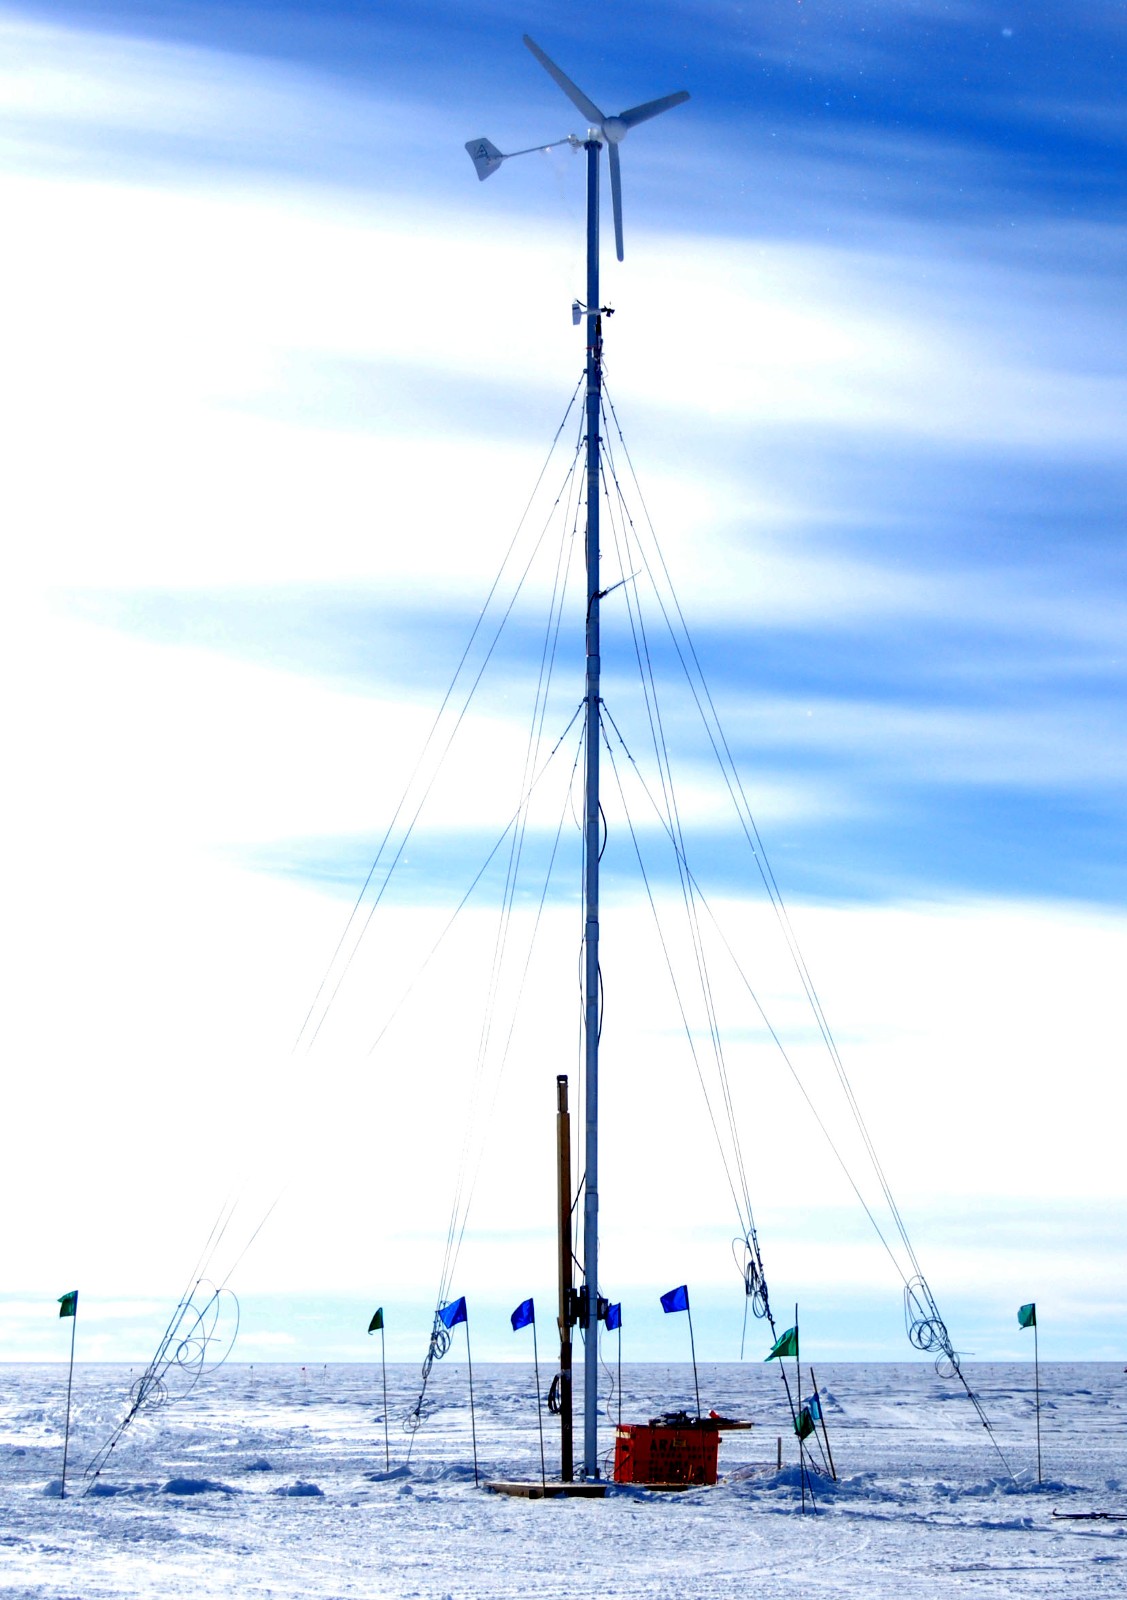
At Site 2, a Hummer kw turbine (Fig. 31) was deployed on a 50’ monopole. The greater weight of the turbine and tower required the use of a Caterpillar 853 to raise the turbine. Three sets of four guy wires are anchored by dead men. A single anemometer is mounted just below the turbine. A Yagi antenna is mounted below the anemometer and pointed toward the ICL.
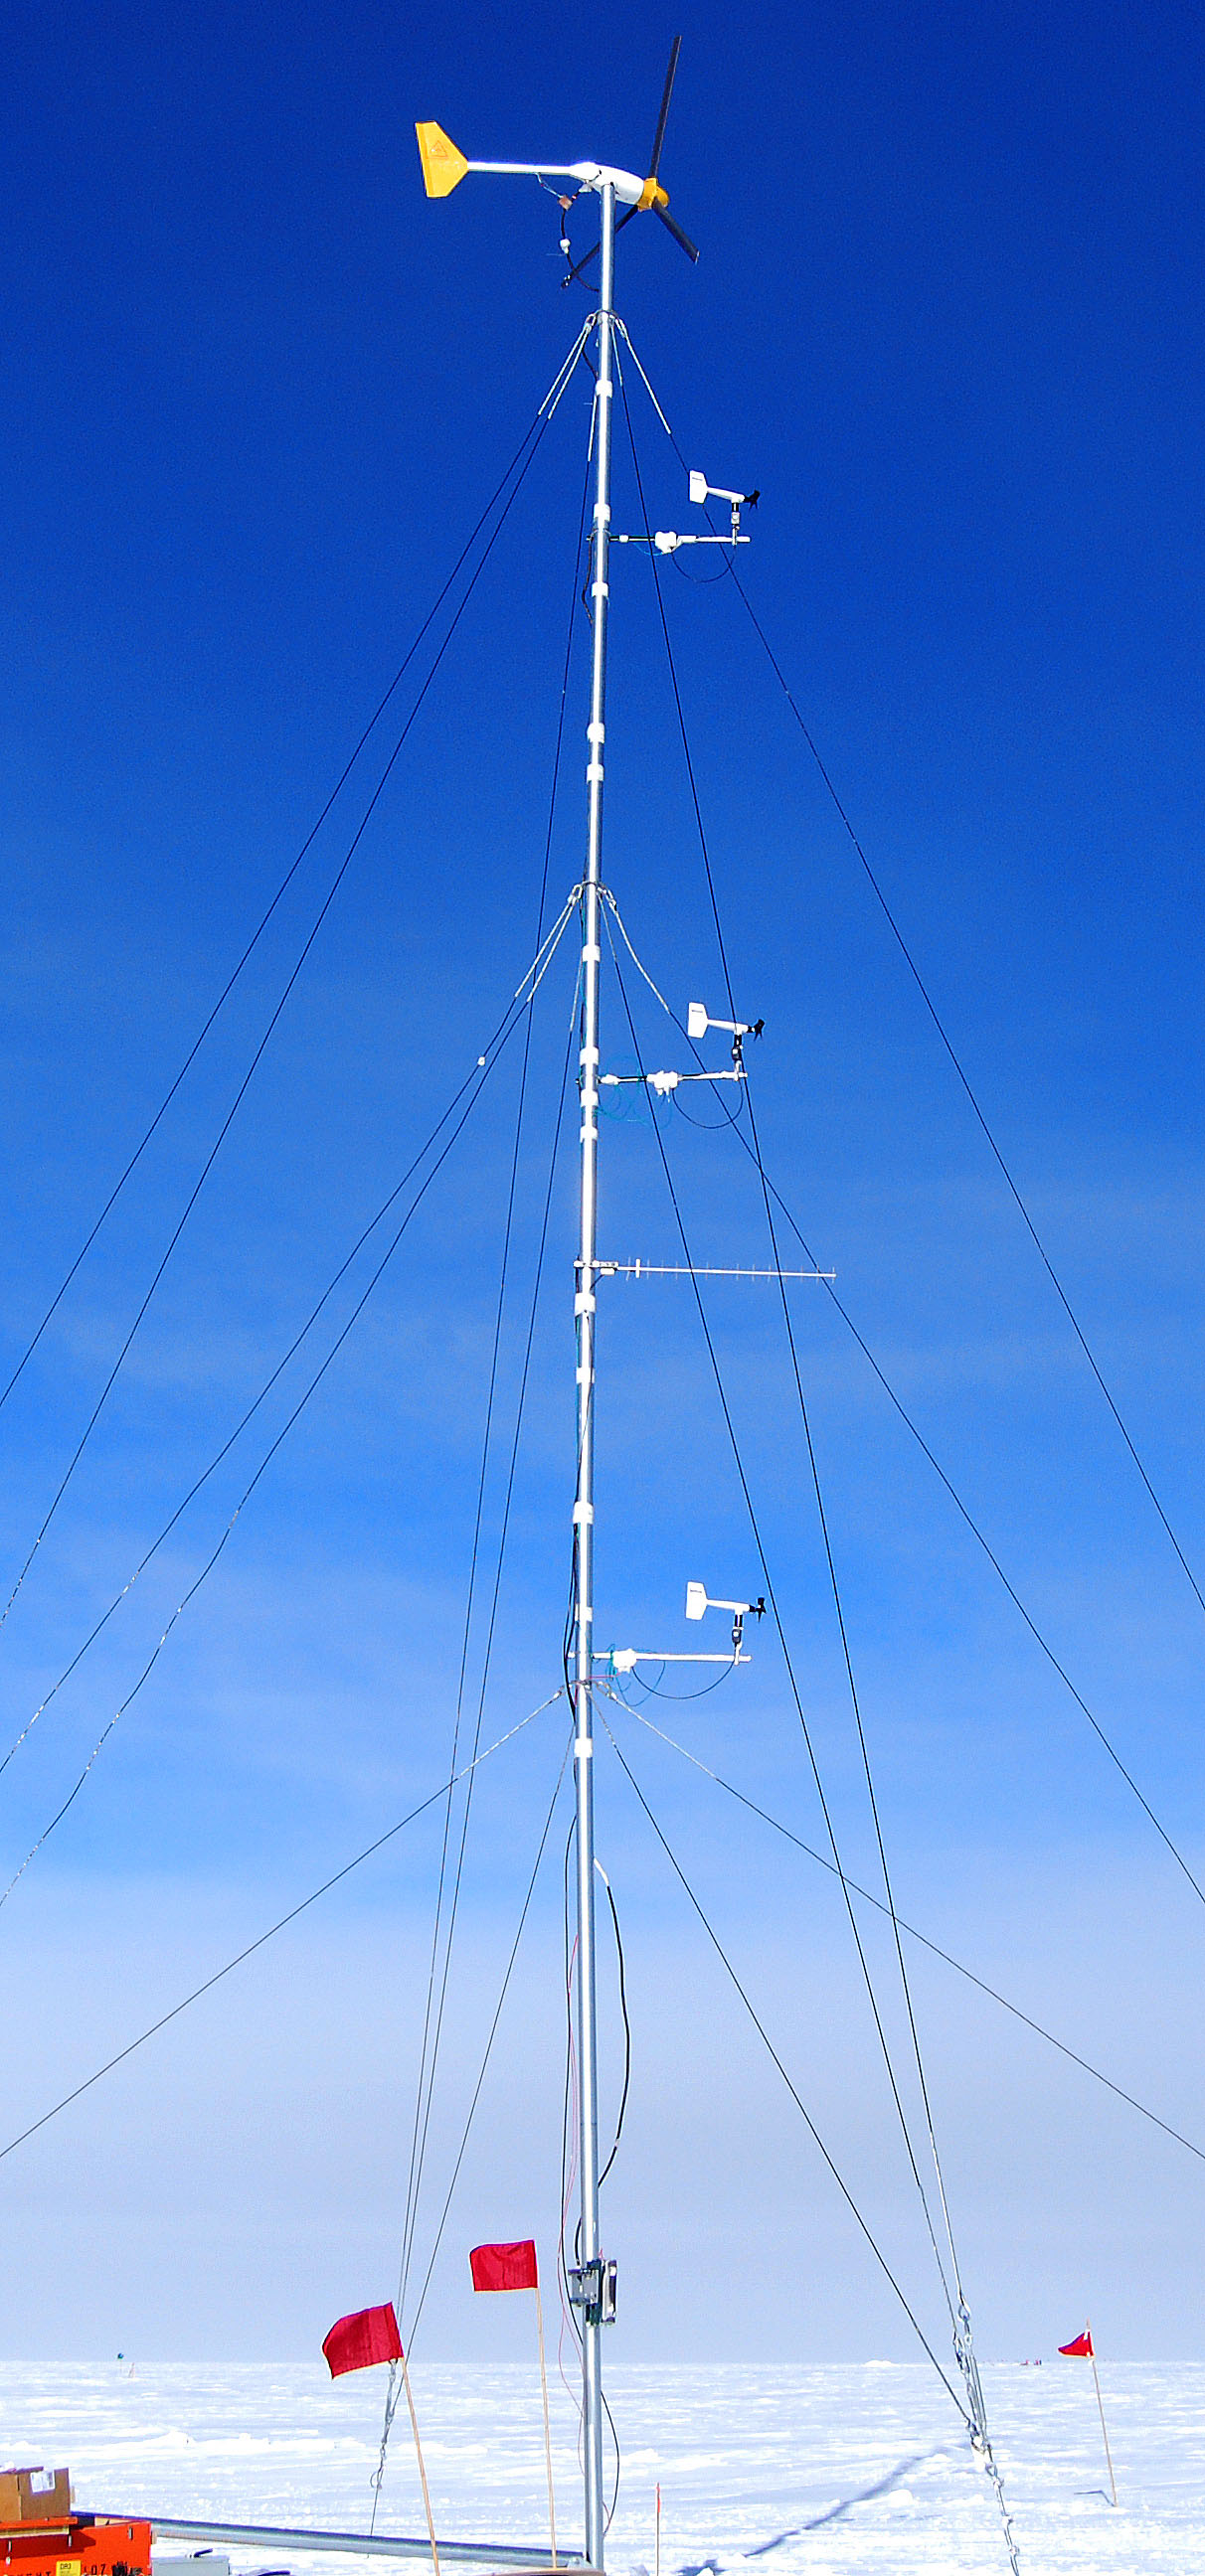
At Site 3, a Bergey XL.1 turbine (Fig. 32) was raised on a 60’ monopole and integral 20’ gin pole using a Pisten Bully. Three sets of four guys were installed and anchored by dead men. In this location only, Kevlar guys are used rather than steel cables to reduce static build-up. A Yagi antenna was mounted on this tower as well.
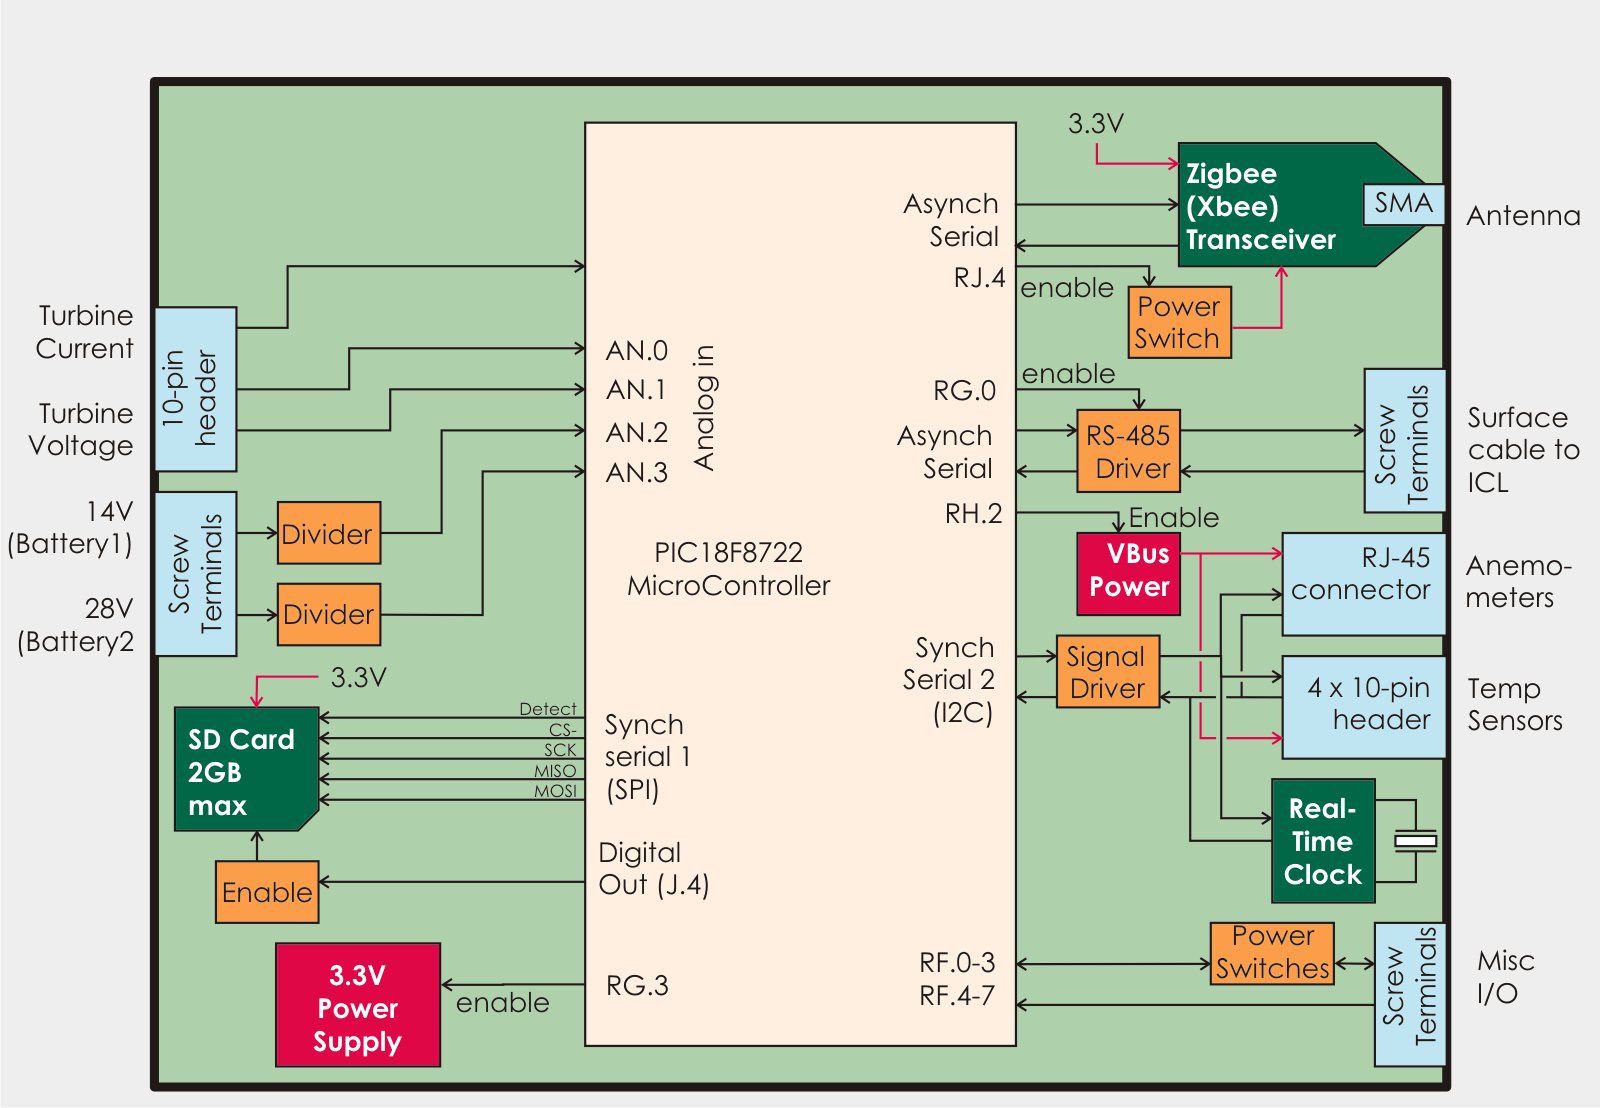
Each turbine was outfitted nearly identically, including the following common characteristics. i) A brake switch and high-power dump resistors are mounted on each tower. ii) An SHM (Fig. 33) is located inside each PIB to collect metrology and power data and store and/or transmit the data. The power is routed to dump resistors inside and outside the box
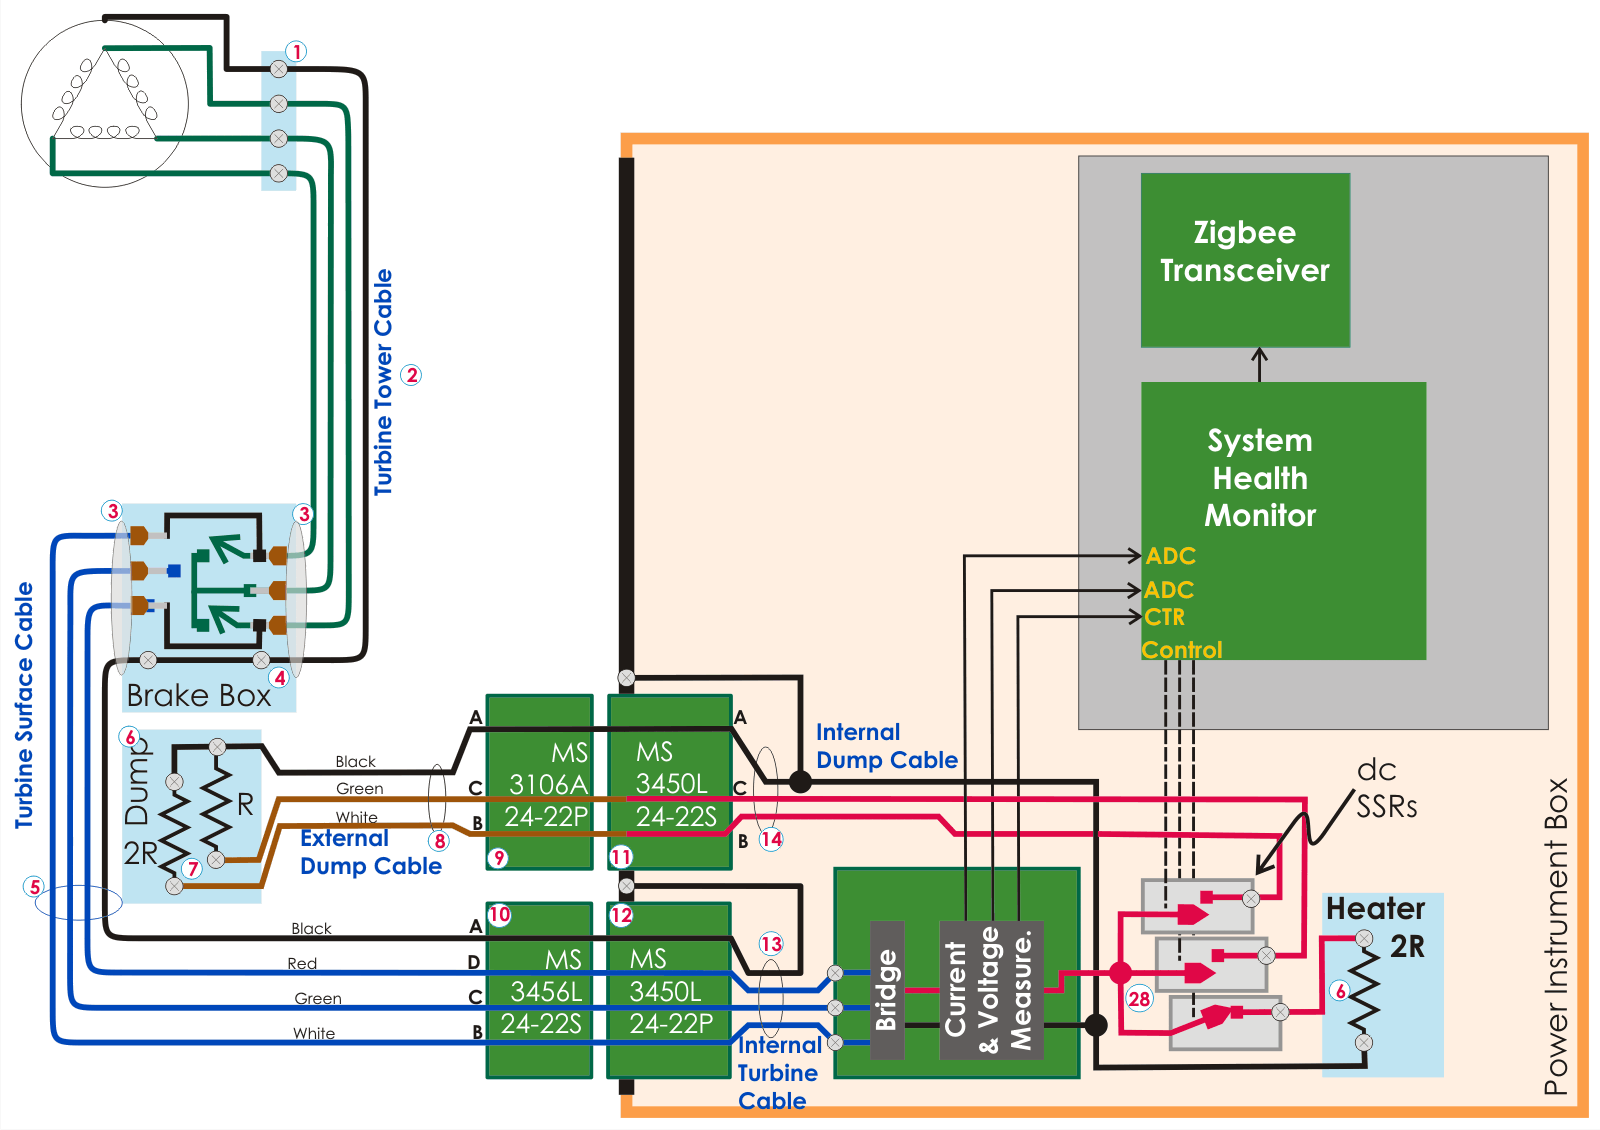
(Fig. 34), controlled by the SHM to maintain a warmed environment inside the PIB. iii) The SHM provides three destinations for the data: a 2GB SD card for local storage, a Zigbee rf link (operated only for short-term testing until approval is obtained), and a hard surface link to the ICL. A Power Board containing a three-phase rectifier and measurement of voltage, current and rotational rate.
A.1 Observations
A.1.1 Power Output
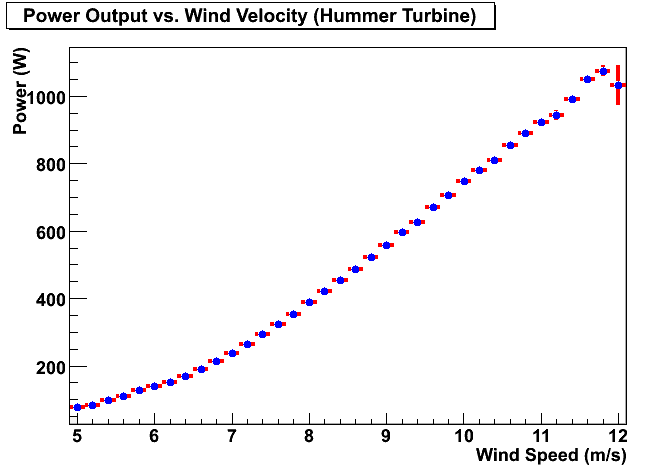
Representative data from one turbine are plotted as a function of wind speed in Fig. 35. Very roughly we see the expected relationship of the cube of the wind speed.
A.1.2 Wind Speed as a function of height
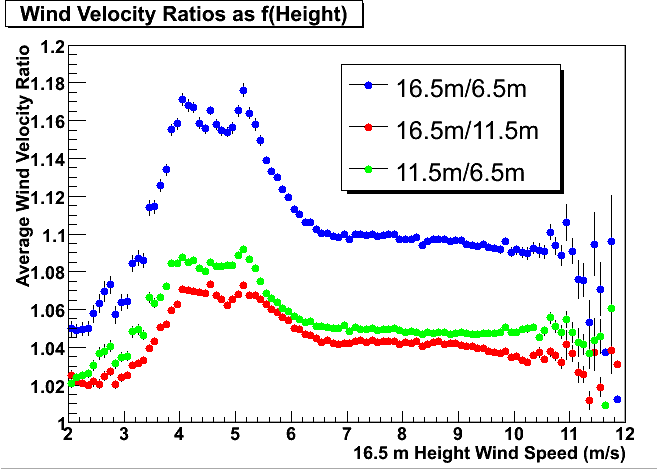
The data collected at three heights on the Bergey tower are shown in Figure 36. It shows the height relationship to be relatively mild, but nevertheless illustrates the benefit of taller towers, especially at lower wind speed.
A.1.3 Modeling Turbine Performance
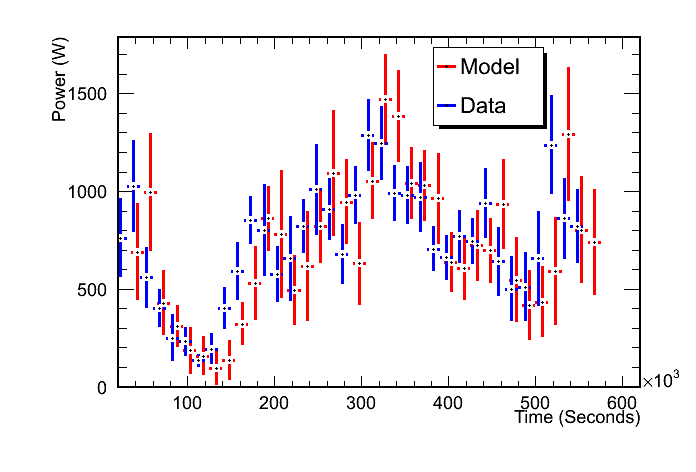
To project the future duty cycle a photovoltaic + wind-based system will offer, a detailed turbine simulation has been developed. This calculation incorporates turbine-specific manufacturers’ data, in addition to our own 2011 measurements of output power vs. wind speed (Fig. 35) and wind velocity profile dependence as a function of above-surface elevation (Fig. 36). For the particularly high-wind conditions at South Pole during the last week of January, 2011, we find agreement between our predicted vs. actual performance at the 5–10% level, as shown in Figure 37. Without the aid of batteries, based on our model, and folding in measured wind speed data from the South Pole over the last half-decade, we expect overall power needs to be satisfied by a photovoltaic+wind-turbine system at least 92% of the time. Buffering power with 48-hour batteries should improve the duty cycle to 97%.
A.1.4 Data Collection
The SHMs have operated reliably, collecting data from the sensors and sending data to the ICL. The array of temperature and metrology sensors is operating reliably. Two of the three custom power sensor boards continue to operate reliably; the one failure may be the Power Board or the cabling and will be investigated during the 2011-12 austral summer. The SD card operation was verified by retrieving the card after several weeks and downloading to a laptop. A simple 4” whip antenna was able to receive low-power Zigbee data at the ICL from all three sites; a mesh network is planned for next season. Data are being received by surface cable using the RS-485 protocol from two sites. Received data are being shipped to the north at regular intervals. The SHM that was deployed consumes over 2 watts, but the design cycle and firmware development now underway are bringing that value down substantially. A custom acquisition and transmission system for the RM Young anemometers also operates at very low power. The multiple anemometers, temperature sensors and planned vibration sensor can be daisy-chained to simplify connection.
A.1.5 Power Instrumentation Box
These were buried in the ice to provide wind protection. Although we have some modest temperature control, we do not yet have sufficient information to determine how much energy is required to maintain the boxes at 0C. Structurally the PIBs worked well with the proviso that the cable penetrations need modification to facilitate access.
A.1.6 Electrical noise from AARP sites
As mentioned elsewhere in this document, attempts to “see” noise from the turbine sites with the test bed have been negative.
References
- (1) G. A. Askaryan, JETP 14, 441 (1962); JETP 21, 658 (1965).
- (2) I. Kravchenko, C. Cooley, S. Hussain, D. Seckel, P. Wahrlich, J. Adams, S. Churchwell, P. Harris, S. Seunarine, A. Bean, D. Besson, S. Graham, S. Holt, D. Marfatia, D. McKay, J. Meyers, J. Ralston, R. Schiel, H. Swift, J. Ledford, K. Ratzlaff, Phys. Rev. D 73, 082002 (2006).
- (3) P. Gorham et al. [the ANITA collaboration] “Observational Constraints on the Ultra-high Energy Cosmic Neutrino Flux from the Second Flight of the ANITA Experiment,” Phys. Rev. D82, 022004 (2010).
- (4) ANITA Collab.: P. W. Gorham et al., Phys. Rev. Lett. 103, 051103 (2009).
- (5) ANITA Collab.: P. W. Gorham et al., Astropart. Phys. 32, 10 (2009).
- (6) G. A. Gusev, I. M. Zheleznykh, “On the possibility of detection of neutrinos and muons on the basis of radio radiation of cascades in natural dielectric media (antarctic ice sheet and so forth),” SOV PHYS USPEKHI, 1984, 27 (7), 550-552.
- (7) P. Chen and K. Hoffman (editors for interested physicists from the IceCube and ANITA Collaborations), ”Origin and evolution of cosmic accelerators - the unique discovery potential of an UHE neutrino telescope: Astronomy Decadal Survey (2010-2020) Science White Paper”, arXiv:0902.3288.
- (8) K. Greisen, Phys. Rev. Lett. 16, 748 (1966);
- (9) G. T. Zatsepin, V. A. Kuzmin, JETP Lett. 4, 78 (1966).
- (10) V. S. Beresinsky, G. T. Zatsepin, Phys. Lett. B 28, 423 (1969).
- (11) J. W. Goodman, Statistical Opics, (Wiley:New York) 1985.
- (12) G.S. Varner, L.L. Ruckman, R.J. Nichol, J. Nam, J. Cao, M. Wilcox and P. Gorham, “Large Analog Bandwidth Recorder and Digitizer with Ordered Readout (LABRADOR) ASIC,” Nucl. Instr. Meth. A483 (2007) 447-460.
- (13) D. Besson, et al. Astropart. Phys. 29, 130-157,(2008).
- (14) D. Besson, R. Keast and R. Velasco, Astroparticle Physics 31, (2009) 348.
- (15) I. Kravchenkoa, D. Besson, A. Ramos, and J. Remmers, Astroparticle Physics 34 (2011) 755.
- (16) S. Barwick, D. Besson, P. Gorham, D. Saltzberg, J. Glaciol. 51, 231 (2005).
- (17) S. Hoover, J. Nam, P. Gorham,et al. [ANITA Collaboration], “Observation of Ultra-high-energy Cosmic Rays with the ANITA Balloon-borne Radio Interferometer,” Phys. Rev. Lett. 105, 151101 (2010).
- (18) Green Bank Solar Radio Burst Spectrometer: http://gbsrbs.nrao.edu/Html/2011/02/20110213_lo.html
- (19) J. D. Kraus, Antennas, 2nd edition (McGraw-Hill: Boston) 1988.
- (20) H. Landsman et al., Nuclear Instruments and Methods in Physics Research Section A, Volume 604, Issue 1-2, p. S70-S75.
- (21) P. W. Gorham, C. L. Hebert, K. M. Liewer, C. J. Naudet, D. Saltzberg, D. Williams, Phys. Rev. Lett. 93 (2004) 041101.
- (22) ANITA Collab.: P. W. Gorham et al., Phys. Rev. Lett. 99, 171101 (2007).
- (23) P. Allison, J. Beatty, P. Chen, A. Connolly, M. DuVernois, P. Gorham, F. Halzen, K. Hanson, K. Hoffman, A. Karle, J. L. Kelley, H. Landsman, J. Learned, C. Miki, R. Morse, R. Nichol, C. Rott, L. Ruckman, D. Seckel, G. Varner, D. Williams, Nucl. Instrum. Meth. Suppl. A604: 64-69, (2009).
- (24) J. Alvarez-Muniz, E. Zas, Phys. Lett. B 411, 218 (1997).
- (25) D. Saltzberg et al., Phys. Rev. Lett., 86, 2802 (2001).
- (26) N. Lehtinen et al., Phys. Rev. D 69, 013008 (2004).
- (27) R. J. Protheroe, P. A. Johnson, Astropart. Phys. 4, 253 (1996).
- (28) R. Engel, D. Seckel, T. Stanev, Phys. Rev. D 64, 093010 (2001).
- (29) Kumiko Kotera, Denis Allard, Angela V. Olinto, “Cosmogenic Neutrinos: parameter space and detectabilty from PeV to ZeV,” Journ. Cosm. Part. Astrophys. 1010:013, (2010); arXiv:1009.1382.
- (30) O. E. Kalashev et al., Phys. Rev. D 66, 063004 (2002).
- (31) O. E. Kalashev et al., Phys. Rev. D 65, 103003 (2002).
- (32) V. Barger, P. Huber, D. Marfatia, Phys. Lett. B 642, 333 (2006).
- (33) H. Yuksel, M. D. Kistler, Phys. Rev. D 75, 083004 (2007).
- (34) M. Ave et al., Astropart. Phys. 23, 19 (2005).
- (35) T. Stanev, Nucl. Instrum. Meth. A588: 215-220, (2008).
- (36) M. Ahlers, L.A. Anchordoqui, M.C. Gonzalez-Garcia, F. Halzen, Subir Sarkar, “GZK Neutrinos after the Fermi-LAT Diffuse Photon Flux Measurement,” Astropart. Phys. 34 (2010) 106-115; arXiv:1005.2620.
- (37) E. Waxman, J. Bahcall, Phys. Rev. D 59, 023002 (1999).
- (38) Pierre Auger Collab.: J. Abraham et al., Phys. Rev. Lett. 100, 211101 (2008).
- (39) HiRes Collab.: R. U. Abbassi et al., Ap. J. 684, 790 (2008).
- (40) Nikolai G. Lehtinen, Peter W. Gorham, Abram R. Jacobson, Robert A. Roussel-Dupre, “FORTE satellite constraints on ultra-high energy cosmic particle fluxes,” Phys. Rev. D69 (2004) 013008; arXiv:astro-ph/0309656v2.
- (41) J. Alvarez–Muñiz & E. Zas, 1997, Phys. Lett. B, 411, 218.
- (42) E. Zas, F. Halzen, & T. Stanev, 1992, Phys Rev D 45, 362.
- (43) C. Aramo, et al., Astropart. Phys. 23, 65 (2005).