Protoplanetary Disk Masses in IC348: A Rapid Decline in the Population of Small Dust Grains After 1 Myr
Abstract
We present a 1.3 mm continuum survey of protoplanetary disks in the 2–3 Myr old cluster, IC348, with the Submillimeter Array. We observed 85 young stellar objects and detected 10 with 1.3 mm fluxes greater than 2 mJy. The brightest source is a young embedded protostar driving a molecular outflow. The other 9 detections are dusty disks around optically visible stars. Our millimeter flux measurements translate into total disk masses ranging from 2 to 6 Jupiter masses. Each detected disk has strong mid-infrared emission in excess of the stellar photosphere and has H equivalent widths larger than the average in the cluster and indicative of ongoing gas accretion. The disk mass distribution, however, is shifted by about a factor of 20 to lower masses, compared to that in the Myr old Taurus and Ophiuchus regions. These observations reveal the rapid decline in the number of small dust grains in disks with time, and probably their concomitant growth beyond millimeter sizes. Moreover, if IC348 is to form planets in the same proportion as detected in the field, these faint millimeter detections may represent the best candidates in the cluster to study the progression from planetesimals to planets.
Subject headings:
stars: formation – stars: pre-main sequence – circumstellar matter – protoplanetary disks1. Introduction
Dusty disks persist around most low mass stars for a Myr or more, much longer than the lifetime of the natal molecular core. At the stage where the core is dispersed, the now optically visible central star has nearly achieved its final mass and the disk is no longer protostellar, but it may still be protoplanetary. In the literature of young stellar objects (YSOs), this corresponds to physical stage II (Robitaille et al., 2006) and observational Class II (Lada, 1987).
The presence of protoplanetary disks is most readily inferred via optically thick infrared emission from the warm dust close to the star. The capacity of a disk to actually form planets, however, requires knowledge of its surface density (or at least mass) which necessitates observations at millimeter wavelengths where the thermal dust emission is optically thin and all radii contribute (Williams & Cieza, 2011).
Compared to infrared observations, there are relatively few millimeter surveys of YSOs on account of the rapid decline of dust emission with wavelength. The pioneering work of Beckwith et al. (1990) showed that many protoplanetary disks in Taurus had masses comparable to or in excess of the minimum mass solar nebula (MMSN; ). This result was confirmed and extended to the similarly close Ophiuchus star forming region by Andre & Montmerle (1994). Improvements in detector technology led to a significantly increased sensitivity and the ability to detect disks with masses (Andrews & Williams, 2005). The high resolution afforded by interferometry can distinguish the millimeter emission from individual disks in the crowded environs of the more distant Orion Trapezium Cluster where Williams et al. (2005) and Eisner & Carpenter (2006) found several disks with the capacity to form a solar system. In a more comprehensive survey, Mann & Williams (2009) showed that the Trapezium Cluster disk mass distribution is similar to Taurus and Ophiuchus but truncated at the high mass end, , due to photoevaporation by the O6 star, Ori C.
The Taurus, Ophiuchus, and Orion star forming environments are all quite young, with typical YSO ages Myr. A key question is how does the disk mass evolve with time. A handful of older, massive disks exist (e.g., TW Hydrae, Wilner et al., 2000) but the survey of 3 Myr to 3 Gyr stars by Carpenter et al. (2005) show that such objects are very rare. This study of IC348 is motivated by the desire to quantify the decline in disk masses after 1 Myr.
IC348 is located at the edge of the Perseus molecular cloud and has been well studied at optical to infrared wavelengths. It contains 283 spectroscopically confirmed members in a relatively compact () region (Luhman et al., 1998) with a mean age estimated to lie between 2 and 3 Myr (Herbig, 1998). About half of the YSOs in IC348 show mid-infrared emission in excess of the stellar photosphere (Lada et al., 2006), which is consistent with the median disk lifetime derived from the statistics of many clusters (Hernández et al., 2007).
Carpenter (2002) mapped the central region of IC348 containing 95 YSOs at 3 mm with the OVRO interferometer but did not find any significant detections at a sensitivity of . By selecting specific fields centered on concentrations of known YSOs, rather than a contiguous mosaic, and by observing at the significantly shorter wavelength of 1.3 mm, we are able to achieve an order of magnitude higher mass sensitivity than Carpenter (2002) and make the first mass measurements of protoplanetary disks in this region. We describe the observing strategy in §2 and the results in §3. We analyze the properties of the detected sources and compare the distribution of disk masses with the younger Taurus, Ophiuchus, and Orion regions in §4, then discuss the implications of this work for disk evolution and planet formation in §5. We summarize our findings in §6.
2. Observations
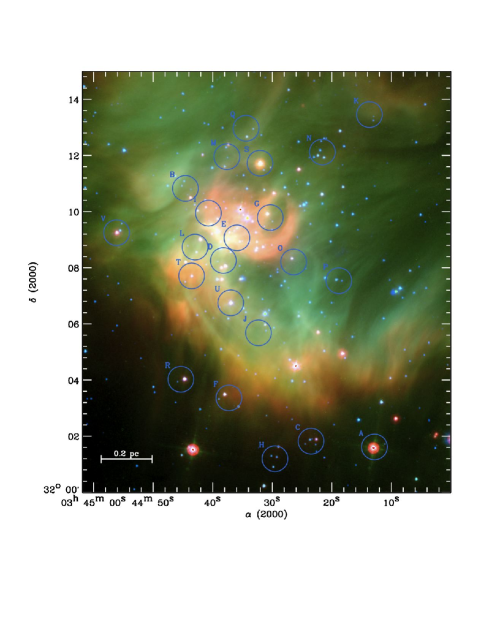
We observed 22 fields containing 85 YSOs in IC348 with the Submillimeter Array (SMA) in its compact configuration over 11 nights from October 2009 through December 2010. The field locations were chosen to maximize the total number of YSOs in the survey while avoiding localized regions of cloud emission determined from m SCUBA maps (Hatchell et al., 2005). The observed fields are overlaid on a three-color infrared image of the region created from the Spitzer Heritage Archive111http://archive.spitzer.caltech.edu/ in Figure 1.
Observations were generally carried out in average Mauna Kea weather with precipitable water vapor levels ranging from 1.5 to 3 mm. IC348 transits nearly overhead in the sky providing long observational tracks and low median system temperatures, K. Typically observations of 3 fields were interleaved with each other on a single track so that the total time per field was 2–2.5 hours, resulting in an rms noise ranging from 0.4 to 0.9 mJy with median 0.6 mJy. The field centers, dates of observation, and rms noise are tabulated in Table 1.
The receivers were tuned to place the 230.538 GHz (1.3 mm) line of CO in the upper sideband and the same transition of the isotopologues, 13CO, and C18O in the lower sideband. The line-free regions provided nearly 4 GHz of bandwidth for continuum measurements.
Together with the observations of IC348, calibration measurements were made through observations of 3C454.3, 3C279, or 3C273 for bandpass, J0336+323 and 3C84 for amplitude and phase, and Uranus and Titan for the absolute flux scale. The data were calibrated using standard procedures in the MIR software package222http://cfa-www.harvard.edu/$∼$cqi/mircook.html. The rms amplitude and phase noise in the calibrated data were % and respectively. The calibrated visibilities were then exported into MIRIAD333http://www.cfa.harvard.edu/sma/miriad/ for imaging and analysis. As protoplanetary disks are too small to be resolved in these compact configuration data, the images were produced using natural weighting to produce the highest signal-to-noise and an approximately circular synthesized beam beam. The flux density or upper limit toward each YSO was determined by fitting a point source with the appropriate phase offset in the visibility plane.
3. Results
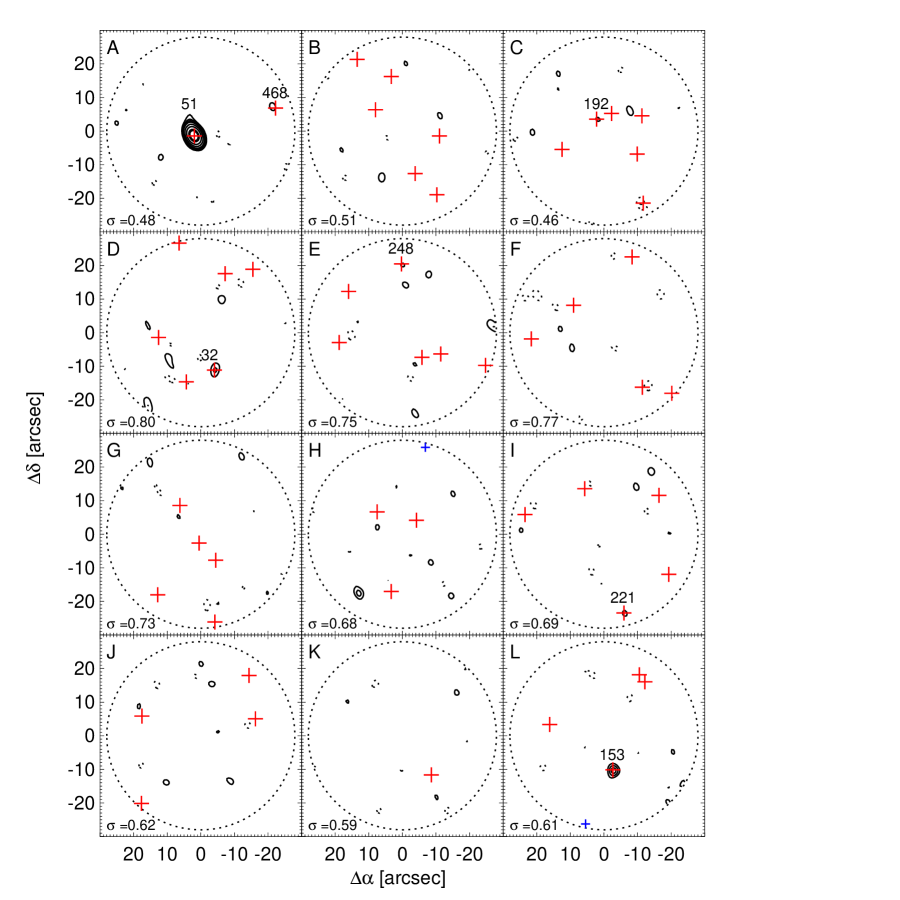
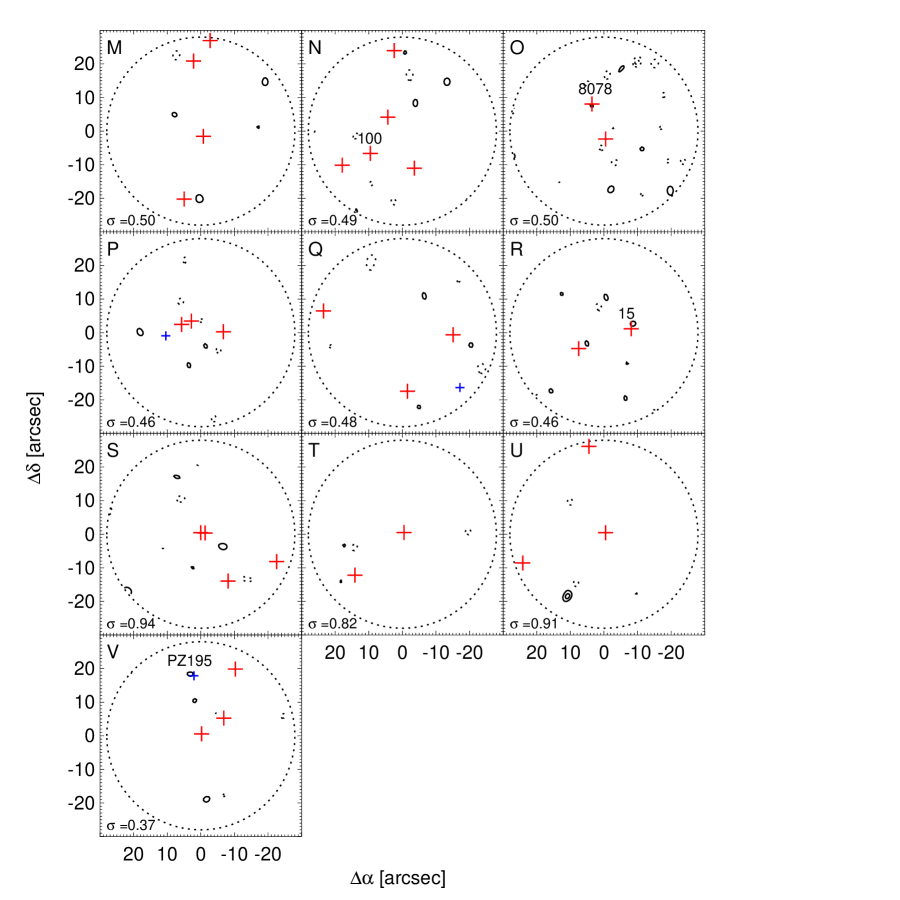
Contour maps of the 1.3 mm emission toward each of the 22 observed fields are in the (online) Figures 2a [Online-only], 2b. These fields contain a total of 85 YSOs from the Luhman et al. (2003) compilation, all of which were detected with Spitzer in multiple bands and tabulated by Lada et al. (2006). We detect 10 of these YSOs with a signal-to-noise ratio greater than 3. These are labeled in the figures with the identification number from Table 1 of Lada et al. (2006) for ease of reference to the mid-infrared fluxes later.
There are also a small number of possibly significant emission peaks that do not correspond to the position of a known YSO that may be due to fluctuations in the background cloud emission or sidelobes from strong emission outside of the primary beam (Hatchell et al., 2005). Strong CO and, in many cases, isotopologue emission is also found but the images do not show clear evidence for point source emission toward the YSOs and we are unable to constrain the gas content of the disks. Cloud contamination is much more severe in the line observations, possibly due to the emission being optically thick and perhaps more spatially variable than the continuum. A similar situation was found in the Trapezium Cluster (Mann & Williams, 2010).
The strongest source, by far, is a core that is apparent as an isolated point source in the SCUBA map of Hatchell et al. (2005). This is clearly a less evolved, protostellar source and we describe it briefly in the following subssection for completeness. As the emission in this source is dominated by the protostellar envelope, we do not include it in the discussion and analysis of the protoplanetary disks thereafter.
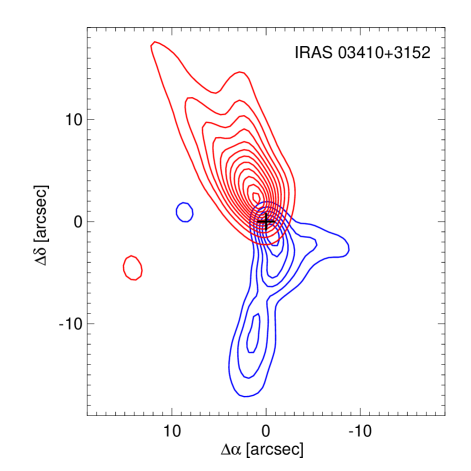
3.1. The Class I Protostar, IRAS 03410+3152
This bright object was chosen to lie in the first field as a simple test of the observational setup. It is a well known Class I YSO, cataloged as IRAS 03410+3152, source 51 in Lada et al. (2006), source 101 in Hatchell et al. (2005), and source 29 in the Chandra X-ray study of the cluster by Preibisch & Zinnecker (2002). It has a bolometric temperature of 463 K and luminosity of . Walawender et al. (2006) also detect several shocks on either side of the star.
We detect both strong continuum and line emission toward IRAS 03410+3152. The continuum is a point source at the resolution of our data (Figure 2a [Online-only]) but the CO 2–1 emission shows prominent red-blue outflow lobes with a moderate opening angle (Figure 3) characteristic of Class I sources (Arce & Sargent, 2006).
IC348 abuts an active star forming region in the Perseus cloud. IRAS 03410+3152 belongs to this younger population but the SMA field contained a second source (Lada source ID 468) that is a bona-fide Class II YSO. Our detection of this object in the same field provides a graphic illustration of the tremendous difference in the millimeter flux from a envelope-dominated to disk-dominated YSO. The rest of this paper concerns the nature of the latter objects.
3.2. Protoplanetary Disk Masses
Nine of the remaining 84 YSOs in the 22 SMA fields were detected with 1.3 mm fluxes ranging from 2 to 6.5 mJy. The limits on the fluxes of the 75 non-detections were typically less than 2 mJy. We stacked the emission of these non-detections to constrain their average properties. There was no clear detection in the stacked map with a limit to the average flux of 0.3 mJy.
As the millimeter emission is optically thin, it provides a direct measure of the dust mass. We convert fluxes to total disks masses through the simple formula,
where the dust opacity, , follows the commonly used prescription from Beckwith et al. (1990) and implicitly assumes an ISM gas-to-dust ratio of 100. We use a distance pc based on Herbig (1998). Although the dust in the disks lies over a range of radii and therefore temperatures, the Planck function, , is calculated at a a single temperature 20 K based on the modeling by Andrews & Williams (2005) who showed this provides an excellent fit to detailed modeling of the infrared-millimeter spectral energy distribution (SED).
The vernacular of disk mass, as derived in this way, is standard in the literature but is really a shorthand for a procedure that has much more validity in the interstellar, as opposed to circumstellar, medium. It is important to keep in mind that we are really only estimating the mass of micron to millimeter sized particles and then extrapolating the gas content by multiplying by two orders of magnitude!
The inferred disk masses vary between 2 and . Their properties are tabulated in Table 2. The survey is 100% complete for disk masses . The limit on the stacking of the non-detections implies that the average mass of the non-detections, .
The nine detections, although only a small fraction of the entire sample, provide the first disk mass measurements in IC348. They provide important constraints on the disk evolution at 2–3 Myr with commensurate implications for understanding planet formation. We place these measurements in context with disk masses in younger star forming regions below after first comparing the properties of the detected and non-detected sources.
4. Analysis
4.1. Comparison of Detected and Non-detected Sources
Figure 4 plots the SED of the nine detected sources. The mid-infrared fluxes in Spitzer IRAC bands 1–4 (m) and MIPS band 1 (m) are from Lada et al. (2006). Optical and near-infrared flux densities in the , , , , and -bands were obtained by cross-referencing the source positions in Lada et al. (2006) with tables published by Cieza et al. (2007) and Luhman et al. (2003). We estimate the extinction, , as in Cieza et al. (2007) where the intrinsic stellar colors, , are from Kenyon & Hartmann (1995) for the spectral types as determined by Luhman et al. (2003). The infrared SEDs are similar, but marginally lower in a handful of cases, than the median SED of classical T-Tauri stars (CTTS) out to m, which is over-plotted in each panel.
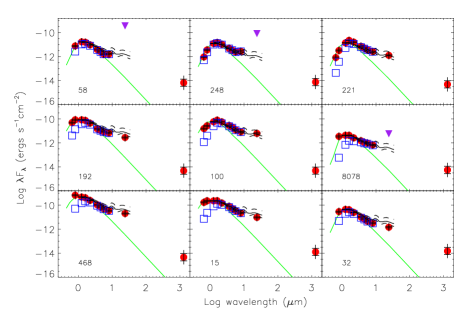
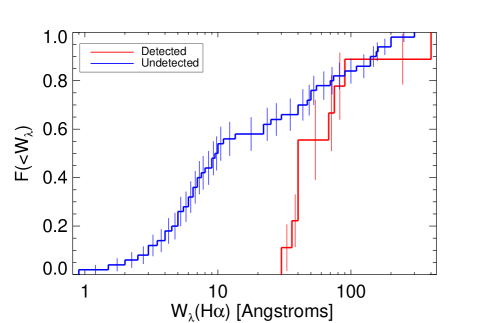
Many of the millimeter non-detections have quite similar infrared SEDs as the millimeter detections in Figure 4. However, there is a statistical difference in the accretion properties of the two samples. Figure 5 plots the cumulative distribution of the H equivalent widths, , for 60 of the 84 disks in our survey from Luhman et al. (2003). All nine disks detected at 1.3 mm have large , indicative of high accretion, but most of the non-detections have much lower values. About two-thirds of the non-detections with measurements have equivalent widths less than the minimum of the detected disks. Based on the spectral type dependent cutoff defined by White & Basri (2003), most of the sources that are not detected in our SMA survey are weak-lined T-Tauri stars (WTTS). However, we only detect 9 out of the 25 identified CTTS. The sensitivity limitations of our survey prevent us from drawing any strong conclusions, but the general correspondence between the millimeter detections and high suggests that the gas and dust depletion timescales are not greatly dissimilar.
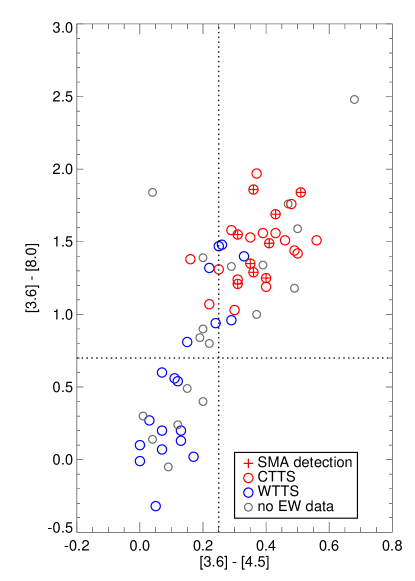
The situation is encapsulated in the IRAC color-color plot in Figure 6 where different symbols represent CTTS, WTTS and SMA detections. The vertical and horizontal dotted lines show the boundaries used by Cieza et al. (2007) to distinguish between YSOs with colors consistent with a stellar photosphere (lower left corner), transition disks with excess infrared emission only apparent at wavelengths greater than m, and “full” disks with excesses at and m. All the CTTSs in our sample display excess emission at m, and the nine disks detected by the SMA exhibit excess emission at both m and m. However, most disks with an infrared excess were not detected in our millimeter survey and there is no correlation between disk mass and the amount of infrared excess. We stacked the SMA emission from all of the stars with infrared excesses that were not individually detected with the SMA, but did not find a significant detection.
There are 45 Chandra X-ray sources within our survey (Preibisch & Zinnecker, 2002). 40 of these are coincident with known cluster members from Luhman et al. (2003) and are active YSOs. 5 were detected with the SMA (including IRAS 03410+3152) but we do not see any clear trend between the millimeter properties of the X-ray detected and undetected sources. The other 5 Chandra sources have no optical or infrared counterpart to a level that rules out highly extincted substellar objects. These are indicated by blue crosses in Figures 2a [Online-only],2b and, as Preibisch & Zinnecker (2002) concluded, are most likely extragalactic contaminants. Interestingly, we detect one of these, source 195 in field V (the lowest noise map in our survey), with a flux mJy.
Most YSOs in IC348 are between 2 and 3 Myr old but there is likely to be a significant dispersion. A simple explanation of our results would be that the detected disks are younger than the non-detections. In principle, protostellar ages and masses can be inferred by comparing their luminosity and effective temperature against model isochrones of pre-main-sequence tracks but, in practice, the associated errors are large. Using the model isochrones of D’Antona & Mazzitelli (1997), we do not find any significant difference in the estimated ages of the millimeter detected and non-detected YSOs. This is not too surprising given previous failed searches for differences between CTTS and WTTS in individual clusters (Gomez et al., 1992) which show that age is not the sole determinant of disk evolution.
Protoplanetary disk masses are also known to scale with stellar mass (Williams & Cieza, 2011). The inferred stellar masses of the detected disks are all sub-solar but range widely from 0.02 to . In this small sample, there is no evidence for a dependency on stellar mass but the detection of a disk around source 468, a M8.25 brown dwarf, is noteworthy.
4.2. Comparison with Taurus, Ophiuchus, and Orion
Based on the lack of detections of relatively massive disks, Carpenter (2002) concluded that disks in IC348 have significantly lower masses than those in Taurus. The high sensitivity of this SMA survey has allowed us to make the first mass measurements of IC348 disks and the results provide an important benchmark for tracking disk evolution at timescales comparable to their statistical half-life. Due to the large number of non-detections and because the sensitivity of the observations varied from field to field, we plot the cumulative disk mass distribution, , in Figure 7 using the Kaplan-Meier product limit estimator (Feigelson & Nelson, 1985). Similarly defined distributions are plotted for the (sub-)millimeter derived disk mass measurements in Taurus (Andrews & Williams, 2005), Ophiuchus (Andrews & Williams, 2007), and Orion (Mann & Williams, 2010).
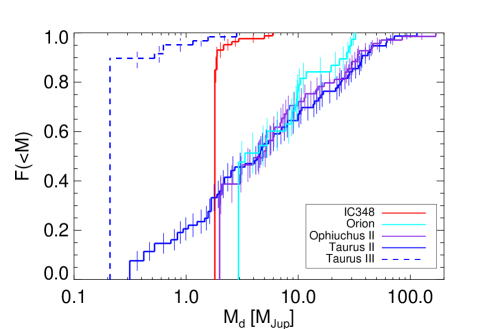
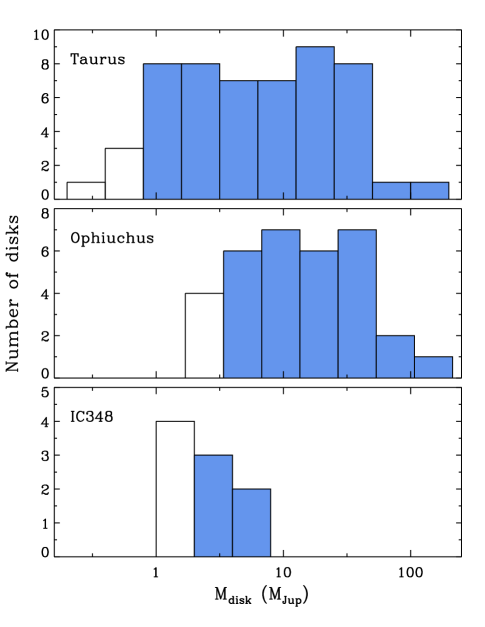
As noted by Andrews & Williams (2007), the Taurus and Ophiuchus distributions are remarkably similar. Because of the greater distance to Orion, the completeness limit is higher but also shows a similar distribution between with a decline at higher masses due to photoevaporation (Mann & Williams, 2010). A more conventional, binned distribution of the Taurus, Ophiuchus and IC348 disk masses is plotted in Figure 8.
The disk mass distribution in IC348 is obviously very different from these three younger star-forming regions. Our inferred masses, which are the high mass tail of the full distribution, are comparable to the median mass in the other regions. Or, to put it another way, more than 60% of Taurus and Ophiuchus disks, but less than 10% of IC348 disks, have masses greater than . Further, although the number of detected disks is small, there is no sharp falloff at the high mass end of the IC348 distribution as in Orion. Rather, the IC348 disk mass distribution seems to be systematically shifted down by about a factor of 20 relative to Taurus and Ophiuchus,
The comparison here is of Class II YSOs, or optically visible stars with infrared excesses and signatures of accretion but no envelope material. A handful of Class III YSOs (no infrared excess or accretion) were detected in the sensitive Taurus survey by Andrews & Williams (2005) and their distribution is plotted as the dashed line in Figure 7. The 2–3 Myr IC348 Class II disks are more massive than the Myr Taurus Class III sources. We conclude that we are witnessing the tail end of the Class II phase, just before accretion ends and the disk disappears.
Luhman et al. (2003) find that the distribution of stellar masses peaks at lower masses in IC348 compared to Taurus. The difference between the stellar mass functions is most pronounced above . Almost all the stars used for the disk mass function comparison here are spectral types K and M and have sub-solar masses. We also compared the disk mass distribution for M stars only and find, with statistically less precision, the same large difference. The dramatically lower disk masses in IC348 are not due to differences in stellar mass.
Because of the steps involved in determining masses from millimeter fluxes, there may be systematic effects in the comparisons between different regions. In each case, however, the masses were determined assuming the same characteristic dust temperature of 20 K, the same Beckwith et al. (1990) dust opacity, , and the same gas-to-dust ratio of 100. The average dust temperature and frequency dependence of dust opacity can be checked with SED modeling and are likely to be reasonably accurate. Cloud confusion prevents us from making an unambiguous CO measurement of gas in the disks but using the same gas-to-dust ratio for all regions allows the simplest comparison. Taking this factor out, we can state with more certainty that there is a reduction of about a factor of 20 in the amount of millimeter and smaller sized dust grains in the IC348 disks compared to the younger regions and, presumably, this is due to the additional Myr of evolution.
5. Discussion
Sensitive infrared surveys of many clusters of different ages have firmly established the trend of decreasing disk fraction with age and a median disk lifetime around low mass stars of Myr (Hernández et al., 2007). The fraction of accreting systems declines on a similar, though possibly slightly shorter timescale (Fedele et al., 2010). IC348 disks are old enough that we expect many to be fully depleted of both dust and gas but we have been able to quantify the amount of dust in a few of the sources with infrared excesses and found that they are all active accretors with H equivalent widths greater than the cluster average.
There is a wide diversity of disk SEDs in IC348 (Lada et al., 2006; Currie & Kenyon, 2009). Based on Spitzer IRAC and MIPS data, they consider three categorizations: (1) anemic disks with excess emission above the stellar photosphere in all IRAC bands (m) but at levels significantly below the median disk SED in Taurus; (2) transition disks or disks with inner holes that have a mid-infrared dip in their SED, with strong excess emission only at m; (3) primordial or “full” disks that show excess emission at all bands at levels similar to the median disk SED in Taurus. At our survey detection threshold of about 2 mJy, corresponding to under the assumptions in §3.2, we only detected a handful of primordial disks. The others, including most primordial disks and all anemic and transition disks, have very low masses.
Lada et al. (2006) suggested that the low infrared excesses in anemic disks are due to a flattened geometry arising from dust settling. Our observations show that there is a paucity of millimeter-sized dust grains, however, and the disk has not just settled but has largely depleted. Similarly the low masses of the transition disks reveals that, in general, the inner disk only dissipates after the outer disk is largely depleted. Cieza et al. (2008) came to the same conclusion based on their low limits to the disk masses of WTTS. This is consistent with photoevaporative models of disk evolution whereby the outer disk feeds the inner disk until the viscous accretion rate drops below the photoevaporation rate from the central star. Our low disk mass upper limits suggest that the photoevaporation rate is low, consistent with FUV radiation (Williams & Cieza, 2011, and references therein). In fact, the disks that we have detected are the least evolved, in the sense that they exhibit strong infrared excesses at all wavelengths and H emission indicative of gas accretion. Yet we only detect about one third of such CTTS and their masses are all substantially below the canonical MMSN.
Assuming that the giant planet frequency in IC348 is to match that measured in the field, the absence of MMSN disks implies that planet formation is either complete or has progressed substantially. However, the possibility that giant planets have already formed is hard to reconcile with core accretion models (Pollack et al., 1996; Hubickyj et al., 2005). The formation of Jupiter and, especially, Saturn () mass planets requires several Myr, significantly longer than the median YSO age in IC348.
On the one hand, our results may be considered a point in favor of very rapid giant planet formation through gravitational instability (Boss, 1997). On the other hand, if planets form over several Myr through core accretion, this process must have progressed to the point where most of the solid material is in large bodies and beyond our ability to detect directly (Greaves & Rice, 2010). At our observing wavelength, mm, the survey is effectively blind to particles with sizes mm (Draine, 2006). For a constant dust mass, and a grain size distribution, , the millimeter emission drops by our measured factor of 20 once the maximum grain size reaches about a meter, as verified in the detailed models of D’Alessio et al. (2001).
We suggest that the primordial disks with millimeter emission in IC348 may be excellent candidates for studying the progression from planetesimals to planets. These are the most massive disks in the young cluster but, given their low millimeter luminosities, most of the dust mass probably resides in macroscopic objects. Their continuous infrared SEDs show that no planets have dynamically cleared out radial gaps or holes that are optically thin to starlight and their large H luminosities indicate that they retain some gas. Recent calculations by Johansen & Lacerda (2010) and Ormel & Klahr (2010) show that centimeter-sized “pebbles” in gas rich disks experience strong drag forces and rapidly accrete onto protoplanets thereby accelerating planetary growth. Our conclusion that most of the solids in the disks have aggregated beyond millimeter sizes within 2–3 Myr is also consistent with cosmochemical measurements of the absolute ages of chondrules within rocky meteorites (Amelin et al., 2002).
6. Summary
We have conducted a 1.3 mm SMA survey of 85 YSOs in the nearby cluster IC348. With a mean age of 2–3 Myr, the cluster presents an opportunity to study YSOs at a critical time in their evolution when they begin to lose a large fraction of their disks. Our main findings are:
-
•
Nine protoplanetary disks are detected with inferred masses ranging from .
-
•
The millimeter detected disks are all actively accreting and exhibit excess photospheric emission above the photosphere at m with infrared SEDs similar to the median in Taurus.
-
•
The protoplanetary disk mass distribution in IC348 is shifted to lower masses by about a factor of 20 compared to the Myr old Taurus and Ophiuchus star-forming regions. We suggest that this is due to substantial grain growth such that most of the solid mass resides in large particles, mm and perhaps up to meters, in at least some of the disks.
-
•
Grain growth beyond millimeter sizes in gaseous disks may promote rapid planetary growth and the disks that we have detected with the SMA likely signpost the best candidates in the cluster for witnessing the birth pangs of giant planets.
Future directions include resolved observations to see whether any protoplanets might have opened up “dusty gaps” that are infrared bright but millimeter-faint (Andrews et al., 2011). It will also be very interesting to try additional spectroscopic observations to measure their gas content, and to observe them at longer wavelengths to constrain the population of centimeter and larger sized grains. Due to their low millimeter luminosities, however, these are tasks for upcoming facilities.
References
- Amelin et al. (2002) Amelin, Y., Krot, A. N., Hutcheon, I. D., & Ulyanov, A. A. 2002, Science, 297, 1678
- Andre & Montmerle (1994) Andre, P., & Montmerle, T. 1994, ApJ, 420, 837
- Andrews & Williams (2005) Andrews, S. M., & Williams, J. P. 2005, ApJ, 631, 1134
- Andrews & Williams (2007) —. 2007, ApJ, 671, 1800
- Andrews et al. (2011) Andrews, S. M., Wilner, D. J., Espaillat, C., Hughes, A. M., Dullemond, C. P., McClure, M. K., Qi, C., & Brown, J. M. 2011, ApJ, 732, 42
- Arce & Sargent (2006) Arce, H. G., & Sargent, A. I. 2006, ApJ, 646, 1070
- Beckwith et al. (1990) Beckwith, S. V. W., Sargent, A. I., Chini, R. S., & Guesten, R. 1990, AJ, 99, 924
- Boss (1997) Boss, A. P. 1997, Science, 276, 1836
- Carpenter (2002) Carpenter, J. M. 2002, AJ, 124, 1593
- Carpenter et al. (2005) Carpenter, J. M., Wolf, S., Schreyer, K., Launhardt, R., & Henning, T. 2005, AJ, 129, 1049
- Cieza et al. (2007) Cieza, L., et al. 2007, ApJ, 667, 308
- Cieza et al. (2008) Cieza, L. A., Swift, J. J., Mathews, G. S., & Williams, J. P. 2008, ApJ, 686, L115
- Currie & Kenyon (2009) Currie, T., & Kenyon, S. J. 2009, AJ, 138, 703
- D’Alessio et al. (2001) D’Alessio, P., Calvet, N., & Hartmann, L. 2001, ApJ, 553, 321
- D’Antona & Mazzitelli (1997) D’Antona, F., & Mazzitelli, I. 1997, Mem. Soc. Astron. Italiana, 68, 807
- Draine (2006) Draine, B. T. 2006, ApJ, 636, 1114
- Eisner & Carpenter (2006) Eisner, J. A., & Carpenter, J. M. 2006, ApJ, 641, 1162
- Fedele et al. (2010) Fedele, D., van den Ancker, M. E., Henning, T., Jayawardhana, R., & Oliveira, J. M. 2010, A&A, 510, A72+
- Feigelson & Nelson (1985) Feigelson, E. D., & Nelson, P. I. 1985, ApJ, 293, 192
- Gomez et al. (1992) Gomez, M., Jones, B. F., Hartmann, L., Kenyon, S. J., Stauffer, J. R., Hewett, R., & Reid, I. N. 1992, AJ, 104, 762
- Greaves & Rice (2010) Greaves, J. S., & Rice, W. K. M. 2010, MNRAS, 407, 1981
- Hatchell et al. (2005) Hatchell, J., Richer, J. S., Fuller, G. A., Qualtrough, C. J., Ladd, E. F., & Chandler, C. J. 2005, A&A, 440, 151
- Herbig (1998) Herbig, G. H. 1998, ApJ, 497, 736
- Hernández et al. (2007) Hernández, J., et al. 2007, ApJ, 662, 1067
- Hubickyj et al. (2005) Hubickyj, O., Bodenheimer, P., & Lissauer, J. J. 2005, Icarus, 179, 415
- Johansen & Lacerda (2010) Johansen, A., & Lacerda, P. 2010, MNRAS, 404, 475
- Kenyon & Hartmann (1995) Kenyon, S. J., & Hartmann, L. 1995, ApJS, 101, 117
- Lada (1987) Lada, C. J. 1987, in IAU Symposium, Vol. 115, Star Forming Regions, ed. M. Peimbert & J. Jugaku, 1–17
- Lada et al. (2006) Lada, C. J., et al. 2006, AJ, 131, 1574
- Luhman et al. (1998) Luhman, K. L., Rieke, G. H., Lada, C. J., & Lada, E. A. 1998, ApJ, 508, 347
- Luhman et al. (2003) Luhman, K. L., Stauffer, J. R., Muench, A. A., Rieke, G. H., Lada, E. A., Bouvier, J., & Lada, C. J. 2003, ApJ, 593, 1093
- Mann & Williams (2009) Mann, R. K., & Williams, J. P. 2009, ApJ, 694, L36
- Mann & Williams (2010) —. 2010, ApJ, 725, 430
- Ormel & Klahr (2010) Ormel, C. W., & Klahr, H. H. 2010, A&A, 520, A43+
- Pollack et al. (1996) Pollack, J. B., Hubickyj, O., Bodenheimer, P., Lissauer, J. J., Podolak, M., & Greenzweig, Y. 1996, Icarus, 124, 62
- Preibisch & Zinnecker (2002) Preibisch, T., & Zinnecker, H. 2002, AJ, 123, 1613
- Robitaille et al. (2006) Robitaille, T. P., Whitney, B. A., Indebetouw, R., Wood, K., & Denzmore, P. 2006, ApJS, 167, 256
- Walawender et al. (2006) Walawender, J., Bally, J., Kirk, H., Johnstone, D., Reipurth, B., & Aspin, C. 2006, AJ, 132, 467
- White & Basri (2003) White, R. J., & Basri, G. 2003, ApJ, 582, 1109
- Williams et al. (2005) Williams, J. P., Andrews, S. M., & Wilner, D. J. 2005, ApJ, 634, 495
- Williams & Cieza (2011) Williams, J. P., & Cieza, L. A. 2011, ArXiv e-prints
- Wilner et al. (2000) Wilner, D. J., Ho, P. T. P., Kastner, J. H., & Rodríguez, L. F. 2000, ApJ, 534, L101
| Field | R.A. | Decl | Date | RMS |
|---|---|---|---|---|
| (J2000) | (J2000) | (yymmdd) | (mJy) | |
| A | 03:44:12.80 | 32:01:37.10 | 091013 | 0.48 |
| B | 03:44:44.57 | 32:10:49.80 | 091013 | 0.51 |
| C | 03:44:23.45 | 32:01:49.39 | 091013 | 0.46 |
| D | 03:44:38.19 | 32:08:15.59 | 091020 | 0.80 |
| E | 03:44:35.91 | 32:09:04.09 | 091020 | 0.75 |
| F | 03:44:37.26 | 32:03:21.89 | 091020 | 0.77 |
| G | 03:44:30.31 | 32:09:47.49 | 091204, 091206 | 0.73 |
| H | 03:44:29.52 | 32:01:11.91 | 091204, 091206 | 0.68 |
| I | 03:44:40.71 | 32:09:56.90 | 091204, 091206 | 0.69 |
| J | 03:44:32.29 | 32:05:41.09 | 091207 | 0.62 |
| K | 03:44:13.64 | 32:13:27.60 | 091207 | 0.59 |
| L | 03:44:42.96 | 32:08:44.29 | 091207 | 0.61 |
| M | 03:44:37.60 | 32:11:57.59 | 091222 | 0.50 |
| N | 03:44:21.55 | 32:12:07.69 | 091222 | 0.49 |
| O | 03:44:26.39 | 32:08:12.49 | 091222 | 0.50 |
| P | 03:44:18.78 | 32:07:32.50 | 091227 | 0.46 |
| Q | 03:44:34.38 | 32:12:58.39 | 091227 | 0.48 |
| R | 03:44:45.34 | 32:04:01.79 | 091227 | 0.46 |
| S | 03:44:32.04 | 32:11:43.70 | 101006 | 0.94 |
| T | 03:44:43.53 | 32:07:42.74 | 101019 | 0.82 |
| U | 03:44:36.96 | 32:06:45.20 | 101122 | 0.91 |
| V | 03:44:56.15 | 32:09:15.19 | 101214 | 0.37 |
| ID | R.A. | Decl | Field | Spectral Type | |||||
|---|---|---|---|---|---|---|---|---|---|
| (J2000) | (J2000) | (mJy) | (mJy) | () | (Å) | () | |||
| (1) | (1) | (1) | (2) | (3) | (4) | (5) | (6) | (7) | (8) |
| 51 | 03 44 12.97 | 32 01 35.40 | A | … | 75.90 | 0.55 | 69.19 | 45 | … |
| 153 | 03 44 42.77 | 32 08 33.90 | L | M4.75 | 6.49 | 0.71 | 5.92 | 40 | 0.20 |
| 32 | 03 44 37.89 | 32 08 04.20 | D | K7 | 5.47 | 0.81 | 4.99 | 68 | 0.77 |
| 221 | 03 44 40.26 | 32 09 33.20 | I | M4.5 | 3.23 | 0.89 | 2.94 | 40 | 0.20 |
| 248 | 03 44 35.95 | 32 09 24.30 | E | M5.25 | 2.81 | 0.81 | 2.56 | 30 | 0.15 |
| 468 | 03 44 11.07 | 32 01 43.70 | A | M8.25 | 2.37 | 0.56 | 2.16 | 400 | 0.02 |
| 8078 | 03 44 26.69 | 32 08 20.30 | O | M0.5 | 2.07 | 0.51 | 1.89 | 75 | 0.65 |
| 100 | 03 44 22.32 | 32 12 00.80 | N | M1 | 2.06 | 0.51 | 1.88 | 90 | 0.60 |
| 192 | 03 44 23.64 | 32 01 52.70 | C | M4.5 | 2.06 | 0.57 | 1.88 | 40 | 0.23 |
| 15 | 03 44 44.72 | 32 04 02.70 | R | M0.5 | 1.98 | 0.46 | 1.80 | 36 | 0.65 |
Note. — (1) Source ID and coordinates as given in Lada et al. (2006). (2) Observed field, as labeled in Figure 1. (3) Spectral type of object where available, from Luhman et al. (2003). (4) mm flux density. (5) 1 errors in flux density. (6) Protoplanetary disk mass in units of . (7) H equivalent widths, from Luhman et al. (2003). (8) Stellar Masses estimated from pre-main-sequence evolutionary tracks.