The Primordial Inflation Explorer (PIXIE): A Nulling Polarimeter for Cosmic Microwave Background Observations
Abstract
The Primordial Inflation Explorer (PIXIE) is an Explorer-class mission to measure the gravity-wave signature of primordial inflation through its distinctive imprint on the linear polarization of the cosmic microwave background. The instrument consists of a polarizing Michelson interferometer configured as a nulling polarimeter to measure the difference spectrum between orthogonal linear polarizations from two co-aligned beams. Either input can view the sky or a temperature-controlled absolute reference blackbody calibrator. PIXIE will map the absolute intensity and linear polarization (Stokes , , and parameters) over the full sky in 400 spectral channels spanning 2.5 decades in frequency from 30 GHz to 6 THz (1 cm to 50 m wavelength). Multi-moded optics provide background-limited sensitivity using only 4 detectors, while the highly symmetric design and multiple signal modulations provide robust rejection of potential systematic errors. The principal science goal is the detection and characterization of linear polarization from an inflationary epoch in the early universe, with tensor-to-scalar ratio at 5 standard deviations. The rich PIXIE data set will also constrain physical processes ranging from Big Bang cosmology to the nature of the first stars to physical conditions within the interstellar medium of the Galaxy.
1 Introduction
A central principle in modern cosmology is the concept of inflation, which posits a period of exponential expansion in the early universe shortly after the Big Bang. The many -foldings of the scale size during inflation force the geometry of space-time to asymptotic flatness while dilating quantum fluctuations in the inflaton potential to the macroscopic scales responsible for seeding large-scale structure in the universe. Inflation provides a simple, elegant solution to multiple problems in cosmology, but it relies on extrapolation of physics to energies greatly exceeding direct experimentation in particle accelerators.
The polarization of the cosmic microwave background (CMB) provides a direct test of inflationary physics. CMB polarization results from Thomson scattering of CMB photons by free electrons. A quadrupolar anisotropy in the radiation incident on each electron creates a net polarization in the scattered radiation. There are only two possible sources for such a quadrupole: either an intrinsic temperature anisotropy or the differential redshift caused by a gravity wave propagating through an isotropic medium. The two cases can be distinguished by their different spatial signatures. Temperature perturbations are scalar quantities; their polarization signal must therefore be curl-free. Gravity waves, however, are tensor perturbations whose polarization includes both gradient and curl components. In analogy to electromagnetism, the scalar and curl components are often called “E” and “B” modes. Only gravity waves induce a curl component: detection of a B-mode signal in the CMB polarization field is recognized as a “smoking gun” signature of inflation, testing physics at energies inaccessible through any other means [1, 2, 3, 4, 5, 6, 7, 8].
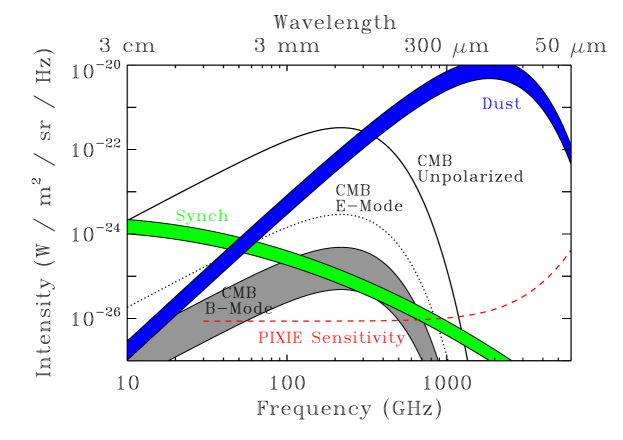
Figure 1 shows the amplitude of CMB polarization as a function of angular scale. At the degree angular scales characteristic of the horizon at decoupling, the unpolarized temperature anisotropy is typically 80 K. These fluctuations in turn generate E-mode polarization, which at amplitude 3 K is only a few percent of the temperature fluctuations. The B-mode amplitude from gravity waves is unknown. This amplitude is related directly to the energy scale of inflation, [9], where GeV is the Planck mass and is the power ratio of gravity waves to scalar fluctuations. If inflation results from Grand Unified Theory physics (energy GeV), the B-mode amplitude should be in the range 1 to 100 nK. Recent WMAP results suggest likely values 30-100 nK, toward the upper range of GUT inflation [10]. Signals at this amplitude could be detected by a dedicated polarimeter, providing a direct, model-independent measurement of the energy scale of inflation.

Detecting the gravity-wave signature in polarization will be difficult. As recognized in multiple reports [11, 12, 13], there are three fundamental challenges:
-
•
Sensitivity The gravity-wave signal is faint compared to the fundamental sensitivity limit imposed by photon arrival statistics. Even noiseless detectors suffer from this photon-counting limit; the only solution is to collect more photons.
-
•
Foregrounds The gravity-wave signal is faint compared to the polarized Galactic synchrotron and dust foregrounds. Separating CMB from foreground emission based on their different frequency spectra requires multiple frequency channels.
-
•
Systematic Errors The gravity-wave signal is faint compared to both the unpolarized CMB anisotropy and the dominant E-mode polarization. Accurate measurement of the B-mode polarization requires strict control of instrumental effects that could alias these brighter signals into a false B-mode detection.
Satisfying the simultaneous requirements of sensitivity, foreground discrimination, and immunity to systematic errors presents a technological challenge. In this paper, we describe an instrument capable of measuring the CMB and diffuse Galactic foregrounds with background-limited sensitivity in over 400 frequency channels using only 4 detectors.
2 Instrument Description
The Primordial Inflation Explorer (PIXIE) is an Explorer-class mission to detect and characterize the polarization signal from an inflationary epoch in the early Universe. PIXIE combines multi-moded optics with a Fourier Transform Spectrometer to provide breakthrough sensitivity for CMB polarimetry using only four semiconductor detectors. The design addresses each of the principal challenges for CMB polarimetry. A multi-moded “light bucket” provides nK sensitivity using only four detectors. A polarizing Fourier Transform Spectrometer (FTS) synthesizes 400 channels across 2.5 decades in frequency to provide unparalleled separation of CMB from Galactic foregrounds. PIXIE’s highly symmetric design enables operation as a nulling polarimeter to provide the necessary control of instrumental effects.
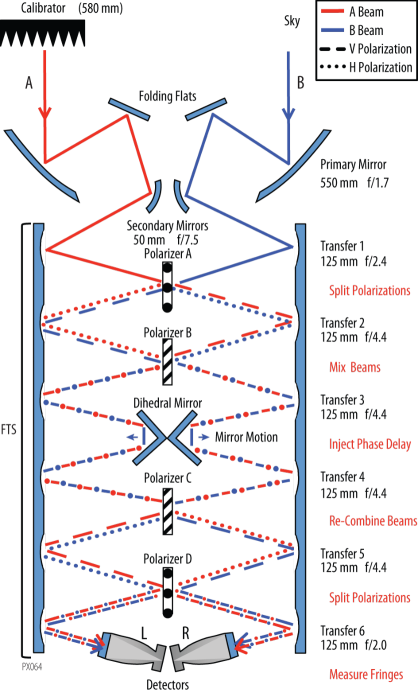
Figure 2 shows the instrument concept. Two off-axis primary mirrors 550 mm in diameter produce twin beams co-aligned with the spacecraft spin axis. A folding flat and 50 mm secondary mirror route the beams to the FTS. A set of six transfer mirror pairs, each imaging the previous mirror to the following one, shuttles the radiation through a series of polarizing wire grids. Polarizer A transmits vertical polarization and reflects horizontal polarization, separating each beam into orthogonal polarization states. A second polarizer (B) with wires oriented 45∘ relative to grid A mixes the polarization states. A Mirror Transport Mechanism (MTM) moves back-to-back dihedral mirrors to inject an optical phase delay. The phase-delayed beams re-combine (interfere) at Polarizer C. Polarizer D (oriented the same as A) splits the beams again and routes them to two multi-moded concentrator feed horns. Each concentrator is square to preserve linear polarization and contains a pair of identical bolometers, each sensitive to a single linear polarization but mounted at 90∘ to each other to measure orthogonal polarization states. To control stray light, all internal surfaces except the active optical elements are coated with a microwave absorber [14], forming a blackbody cavity isothermal with the sky.
Each of the four detectors measures an interference fringe pattern between orthogonal linear polarizations from the two input beams. Let represent the electric field incident from the sky. The power at the detectors as a function of the mirror position may be written
| (2.1) |
(Appendix A), where is the angular frequency of incident radiation, L and R refer to the detectors in the left and right concentrators, and A and B refer to the two input beams (Fig 2).
| Parameter | Value | Notes |
| Primary Mirror Diameter | 55 cm | Sets beam size on sky |
| Etendu | 4 cm2 sr | 2.7 times larger than FIRAS |
| Beam Diameter | 26 tophat | Equivalent 16 Gaussian FWHM |
| Throughput | 82% | Excludes detector absorption |
| Detector Absorption | 54% | Reflective backshort |
| Mirror Stroke | 2.6 mm peak-peak | Phase delay 10 mm |
| Spectral Resolution | 15 GHz | Set by longest mirror stroke |
| Highest Effective Frequency | 6 THz | Spacing in polarizing grids |
| Detector NEP | W Hz-1 | |
| System NEP | W Hz-1 | Background limit |
The term modulated by the mirror scan is proportional to the Fourier transform of the frequency spectrum for Stokes linear polarization in instrument-fixed coordinates. Rotation of the instrument about the beam axis interchanges and on the detectors. The sky signal (after the Fourier transform) then becomes
| (2.2) |
where , , and are the Stokes polarization parameters, is the spin angle, and denotes the synthesized frequency spectrum with bins set by the fringe sampling.
Table 1 summarizes the instrument optics. Cryogenic pupil stops at the primary mirror and field stops at the transfer mirrors limit the etendu to 4 cm2 sr to produce a circular tophat beam with diameter 26111 The angular smoothing from the tophat beam (window function in ) may be approximated by a 16 Gaussian full width at half maximum.. Throughput from the entrance aperture to the detector is 82%, evenly split among geometric loss, diffractive loss, and absorption on the wire grids. A low-pass filter on each folding flat blocks zodiacal light. The optics, including the square concentrator, preserve polarization: orthogonal polarization states at the detector remain orthogonal within 3∘ when projected to the sky.
PIXIE operates as a nulling polarimeter: when both beams view the sky, the instrument nulls all unpolarized emission so that the fringe pattern responds only to the sky polarization. The resulting null operation greatly reduces sensitivity to systematic errors from unpolarized sources. Normally the instrument collects light from both co-aligned telescopes. A full-aperture blackbody calibrator can move to block either beam, replacing the sky signal in that beam with an absolute reference source, or be stowed to allow both beams to view the same sky patch. The calibrator temperature is maintained near 2.725 K and is changed mK every other orbit to provide small departures from null as an absolute reference signal. When the calibrator blocks either beam, the fringe pattern encodes information on both the temperature distribution on the sky (Stokes I) as well as the linear polarization. Interleaving observations with and without the calibrator allows straightforward transfer of the absolute calibration scale to linear polarization, while providing a valuable cross-check of the polarization solutions obtained in each mode.
The PIXIE design differs radically from kilo-pixel focal plane arrays, but shares a number of similarities with the Far Infrared Absolute Spectrophotometer (FIRAS) instrument on NASA’s Cosmic Background Explorer (COBE) mission [15, 16, 17]. Both instruments use a polarizing Michelson interferometer with free-standing wire grid polarizers to measure the frequency spectrum over several decades. PIXIE unfolds the optics so that each photon interacts with each grid and mirror once instead of twice, thus requiring four grids to FIRAS’ two. The larger PIXIE etendu (4 cm2 sr compared to 1.5 cm2 sr for FIRAS) and lower bolometer NEP ( compared to for FIRAS) provide a factor of 76 in improved sensitivity. FIRAS compared a single sky beam to an internal blackbody calibrator, and occasionally inserted an external calibrator for absolute calibration. The PIXIE optical path is fully symmetric, with two sky beams incident on the FTS. The PIXIE external calibrator can be moved to block either beam or stowed so that both beams view the sky. Dichroic splitters divided the FIRAS output into a high-frequency and low-frequency band, using a total of four identical detectors (left high, left low, right highn and right low). PIXIE divides each ouput by polarization, also utilizing four identical detectors (left , left , right , and right ). Each PIXIE detector measures the difference between orthogonal linear polarizations from opposite sides of the instrument.
The frequency multiplex advantage inherent in the FTS spectrometer also means that each synthesized frequency bin contains noise defined not by the background intensity evaluated at that frequency, but by the integrated background intensity incident on the detector. For a ground-based experiment, the resulting noise from atmospheric emission would be unacceptable compared to other techniques. PIXIE is optimized for a space environment where the nulling FTS polarimeter provides significant advantages for both instrument simplicity and control of systematic errors.
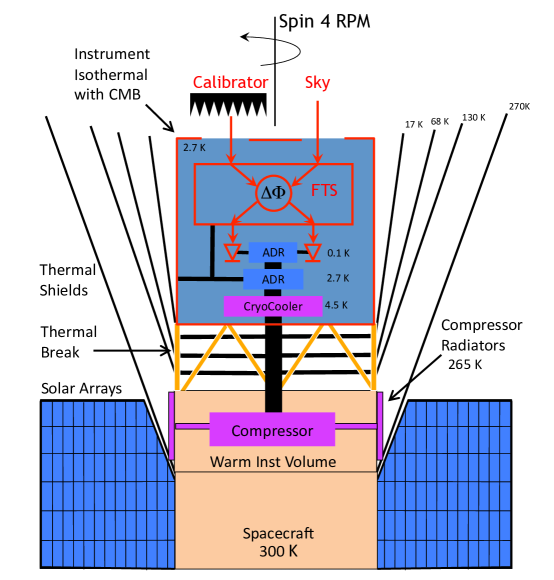
Figure 3 shows the thermal schematic of the instrument. An adiabatic demagnetization refrigerator (ADR) maintains the telescope and FTS at 2.725 K, in thermal equilibrium with the CMB. A second ADR cools the detectors and associated feed horn assembly to 0.1 K. An absorbing enclosure, also maintained at 2.725 K, surrounds the optics to control stray light, so that radiation leaving the detector (in a time-reversed sense) terminates either on the sky or on a blackbody enclosure with spectrum nearly identical to the sky. The ADR rejects heat to a mechanical cryo-cooler at 4.5 K, which in turn rejects the heat to a dedicated radiator viewing deep space. A hexapod thermal break structure provides thermal isolation between the cryogenic and warm portions of the instrument. A set of concentric shields surrounds the instrument and cryocooler radiator to prevent heating by the Sun or Earth while also providing passive cooling to the thermal break structure.
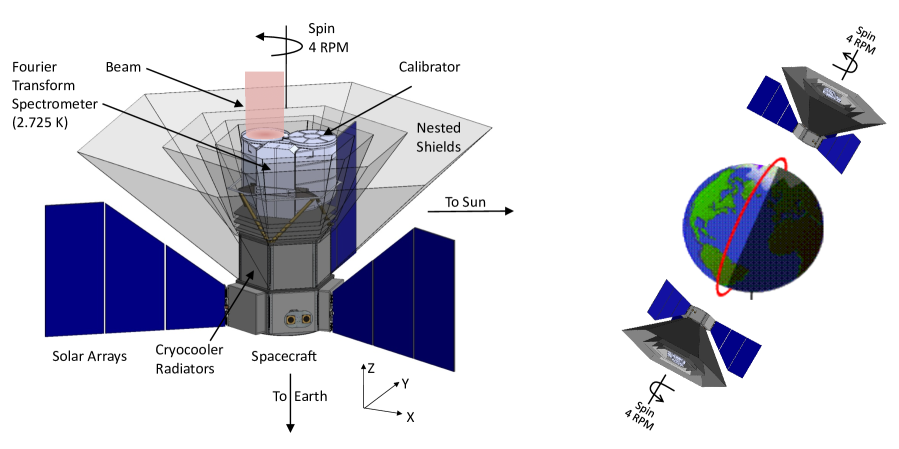
Figure 4 shows the observatory and mission concept. PIXIE will launch into a 660 km polar sun-synchronous orbit with 6 AM or 6 PM ascending node to provide full-sun operation. The instrument spins at 4 RPM with the spin axis maintained 91∘ from the Sun line and as close as possible to the zenith consistent with the Solar pointing requirement. The instrument thus observes a great circle each orbit, while the orbit precession of 1∘ per day achieves full sky coverage in each 6-month observing period. The detector sampling, mirror stroke, and spacecraft spin are fast compared to the orbital motion of the beam across the sky, eliminating the need for pixel-to-pixel differences in the data analysis.
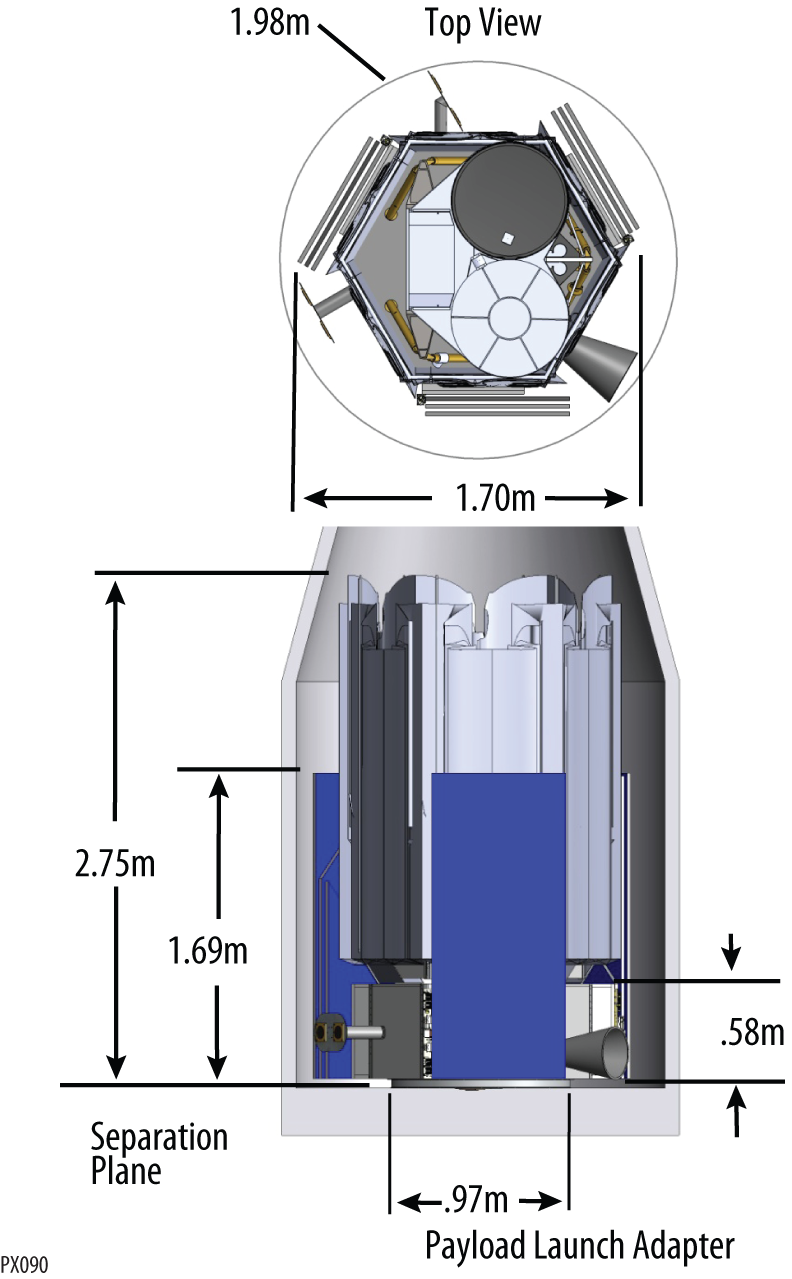
PIXIE is small mission, well within the capabilities of NASA’s Explorer program. Figure 5 shows the observatory in launch configuration. The observatory size is set by the two 55 cm primary mirrors, and fits easily within the 92” fairing of either the Taurus or Athena launch vehicles. PIXIE is technologically mature and could launch as early as 2017.
3 Instrument Performance
3.1 Sensitivity
The gravity-wave signal is faint compared to the fundamental sensitivity limit imposed by photon arrival statistics. Currently fielded instruments search for the inflationary signature using kilo-pixel arrays of transition-edge superconducting bolometers [18, 19, 20]. Strictly speaking, however, the need is for more photons, not necessarily more detectors. The noise equivalent power (NEP) of photon noise in a single linear polarization is given by
| (3.1) |
where , is the observing frequency, is the detector area, is the detector solid angle, is detector absorptivity, is the physical temperature of the source, is the emissivity of the source, and is the power transmission through the optics [21]. For a fixed integration time the detected noise is simply
| (3.2) |
where the factor of 2 accounts for the conversion between the frequency and time domains. The noise at the detector may in turn be referred to the specific intensity on the sky,
| (3.3) |
where is the observing bandwidth.
The light-gathering ability of an instrument is specified by its etendu . Two points are worth noting. Increasing the etendu for a single detector increases the photon noise, , thereby decreasing the relative contribution of the intrinsic detector (phonon) noise. But since the signal increases linearly with etendu, the signal-to-noise ratio improves as . Increasing the etendu relaxes detector noise requirements while simultaneously improving the overall system sensitivity to sky signals.
The multi-moded PIXIE optics provide sensitivity comparable to kilo-pixel focal plane arrays while requiring only 4 semiconductor bolometers. For diffraction-limited single-mode optics, the etendu and wavelength are related as so that the beam size scales with the observing wavelength. For multi-moded optics, however, the beam size is fixed and the number of modes scales as . Multi moded optics thus allow a considerable increase in sensitivity compared to single-moded designs of comparable size. The improvement is large enough to allow precision measurement of the gravity-wave signature in polarization using a handful of detectors. Over just the frequency range 30–600 GHz where the CMB is brightest, each PIXIE detector measures 22,000 independent modes of the electric field.
The fringe pattern measured at each detector samples the Fourier transform of the frequency spectrum of the difference between one linear polarization from the A-side beam and the orthogonal linear polarization from the B-side beam (Eq. 2.1). The frequency bins in the synthesized spectra are set by the mirror throw and detector sampling. As the mirror moves, we obtain detector samples over an optical path length . The Fourier transform of the sampled fringe pattern returns frequencies where . The path length (optical stroke) thus determines the width of the frequency bins in the synthesized spectra, while the number of detector samples within each optical stroke determines the number of frequency bins and thus the highest sampled frequency. With and cm, we obtain 512 synthesized frequency bins of width 15 GHz each. The corresponding physical mirror movement = 2.58 mm accounts for the folded optics as well as the off-axis optical path ) and beam divergence ().
Table 1 summarizes the instrument optical parameters. The instrument NEP of is dominated by photon noise with only minor contribution from the intrinsic detector noise. With the calibrator deployed over either aperture, the instrument measures both polarized and unpolarized emission (Stokes , , and ). With both beams open to the sky, the instrument is insensitive to unpolarized emission but has twice the sensitivity to polarized signals222 Replacing the blackbody calibrator emission with sky emission in one beam leaves the noise nearly unchanged but doubles the sky signal incident on the FTS.. Reducing the mirror stroke when the calibrator is stowed further improves sensitivity (the wider frequency bins do not degrade foreground subtraction since no polarized line emission is anticipated). Including these effects and averaging over the four detectors, the combined instrument sensitivity to either unpolarized or polarized emission within each synthesized frequency bin is
| (3.4) |
for a one-second integration with the calibrator deployed over either aperture, and
| (3.5) |
when the calibrator is stowed (Appendix B). PIXIE will spend approximately 30% of the observing time with the calibrator deployed and 60% with the calibrator stowed. The remaining 10% includes both high-temperature calibration of the Galactic dust signal and lost observing time.
| Observing Mode | NET | NEQ |
|---|---|---|
| () | () | |
| Calibrator Deployed | 13.6 | 19.2 |
| Calibrator Stowed | — | 5.6 |
Eqs 3.4 and 3.5 give the specific intensity within each synthesized frequency bin. The wire grid polarizers become inefficient in reflection at wavelengths m defined by the m wire spacing, limiting the effective frequency coverage to 400 bins from 30 GHz to 6 THz (Fig 6). For continuum sources like the CMB we may integrate over multiple bins to further improve sensitivity. Table 2 shows the resulting sensitivity to a CMB source. A 4-year mission achieves rms sensitivity 70 nK within each pixel.
Cosmological foregrounds present a natural sensitivity limit. Primordial density perturbations source E-mode polarization. Gravitational lensing from the mass distribution along each line of sight creates a shear that distorts the orientation of the primordial polarization field, analogous to the shear in galaxy orientations observed along the line of sight toward distant massive clusters. By perturbing the polarization orientation, gravitational lensing mixes the E and B modes and transforms a small fraction of the dominant E-mode polarization into a B-mode. On angular scales , the lensed B-mode signal is well approximated by a random white noise field on the sky (Fig 1). This sky noise is present along every line of sight and adds in quadrature with the instrument noise. PIXIE will reach reach this cosmological “noise floor” beyond which little additional gain can be realized.
The PIXIE sensitivity allows robust detection and characterization of the inflationary B-mode signal. Averaged over the cleanest 75% of the sky, PIXIE will detect the gravity-wave signal at 5 standard deviations, two orders of magnitude more sensitive than Planck and a factor of ten below the predicted signal for GUT-scale inflation. The resulting sensitivity allows characterization of the B-mode angular power spectrum in 20 bins at multipoles limited by the 26 diameter beam (Figure 1).
3.2 Foreground Subtraction
The most demanding challenge to detecting cosmological B modes is likely to be confusion from foreground signals. PIXIE has both the sensitivity and multi-frequency lever arm necessary to map foreground emission independently in each sky pixel.
On the large angular scales of interest to PIXIE, foregrounds are dominated by polarized emission from the Milky Way’s interstellar medium [12, 22]. Polarized emission within the Galaxy is dominated by two main sources. Synchrotron radiation from cosmic ray electrons accelerated in the Galactic magnetic field approximates a power-law spectrum
| (3.6) |
with . Thermal emission from dust grains follows a greybody spectrum,
| (3.7) |
with . CMB emission follows a Planck spectrum, with power-law spectral index in the low-frequency Rayleigh-Jeans portion and an exponential cutoff on the Wien side of the blackbody spectrum (Fig 6).
CMB emission can be distinguished from Galactic foregrounds based on their different frequency spectra. The number of independent frequency channels must equal or exceed the number of free parameters to be derived from a multi-frequency fit. A conservative approach requires at least ten frequency channels at the millimeter wavelengths where the CMB is brightest: three parameters (amplitude, spectral index, and spectral curvature) for synchrotron emission, three parameters (amplitude, spectral index, and frequency-dependent polarization fraction) for thermal dust emission, two parameters (amplitude and spectral index) for electric dipole emission from a population of rapidly spinning dust grains, one parameter (amplitude) for free-free emission (thermal bremsstrahlung) reflected from diffuse interstellar dust, and one parameter (amplitude) for CMB polarization.
A commonly used technique forms a linear combination of frequency channels,
| (3.8) |
to separate CMB from foreground emission based on the different spectra. If the component spectra are known, the coefficients may be chosen such that a CMB spectrum is recovered with unit response while the foreground signals are canceled [23, 24]. A useful way to express sensitivity is to quote the Foreground Degradation Factor (FDF), the ratio of the noise per pixel in the foreground-reduced map to corresponding noise obtained using straight noise weighting. PIXIE has many more frequency channels than foreground components, allowing efficient foreground suppression without excessive noise penalty. PIXIE achieves FDF=1.02 – the noise penalty for rejecting foregrounds with PIXIE is only 2%. This noise penalty is included in all estimates of CMB sensitivity.
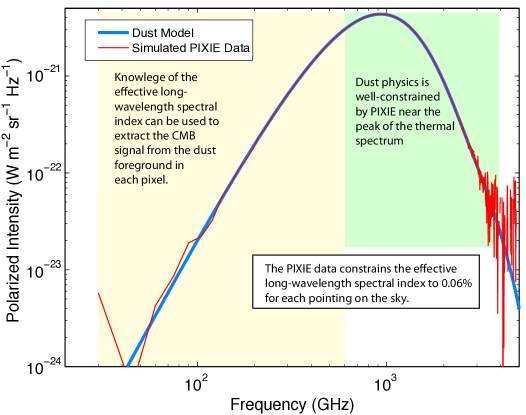
The internal linear combination technique requires knowledge of the foreground spectral indices. PIXIE has 400 effective channels from 30 GHz to 6 THz, allowing independent determination of the spectral indices within each sky pixel. PIXIE primarily observes at frequencies above 100 GHz where the dominant foreground is dust. Simulations using realistic polarized foregrounds [25, 26] and instrument noise successfully recover the long-wavelength dust index from the input maps to 0.06% precision, corresponding to uncertainty in the dust spectral index (Fig 7). The resulting error in the recovered CMB component is below 1 nK.
3.3 Systematic Errors
Reliable detection of the primordial gravity-wave signal requires rigorous control of systematic errors. PIXIE uses multiple levels of signal modulation spanning 11 orders of magnitude in time to reject systematic errors.
-
•
Detector Readout (1 ms) An AC bias circuit modulates the detector output at 1 kHz to reduce the effects of noise in the detector or readout electronics.
-
•
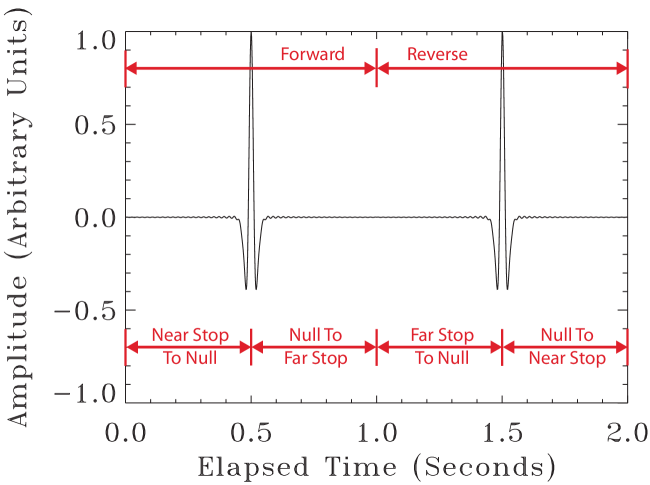
FTS Fringe Pattern (1 sec) The fringe pattern observed as the mirror moves from one endpoint through the white-light null to the opposite endpoint modulates sky signals on time scales from 1 ms to 1 s (Fig 8). True sky signals are independent of the sign (near vs far side of null) and direction (forward vs back) of the mirror motion, allowing separation of sky signal from instrumental effects.
-
•
Spacecraft Spin (15 sec) Unlike simple polarization-sensitive detectors, where instrument rotation produces a sinusoidal response to polarized sky signals, PIXIE’s rotation produces amplitude modulation of the entire fringe pattern at twice the spin frequency (Fig 9). The resulting modulated fringe pattern is readily distinguished from a simple spin-locked sine wave or its harmonics, suppressing spin-synchronous drifts. Sky signals are measured uniformly in azimuthal angle, mitigating the effect of beam ellipticity and cross polar response.
-
•
Calibration (3 hours) The calibrator changes position every even-numbered orbit (3 hours), reversing the sign of the fringe pattern from any sky signal. The calibrator changes temperature every odd-numbered orbit. Observations with the calibrator warmer than the sky reverse the sign of the fringe pattern compared to observations with the calibrator colder than the sky.
-
•
Orbit (2 days) The orbital scan re-visits each sky pixel for at least 20 consecutive orbits. Pixels near the celestial poles are viewed every orbit.
-
•
Orbit Precession (6 months) The observatory completes a full sky map every six months. A sky pixel observed on the ascending node of the orbit is re-observed 6 months later on the descending node, allowing subtraction of orbital effects.

In addition to the multiple levels of signal modulation, PIXIE’s highly symmetric design provides additional rejection of potential systematic errors.
-
•
– Symmetry The two detectors within each concentrator share the same optical path but observe orthogonal linear polarization states (Eq. 2.1). Beam and pointing errors cancel to first order when differencing the detectors.
-
•
L–R Symmetry The detector on the left side measures the same sky signal as the detector on the right side, but with opposite sign (Eq. 2.1). Beam and pointing errors cancel to first order when summing these two detectors.
-
•
A–B Symmetry The detector on the left side observes the same linear polarization as the detector on the right side, but with the roles of the and beams reversed. Differences reveal differential loss in the optics.
-
•
Real–Imaginary Symmetry The spatial symmetry of the fringe pattern about zero path length forces the sky signal entirely into the real part of the Fourier transform. The imaginary component of the Fourier transform provides an independent realization of the instrument noise, including systematics and any component, sampled at the same time and through the same optics as the noise in the sky spectra. The imaginary spectral maps may be analyzed identically to the real spectral maps (including multipole power spectra) as blind tests of systematics, with identical noise amplitude as the analyzed signal maps.
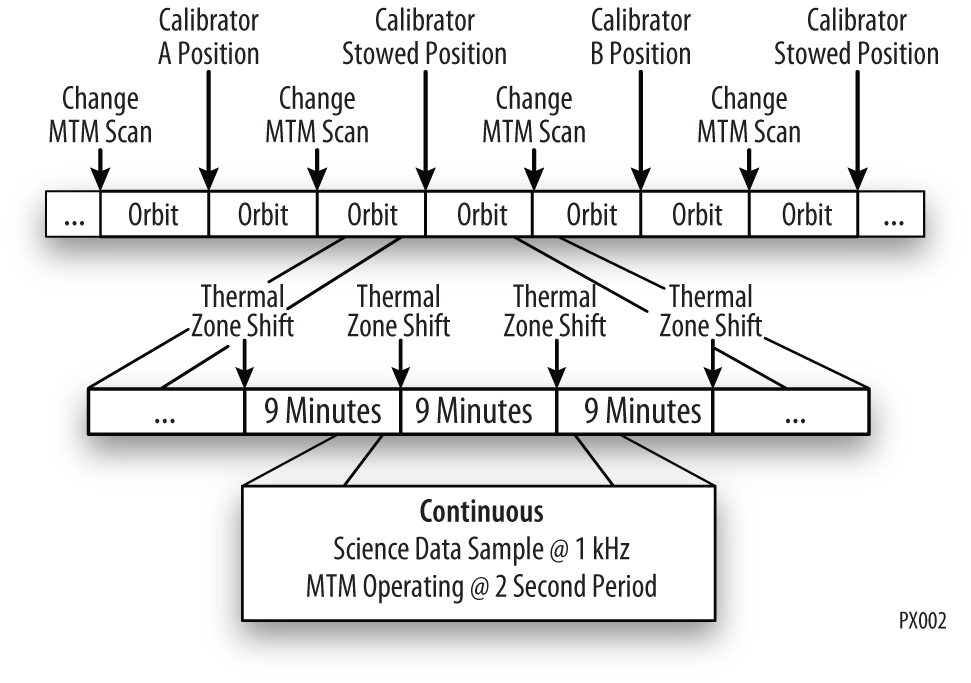
PIXIE operates in a continuous scanning mode, sampling the detectors at 1 kHz as the FTS mirror scan and spacecraft spin modulate the sky signal. Figure 10 shows the nominal operation sequence. Every 9 minutes the temperature of one of 20 optical surfaces within the instrument is adjusted to a new value to measure its effective emissivity. Every other orbit the calibrator moves to a different position (blocking beam A, blocking beam B, or stowed), while the peak-to-peak mirror stroke length is adjusted to apodize the interferograms (Appendix C). These changes use an autonomous lookup table and require no direct ground intervention. The observing strategy makes use of PIXIE’s inherent symmetry to further reduce potential systematic errors.
-
•
Null Operation PIXIE operates as a nulling polarimeter to avoid the need for high-fidelity control of the relative bolometer calibration. The polarization from the A beam interferes with the polarization from the B beam (Eq. 2.1). Only the difference signal is modulated, reducing the requirement on gain match or gain drift by a factor of .
-
•
Isothermal Operation The entire telescope, including the mirrors, FTS, support structure and enclosure, is maintained within 10 mK of the sky temperature. Rays that terminate within the instrument (stray light) simply replace a sky photon with an equivalent photon at nearly identical temperature, reducing the requirement on stray light or measured emissivities by a factor of .
-
•
Thermal Stability PIXIE observes from a thermally stable sun-synchronous orbit to minimize thermal perturbations that might source systematic errors (e.g. gain drifts). To further reduce thermal effects, the front-end analog electronics are housed in a thermally-controlled enclosure. Active thermal control and a long time constant reduce spin-locked temperature variation below 2 mK.
-
•
Frequency Coverage PIXIE’s frequency coverage extends well beyond the Wien cutoff in the CMB spectrum. Greybody emission from bright sources (Earth, Moon, Sun) in the far sidelobes can be distinguished from CMB emission based on color temperature alone.
-
•
Sky Observations The detector sampling (1 ms), mirror stroke (1 sec), and spacecraft spin (15 sec) are fast compared to the 41 sec required for the beam to pass through a fixed spot on the sky. PIXIE completes a measurement of the frequency spectrum of the Stokes parameters , , and independently for each spin period at each position on the sky. Pixel-to-pixel comparisons are not required.
A number of authors have examined systematic errors for CMB polarimetry [27, 28, 11, 29, 30, 31, 32, 33, 34, 35]. These systematic errors may be grouped into several broad categories. Instrumental drift or noise is mitigated by the FTS. The Fourier transform acts on short stretches of data, ranging from 330 ms to 1 second depending on the mirror apodization stroke (Table 5). Each interferogram is independent: noise or baseline drifts on time scales much longer than 1 second appear as a constant slope or low-order polynomial in the spatial frequency basis of any single interferogram. The Fourier transform of such low-order polynomials affects only the lowest few spectral bins and does not project efficiently onto either the CMB or foreground spectra. noise is thus inefficient at creating striping in the CMB polarization maps.
Scan-synchronous effects, which accumulate coherently through multiple observations, are of particular concern for CMB polarimetry. Amplitude modulation of the observed fringe pattern by the spacecraft spin efficiently rejects simple scan-synchronous pickup or offset variation. Scan-synchronous modulation of the instrument responsivity (gain drift) is more serious. Variation in responsivity at twice the spin period will modulate the dominant unpolarized signal to mimic a polarized source. PIXIE’s null design mitigates such a systematic error. With the calibrator stowed, the instrument responds only to polarized sky emission, removing the source term for gain modulation. Gain drifts only affect data when the calibrator is deployed. The calibrator is maintained within 10 mK of the sky temperature to allow operation near null. The residual systematic error signal is linear in the sky–calibrator temperature difference, while true sky signals are independent of the calibrator. Calibration data taken at different calibrator temperature allows identification and removal of scan-synchronous gain drifts. Residual modulation (e.g. from instrument asymmetries) can be rejected by comparing the signal from the 4 independent detectors. Gain drifts are predominantly common mode and produce identical signals on all 4 detectors,. True sky signals have opposite sign for specific detector pairs, allowing separation from common-mode signals.
| Effect | Leakage | PIXIE Mitigation | Residual | |||||
|---|---|---|---|---|---|---|---|---|
| FTS | Spin | Orbit | Xcal | Symmetry | Preflight | (nK) | ||
| Beam Ellipticity | ✓ | ✓ | ✓ | ✓ | 2.7 | |||
| Cross Polarization | ✓ | ✓ | ✓ | 1.5 | ||||
| Polarized Sidelobes | ✓ | ✓ | ✓ | ✓ | 1.1 | |||
| Instrumental Polarization | ✓ | ✓ | ✓ | ✓ | ✓ | |||
| Polarization Angle | ✓ | ✓ | ✓ | 0.7 | ||||
| Pointing Offset | ✓ | ✓ | ✓ | ✓ | ✓ | 0.7 | ||
| Relative Gain | ✓ | ✓ | ✓ | ✓ | ||||
| Scan-Synch Gain | ✓ | ✓ | ✓ | ✓ | ||||
| Scan-Synch Offset | ✓ | ✓ | ✓ | ✓ | ✓ | |||
Beam effects modulate the sky signal and can produce systematic errors. For example, instrument rotation of an elliptical beam pattern over an unpolarized sky creates a spurious “polarization” response at twice the spin frequency as the elliptical beam beats against the quadrupolar component of the local anisotropy. Since beam effects directly modulate the true sky signal, they can not be removed simply by altering the scan strategy and are sometimes referred to as “irreducible” systematic errors. The effect depends on anisotropy on angular scales smaller than the instrument beam and is thus of particular concern for an instrument like PIXIE whose 26 beam diameter is larger than the degree angular scale of unpolarized CMB anisotropy.
PIXIE’s differential design mitigates beam-related systematic errors. With the calibrator stowed, the unpolarized signal cancels to leading order, leaving only the differential ellipticity between the A- and B-side beams as a source of potential error. Regardless of calibrator position, polarized and unpolarized signals produce a different sign on each of the four detectors (Eq. 2.2), allowing unambiguous separation and rejection of beam effects.
A non-zero cross-polar beam response creates systematic errors by mixing the Stokes and parameters, thereby aliasing the dominant E-mode polarization into a spurious B-mode pattern. The dominant cause is the quadrupolar component of the cross-polar beam pattern333 A cross-polar response that is uniform across the beam affects the amplitude of the response to a polarized sky signal (polarization efficiency) but does not mix the and modes. . PIXIE’s non-imaging optics produce a tophat beam with nearly uniform polarization response, mitigating this effect. As with other beam-related effects, true polarized sky signals enter each detector at a specific relative phase in spin angle and can be identified by the appropriate detector-pair difference.
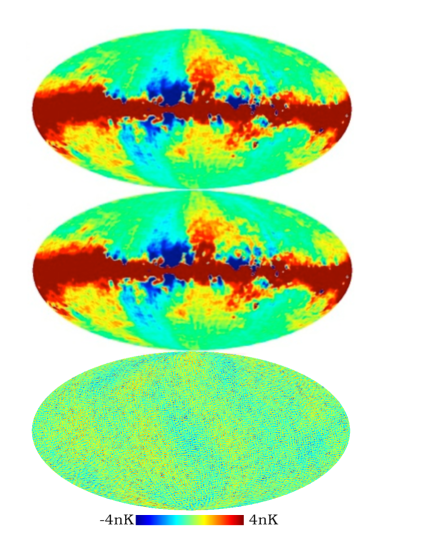
Table 3 lists the major sources of systematic error and their estimated effect on the PIXIE polarization results. We estimate the amplitude of each effect using end-to-end simulations. Figure 11 shows an example for the cross-polar instrument response. We generate a multi-frequency sky model consisting of the CMB monopole, temperature anisotropy, and polarization plus a relatively simple Galactic foreground consisting of a 2-component dust model [25]. We assume a constant 2% dust polarization fraction and adopt dust polarization direction from the WMAP K-band (synchrotron) data. The top panel of Figure 11 shows the resulting sky model in the 250 GHz frequency channel.
We next ‘fly” the mission over the simulated sky model, using nominal instrument pointing and spin to generate a set of time-ordered data that includes the modeled cross-polar beam response. An independent mapping pipeline reads the time-ordered archive and solves for the Stokes , , and maps within each synthesized frequency bin. We then subtract the output sky maps from the input model used to generate the simulation to create a set of maps showing the systematic error resulting from the cross-polar beam response. The bottom panel of Figure 11 shows the cross-polar systematic error map in the 250 GHz frequency channel. The cross-polar response creates a systematic error with peak-to-peak amplitude of 4 nK, with rms amplitude 1.5 nK averaged over the full sky. Similar simulations provide estimates for each systematic error term in Table 3. Systematic errors are small compared to the instrument noise.
4 Data Set and Science Goals
PIXIE will map the full sky in absolute intensity and linear polarization (Stokes , , and ) with angular resolution 26 in each of 400 frequency channels 15 GHz wide from 30 GHz to 6 THz. The calibrated spectral data at each frequency will be binned into 49152 sky pixels each 09 in diameter using the HEALPIX pixelization [36]. Typical sensitivities within each mid-latitude pixel are
for Stokes and
for Stokes or . The resulting data set supports a broad range of science goals.
4.1 Inflation
The primary science goal is the characterization of primordial gravity waves from an inflationary epoch through measurement of the CMB B-mode power spectrum. PIXIE will measure the CMB linear polarization to sensitivity of 70 nK per pixel, including the penalty for foreground subtraction. Averaged over the cleanest 75% of the sky, PIXIE can detect B-mode polarization to 3 nK sensitivity, well below the 30 nK predicted from large-field inflation models. The sensitivity is comparable to the “noise floor” imposed by gravitational lensing, and allows robust detection of primordial gravity waves to limit at more than 5 standard deviations.
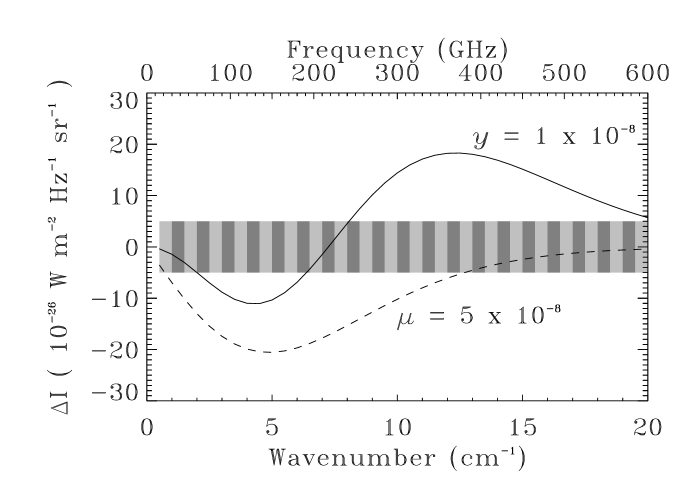
PIXIE also constrains inflationary models through measurements of distortions in the CMB blackbody spectrum. Inflation generates density fluctuations on all physical scales. The largest scales freeze out and later re-enter the particle horizon as the fluctuations observed by WMAP and Planck. On smaller scales, photon diffusion (Silk damping) erases the primordial fluctuations and transfers their energy to the radiation bath. Energy injected to the CMB distorts its spectrum from a blackbody. For energy injected at redshift , the distorted spectrum is characterized by a chemical potential
| (4.1) |
proportional to the fractional energy release to the CMB [37, 38, 39]. PIXIE compares the (monopole) CMB spectrum to a blackbody calibrator with K precision, corresponding to a chemical potential (Fig. 12). Constraints on chemical potential distortions in the CMB spectrum probe the amplitude of matter fluctuations down to physical scales as small as 1 kpc (1 solar mass).
4.2 Dark Matter
The chemical potential of the CMB spectrum provides a limit to any early energy release. Neutralinos are an attractive candidate for dark matter; the annihilation of pairs in the early universe leads to an observable distortion in the CMB. The chemical potential can be estimated as
| (4.2) |
where is the fraction of the total mass energy released to charged particles, is the velocity-averaged annihilation cross section, is the dark matter density, and is the Hubble constant [40, 41]. The dark matter annihilation rate varies as the square of the number density. For a fixed the number density is inversely proportional to the particle mass. The chemical potential distortion is thus primarily sensitive to lower-mass particles. PIXIE will probe neutralino mass range keV to provide a definitive test for light dark matter models [42].
Neutralino models are only one class of potential dark matter candidates. Many supersymmetric models predict that the lightest stable supersymmetric particle is the gravitino, the superpartner of the graviton, rather than the photino (or more generally the neutralino), the superpartner of the photon. Such superWIMP models can yield dark matter densities near the observed value while suppressing dark matter interactions to values well below the weak scale. For dark matter experimentalists, these superWIMP models are a depressing possibility as the gravitino will be undetectable in any foreseeable terrestrial dark matter search.
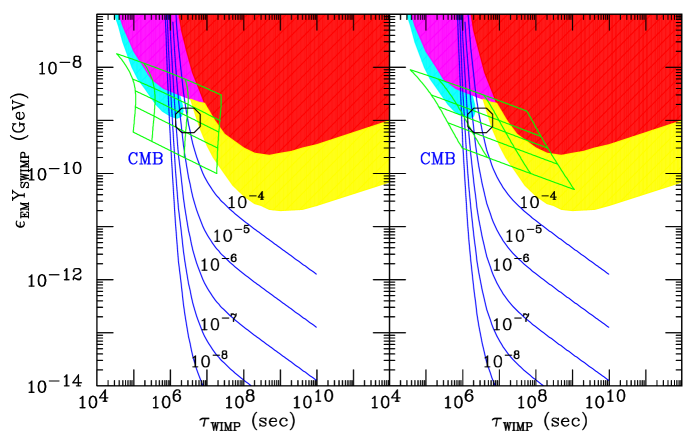
CMB spectral distortions offer a novel probe of supersymmetric physics. The decay of heavier supersymmetric leptons to gravitinos in the early universe also releases energy to Standard Model particles, distorting the CMB blackbody spectrum [43]. Figure 13 shows the amplitude of the resulting chemical potential as a function of the lifetime and electromagnetic energy release for slepton WIMP gravitino superWIMP decay. PIXIE explores an important region of superWIMP parameter space not excluded by any other bound, offering the potential to detect one of the most elusive dark matter candidates.
4.3 Reionization
The ionization history of the universe is our most direct probe of the star formation history at redshifts greater than 7. Theoretical studies [44, 45] suggest our universe may have had a complex star formation history: this signature of the extended ionization history is traced by the E-mode polarization power spectrum on angular scales . In some scenarios [46], early black holes produce low levels of ionization at redshift , while in other scenarios, metal-free Pop III stars partially ionize the universe and suppress further star formation until a delayed second generation of stars finally ionizes the universe [47]. While Planck data will improve existing constraints on the optical depth, Planck is noise-limited at multipoles , the range most sensitive to the details of the star formation history, and can thus test only the most extreme models [48]. PIXIE will make a cosmic variance limited measurement of the E-mode power spectrum at to characterize the ionization history.
Early stars not only ionize the universe but also heat the gas. Microwave background photons inverse Compton scatter off this hot gas to produce a distinctive distortion in the CMB blackbody spectrum. The amplitude of this Compton distortion is characterized by the parameter
| (4.3) |
where , , and are the electron mass, number density, and temperature, is the Thomson cross section, is the CMB radiation temperature, and is Boltzmann’s constant [49]. The resulting distortion depends on both the optical depth and gas temperature ,
| (4.4) |
PIXIE measures the Compton spectral distortion to limit . In combination with PIXIE’s measurement of (observed through the same optics and using the same calibration), PIXIE will determine the temperature of the intergalactic medium to 5% precision at redshift .
The mean temperature of the universe depends sensitively on the ionizing spectrum of the first objects. PIXIE’s precision measurement of the electron temperature will distinguish whether the first stars were “classical” Pop II stars or more exotic objects such as very massive Pop II stars or black holes. No other measurement has such power to determine the nature of the first luminous objects in the universe.
4.4 Star Formation History
The cosmic infrared background (CIB) results from cumulative emission from dusty galaxies since their epoch of formation. It consists of X-ray, UV, and optical emission from stars and active galactic nuclei, absorbed by dust and re-radiated at infrared wavelengths. It therefore provides an integral constraint on the cosmic star formation history of the universe. The CIB arises primarily from galaxies with redshifts between 1 and 2 due to the steeply rising dust spectrum, which cancels the cosmological dimming due to redshift. The absolute emission spectrum as a function of angular scale is sensitive to the entire history of dusty star-forming galaxies [50]. Spatial fluctuations in the CIB should correlate with the integrated Sachs-Wolfe effect and gravitational lensing fluctuations [51]. The combination is a powerful probe of the characteristic mass of star-forming galaxies and the integrated cosmic star formation history. PIXIE’s sensitivity at large angular scales over a broad range of frequencies spanning the peak CIB intensity will complement measurements by Herschel, Planck, and other observatories.
4.5 Interstellar Medium
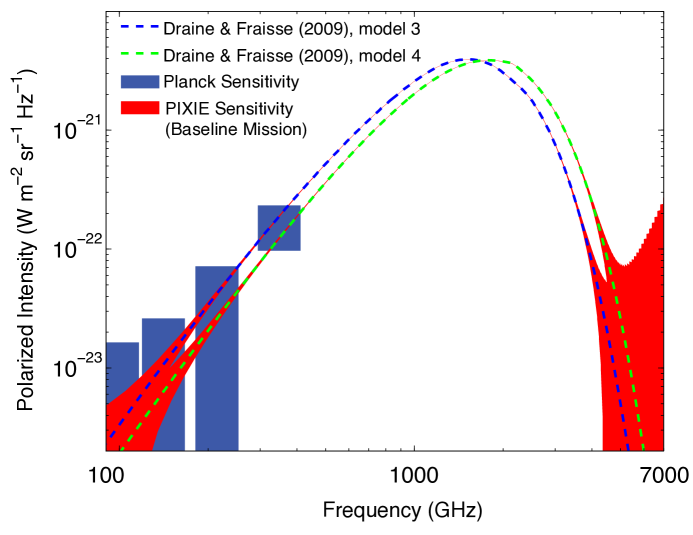
PIXIE’s all-sky spectral cubes provide important insights into the interstellar medium (ISM) within the Galaxy. Thermal emission from dust within our galaxy dominates the far-infrared sky brightness. Dust emission is partially polarized by magnetic alignment of aspherical grains [53]. While there are appealing theories detailing the alignment mechanism and the composition of the aligned grain populations, there is minimal observational evidence available to constrain these theories. PIXIE has both the sensitivity and frequency coverage to distinguish different models of the polarized intensity based on their chemical composition.
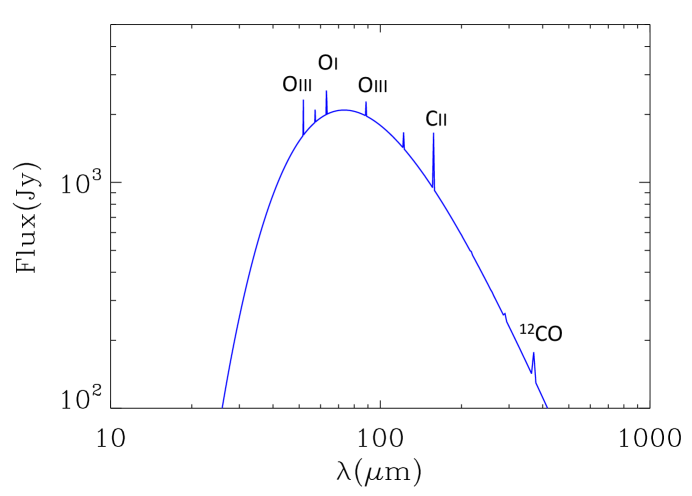
Figure 14 illustrates the sensitivity to dust properties. The polarized intensity of dust emission depends on the chemical composition (silicate vs carbonaceous). PIXIE maps dust polarization at frequencies spanning the peak emission to determine the chemical composition. The resulting full-sky map of the chemical composition of the diffuse dust cirrus provides important insights into the life cycle of dust creation and destruction in the interstellar medium. Physically motivated models of dust emission are also an important tool to subtract the dust foreground from maps of primordial CMB polarization (§3.2).
An important driver of Galactic evolution is the chemical enrichment of the ISM in heavy elements, molecules, and dust. This enrichment is the result of the cumulative contribution of stellar nucleosynthetic processes over the star formation history of the Milky Way. The 50 m to 1 cm spectral region covered by PIXIE contains important lines from atomic, ionized and molecular species, as well as continuum emission from the dust and gas in the ISM. PIXIE observations will thus provide important information for determining the abundances and composition of key elements and the dust in the ISM, the physical conditions of the host ISM phases, and the spatially resolved star formation rate in the Galaxy.
The brightness of the far IR sky is dominated by thermal emission from dust. Figure 15 depicts the Herschel spectrum of the starburst galaxy M82, convolved to the 15 GHz resolution of the PIXIE instrument. PIXIE will provide similar spectra along the line of sight to large star forming complexes and molecular clouds along the galactic plane. Table 4 lists selected emission lines from ionized, neutral and molecular species in the ISM. The lines are organized according to the four major gas phases of the ISM from which they arise:
-
•
hot coronal gas, characterized by densities and temperatures, {n, T} = { cm-3, K}, collisionally ionized and maintained by expanding supernova blast waves;
-
•
HII regions with {n, T} = { cm-3, K}, photoionized by massive OB stars;
-
•
molecular clouds, with {n, T} = { cm-3, K}, heated by cosmic rays and photoelectrons from dust; and
-
•
photodissociation regions (PDRs) which are the interface between the molecular clouds and the ionized gas. Their characteristic density and temperatures are {n, T} = { cm-3, K}, and they are heated by photoelectrons from dust and cosmic rays.
| Molecular | Photodissociation | Hii | Hot ( K) | ||||
|---|---|---|---|---|---|---|---|
| Gas | Regions | Regions | Gas | ||||
| CO | 115 GHz | Feii | 51.3, 87.4 m | Feiii | 51.7 m | Oiii | 51.8 m |
| CO | 231 GHz | Fei | 54.3, 111.2 m | Niii | 57.3 m | Niii | 57.3 m |
| CO | 3438 GHz | Si | 56.3 m | Feii | 87.4 m | Fev | 70.4 m |
| H2O | 22 GHz | Oi | 63.2 m | Feiii | 105.4 m | Oiii | 88.4 m |
| H2O | 183 GHz | Sii | 68.5, 129.7 m | Nii | 121.9 m | ||
| CS | 49 GHz | Oi | 145.5 m | Sii | 129.7 m | ||
| CS | 98 GHz | Cii | 157.7 m | Nii | 205.2 m | ||
| CS | 196 GHz | Ci | 370.4, 609.1 m | ||||
The different phases of the ISM cool by line emission and by continuum emission from dust and gas. In PDRs, the ionization state and intensity of the line emission are determined by the UV flux incident on the PDR, by the density of the gas, and since the gas is heated by photoelectrons ejected from the surface of dust grains, by the composition and size distribution of the dust as well. With its broad wavelength coverage, PIXIE will provide all the necessary information to completely characterize this important phase of the ISM. Line ratios from different excitation levels of the same species serve as important density or temperature diagnostics of the gas. Important density diagnostics include line ratios [Feii] 51 m/87 m, [Fei] 54 m/111 m; [Nii] 122 m/205 m; [Oiii] 52 m/88 m; [Oi] 146 m/63 m; and [Nii] 205 m/122 m. Temperature diagnostics include line ratios [Niii] 57 m/[Nii] 122 m, 205 m; and [Cii] 157 m/[Ci] 370 m, 609 m. Figure 16 depicts how the intensity of the UV radiation field incident on the surface of the PDR, , can be used together with different line ratios to determine the elemental abundances and physical conditions of the PDRs that give rise to the line emission [54].
The density and ionization sources of Galactic Hii regions can be completely characterized by their free-free emission and IR spectrum, both observed by PIXIE through the same optics and with the same calibration. The free-free emission determines the density dependent rate of UV photons required to keep the region ionized. The spectrum of the dust emission is sensitive to metallicity and density of the Hii region. The metallicity of the Hii regions can in turn be derived from their characteristic line emission. By creating template IR spectra for different densities, metalicities,and dust models, we may characterize the dust composition, gas density, and ionizing stellar sources that form the Hii regions. Combined with the thermal dust emission arising from the neutral Hi gas this information will be used to derive the star formation rate along the different lines of sight in the Milky Way.


The characterization of physical conditions within the different gas phases of the ISM requires the decomposition of the continuum IR emission into its different gas phase components. Using the free-free emission maps as proxies for Hii regions, molecular lines as proxies for the molecular gas, and ancillary Galactic 21 cm surveys to trace the atomic gas, PIXIE observations will be correlated with the emissions from these different ISM component. This will enable the decomposition of the thermal dust emission, providing the first detailed determination of the temperature distribution, the abundance and composition of the dust in the different phases of the ISM.
5 Summary
The Primordial Inflation Explorer will measure the intensity and linear polarization of the cosmic microwave background to search for the predicted signature of gravity waves excited during an inflationary epoch in the early universe. It uses a polarizing Michelson interferometer configured as a nulling polarimeter to measure the inflationary signal to the limits imposed by astrophysical and cosmological foregrounds.
PIXIE achieves the sensitivity, frequency coverage, and control of systematic errors needed to characterize the inflationary signal while remaining within the resources of NASA’s Explorer program. Multi-moded optics achieve background-limited sensitivity using only 4 semiconductor bolometers. A Fourier Transform Spectrometer provides 400 synthesized frequency channels each 15 GHz wide from 30 GHz to 6 THz, yielding unprecedented ability to distinguish cosmic from Galactic emission based on their difference frequency spectra. The highly symmetric instrument design and multiple layers of signal modulation spanning 11 orders of magnitude in time provide robust discrimination against systematic errors. Detailed simulations of the entire mission, including data analysis, foreground subtraction, and systematic error contribution, demonstrate sensitivity at 5 standard deviations over the cleanest 75% of the sky.
PIXIE will measure the absolute intensity and linear polarization (Stokes , , and parameters) over the full sky at 26 angular resolution, with typical sensitivity for unpolarized emission and for polarized emission within each of 49152 equal-area pixels and each of 400 spectral channels. The resulting data set provides a rich resource for ancillary science. PIXIE will measure distortions in the CMB blackbody spectrum to test dark matter models and extend the measurement of the scalar index of density perturbations to scales as small as 1 kpc or 1 solar mass. PIXIE measures both the temperature and ionization fraction of the intergalactic medium at redshifts 5–30 to determine the nature of the first luminous objects in the universe. PIXIE data in the far-infrared determine the properties of the diffuse dust cirrus and maps line emission from the molecules and ions that cool the interstellar medium within the Galaxy.
Acknowledgments
Appendix A Optical Signal Path
PIXIE is fully symmetric about the plane bisecting the transfer mirrors (Figure 2). Consider a plane wave incident on the instrument A-side primary mirror,
| (A.1) |
where is in the plane of the diagram, is normal to the page, and is along the direction of propagation. For clarity, we will ignore the term since it is common to all expressions, and denote the amplitude of the field in the and directions as
| (A.2) |
where and . Reflection from a mirror reverses the direction of propagation and flips the sign of the electric field. Reflections from the primary, folding, and secondary mirrors flip the sign three times and route the beam to the FTS. Reflection from the first transfer mirror flips the sign a fourth time. The field after reflection from the first transfer mirror is thus
| (A.3) |
The first polarizing grid transmits the polarization while reflecting . The second left-side transfer mirror collects the beam reflected from the polarizing grid (with a minus sign for the reflection), while the right-side transfer mirror collects the transmitted beam. After reflecting off the second transfer mirror (which induces another sign flip), the fields are
| (A.4) |
where subscripts and refer to the left and right sides of the instrument, respectively. The beams then encounter the second polarizing grid, oriented such that from the point of view of the radiation the wires are at 45∘ from the plane of polarization. Half of each beam is transmitted and half is reflected, imposing a new polarization basis on the radiation which we denote and . The relationship between and coordinate systems is
| (A.5) |
Hence the radiation just before the second polarizer can be described as
| (A.6) |
The wires of the second polarizer are aligned with the vector so that the E fields in the direction are reflected (with a minus sign) while those in the direction are transmitted.
The third transfer mirror mirror on the left side thus collects the reflected () radiation from (with a minus sign) plus the transmitted () radiation from . The third transfer mirror on the right collects transmitted () radiation from plus the reflected () radiation from (with a minus sign). After reflection from the third transfer mirror (which induces another sign flip), the fields become
| (A.7) |
In the original coordinate system we may write this as
| (A.8) |
Note that the second polarizing grid mixes the original polarization states – we began with amplitude oriented along and amplitude oriented along . From Eq. A.8 we now have linear combinations of and along each coordinate axis and .
Each beam then reflects from the dihedral mirror assembly. The dihedral mirror treats the two polarization states differently. The polarization reflects from two faces, generating two canceling negative signs, while the polarization reflects from two faces but also changes direction, resulting in a net change of sign. In addition, the different path length of the left beam with respect to the right beam generates an optical phase delay that depends on the position of the dihedral mirror assembly. The path is shortened on one side but lengthened on the other, creating a total phase delay on one side and on the other side, where is the position of the dihedral mirror assembly. The beams then reflect from the fourth transfer mirror. Including the phase delay, the electric fields after the fourth transfer mirror become
| (A.9) |
or in the rotated coordinate system,
| (A.10) |
The beams then recombine at the third polarizing grid. The phases are different (in general) and will lead to either constructive or destructive interference. The wires in the third polarizer are oriented identically to the second polarizer. Radiation leaving the fourth transfer mirror on the left side () will thus reflect the component to the fifth transfer mirror on the left side (with a minus sign) while transmitting the component to the fifth transfer mirror on the right side. The fifth transfer mirror induces another sign change. The fields after the fifth transfer mirror are thus
| (A.11) |
or in the original coordinate system
| (A.12) |
Re-writing the exponentials as sines and cosines, we obtain
| (A.13) |
The beams then encounter the fourth polarizing grid. The wires of the fourth grid are oriented the same as the first grid, reflecting the component while transmitting . After a final reflection from the sixth transfer mirror, the beams reach the detectors. The electric fields at the detectors from radiation originally incident from the left-side beam are thus
| (A.14) |
PIXIE has 4 detectors, each of which measures a single linear polarization. The detectors are arranged in two pairs. One member of each pair measures the component while the other member measures . The bolometers measure the incident power, which is the square of the electric field:
| (A.15) |
The derivation thus far has ignored radiation incident from the B-side beam. Since PIXIE is fully symmetric, the derivation for radiation from the B-side beam is identical to radiation from the A-side beam. Using the principle of superposition we can combine the results from both sides and all frequencies to obtain the power incident on the bolometers as a function of the dihedral mirror position :
| (A.16) |
where we use notation
Each detector thus measures a DC term plus an interference fringe pattern modulated by the position of the dihedral mirror. Low-frequency noise will render the DC component unusable. The modulated term is proportional to the Fourier transform of the difference spectrum between one linear polarization from one input beam and the orthogonal linear polarization from the other beam.
PIXIE can operate in two modes. With the calibrator stowed, both beams view the same part of the sky. The power on each detector then becomes
| (A.17) |
We may rewrite this in terms of the Stokes parameters
| (A.18) |
to obtain
| (A.19) |
The detected fringe pattern is thus directly proportional to the Fourier transform of the frequency spectrum of the Stokes Q linear polarization of the sky. The spacecraft spin modulates the polarized signal from the sky while leaving the unpolarized component unchanged. The sky signal
| (A.20) |
in sky-fixed coordinates becomes
| (A.21) | |||||
in instrument coordinates , where is the spacecraft rotation angle relating the two coordinate systems. When the calibrator is in the stowed position, we may thus recover the polarization state of the sky as
| (A.22) |
where we have dropped for clarity the constant term (proportional to Stokes I) not modulated by the mirror movement.
The instrument can also operate with a blackbody calibrator blocking one aperture. Assume that the calibrator blocks the A-side beam. The detected power may now be written
The fringe pattern now depends on the difference between the sky signal in one linear polarization and the calibrator signal in the orthogonal polarization. We may write a single linear polarization state as a linear combination of Stokes parameters,
The calibrator is unpolarized so that . As the spacecraft spins, the measured fringe pattern yields the frequency spectrum of the Stokes I, Q, and U parameters from the sky,
| (A.25) |
where we again drop for clarity the constant terms (now proportional to ) not modulated by the mirror movement. Note the factor of two difference for the Stokes Q and U terms between Eqs. A.22 and A.25. When the calibrator is over one beam, the fringe pattern is sensitive to Stokes I, Q, and U. When both beams view the sky, the fringe pattern is only sensitive to linear polarization (Stokes Q and U), but at twice the signal intensity since the instrument now interferes two copies of the sky signal.
The factor of two increase in sensitivity when both beams view the sky is possible because the instrument interferes one linear polarization from one beam with the orthogonal polarization from the other beam. Circularly polarized sky emission would introduce correlations between the orthogonal linear polarization states, but continuum emission at millimeter wavelengths has no significant circular polarization.
Appendix B Noise Budget
Several sources of noise contribute to the total noise budget. The dominant term is statistical noise from the incident photons. The instrument is contained in an emissive cavity maintained at the same temperature as the CMB. For noise from a CMB source we set the emissivity and throughput in Eq. 3.1, since any CMB photon absorbed by the instrument will be replaced by an equivalent photon emitted by the instrument. The etendu in Table 1 refers to the circularized beam truncated by the field and pupil stops. Since each detector views these stops, their emission also contributes to the photon noise. We conservatively assume that the beam stops are at the same 2.725 K temperature as the rest of the optics and increase the effective etendu by a factor 1.27 in Eq. B.1 to account for emission from the beam stops. We numerically evaluate Eq. 3.1, yielding CMB photon noise
| (B.1) |
At sub-millimeter wavelengths, photon noise from the Galactic dust cirrus is non-negligible. We model the mid-latitude dust as a modified greybody,
| (B.2) |
with values , K, , and reference frequency THz [25], where is the Planck function. The instrument cavity does not contribute to the THz photon noise. We thus use optical parameters from Table 1 to obtain
| (B.3) |
where the constant when both apertures are open to the sky and when the calibrator blocks one aperture (cf the factors and in Eqs. A.19 and A.25).
A third source of noise is the intrinsic phonon noise associated with the detector, measured as
| (B.4) |
PIXIE will thus operate with nearly photon-limited noise given by the quadrature sum of the photon and phonon terms,
| (B.5) | |||||
The larger dust signal when the calibrator is stowed increases the photon noise in this configuration. However, the small increase in photon noise is compensated by a doubling of the sky signal, so that the overall system sensitivity improves when the calibrator is stowed (Eqs. 3.4 and 3.5).
Photon noise from the CMB is isotropic on the sky, but the contribution from dust will vary with position. Equation B.3 uses the mean dust amplitude for Galactic latitude . The sensitivity will be slightly better in regions of low dust signal and slightly worse near the Galactic plane. Note that the sharp edges of the PIXIE tophat beam minimize spillover of Galactic plane emission to higher latitudes.
The detector noise and sampling determine the noise in the time-ordered data. The data taken as the mirror moves from one end of its throw to the other end constitutes a single interferogram, which we Fourier transform to derive the difference spectrum between the two beams. We assume each interferogram uses samples and define the forward Fourier transform as
| (B.6) |
where is a time-ordered sample and denotes frequency. The noise in each time-ordered sample is
| (B.7) |
where ms is the integration time per sample and the factor of 2 accounts for the Nyquist sampling between the frequency and time domains. The noise from different time-ordered bins is uncorrelated and will add incoherently in the FFT, while the signal is correlated and adds coherently. The RMS noise in a single bin of the Fourier transform is thus
| (B.8) |
where is the number of discrete frequencies in the FFT. Assume we observe the sky for a time corresponding to a single interferogram (physical movement of the mirror from one endpoint through the null to the other endpoint). If there are samples per interferogram then each sample is observed for a total integration time . The noise in each bin of the FFT derived from a single interferogram for each detector then becomes
| (B.9) |
independent of the number of frequency bins. This result is independent of the choice of normalization in the Fourier transform. If we instead adopted the reverse transform , we would obtain an additional compensating factor of when deriving the sky signal in Eq. 3.3.
| Orbit | Optical | Physical | Samples | Strokes |
|---|---|---|---|---|
| Number | Delay | Stroke | per Stroke | per Spin |
| 1 & 2 | 10 mm | 2.6 mm | 1024 | 8 |
| 3 & 4 | 8.9 mm | 2.3 mm | 910 | 9 |
| 5 & 6 | 8.0 mm | 2.1 mm | 819 | 10 |
| 7 & 8 | 6.7 mm | 1.7 mm | 683 | 12 |
| 9 & 10 | 5.0 mm | 1.3 mm | 512 | 16 |
| 11 & 12 | 3.3 mm | 0.9 mm | 341 | 24 |
The sky signal is split among the 4 detectors, effectively increasing the noise by a factor of 4. When the calibrator is stowed, the instrument interferes two copies of the sky signal, gaining back a factor of 2 (cf the factors and in Eqs. A.22 and A.25). In addition, the raw interferograms are a linear combination of polarized and unpolarized sky signal. We Fourier transform the interferogram from a single detector and bin the resulting spectrum by spacecraft rotation angle , to fit for the Stokes , , and parameters in each sky pixel. The or basis functions increase the noise for the fitted Q or U parameters by a factor .
If the instrument throughput were independent of frequency, the noise in the specific intensity spectra would also be independent of frequency. Several factors reduce the throughput at high frequencies. The beams within the FTS are not plane waves but use collimating optics with half-angle 65. The resulting dispersion causes loss of fringe coherence at short wavelengths. The optical polarizers use wire grids, which become inefficient in reflection at wavelengths shorter than twice the 30 m wire pitch, resulting in a loss of fringe amplitude. We model this as a single-pole filter with knee at twice the grid pitch. There are 4 identical grids, resulting in a 4-pole low-pass filter. A separate low-pass filter with a knee at 100 m blocks short-wavelength zodiacal emission to prevent radiation at frequencies beyond the highest synthesized spectral channel from affecting the photon noise budget. Finally, the doped silicon absorbing structure on the polarization-sensitive bolometers loses efficiency at short wavelengths. We model this as an additional low-pass filter with knee at 60 m. All sensitivity estimates include these low-pass filters. The primary effect is to limit the effective spectral range of the instrument. Although the synthesized spectra have 512 channels to a maximum of 7665 GHz, channels at frequencies above 6 THz (wavelength 50 m) will have little sensitivity to sky signal.

Appendix C Fourier Apodization
A Fourier transform uniformly sampled from -1 to +1 has sharp edges at 1, leading to ringing in the frequency domain. In addition, the CMB only produces fringes near zero path length — observations at longer optical path, necessary to provide sufficiently narrow frequency bins, have little CMB signal and contribute little to the CMB sensitivity. We minimize ringing and maximize sensitivity by varying the mirror stroke to apodize the Fourier transform. This softens the edges in the position domain by spending less time observing at large optical path length, while maximizing CMB sensitivity by spending more time observing CMB fringes near the optical null. A commonly used apodization is . We approximate this apodization by varying the mirror stroke length on successive orbits. PIXIE observes the sky from a polar sun-synchronous orbit. The orbit plane precesses 1∘ per day, so that a pixel near the celestial equator is visible for at least 13 consecutive orbits. Each orbit uses a different mirror stroke length, ranging from shortest stroke mm (optical path length mm) to a longest stroke mm (optical path length mm). Table 5 summarizes the mirror stroke pattern. The resulting apodization closely approximates the ideal (Figure 17). Optical paths near zero delay are observed much more often than paths at large delay, and have correspondingly smaller noise, while optical paths at large phase delay are seldom observed and have larger noise. Simulations of the Fourier transform using this non-uniform noise pattern show noise in the Fourier transform to be smaller by a factor 0.73 compared to simulations with the equivalent integration time and no apodization.
References
- [1] V.A. Rubakov, M. Sazhin, and A. Varyaskin, Graviton Creation In The Inflationary Universe And The Grand Unification Scale, Phys Lett B 115 (1982) 189
- [2] R. Fabbri and R. Pollock, R., The Effect of Primordially Produced Gravitons upon the Anisotropy of the Cosmological Microwave Background Radiation, Physical Letters B 125 (1983) 445
- [3] L. Abbott and M. Wise, Constraints on Generalized Inflationary Cosmologies, Nuclear Physics B 244 (1984) 541
- [4] A. G. Polnarev, Polarization And Anisotropy Of The Relic Radiation, Induced By Cosmological Gravitational-Waves, Astronomicheskii Zhurnal 62 (1985) 1041
- [5] R. Davis et al., Cosmic Microwave Background Probes Models of Inflation, Physical Review Letters 69 (1992) 1856
- [6] L. P. Grishchuk, Cosmological Perturbations of Quantum-Mechanical Origin and Anisotropy of the Microwave Background, Physical Review Letters 80 (1993) 2371
- [7] M. Kamionkowski, A. Kosowsky, and A. Stebbins, Statistics of Cosmic Microwave Background Polarization, Physical Review D 55 (1997) 7368
- [8] U. Seljak, and M. Zaldarriaga, Signature of Gravity Waves in the Polarization of the Microwave Background, Physical Review Letters 78 (1997) 2054
- [9] M. S. Turner and M. White, Dependence of inflationary reconstruction upon cosmological parameters, Physical Review D 53 (1996) 6822
- [10] E. Komatsu et al., Five-Year Wilkinson Microwave Anisotropy Probe Observations: Cosmological Interpretation, Astrophysical Journal Supplement Series 180 (2009) 330
- [11] J. Bock, et al., Task Force on Cosmic Microwave Background Research (2006) astro-ph/0604101
- [12] J. Dunkley, et al., Prospects for Polarized Foreground Removal, AIP Conference Proceedings 1141 (2009) 222, arXiv:0811.3915
- [13] S. Dodelson, et al., The Origin of the Universe as Revealed Through the Polarization of the Cosmic Microwave Background, Astro2010: The Astronomy and Astrophysics Decadal Survey White Paper 67 (2009) arXiv:0902.3796
- [14] E. J. Wollack, et al., Electromagnetic And Thermal Properties Of A Conductively Loaded Epoxy, International Journal of Infrared and Millimeter Waves 29 (2008) 51
- [15] J. C. Mather, The Cosmic Background Explorer (COBE), Optical Engineering 21 (1982) 769
- [16] J. C. Mather, et al., A preliminary measurement of the cosmic microwave background spectrum by the Cosmic Background Explorer (COBE) satellite, The Astrophysical Journal Letters 354 (1990) L37
- [17] J. C. Mather, D. J. Fixsen, and R. A. Shafer, Design for the COBE far-infrared absolute spectrophotometer (FIRAS), Society of Photo-Optical Instrumentation Engineers (SPIE) Conference Series 2019 (1993) 168
- [18] J. P.Filippini, et al., SPIDER: a balloon-borne CMB polarimeter for large angular scales, Society of Photo-Optical Instrumentation Engineers (SPIE) Conference Series 7741 (2010) 77411N
- [19] B. Reichborn-Kjennerud, et al., EBEX: a balloon-borne CMB polarization experiment, Society of Photo-Optical Instrumentation Engineers (SPIE) Conference Series 7741 (2010) 77411C
- [20] D. T. Chuss, et al., The Primordial Inflation Polarization Explorer (PIPER), Society of Photo-Optical Instrumentation Engineers (SPIE) Conference Series 7741 (2010) 7741P
- [21] J. C. Mather Bolometer noise: nonequilibrium theory, Applied Optics 21 (1982) 125
- [22] A. Fraisse, et al., CMBPol Mission Concept Study: Foreground Science Knowledge and Prospects, 2008, arXiv:0811.3920
- [23] C. L. Bennett, et al., Preliminary Separation of Galactic and Cosmic Microwave Emission for the COBE Differential Microwave Radiometer, The Astrophysical Journal Letters 396 (1992) L7
- [24] C. L. Bennett, et al., First-Year Wilkinson Microwave Anisotropy Probe (WMAP) Observations: Foreground Emission, The Astrophysical Journal Supplement Series 148 (2003) 97
- [25] D. P. Finkbeiner, M. Davis, and D. J. Schlegel, Extrapolation of Galactic Dust Emission at 100 Microns to Cosmic Microwave Background Radiation Frequencies Using FIRAS, The Astrophysical Journal 524 (1999) 867
- [26] R. Hildebrand and L. Kirby, Polarization of FIR/Sub-mm Dust Emission, ASP Conference Series 309 (2004) 515
- [27] W. Hu, M. M. Hedman, and M. Zaldarriaga, Benchmark parameters for CMB polarization experiments, Physical Review D 67 (2003) 043004
- [28] E. Carretti, et al., Antenna instrumental polarization and its effects on E- and B-modes for CMBP observations, Astronomy and Astrophysics 420 (2004) 437
- [29] M. Shimon, et al., CMB polarization systematics due to beam asymmetry: Impact on inflationary science, Physical Review D 77 (208) 083003
- [30] C. J. Mactavish, et al., Spider Optimization: Probing the Systematics of a Large-Scale B-Mode Experiment, The Astrophysical Journal 689 (2008) 655
- [31] M. L. Brown, et al., Impact of modulation on CMB B-mode polarization experiments, Monthly Notices of the Royal Astronomical Society 397 (2009) 634
- [32] N. J. Miller, M. Shimon, and B. G. Keating, CMB polarization systematics due to beam asymmetry: Impact on cosmological birefringence, Physical Review D 79 (2009) 103002
- [33] Y. D. Takahashi, et al., Characterization of the BICEP Telescope for High-precision Cosmic Microwave Background Polarimetry, The Astrophysical Journal 711 (2010) 1141
- [34] J. Bock, et al., Study of the Experimental Probe of Inflationary Cosmology (EPIC)-Intemediate Mission for NASA’s Einstein Inflation Probe, arXiv:0906.1188 (2009)
- [35] D. T. O’Dea, et al., Spider Optimization II: Optical, Magnetic and Foreground Effects, The Astrophysical Journal, submitted (2011), arXiv:1102.0559
- [36] K.M. Górski, et al., HEALPix: A Framework for High-Resolution Discretization and Fast Analysis of Data Distributed on the Sphere, The Astrophysical Journal 622 (2005) 759
- [37] C. Burigana, L. Danese, and G.F. De Zotti, Formation and Evolution of Early Distortions of the Microwave Background Spectrum: A Numerical Study, Astronomy and Astrophysics 246 (1991) 49
- [38] R. Daly, Spectral Distortions of the Microwave Background Radiation Resulting from the Damping of Pressure Waves, The Astrophysical Journal 371 (1991) 14
- [39] W. Hu, D. Scott, and J. Silk, Power Spectrum Constraints From Spectral Distortions In The Cosmic Microwave Background, The Astrophysical Journal Letters 430 (1994) L5
- [40] J. Silk and A. Stebbins, Decay of long-lived particles in the early universe, The Astrophysical Journal 269 (1983) 1
- [41] P. McDonald, et al., Cosmic microwave background constraint on residual annihilations of relic particles, Physical Review D 63 (2001) 023001
- [42] H. J. de Vega and N. G. Sanchez, Model-independent analysis of dark matter points to a particle mass at the keV scale, Monthly Notices of the Royal Astronomical Society 404 (2010) 885
- [43] J. L. Feng, A. Rajaraman, and F. Takayama, Superweakly interacting massive particle dark matter signals from the early Universe, Physical Review D 68 (2003) 063504
- [44] R. Barkana and A. Loeb, The Physics and Early History of the Intergalactic Medium, Reports on Progress in Physics 70 (2007) 627
- [45] A. Meiksin, The Physics Of The Intergalactic Medium, Review of Modern Physics 81 (2007) 1405
- [46] M. Ricottie, J. P. Ostriker, and K. J. Mack, Effect Of Primordial Black Holes On The Cosmic Microwave Background And Cosmological Parameter Estimates, The Astrophysical Journal 680 (2008) 829
- [47] R. Cen, The Universe Was Reionized Twice, The Astrophysical Journal 591 (2003) 12
- [48] P. Mukherjee and A. Liddle, Planck And Re-Ionization History: A Model Selection View, Monthly Notices of the Royal Astronomical Society 389 (2008) 231
- [49] Ya. B. Zeldovich and R. A. Sunyaev, The Interaction of Matter and Radiation in a Hot-Model Universe, Astrophysics and Space Science 4 (1969) 301
- [50] L. Knox, et al., Probing Early Structure Formation with Far-Infrared Background Correlations, The Astrophysical Journal 550 (2001) 7
- [51] A. Cooray, et al., The Herschel-SPIRE Legacy Survey (HSLS): the scientific goals of a shallow and wide submillimeter imaging survey with SPIRE, arXiv:1007.3519 (2010)
- [52] B. T. Draine and A. A. Fraisse, Polarized Far-Infrared and Submillimeter Emission from Interstellar Dust, The Astrophysical Journal 696 (2009) 1
- [53] A. Lazarian, Tracing magnetic fields with aligned grains, Journal of Quantitative Spectroscopy and Radiative Transfer 106 (2007) 225
- [54] M. J. Kaufman, et al., Far-Infrared and Submillimeter Emission from Galactic and Extragalactic Photodissociation Regions, The Astrophysical Journal 527 (1999) 795