Long baseline experiments with LOFAR
Abstract:
I present first results of LOFAR observations with international baselines. An important cornerstone was the detection of the first long-baseline fringes. Their analysis turns out to be extremely useful to investigate and solve a number of technical issues of the instrument. Crude maps of the sky are created from single-baseline delay/fringe-rate spectra and compared with a short-baseline synthesis map. First long-baseline LBA images are shown of the source 3C196, a bright quasar whose sub-components can only be resolved with the long baselines. The corresponding sub-arcsec HBA image does not show the same amount of details yet, but HBA results are expected to improve significantly very soon. The LBA long-baseline image of 3C196 comprises the highest-resolution radio map ever produced at this low frequency.
1 Introduction
The Low Frequency Array (LOFAR) will soon consist of 30–40 stations in the Netherlands plus international stations in Germany, France, England, Sweden and hopefully also Italy, Poland, Spain and other countries. Currently the only available international stations are all in Germany: Effelsberg near Bonn, Tautenburg near Jena, Unterweilenbach near Munich and Bornim near Potsdam.
LOFAR will offer wide fields of view, observations with several independent beams (in different directions) and a high survey speed. Two subsystems cover a frequency range between about 10 and 250 MHz. The Low Band Antennas (LBA) are used for 10–80 MHz (only 30–80 will be used regularly because of strong RFI at lower frequencies), and the High Band Antennas (HBA) for 110–250 MHz. The FM band is excluded intentionally.
On long baselines, sub-arcsec resolution will be possible even in the LBA band, which opens an entirely new parameter space for radio observations. Because of the high number of stations, full synthesis imaging is possible.
2 Resolution
The main motivation for international baselines is the possibility to reach much higher resolutions than with Dutch stations alone. One exciting application of LOFAR surveys is the search for gravitational lenses [4]. These objects can be identified directly from the survey data provided that sub-arcsec resolution can be achieved. The reliability of this identification and thus the efficiency of lens surveys depends strongly on the resolution and the sensitivity on long baselines. The resolution that can be achieved with LOFAR is shown in Tab. 1 as a function of frequency and baseline length.
| freq/MHz | m | 1 km | 30 km | 300 km | 1000 km |
|---|---|---|---|---|---|
| 10 | 30 | 17 | 34 | 21′′ | 62 |
| 30 | 10 | 34′ | 11 | 69 | 21 |
| 80 | 3.8 | 13′ | 26′′ | 26 | 077 |
| 120 | 2.5 | 86 | 17′′ | 17 | 052 |
| 160 | 1.9 | 64 | 13′′ | 13 | 039 |
| 220 | 1.5 | 47 | 94 | 094 | 028 |
3 International stations available for this work
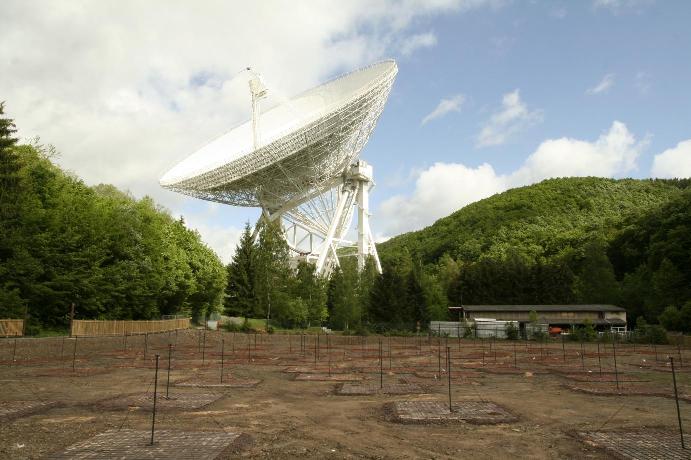
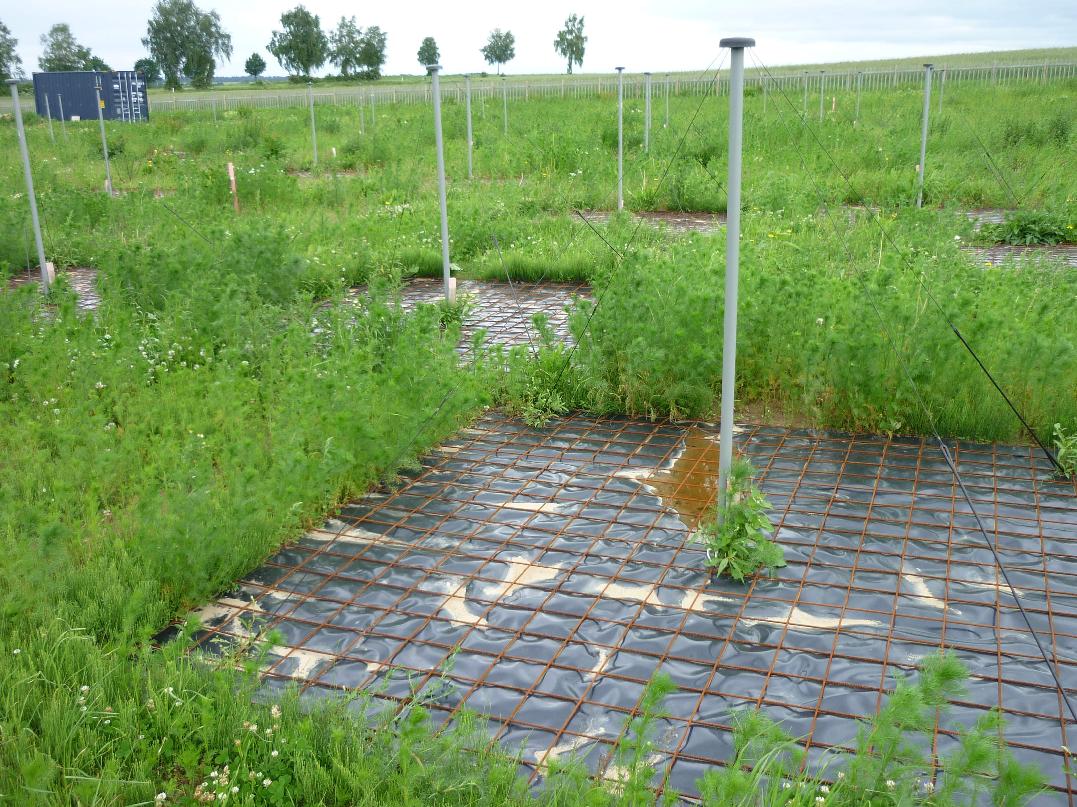
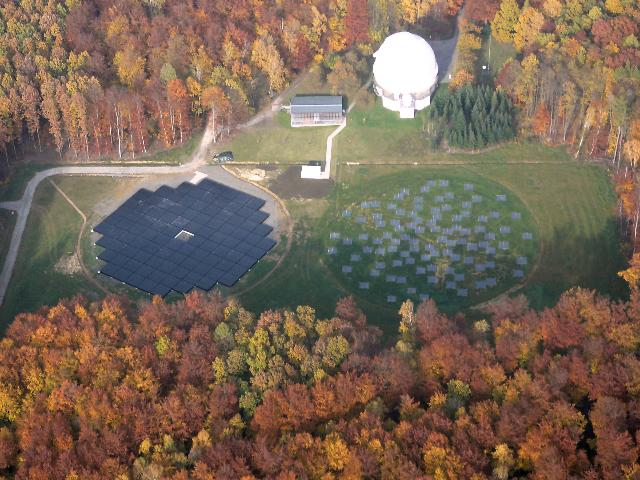
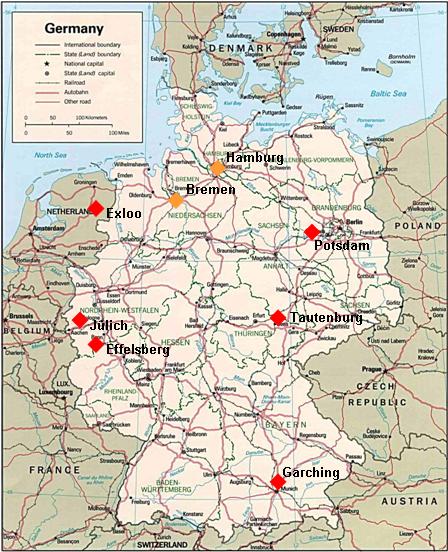
For the observations described here, only the international stations in Effelsberg, Tautenburg and Unterweilenbach were used (see Fig. 1). Bornim was still waiting for its network connection, and stations in other countries were not constructed yet.
The baseline lengths between the Dutch core and German stations are about 300 km (Effelsberg), 400 km (Tautenburg) and 600 km (Unterweilenbach), compare Fig. 2.
4 Long baseline issues
A major issue on long baselines is the fact that the majority of sources will at least be partially resolved so that the signal weakens considerably on longer baselines. This is also true for calibrator sources so that the number of good calibrators is reduced.
In order to achieve a sufficient signal-to-noise ratio () not only for imaging, but in the first instance for the calibration, the data have to be (implicitly or explicitly) averaged in time and frequency. In order to do that, the dependence of phases on time and frequency has to be taken into account. Delays (proportional to derivatives of phase with respect to frequency) and rates (derivatives of phase with respect to time) have to be fitted and corrected for. In Very Long Baseline Interferometry (VLBI), this technique is known as fringe-fitting and is applied on a regular basis.
In the context of LOFAR, with the very low frequencies and very large fractional bandwidth, the procedure is considerably more complicated than in standard VLBI observations, because one has to distinguish between non-dispersive and dispersive delays. Non-dispersive delays ( independent of ) are due to clock offsets and errors in positions of stations and sources, while dispersive delays () are caused by the ionosphere. Generally it turns out that both are important. We find that the clock offsets can be much larger than the ionospheric delays (sometimes many sec when the clock synchronisation fails), but they tend to be constant with time and are thus easier to correct. Ionospheric delays of several nsec are often observed on long baselines at frequencies around 50 MHz. Both effects have to be taken into account when averaging over several subbands.
At the moment, fringe-fitting is only partly implemented in own software. I can fit both kinds of delays on individual baselines. Because the dispersion is not significant over a single subband, FFTs can be used within the subbands. Interpolated results of that are combined coherently over all subbands to determine multi-band coherent delay solutions.
With the wide bands, the rates have to be treated as delay rates instead of phase rates, because the latter would be frequency dependent both for dispersive and non-dispersive delays. The software thus fits four parameters (plus a phase) for blocks of data that typically extend over 10–60 sec in time and up to 48 MHz in frequency.
In addition it is found, not unexpectedly, that differential Faraday rotation between the stations is generally significant at lower frequencies and on long baselines. This means that the XX and YY correlations are not sufficient to determine Stokes I, because parts of the signal are shifted to the mixed correlations XY and YX. Finally the imaging on long baselines is much more difficult than for the Dutch array alone, because the coverage is much more sparse.
5 First long-baseline fringes
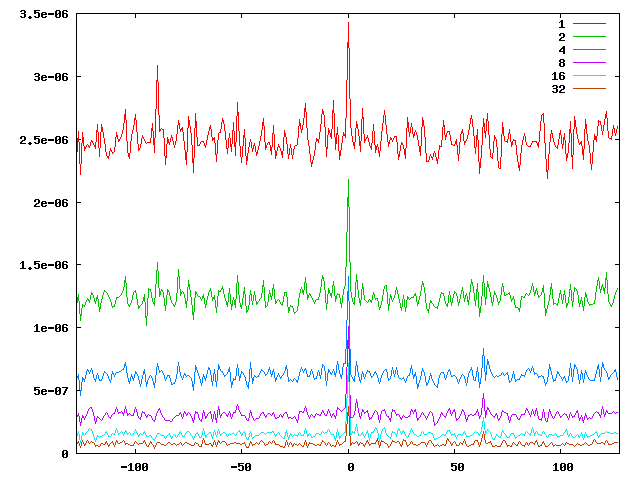
Shortly after others had seen hints of short periods of consistent phases on LBA observations of 3C196 that included the station Effelsberg, I started a more systematic search for fringes in the parameter space of delay and rate. For the first attempt in August 2009, data of one subband were coherently averaged over short intervals, then Fourier transformed on the frequency axis to obtain delay spectra, and the power was averaged (incoherently) over one hour to increase the . Results are shown in Fig. 3.
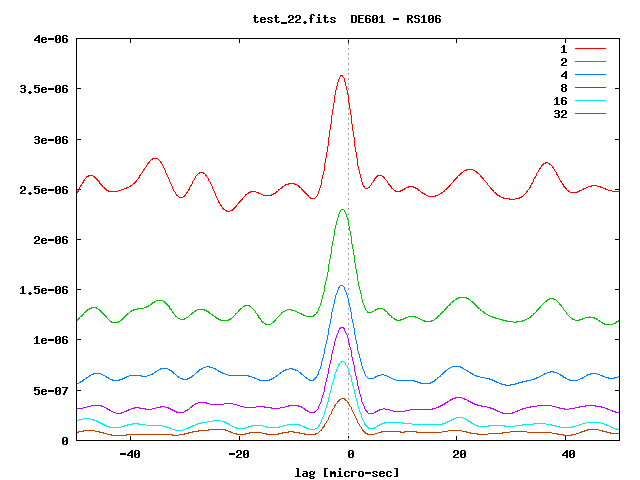
The clear peak in the delay spectra near a lag of 0 did not convince everybody at that time, because other effects may mimic real fringes caused by a sky signal, particularly if the peak is at exactly zero delay. Plotting the spectra with higher resolution revealed that the peak is in fact offset by about one sec.
A more systematic analysis followed in which the time-dependence was explicitly taken into account by scanning a two-dimensional (and finally four-dimensional) parameter space of delay and rate. See Fig. 4 for the first single-band and multi-band results, again for observations of 3C196.
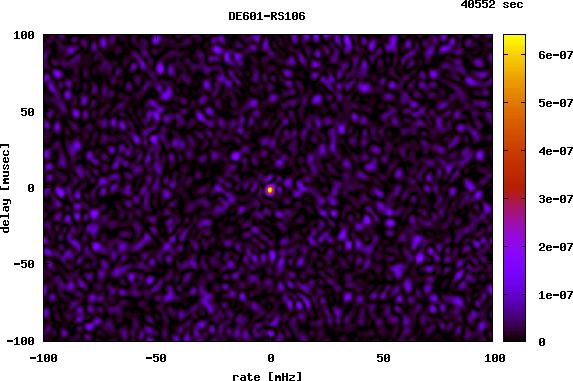
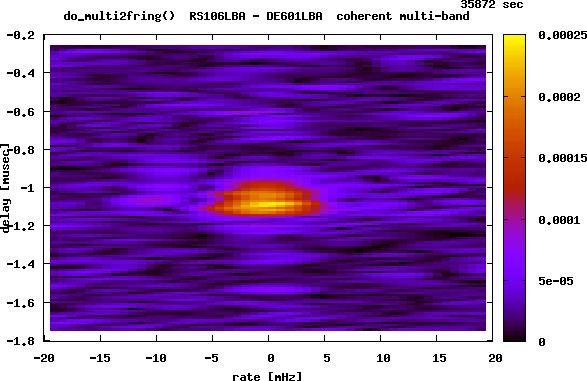
This analysis started on the short baselines, where the strongest fringes were surprisingly found for delays and rates far from zero and of the same order of magnitude as the total geometric delays and rates. It was first thought that the delay tracking did not work properly, but then I found that the stronger fringes are coming from other bright sources like Cygnus A or Cassiopeia A. Their signal, leaking in through high-order sidelobes of the station beam, can be stronger than the target signal even if they are more than 90∘ away from the station beam centre.
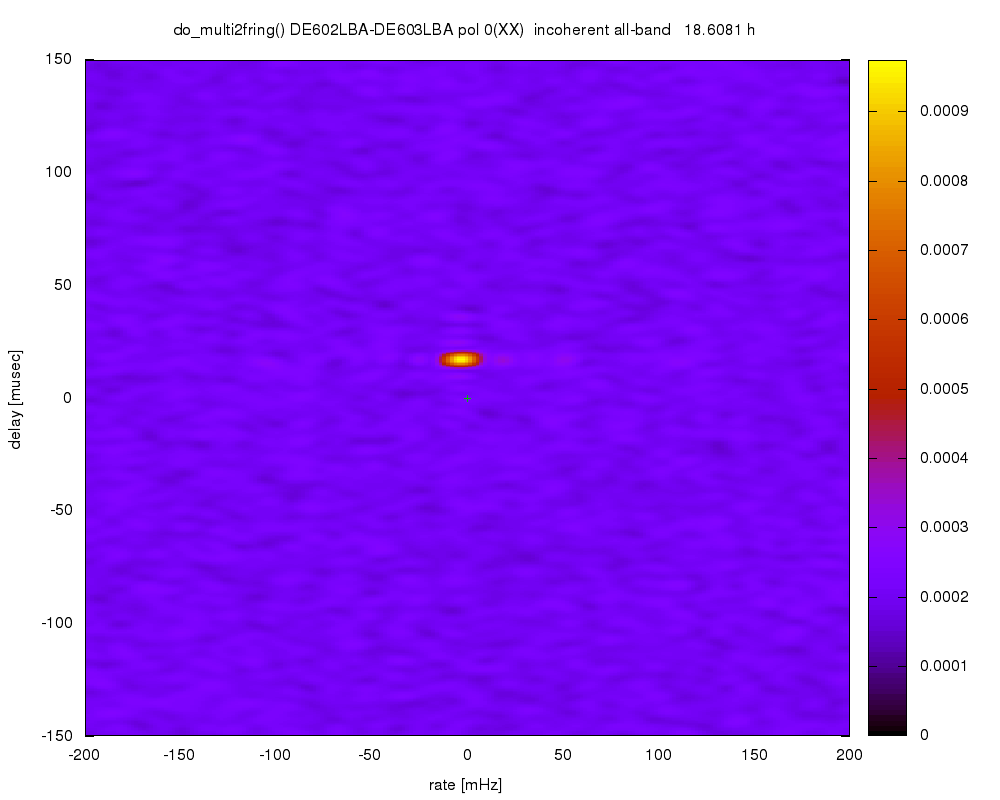
The next two German stations coming online were Tautenburg and Unterweilenbach with first LBA observations in January 2010. Shortly thereafter I detected fringes to Tautenburg, then to Unterweilenbach and finally even between pairs of German stations. The first fringes between Tautenburg and Unterweilenbach are shown in Fig. 5.
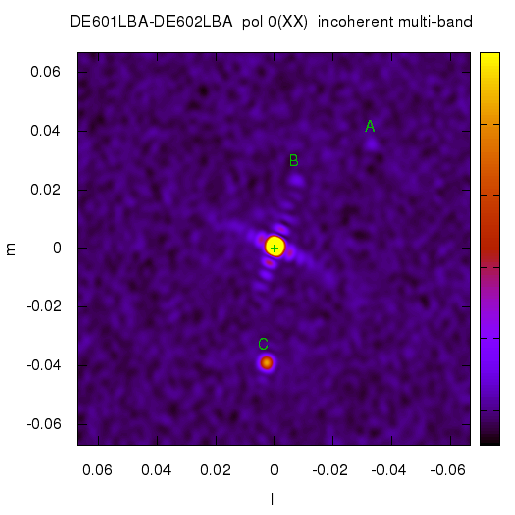
Applying the elementary geometry of the Earth rotation, I transformed delay/rate values to sky position and in this way (after averaging over a short period) produced a delay/fringe-rate map of the field around 3C196 using data from only one baseline (see Fig. 6). Besides the target 3C196, three other sources can be seen more or less clearly.
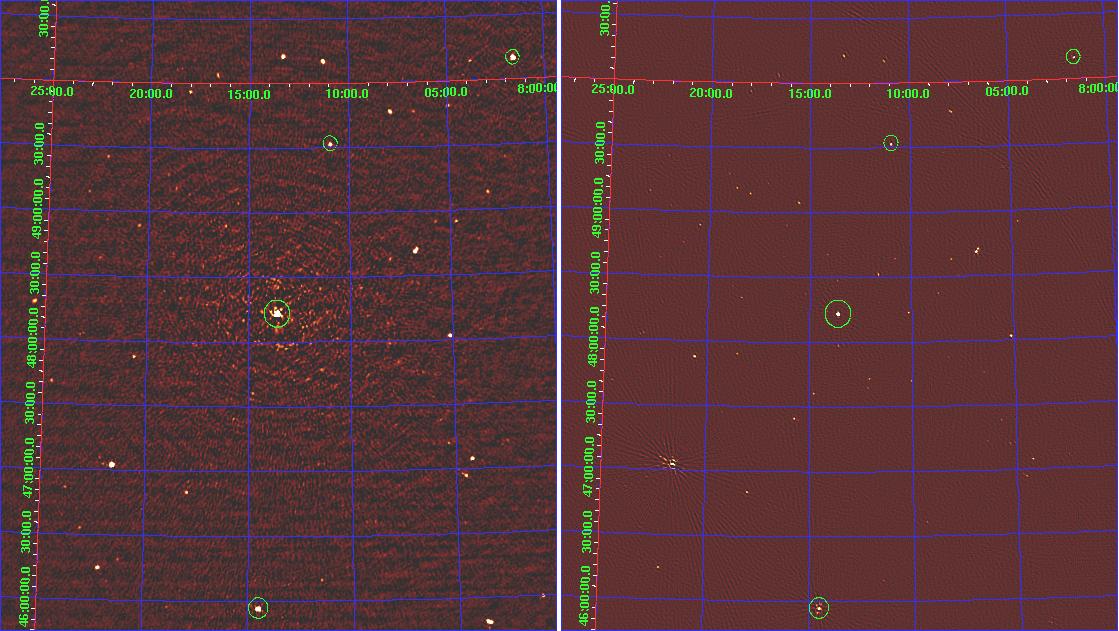
For comparison, a wide-field synthesis map was produced using only Dutch baselines. Fig. 7 shows the result and a VLSS map of the same field.
6 Results from fringe-analysis
The most important result is the clear detection of fringes in long-baseline LBA observations. In addition a number of technical issues were found in the course of this analysis. Among them are the relatively large clock offsets in German stations, some confusion about the labelling of LBA polarisations under certain circumstances, a strong 8 MHz ripple that resulted from accidentally disabling the cable-length compensation in the beam forming, the detection of strong differential Faraday rotation and an independent detection of a resonance near 63 MHz.
Most of these problems have been fixed later. The independent long-baseline analysis contributed significantly to that process, even though this was not the primary intention of my efforts.
7 First long-baseline maps: LBA
For the first serious long-baseline imaging attempt, a 6 h observation on the target 3C196 on 12/13th Feb 2010 (data set D2010_16704) was used. Five Dutch and three German stations (Effelsberg, Unterweilenbach and Tautenburg) produced a wide range of baselines lengths. Only a fraction of the 160 subbands (30–80 MHz with small gaps) showed a strong signal because of the aforementioned 8 MHz ripple. In the first attempts, only the good subbands were used, later the weaker ones were included, too.
In the analysis I first corrected for the sec and sec clock offsets in Effelsberg and Tautenburg, applied some flagging, then converted the XX/XY/YX/YY polarisation combinations to circular RR/RL/LR/LL in order to avoid differential Faraday rotation, averaged somewhat in time and frequency, and then finally imaged and self-calibrated RR and LL in AIPS and difmap. For the final maps produced with difmap, Gaussian components with variable spectral indices were fitted to the data in order to correct the MFS (multi frequency synthesis) imaging for spectral index variations.
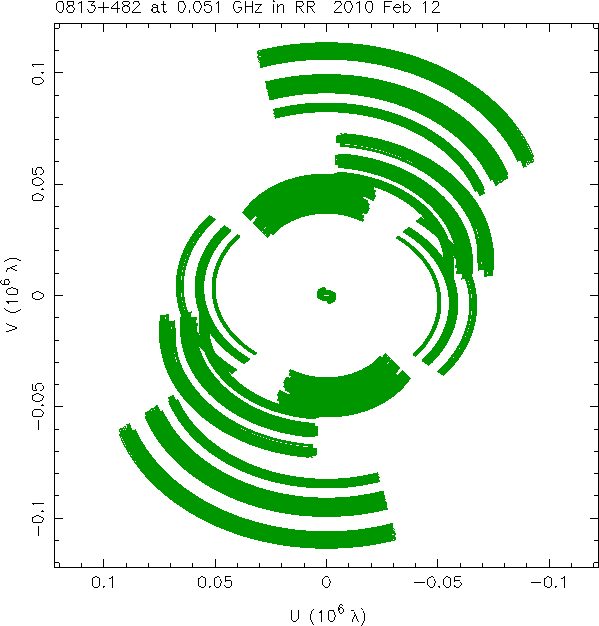
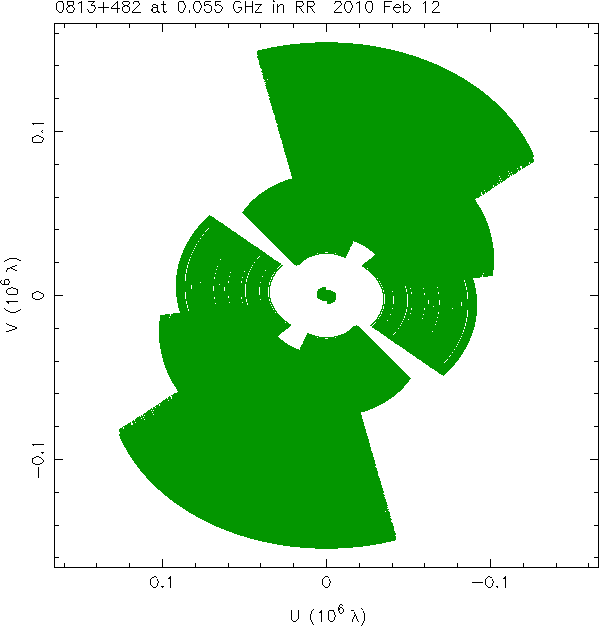
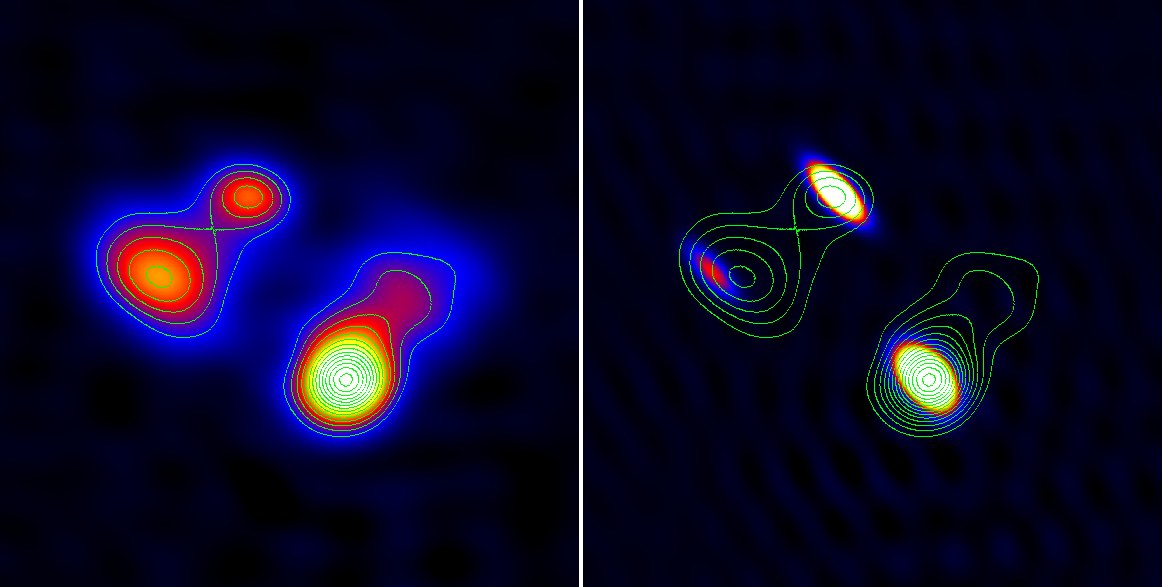
The coverage is shown in Fig. 8. The expected appearance of the source and the very first LOFAR images are shown in Fig. 9. To my surprise, about four instead of the expected two components showed up in the images. However, the inspection of 408 MHz MTRLI (MERLIN) observations revealed a very similar structure (see Fig. 11).
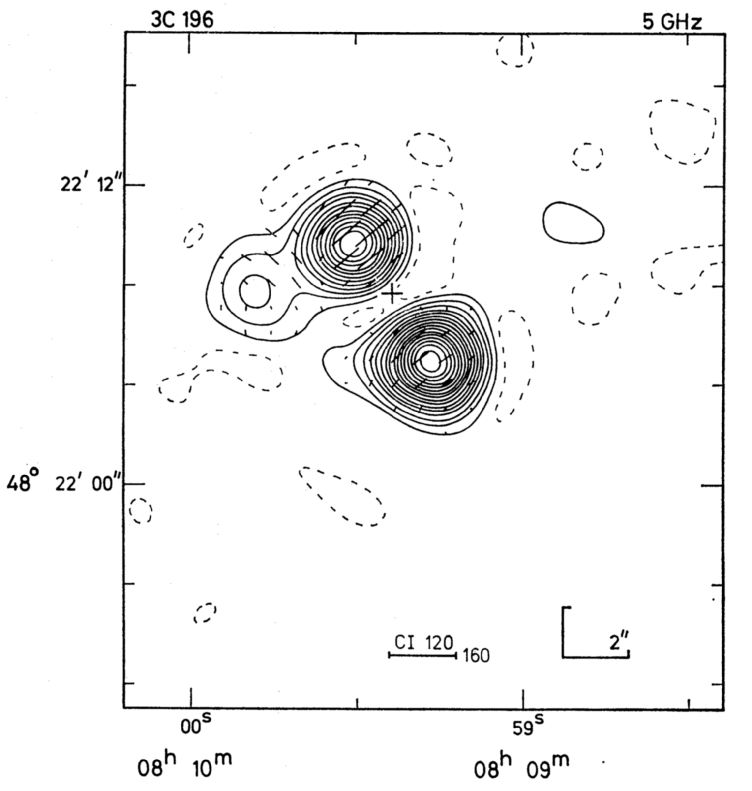
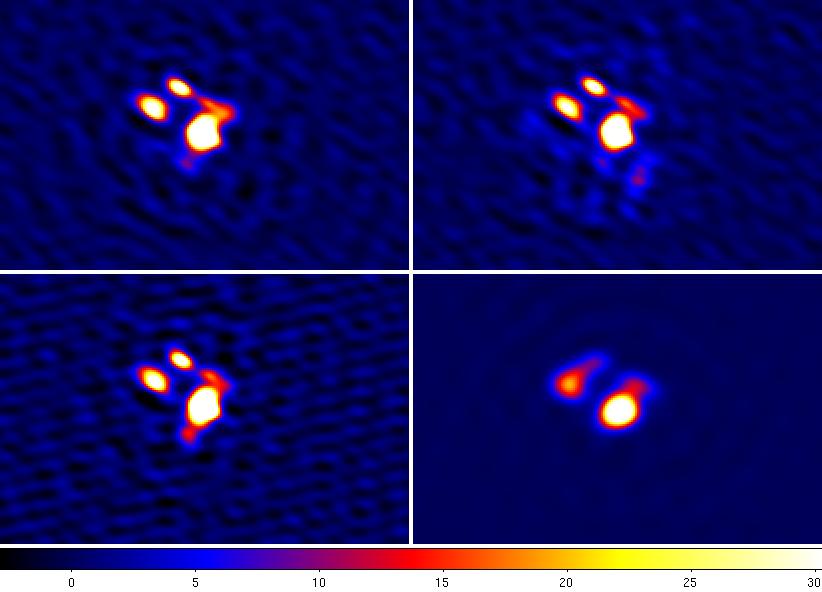
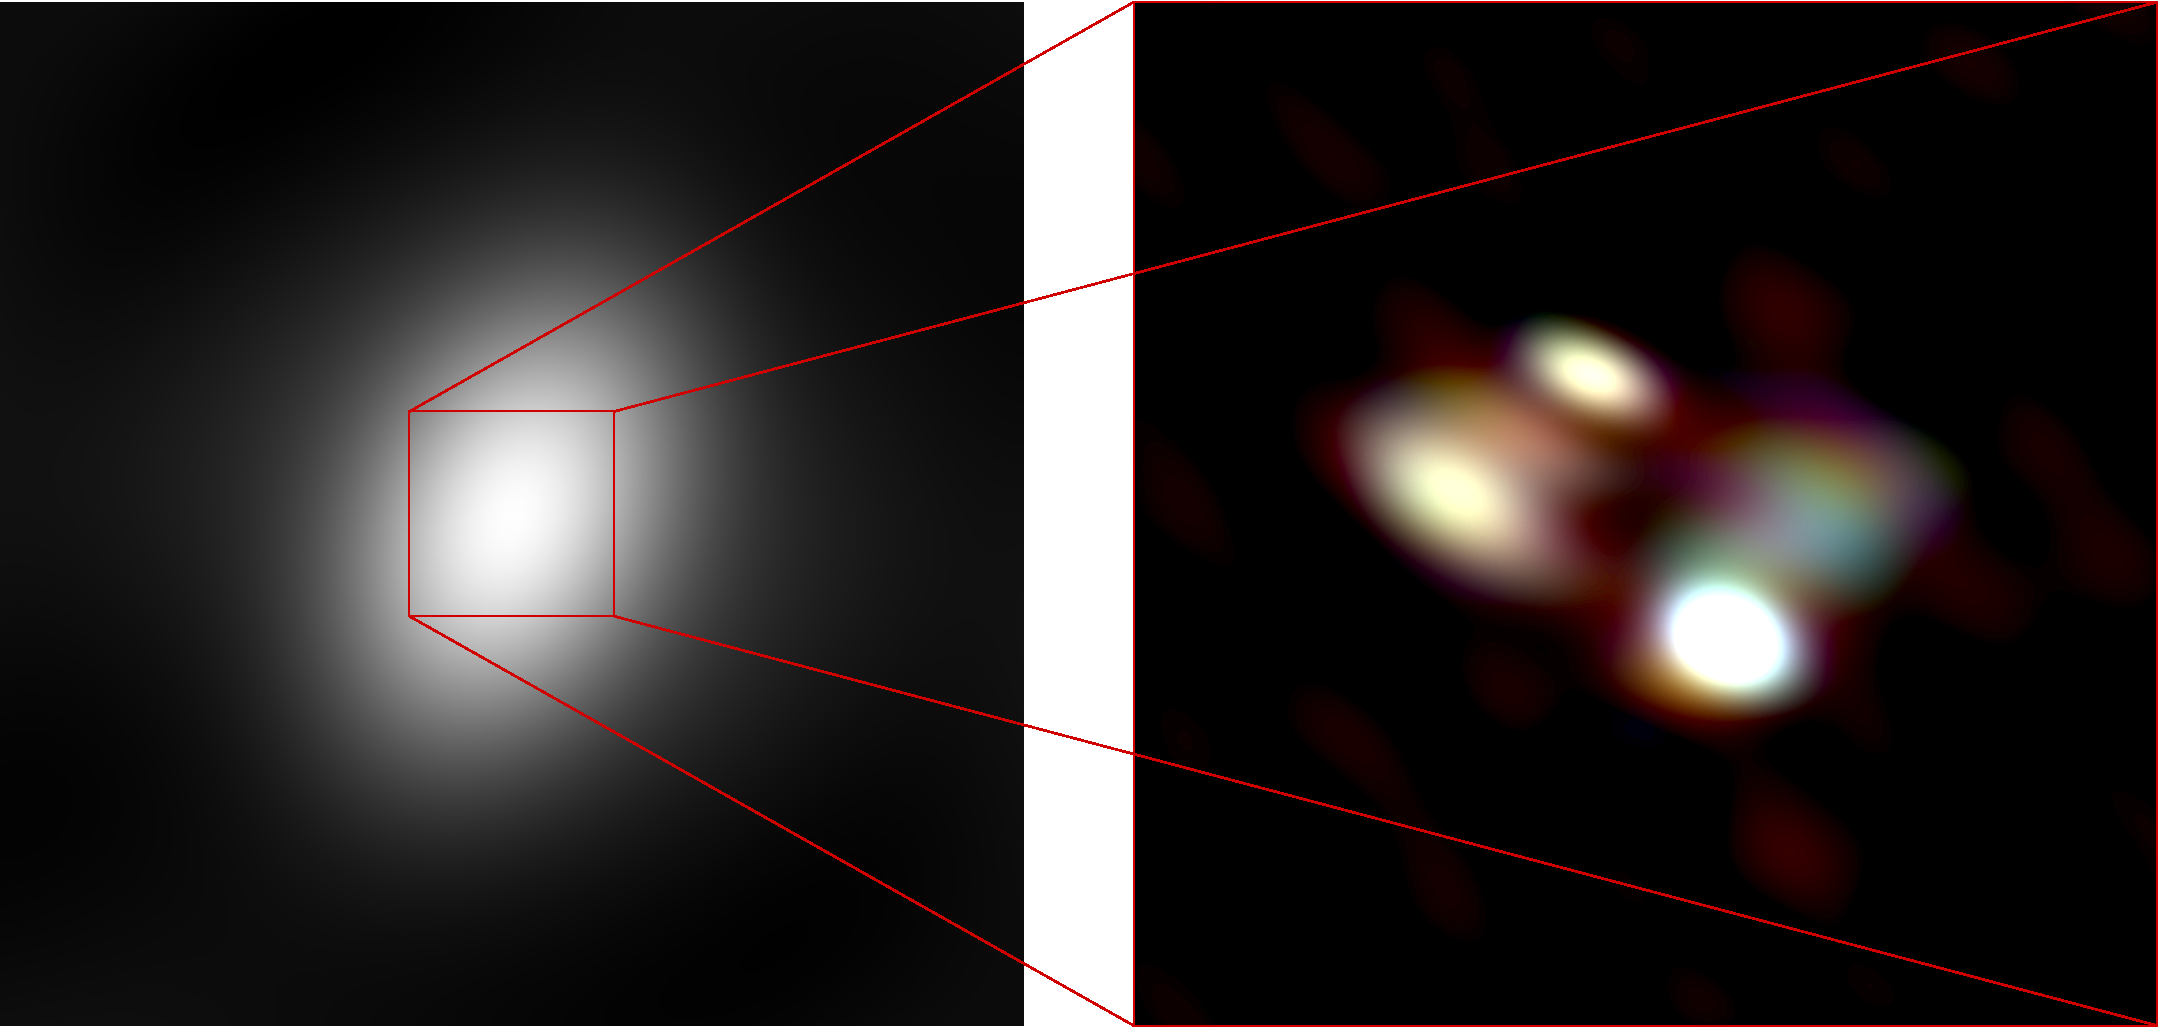
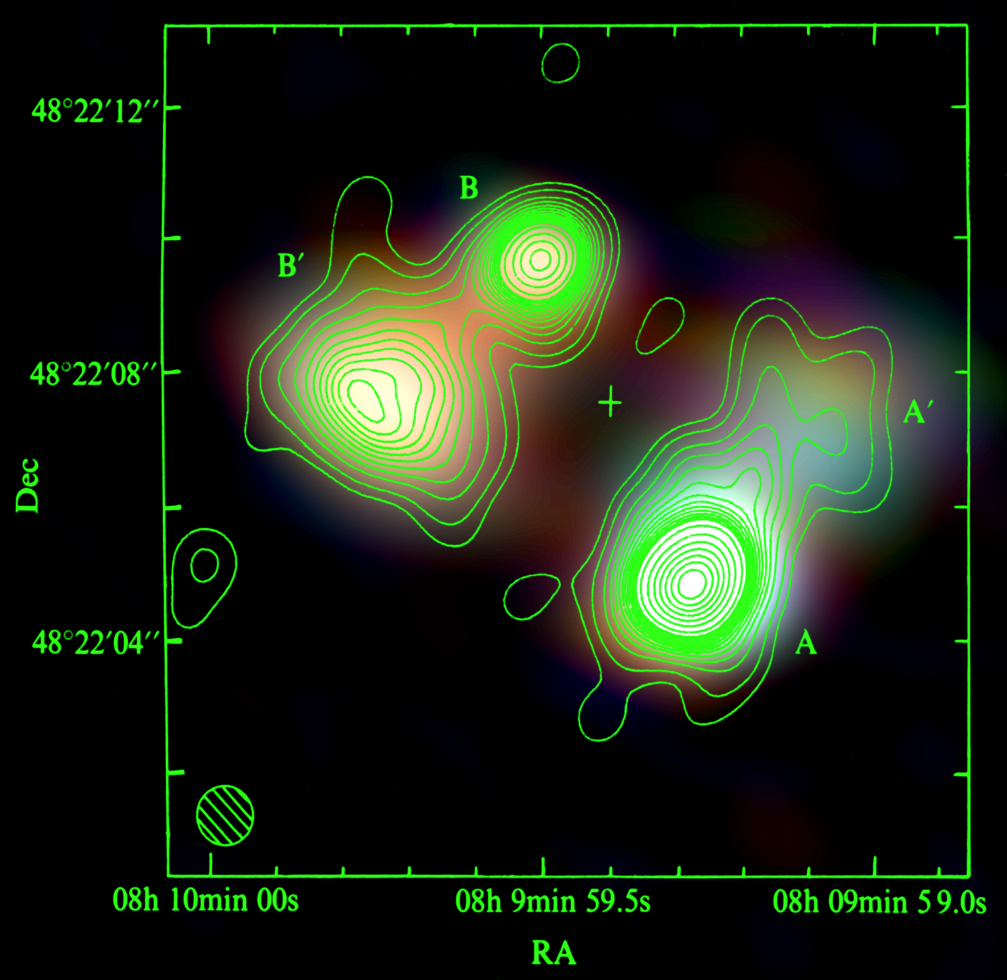
The comparison with the MERLIN images gave more confidence in the reliability of the imaged structures. The process was repeated and improved to produce the currently best long-baseline LBA LOFAR image shown in Fig. 10. The direct comparison with the 408 MHz image is shown in Fig. 11.
These maps have the highest resolution that has ever been achieved in this frequency range so far. They are a great step forward for low-frequency VLBI.
8 First long-baseline maps: HBA
Progress with the HBA is still lagging behind. Shortly after the first long-baseline HBA observations, fringes could be confirmed, but they turned out to be much weaker than expected. The imaging was correspondingly intricate and has not produced satisfying results so far.
For the first image, observation L2010_07608 of 3C196 was used (12 h on 22nd May 2010). The frequency range was 131–155 MHz in 120 subbands. 7 Dutch and only two German stations (Effelsberg and Tautenburg) were used. I had to correct for the clock offset in Effelsberg and for an offset of sec in the superterp stations in the core in order to allow averaging in frequency. The imaging and self-calibration was done in difmap and used the YY correlation. Most of the time the on the long baselines was very low, particularly on the baseline Effelsberg–Tautenburg. The reason for this is not fully understood. Partially it is due to the source structure, but more important seems to be the (then still missing) station calibration. Some inconsistencies between blocks of subbands made the averaging in frequency difficult.
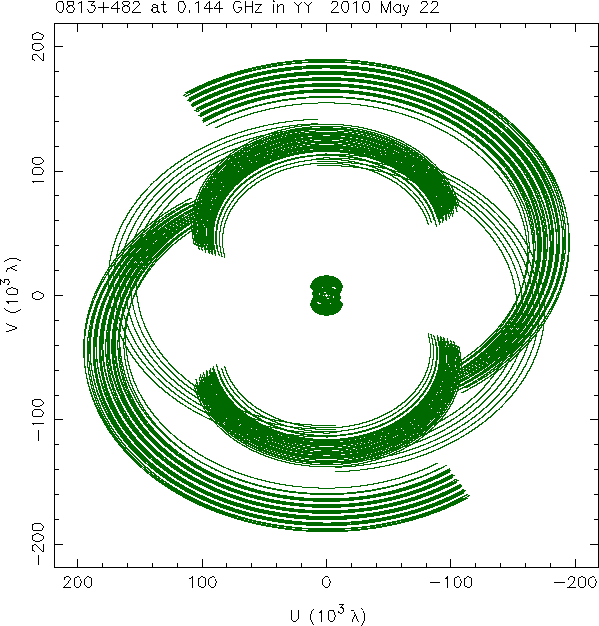
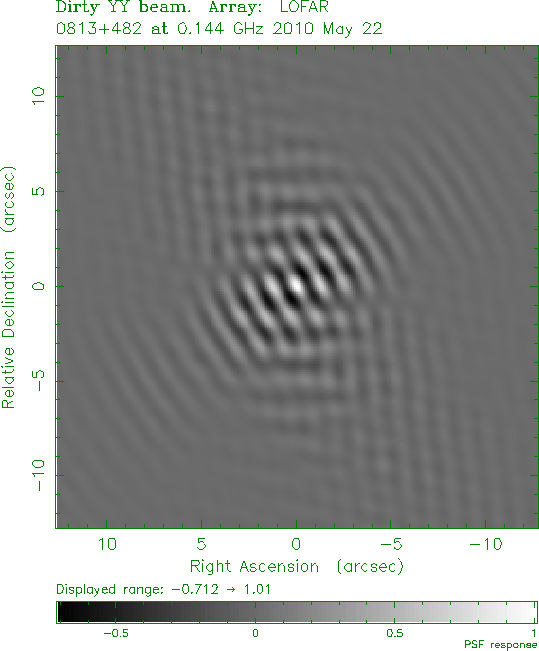
The coverage and dirty beam are shown in Fig. 12, the very preliminary map in Fig. 13. So far we only see compact parts of three of the components at HBA frequencies.
9 Acknowledgements
I would like to thank many colleagues in the LOFAR team whose work made these results possible. In particular the contributions of the following people were directly related to the results presented here. From ASTRON: Ashish Asgekar, Michiel Brentjens, André Gunst, George Heald, John McKean, Menno Norden, Antonis Polatidis and Stefan Wijnholds. From the German stations: James Anderson (Effelsberg), Annette Haas and Matthias Hoeft (Tautenburg).
10 Summary
This contribution proves that the long baselines of LOFAR actually work. They produce fringes, they can be calibrated, and they can be used to produce high-resolution images of the low-frequency radio sky. The highest-resolution image in the frequency range 30–80 MHz has been produced from only three international (plus five Dutch) stations, a small part of the final array. Fringe-fitting methods are required to determine and correct dispersive and non-dispersive delays in order to allow averaging in frequency. Phase changes with time turn out to be not much worse on long baselines than on short ones. Beyond about 30 km, the ionospheric patches are more or less independent of each other, so that variations do not increase with baseline length anymore. Even though the delays are larger, they can be calibrated because of their stability.
In order to analyse these data, new analysis techniques had to be developed and implemented. The results presented here were achieved with software written particularly for this purpose together with the standard packages AIPS and difmap.
The original presentation of the conference talk together with a number of fringe movies is available from the author’s homepage at http://www.astro.uni-bonn.de/~wucknitz/publications/pub.php?2010_iskaf_assen_lofar.
References
- [1]
- Lonsdale & Morison [1980] Lonsdale, C. J. & Morison, I.: 1980, Rotationally symmetric structure in two extragalactic radio sources, Nature 288, 66–69.
- Pooley & Henbest [1974] Pooley, G. G. & Henbest, S. N.: 1974, Observations of 48 extragalactic radio sources with the Cambridge 5-km telescope at 5 GHz, MNRAS 169, 477–526.
- Wucknitz & Garrett [2008] Wucknitz, O. & Garrett, M.: 2008, Gravitational lens surveys with LOFAR, Proceedings of the conference From Planets to Dark Energy: the Modern Radio Universe, \posPoS(MRU)142.