Gas morphology and energetics at the surface of PDRs: new insights with Herschel observations of NGC 7023††thanks: Herschel is an ESA space observatory with science instruments provided by European-led Principal Investigator consortia with important participation from NASA.
Abstract
Context. We investigate the physics and chemistry of the gas and dust in dense photon-dominated regions (PDRs), along with their dependence on the illuminating UV field.
Aims. Using Herschel-HIFI observations, we study the gas energetics in NGC 7023 in relation to the morphology of this nebula. NGC 7023 is the prototype of a PDR illuminated by a B2V star and is one of the key targets of Herschel.
Methods. Our approach consists in determining the energetics of the region by combining the information carried by the mid-IR spectrum (extinction by classical grains, emission from very small dust particles) with that of the main gas coolant lines. In this letter, we discuss more specifically the intensity and line profile of the 158 m (1901 GHz) [C ii] line measured by HIFI and provide information on the emitting gas.
Results. We show that both the [C ii] emission and the mid-IR emission from polycyclic aromatic hydrocarbons (PAHs) arise from the regions located in the transition zone between atomic and molecular gas. Using the Meudon PDR code and a simple transfer model, we find good agreement between the calculated and observed [C ii] intensities.
Conclusions. HIFI observations of NGC 7023 provide the opportunity to constrain the energetics at the surface of PDRs. Future work will include analysis of the main coolant line [O i] and use of a new PDR model that includes PAH-related species.
Key Words.:
ISM: structure – ISM: kinematics and dynamics – ISM: molecules – Submillimeter1 Introduction
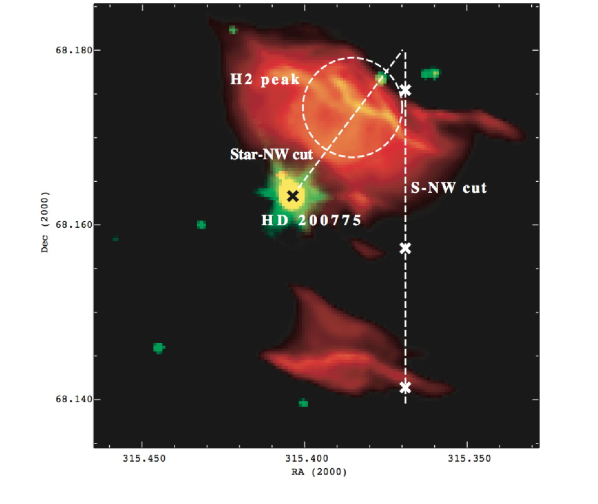
One main goal of the Guarantee Time Key Programme ”Warm and dense interstellar medium” (WADI) of the HIFI heterodyne spectrometer (de Graauw et al. 2010) onboard Herschel (Pilbratt et al. 2010) is to investigate the physics and chemistry of the gas and dust in dense photon-dominated regions (PDRs), as well as their dependence on the illuminating UV field. As part of this programme, we observed a prototype PDR, NGC 7023. The region is illuminated by the B2Ve HD 200775 RA(2000) = 21h01m36.9s ; Dec(2000) = +68∘09′47.8′′], and has been shaped by the star formation process leading to the formation of a cavity. NGC 7023 has been widely studied at many wavelengths. It has been shown that this region hosts structures at different gas densities: cm-3 in the cavity, cm-3 in the PDRs that are located north-west (NW), south (S) and east, and cm-3 in dense filaments and clumps that are observed in the mm (Fuente et al. 1996; Gerin et al. 1998 and references therein) and near-IR (Lemaire et al. 1996; Martini et al. 1997).
NGC 7023 has been mapped by the instruments PACS and SPIRE of Herschel to study the emission of large cold grains (Abergel et al. 2010). We present here some observations of the gas at the surface of this nebula, taking advantage of the very high spectral resolution of HIFI. By combining these observations with previous mid-IR observations, we study the geometry and energetics of the NW and S PDRs.

| Transition | Position | Beam | vlsr | FWHM † | T | Area | |
| GHz] | size ″ | km s-1 | km s-1 | K | K km s | ||
| HCO+ (65) | 535.062 | H2 peak | 41 | 0.22 | |||
| 13CO (54) | 550.926 | H2 peak | 41 | 5.12 | |||
| 13CO (87) | 881.272 | H2 peak | 24 | 4.15 | |||
| C18O (54) | 548.831 | H2 peak | 41 | 1.12 | |||
| [C ii] | 1900.537 | H2 peak | 11 | 23.6 | |||
| [C ii] | 1900.537 | S-NW cut / North | 11 | 17.9 | |||
| [C ii] | 1900.537 | S-NW cut / Cavity | 11 | 6.89 | |||
| [C ii] | 1900.537 | S-NW cut / South | 11 | 13.3 | |||
| † For [C ii] , we report the FWHM of the Gaussian profile of equivalent area and peak intensity. | |||||||
2 Observations and results
2.1 HIFI observations
The HIFI observations presented here consist in (offset positions are relative to the star; see Fig. 1):
- single pointing using frequency switch mode towards the NW PDR in bands 1a and 3b.
In band 1a, the frequency ranges covered by the Wide Band Spectrometer (WBS) were
[535-539] GHz (LSB) and [547-551] GHz (USB).
In band 3b, covered ranges were [879-883] GHz (LSB) and [891-895] GHz (USB).
The observed position (, ,
called H2 peak) corresponds to the peak intensity of the H2
ro-vibrational emission associated to the near-IR filaments (Lemaire et al. 1996).
- On-the-fly (OTF) mapping of the [C ii] 1901 GHz emission line in band 7b.
The line was covered by both the WBS and the high-resolution spectrometer (HRS) in USB.
Two cuts were performed: a cut from the star to the NW PDR (star-NW cut) and a south-north cut (hereafter S-NW cut) covering the
NW PDR, the cavity and the S PDR (, , see
Fig. 1). The pixel size after regriding is 6.5.
All these observations include an OFF reference position in the western lobe of the cavity (, ). Data was reduced with HIPE 3.0 (Ott 2010) on level-2 data produced with the standard pipeline. For the pointed observations in bands 1a and 3b, manual steps consisted in stitching sub-bands, baseline removal, and correction for main beam efficiency ( = 0.71). The [C ii] WBS spectra required defringing, which was performed with standard HIPE tasks, and the best data quality was produced with the subtraction of two sinusoidal fringes. To verify the biases introduced by the fringe removal, we compared the WBS and HRS profiles, which showed good agreement both in profile and absolute intensity except for the weakest lines (T K).
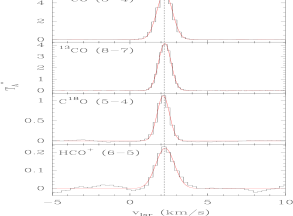
2.2 Gas kinematics
Figure 2 (left panel) shows the 13CO 54, 13CO 87, C18O 54, and HCO+ 65 lines observed by HIFI towards the H2 peak. All the lines have a central velocity of about 2.2 km s-1, comparable to previous ground-based observations in several molecular lines (Fuente et al. 1993). Figure 2 (right panel) shows the [C ii] line profiles at the H2 peak and at different positions along the S-NW cut. The line is much broader than molecular lines and its profile shows a complex multi-component structure. The observations towards the PDRs show that the emission peaks at intermediate velocities (v1.8-2.8 km s-1), which have already been observed towards the NW PDR in several molecular tracers (see, for example, Fuente et al. 1996). There is also a contribution from higher velocity components (v4 km s-1), which dominate the emission in the cavity.
2.3 Emission from very small dust particles and C+
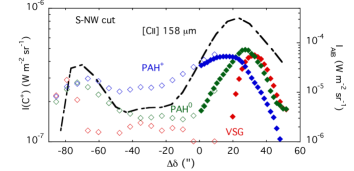
The 158 m (1901 GHz) [C ii] and 63 m [O i] lines are the major coolants of the gas at the surface of PDRs (Hollenbach & Tielens 1999). In these regions, photoelectric effect dominates the heating, while H2 formation provides a minor contribution. Since the smallest dust particles, polycyclic aromatic hydrocarbons (PAHs) and very small grains (VSGs) contribute to a large fraction to this process (Bakes & Tielens 1994; Habart et al. 2001), and these particles emit in the mid-IR most of the energy they absorb in the UV, we expect that the mid-IR and [C ii] emissions arise in the same regions.
We used mid-IR spectro-imagery data of the NW PDR of NGC 7023 that were obtained in the 5.5-14.5 m range with the Infrared Spectrograph onboard Spitzer
(Werner et al. 2004). For the S PDR, we used ISOCAM highly-processed data products (Boulanger et al. 1996) from the ISO data archive. To analyse the mid-IR spectra, we followed the method explained in Rapacioli et al. (2005) and Berné et al. (2007),
in which the mid-IR emission is decomposed into three aromatic IR band (AIB) spectra whose carriers are neutral PAHs (PAH0), cationic PAHs (PAH+), and evaporating VSGs.
The fitting procedure was recently improved by including the convolution of the composite spectrum by extinction (Pilleri et al. 2010).
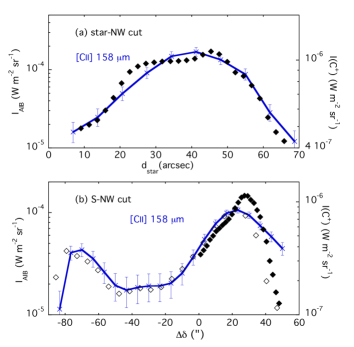
Figure 3 displays the AIB flux, IAIB, obtained by summing the fluxes of the PAH0, PAH+, and VSG components that were derived from the fit. It shows that the AIB intensity correlates well with the [C ii] line intensity, strongly suggesting that both emissions arise from the same regions.
The fit of the mid-IR emission provides two independent tracers of the total gas column density N(H) along the line of sight as explained below.
(i) Owing to the excitation mechanism, the AIB intensity can be written as I
where N is the column density of carbon in the AIB carriers and G0 the UV flux in Habing units (Habing 1968).
Assuming that N stays constant at the PDR surface, IAIB can therefore be used as a tracer of N(H) if G0 is known (Pilleri et al. 2010).
(ii) If the column density N(H) is high enough, the effect of extinction by silicates can be seen on the AIB spectrum. In the mid-IR fit, the extinction is derived from a simple correction term, assuming that the emitting and absorbing materials are fully mixed:
where is the optical depth in the line of sight. The extinction cross-section per
nucleon is taken from Weingartner & Draine (2001) for and N(H) is a free parameter of the fit.
Method (ii) is precise for column densities higher than
cm-2. Method (i) can probe lower column densities but has two limitations. The AIB emission needs to be corrected for the variation in the UV field G0
to retrieve the value of N(H). This was done assuming that G0 scales as the inverse squared distance to
the illuminating star HD200775 and a value of G0=2600 at 42 from this star (Pilleri et al. 2010). We used the projected distance as an estimate of the true distance.
This introduces an error that can be especially strong at positions close to the star in the plane of the sky.
Figure 3 shows that the AIB emission stays almost constant at ″, therefore we used this value as the minimum effective distance of the NW PDR to the star.
Method (i) also needs to be calibrated since the local emissivity of the AIB carriers is not known precisely. Our approach was therefore to derive a calibration factor using the values obtained by
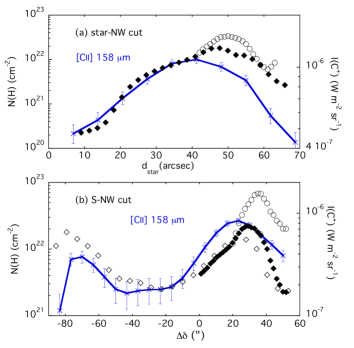
method (ii) around position 42″on the star-NW cut. The same calibration factor was used for all positions along the two cuts. Figure 4 shows that the column densities
that were derived on the two cuts correlate quite well with the [C ii] line intensity.
3 Modelling C+ emission
| Pos. () | dproj | UV field | T | PAH+/PAH0 | Ionization | [C ii] local emissivity | [C ii] flux | ||
| parameter () | HIFI | Model | |||||||
| (″) | (″) | (G0) | (K) | ( G0 K1/2 cm3) | ( cm-2) | (10-21W m-3) | (W m-2 sr-1) | ||
| NW3 (16) | 50 | 1873 | 337 / 333 | 1.9 | 11.0 / 29.5 | 10.5 | 4.4 / 1.4 | 8.0 | 11.0 / 8.0 |
| NW2 (12) | 48 | 1975 | 342 / 333 | 2.7 | 11.7 / 31.1 | 8.1 | 4.4 / 1.4 | 6.9 | 9.5 / 7.1 |
| NW1 (-3) | 47 | 2100 | 348 / 333 | 9.6 | 12.6 / 33.0 | 3.9 | 4.4 / 1.4 | 3.3 | 5.6 / 4.6 |
| S1 (-63) | 79 | 747 | 248 / 320 | 1.7 | 3.8 / 11.8 | 8.7 | 4.2 / 1.4 | 3.1 | 8.3 / 7.2 |
| S2 (-73) | 87 | 607 | 230 / 312 | 0.96 | 3.0 / 9.5 | 14.0 | 4.1 / 1.4 | 3.7 | 9.6 / 8.4 |
| Calculated using a projected distance and G0=2600 at 42″ from the star. | |||||||||
| From the PDR model using cm-3, respectively. | |||||||||
| Given as the ratio of the mid-IR intensities shown in Fig. 5. | |||||||||
| Derived from the analysis of the mid-IR emission spectra. | |||||||||
The critical density for the [C ii] 158 m line is ncrit=2500 cm-3 for collisions with H and therefore the line emissivity depends mainly on temperature for nncrit. We selected a few positions on the HIFI S-NW [C ii] cut, three points on the NW PDR and two on the South PDR (cf. Table 2). The values of G0 were determined as explained in Sect. 2.3, and we assumed a constant average density with two different values: cm-3 that is characteristic of the molecular cloud (Gerin et al. 1998) and cm-3 that was derived by Rapacioli et al. (2006) in their study of PAH-related species.
We used the 1D Meudon PDR code (Le Petit et al. 2006) to compute the gas temperature T at the cloud surface for all the selected positions (cf. Table 2). The values of T are used to calculate the C+ level populations. Line intensities are then derived by integrating along the line-of-sight (perpendicular to model results) and by assuming uniform excitation conditions. The thickness of the observed regions leads to an optical depth 1, which implies that transfer effects must be taken into account. If we assume constant excitation conditions and gas properties along the line of sight, then and the line intensity can be computed.
The agreement between calculated and observed flux values is very good when using cm-3. In the NW PDR, the ratio is 1.0 for NW3 (16) and NW2 (12), and 1.4 for NW1 (-3). For the S PDR, a value of 2.3 is derived for the two positions, suggesting that systematic effects are causing the deviation between observed and calculated values of the [C ii] flux. There are several parameters that are not precise in our model but looking at Table 2, it seems the local [C ii] emissivity is mainly affected by the local density and not by the value of G0. For N(H), we assumed the same regions emit in PAHs and [C ii] , in agreement with the profiles shown in Fig. 3. There is also an error for N(H) due to our method (cf. Sect. 2.3), but this error is expected to be the same for both PDRs. Dividing N(H) by a factor of two leads to lower values of the ratio of the calculated over the observed [CII] flux: 0.7-0.8 for the NW PDR and 1.6-1.7 for the S PDR.
One step further in the model would consist in studying the effect of the grain charge on the photoelectric efficiency (Bakes & Tielens 1994). The relative abundances of PAH+, PAH0, and evaporating VSGs vary significantly over the nebula (Fig. 5). Regions in the cavity appear mainly populated by PAH+ (cf. NW1 (-3) in Table 2). Since the ionization potential of PAH+ is much higher than that of PAH0 (10 eV compared to 6 eV; Malloci et al. 2007), PAH+ should contribute less to the photoelectric heating than PAH0, leading to a decrease in the heating rate, hence in the gas cooling. In its current version, the PDR code uses classical grains with an MRN distribution (Mathis et al. 1977) and absorption and scattering cross-sections from Laor & Draine (1993). We have used grains of sizes from 15 Å to 3000 Å with a dust-to-gas mass ratio of 1%. As a result, the ionization parameter that quantifies the grain charge (cf. Table 2) does not reflect well the variations of the PAH charge observed in Fig. 5. An upgraded version, in which the PDR code is coupled to the code DUSTEM (Compiègne et al. 2010), is under development (Gonzalez et al., to be submitted) and will allow for including PAHs. NGC 7023 is clearly a template region that could be used for these studies.
4 Conclusion
By using HIFI and complementary mid-IR data, we have shown that the [C ii] cooling line and the AIB emission arise from the same regions, in the transition zone between atomic and molecular gas. The prototype PDR NGC 7023 was found to be a good object for comparison with PDR models. Further progress on the energetics of this region awaits for the coming [O i] data from the PACS instrument and a PDR model that treats the photophysics of PAHs consistently.
References
- Abergel et al. (2010) Abergel, A., Arab, H., Compiègne, M., et al. 2010, A&A, in press
- Bakes & Tielens (1994) Bakes, E. L. O. & Tielens, A. G. G. M. 1994, ApJ, 427, 822
- Berné et al. (2007) Berné, O., Joblin, C., Deville, Y., et al. 2007, A&A, 469, 575
- Boulanger et al. (1996) Boulanger, F., Reach, W. T., Abergel, A., et al. 1996, A&A, 315, L325
- Compiègne et al. (2010) Compiègne, M., Verstraete, L., Jones, A., et al. 2010, ApJ, submitted
- de Graauw et al. (2010) de Graauw, T. et al. 2010, A&A, in press
- Fuente et al. (1993) Fuente, A., Martin-Pintado, J., Cernicharo, J., & Bachiller, R. 1993, A&A, 276, 473
- Fuente et al. (1996) Fuente, A., Martin-Pintado, J., Neri, R., Rogers, C., & Moriarty-Schieven, G. 1996, A&A, 310, 286
- Gerin et al. (1998) Gerin, M., Phillips, T. G., Keene, J., Betz, A. L., & Boreiko, R. T. 1998, ApJ, 500, 329
- Habart et al. (2001) Habart, E., Verstraete, L., Boulanger, F., et al. 2001, A&A, 373, 702
- Habing (1968) Habing, H. J. 1968, Bull. Astron. Inst. Netherlands, 19, 421
- Hollenbach & Tielens (1999) Hollenbach, D. J. & Tielens, A. G. G. M. 1999, Reviews of Modern Physics, 71, 173
- Laor & Draine (1993) Laor, A. & Draine, B. T. 1993, ApJ, 402, 441
- Le Petit et al. (2006) Le Petit, F., Nehmé, C., Le Bourlot, J., & Roueff, E. 2006, ApJS, 164, 506
- Lemaire et al. (1996) Lemaire, J. L., Field, D., Gerin, M., et al. 1996, A&A, 308, 895
- Malloci et al. (2007) Malloci, G., Joblin, C., & Mulas, G. 2007, A&A, 462, 627
- Martini et al. (1997) Martini, P., Sellgren, K., & Hora, J. L. 1997, ApJ, 484, 296
- Mathis et al. (1977) Mathis, J. S., Rumpl, W., & Nordsieck, K. H. 1977, ApJ, 217, 425
- Ott (2010) Ott, S. 2010, in ASP Conference Series, Astronomical Data Analysis Software and Systems XIX, ed. Y Mizumoto, K. I. Morita, M. Ohishi, ”in press”
- Pilbratt et al. (2010) Pilbratt, G. L., Riedinger, J. R., Passvogel, T., et al. 2010, A&A, in press
- Pilleri et al. (2010) Pilleri, P., Montillaud, J., Berné, O., & Joblin, C. 2010, in prep.
- Rapacioli et al. (2005) Rapacioli, M., Joblin, C., & Boissel, P. 2005, A&A, 429, 193
- Rapacioli et al. (2006) Rapacioli, M., Calvo, F., Joblin, C., et al. 2006, A&A, 460, 519
- Weingartner & Draine (2001) Weingartner, J. C. & Draine, B. T. 2001, ApJ, 548, 296
- Werner et al. (2004) Werner, M. W., Uchida, K. I., Sellgren, K., et al. 2004, ApJS, 154, 309