11email: james.difrancesco@nrc-cnrc.gc.ca 22institutetext: University of Victoria, Department of Physics and Astronomy, PO Box 3055, STN CSC, Victoria, BC, V8W 3P6, Canada 33institutetext: Laboratoire AIM, CEA/IRFU – CNRS/INSU – Université Paris Diderot, CEA-Saclay, F-91191 Gif-sur-Yvette Cedex, France 44institutetext: Laboratoire d’Astrophysique de Bordeaux, CNRS/INSU – Université de Bordeaux, BP 89, 33271 Floirac cedex, France 55institutetext: Max-Planck-Institut für Astronomie, Königstuhl 17, D-69117, Heidelberg, Germany 66institutetext: Laboratoire d’Astrophysique de Marseille, CNRS/INSU - Université de Provence, 13388 Marseille cedex 13, France 77institutetext: INAF-IFSI, Fosso del Cavaliere 100, 00133 Roma, Italy 88institutetext: Cardiff University School of Physics and Astronomy, UK 99institutetext: IAS, Université Paris-Sud, 91435 Orsay, France 1010institutetext: CESR & UMR 5187 du CNRS/Université de Toulouse, BP 4346, 31028 Toulouse Cedex 4, France 1111institutetext: IRAM, 300 rue de la Piscine, Domaine Universitaire, 38406 Saint Martin d’Héres, France 1212institutetext: National Astronomical Observatories, Chinese Academy of Sciences, Beijing 100012, China 1313institutetext: The Rutherford Appleton Laboratory, Chilton, Didcot, Oxon OX11 ONL, UK 1414institutetext: Herschel Science Centre, ESAC, ESA, PO Box 78, Villanueva de la Cañada, 28691 Madrid, Spain 1515institutetext: CITA & Department of Astronomy and Astrophysics, University of Toronto, 50 St. George St., Room 101, Toronto, ON, M5S 3H4, Canada 1616institutetext: Department of Astronomy, Stockholm Observatory, AlbaNova University Center, Roslagstullsbacken 21, 10691 Stockholm, Sweden 1717institutetext: INAF-IASF, Sez. di Roma, via Fosso del Cavaliere 100, 00133, Rome, Italy 1818institutetext: UK Astronomy Technology Centre, Royal Observatory Edinburgh, Blackford Hill, EH9 3HJ, UK 1919institutetext: ESO, Karl Schwarzchild Str. 2, 85748, Garching, Germany 2020institutetext: Department of Physics & Astronomy, The Open University, Milton Keynes MK7 6AA, UK 2121institutetext: Department of Physics and Astronomy, ABB-241, McMaster University, 1280 Main St. W., Hamilton, ON, L8S 4M1, Canada
Small-scale structure in the Rosette molecular cloud
revealed by Herschel††thanks: Herschel is an ESA space observatory with science instruments provided by European-led Principal Investigator consortia and with important participation from NASA.
We present a preliminary analysis of the small-scale structure found in new 70-520 m continuum maps of the Rosette molecular cloud (RMC), obtained with the SPIRE and PACS instruments of the Herschel Space Observatory. We find 473 clumps within the RMC using a new structure identification algorithm, with sizes up to 1.0 pc in diameter. A comparison with recent Spitzer maps reveals that 371 clumps are “starless” (without an associated young stellar object), while 102 are “protostellar.” Using the respective values of dust temperature, we determine the clumps have masses () over the range -0.75 log (/M⊙) 2.50. Linear fits to the high-mass tails of the resulting clump mass spectra (CMS) have slopes that are consistent with those found for high-mass clumps identified in CO emission by other groups.
Key Words.:
dust – ISM: clouds — ISM: structure — stars: formation – individual objects: Rosette – submillimetre — IR: Herschel1 Introduction
Stars form within molecular clouds, after some fraction of cloud material is first condensed into smaller-scale structures. How this process unfolds is not well understood, however. For example, what conditions within clouds drive the formation of small-scale structures that in turn produce stars of any given mass, e.g., high-mass stars. Detailed observations of the small-scale structure within molecular clouds should provide valuable insight into how stars of various masses form out of dense material.
The need for sensitive probes of small-scale structure in molecular clouds is the impetus behind the “Herschel OB Young Stellar objects” (HOBYS) Key Project (see Motte et al. 2010). The HOBYS team is currently using the ESA Herschel Space Observatory (Pilbratt et al. 2010) to obtain wide-field maps of 15 molecular clouds which are forming high-mass stars within 3 kpc of the Sun. These clouds are being observed with both the Herschel SPIRE (Griffin et al. 2010) and PACS (Poglitsch et al. 2010) instruments, ultimately to obtain wide maps of these clouds at 70-520 m at diffraction-limited resolutions of 18′′ (/250 m). Such data sample thermal emission from cold dust grains mixed with molecular gas within the cloud. Since continuum emission at submillimetre wavelengths is typically optically thin, detections of continuum emission from dust at high resolution can trace the organization of mass in clouds on small scales. By sensitively sampling emission across the peaks of the spectral energy distributions (SEDs) of this dust, SPIRE and PACS data can constrain both the column density and temperature of the dust and provide unparalleled censuses of the small-scale structure in molecular clouds.
In this paper, we describe the small-scale structure detected with SPIRE and PACS in the Rosette molecular cloud (RMC), the first of the HOBYS target list that was observed as part of the early Herschel “science demonstration phase” (SDP) campaign. The RMC is a rich location of star formation at a distance of 1.6 kpc (Johnson 1962; Pérez et al. 1987; Park & Sung 2002). The cloud is southeast of NGC 2244, the Rosette Nebula, and the expanding HII region associated with NGC 2244 has begun to interact with it. The structure of material within the RMC has been previously examined by Williams, Blitz & Stark (1995), Schneider et al. (1998) and Dent et al. (2009) using various CO observations. Alternatively, the populations of young stellar objects (YSOs) within the RMC have been studied by Phelps & Lada (1998), Li & Smith (2005), Poulton et al. (2008), and Román-Zúñiga et al. (2008) using infrared observations. Notably, these studies identified 10 embedded clusters within the RMC, i.e., PL01-07 and REFL08-10. A recent review of observations of the RMC has been made by Román-Zúñiga & Lada (2008; RZL).
The SPIRE and PACS observations described in this paper provide a preliminary look into how Herschel data trace small-scale structures in the RMC, and the relationships between these structures and YSOs. Analyses of other aspects within the SDP data of the RMC can be found in the accompanying papers by Motte et al. 2010, Henneman et al. 2010, and Schneider et al. 2010.)
2 Observations
A complete description of the observations described here can be found in the accompanying paper by Motte et al. (2010). In short, an extinction map of the RMC was first constructed for planning purposes using 2MASS data and the AvMAP algorithm. AvMAP derives extinction maps with typical resolutions of 2′ using colour excesses in a manner akin to the NICER algorithm of Lombardi & Alves (2001). AvMAP, however, also uses a stellar model to predict foreground source densities; see Schneider et al. (2010a). Using the AvMAP data as a guide, an area of the RMC 1 deg2 in extent encompassing areas southeast of NGC 2244 with 5 was mapped in common with SPIRE and PACS in parallel scan mode on 2009 October 20. Maps were obtained simultaneously at 70 m and 170 m with PACS and at 250 m, 350 m, and 520 m with SPIRE.
1

The SPIRE and PACS data were reduced separately using common routines of the Herschel Interactive Processing Environment111HIPE is a joint development by the Herschel Science Ground Segment Consortium, consisting of ESA, the NASA Herschel Science Center, and the HIFI, PACS and SPIRE consortia. (HIPE; see Ott 2010). To facilitate the identification and analysis of the cold, small-scale structure in the RMC, i.e., dense clumps, the PACS maps were Gaussian smoothed to the 18′′ FWHM resolution of the 250 m SPIRE map. A full analysis of the unsmoothed PACS maps will be provided in the near future by Sadavoy et al. (2010b, in preparation).
3 Results
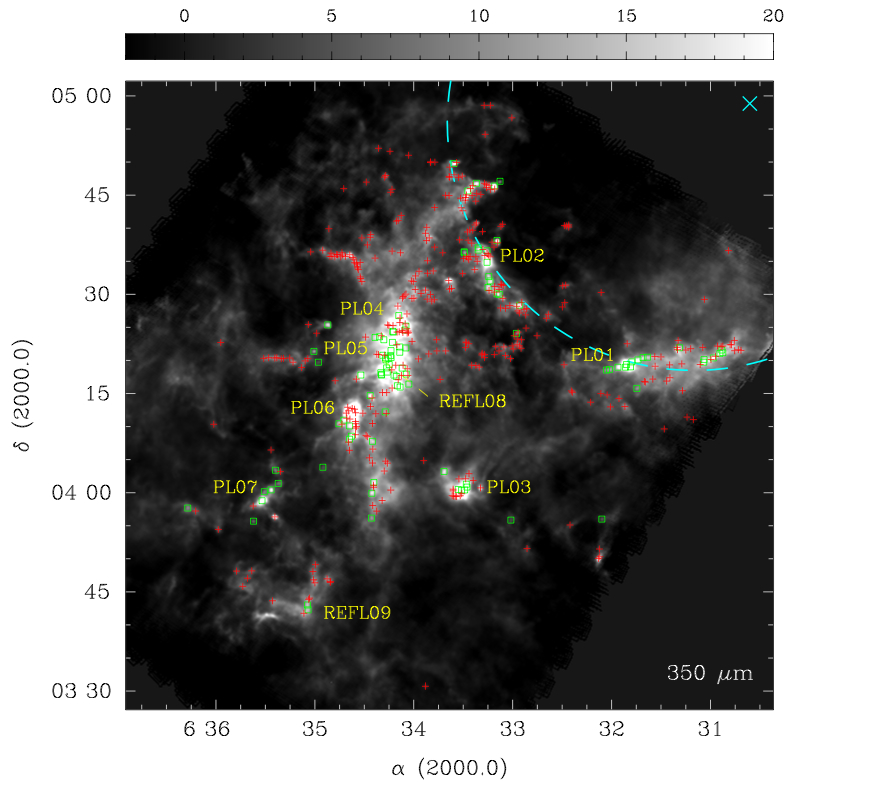
Figure 1 (available electronically) shows the 350 m map of the RMC, revealing a rich amount of structure in continuum emission. (See Motte et al. for maps at all five wavelengths.) Several bright knots are seen embedded in large filaments, and each can be associated with known infrared clusters (see Figure 1, also RZL). Ubiquitous, faint diffuse emission is also seen, and in many cases this appears filamentary as well. Of special note in Figure 1 is the filamentary arc seen in the northwestern corner, indicating the “ridge” of the RMC (+ “Core D”), i.e., where the adjacent NGC 2244 HII region (the Rosette Nebula) is interacting with the molecular cloud.
From the (smoothed) PACS and SPIRE maps, 473 continuum objects were identified using the getsources algorithm; an accompanying paper in this volume by Men’shchikov et al. (2010) describes getsources in more detail. In brief, getsources first decomposes maps into images over a range of scales and objects are identified as discrete emission regions in each image. Objects are then defined using information on many scales and at many wavelengths. For example, positions and extents (i.e., “footprints”) are determined from the first and second moments of intensities in images where all scales are recombined. Integrated flux densities are calculated by summing the background-subtracted emission under the footprint of an object. Sizes are well-approximated by 2D Gaussian fits.
For simplicity, we choose to identify all objects found by getsources as “clumps”222The term “clump” has been used previously to describe sites of grouped or clustered star formation, as opposed to sites of single- (or multiple-) star formation, i.e., “cores”; see Williams, Blitz & McKee (2000). We use “clump” here to describe all discrete condensations of material of size 1 pc within the larger cloud. Figure 1 shows the locations of all 473 clumps identified in the RMC overlaid onto the 350 m map. Most are found within the brighter filaments of the RMC, with neighbouring clumps tracing the linear structures of underlying filaments. Several “isolated” clumps (i.e., those without close neighbours), however, are also seen associated with fainter emission. Relatively few clumps are seen inside the northwestern “ridge” and coincident with the NGC 2244 HII region.
Figure 1 also shows which clumps in the RMC contain YSOs (“protostellar clumps”) and which do not (“starless clumps”). These determinations were made using Spitzer IRAC and MIPS data of the region (see Poulton et al. 2008; Balog et al. 2010, in preparation). The criteria used to determine which clumps contain YSOs are based on those developed recently by Sadavoy et al. (2010a) for small-scale structure detected at 850 m in the less-distant Orion, Taurus, Perseus and Ophiuchus molecular clouds. For this comparison, potential YSOs had to be detected in all four IRAC bands or at 24 m. Their colours and brightness were checked against colour criteria to distinguish them as either YSOs or other objects (e.g., background galaxies or stars). In addition, their positions relative to clumps were checked for coincidence within areas defined by the 2D Gaussian fits to the clump extents. We do not distinguish here between protostellar Classes of YSOs in clumps; see Henneman et al. for further discussion.

In total, we find 371 starless clumps and 102 protostellar clumps in the RMC. Most protostellar clumps contain one YSO, but 35% contain more than one. Figure 1 suggests that brighter clumps tend to be protostellar, while fainter clumps tend to be starless. (Exceptions to both cases are seen, however.) As expected, the protostellar clumps are associated with the embedded clusters known in the cloud, i.e., PL01-07 and REFL08-10. Many starless clumps appear to be associated with the RMC ridge and the area between it and the RMC “central core” (i.e., the concentration of bright protostellar clumps associated with the embedded clusters PL04-06 and REFL08 in the centre of Figure 1). Relatively few (15) clumps are seen behind the ridge itself, and they all appear to be starless. Excluding areas inside and outside the ridge, the starless and protostellar clumps appear well-mixed, suggesting no “age gradient” across the RMC. (Schneider et al. 2010b suggest, however, that the most massive cores in the RMC decrease in age with increased distance from NGC 2244.)
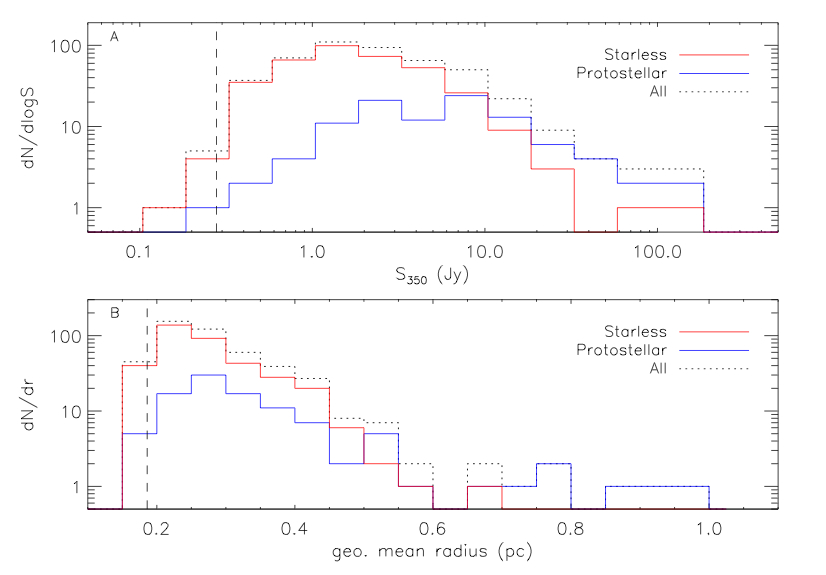
Figure 2 shows distributions of the flux and size of clumps in the RMC, as a whole and when separated into starless or protostellar clumps. Figure 2a shows histograms of 350 m integrated fluxes, , of the clumps, demonstrating how the brightest are indeed protostellar (see Figure 1). Starless and protostellar clumps with 5 Jy are similar in number, but clumps fainter than 5 Jy are predominantly starless. For reference (see §4 below), a clump of 5 Jy flux at 350 m in the RMC has a mass of 7 M⊙, assuming = 20 K. Figure 2b shows size histograms of each population where size is the geometric mean of the observed major and minor axes of the 2D Gaussian fit to each clump extent. (These sizes are not deconvolved from the finite beam.) Clumps of each type have sizes that extend from the resolution limit up to 0.65 pc. The few larger clumps (i.e., 0.7-1.0 pc) are all protostellar, however.

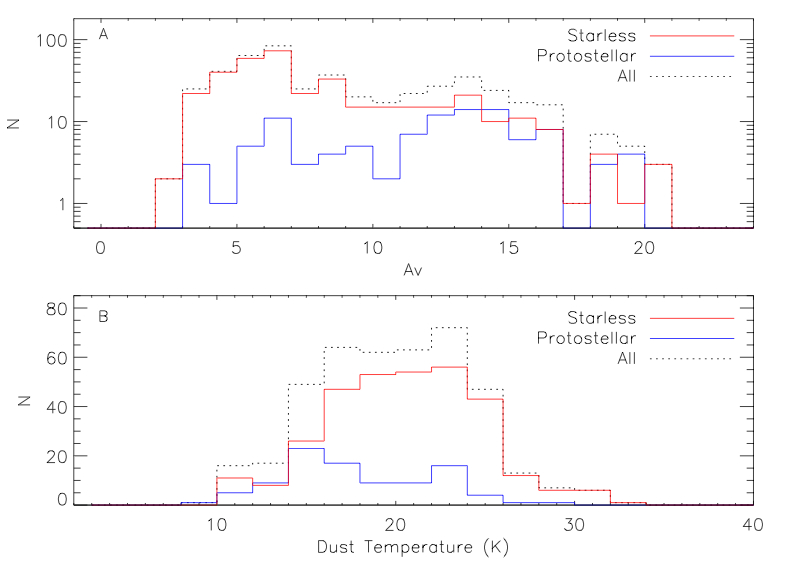
Figure 3 shows distributions of the local extinction and temperatures of clumps within the cloud, again as a whole and when separated into starless or protostellar clumps. Figure 3a shows the values associated with the clumps, as determined from the low-resolution (i.e., 2′) extinction maps. For a given clump, its associated low-resolution can be used as a proxy for its depth within its parent cloud (see Johnstone, Di Francesco & Kirk 2004). Clumps of each type are found across the same range of extinction ( 3-20). No clumps of either type are found at 2, however. Starless clumps are found in greater numbers at lower extinctions ( 12), but both types are found in similar numbers at higher extinctions ( 12). The number of starless clumps peaks at 6, while that of protostellar clumps peaks at 13-14. Though starless and protostellar clumps are found over the same range of , the difference in peak may be due in part to protostellar clumps having higher masses on average than starless clumps (see §4 below). Assuming similar sizes, the resulting relatively higher column densities could mean relatively higher local values, though the difference in the AvMAP and Herschel resolutions is large.
Figure 3b shows the distributions of the clump temperatures () found across the RMC using all five Herschel wavelengths and a method described by Schneider et al. (2010b) Temperatures could be found for only 402 of the 473 identified clumps (i.e., 323 starless and 79 protostellar clumps), and we limit further discussion only to those clumps. Dust temperatures for these clumps range between 10 K and 30 K. Interestingly, starless clumps appear to be generally warmer than protostellar clumps, a surprise as the latter could be expected to be warmer given internal heating by YSOs. The difference here, however, stems from the large population of starless clumps located to the northwest of the RMC (see Figure 1). At this location, the dust is quite warm owing to its proximity to the O stars in NGC 2244.
4 Clump mass spectra
The mass for each clump, , was determined using its observed 350 m flux and the relation /() = 0.073()()2( cm2g-1)-1[exp(41.1/)-1] M⊙. To account for variations in temperature across the RMC, we assume for each clump its respective value when determining its mass, rather than averages of the distributions shown in Figure 3b. We also use = 0.07 cm2 g-1for a dust opacity, consistent with the dust prescription of Ossenkopf & Henning (1994), and a distance of 1.6 kpc.
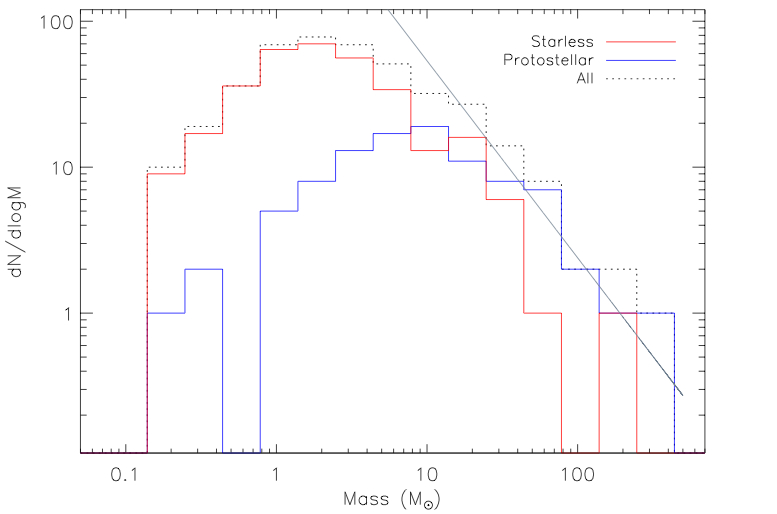
Figure 4 shows the distributions of mass for the total, starless, and protostellar clump populations, i.e., their clump mass spectra (CMS). Masses for all clumps range across 3.5 orders of magnitude, i.e., -0.75 log (/M⊙) 2.50. Evidence for differences in mass between the populations is seen, however, with starless clumps having on average lower masses than protostellar clumps. Moreover, the starless population peaks at log (/M⊙) = 0.25, while the protostellar population peaks at log (/M⊙) = 1.0. This difference is likely because the starless clumps in the RMC are both warmer and have lower submillimetre fluxes on average than the protostellar clumps (see Figures 2 and 3). Note also that there are fewer higher mass starless clumps than protostellar clumps, e.g., over the high-mass range of log (/M⊙) = 1.75-2.50, only two starless clumps are found but 11 protostellar clumps.

Table 1 lists the linear slopes () fit to the high-mass tails of the respective CMS, using the least-squares method and assuming Poissonian errors in each mass bin. Table 1 also lists the mass ranges used to compute the slopes. In general, slopes were fit between the bin containing the peak of the respective CMS and the bin of the highest mass in the sample. The = -0.65 0.01 for all high-mass clumps is slightly more than the value of -0.8 found by Dent et al. (2009) from CO 3-2 observations over a 5 deg2 map of the entire Rosette complex. The value found here, however, is quite similar to the -0.6 slope found by Schneider et al. (1998) for higher clump masses using CO (2-1) maps of the Rosette. Both these groups used different clump identification algorithms than used here, i.e., clumpfind by Dent et al. and gaussclumps by Schneider et al. (1998). Moreover, we have determined masses from clumps we identified here, not over the extents of the clumps found by either group using CO.
| Clump Type | Mass Range | |
|---|---|---|
| All | -0.65 0.01 | 0.25 log (/M⊙) 2.50 |
| Starless | -0.82 0.02 | 0.25 log (/M⊙) 2.25 |
| Protostellar | -0.80 0.02 | 1.00 log (/M⊙) 2.50 |
After dividing the clumps by type, our starless and protostellar clumps have similar slopes to their high-mass distributions, i.e., = -0.8, but over different mass ranges. Indeed, these slopes are more similar to that found by Dent et al. The high-mass tails of the all-clump CMS has a shallower slope than do just starless or protostellar clumps. This difference stems from the difference in the mass ranges used to measure slopes. Also, the numbers of protostellar clumps peak at a higher mass than do those of starless clumps, and they dominate the all-clump CMS at even higher masses.
With single fits, all three CMS are shallower at higher masses than seen in the high-mass tails of mass spectra of small-scale structures within closer clouds. Indeed, the slopes of such tails are seen to be consistent with the -1.35 slope of the Salpeter IMF (e.g., in Aquila; see André et al. 2010). For comparison with the RMC, a Salpeter slope is also shown in Figure 4. This difference may come simply from resolution; namely, in closer clouds, sites of individual star formation, (“cores”) can be resolved. For example, typical core separations in Ophiuchus at 125 pc were found to be 0.03 pc by Motte, André & Neri (1998). Though our minimum linear resolution (at 250 m) is 0.12 pc, or about the expected size of isolated cores, we may not be able to resolve individual cores in the RMC owing to crowding on scales 0.12 pc. Indeed, such crowding may cause the resulting mass spectra to be artificially shallow. Higher resolution data will be critical for testing this possibility.
Without appropriate spectral line data, we cannot estimate the states of gravitaitonal stability for the clumps in the RMC, and determine which may be bound or which may be transient structures. For example, we cannot presently guess which starless clumps will likely engage in future star formation. It is clear from Figure 1, however, that the Herschel data have revealed that star formation is ongoing in the RMC and that we are seeing only a snapshot of a very dynamical situation.
5 Summary
We have conducted a preliminary analysis of small-scale emission within the Rosette molecular cloud, as observed by the Herschel Space Observatory. From SPIRE and smoothed PACS images, we identified 473 clumps using getsources, a new algorithm that identifies structure over multiple wavelengths and scales. Using Spitzer data, we classified these into 371 starless and 102 protostellar clumps. The clumps have dust temperatures of 10-30 K, with starless clumps surprisingly warmer on average than the protostellar clumps, owing to the proximity of many to NGC 2244. Masses were determined for each clump, revealing a range of -0.75 log (/M⊙) 2.50. Linear least-squares fits to the high-mass tails of the CMS reveal slopes that are consistent with slopes fit to mass spectra of clumps identified through CO in the RMC. Such slopes are shallower than those seen in the high-mass tails of the mass spectra of small-scale continuum structures (“cores”) in closer clouds, possibly from crowding of such objects on scales smaller than probed here.
Acknowledgements.
We thank our referee, Jonathan Williams, for comments that improved this paper. JDF acknowledges support by the National Research Council of Canada, the Canadian Space Agency (via a SSEP Grant), and the Natural Sciences and Engineering Council of Canada (via a Discovery Grant). JDF also thanks David Naylor for encouragement and assistance over the years.SPIRE has been developed by a consortium of institutes led by Cardiff University (UK) and including Univ. Lethbridge (Canada); NAOC (China); CEA, LAM (France); IFSI, Univ. Padua (Italy); IAC (Spain); Stockholm Observatory (Sweden); Imperial College London, RAL, UCL-MSSL, UKATC, Univ. Sussex (UK); and Caltech, JPL, NHSC, Univ. Colorado (USA). This development has been supported by national funding agencies: CSA (Canada); NAOC (China); CEA, CNES, CNRS (France); ASI (Italy); MCINN (Spain); SNSB (Sweden); STFC (UK); and NASA (USA). PACS has been developed by a consortium of institutes led by MPE (Germany) and including UVIE (Austria); KUL, CSL, IMEC (Belgium); CEA, LAM (France); MPIA (Germany); IFSI, OAP/AOT, OAA/CAISMI, LENS, SISSA (Italy); IAC (Spain). This development has been supported by the funding agencies BMVIT (Austria), ESA-PRODEX (Belgium), CEA/CNES (France), DLR (Germany), ASI (Italy), and CICT/MCT (Spain).
References
- (1) André, P. et al. 2010, A&A, this volume
- (2) Dent, W. R. F., et al. 2009, MNRAS, 395, 1805
- (3) Griffin, M., et al. 2010, this volume
- (4) Henneman, M., et al. 2010, this volume
- (5) Johnson, H. L. 1962, ApJ, 136, 1135
- (6) Johnstone, D., Di Francesco, J. & Kirk, H. 2004, ApJ, 611, L45
- (7) Li, J. Z., & Smith, M. 2005, AJ, 130, 721
- (8) Lombardi, M., & Alves, J. 2001, A&A, 377, 1023
- (9) Men’shchikov, A. et al. 2010, A&A, this volume
- (10) Motte, F., André, P., & Neri, R. 1998, A&A, 336, 150
- (11) Motte, F., et al. 2010, A&A, this volume
- (12) Ossenkopf, V., & Henning, T. 1994, A&A, 291, 943
- (13) Ott, S. 2010, in ASP Conference Series, Astronomical Data Analysis Software and Systems XIX, Y. Mizumoto, K.-I. Morita, and M. Ohishi, eds. in press
- (14) Park, B., & Sung, H. 2002, AJ, 123, 892
- (15) Pérez, M. R., Thé, P.-S., & Westerlune, B. E. 1987, PASP, 99, 1050
- (16) Phelps, R., & Lada, E. A. 1998, ApJ, 477, 176
- (17) Pilbratt, G., et al. 2010, this volume
- (18) Poglitsch, A., et al. 2010, this volume
- (19) Poulton, C. J., Robitaille, T. P., Greaves, J. S., Bonnell, I. A., Williams, J. P., & Heyer, M. H. 2008, MNRAS, 384, 1249
- (20) Román-Zúñiga, C. G., Elston, R., Ferreira, B., & Lada, E. A. 2008, ApJ, 672, 861
- (21) Román-Zúñiga, C. G., & Lada, E. A. 2008, in “The Handbook of Star Forming Regions, Volume 1: The Northern Hemisphere,” ed. B. Reipurth, (ASP: San Francisco), p. 928 (RZL)
- (22) Sadavoy, S. et al. 2010, ApJ, 710, 1247
- (23) Schneider, N., Bontemps, S., Simon, R., et al. 2010a, astro-ph/1001.2453
- (24) Schneider, N. et al. 2010b, this volume
- (25) Schneider, N., Stutzki, J., Winnewisser, G., & Block, D. 1998, A&A, 335, 1045
- (26) Williams, J. P., Blitz, L., & McKee, C. F. 2000, in “Protostars and Planets IV,” eds. V. Mannings, A. P. Boss, & S. S. Russell, (Tucson: University of Arizona), p. 97
- (27) Williams, J. P., Blitz, L., & Stark, A. 1995, ApJ, 451, 252