Self-organized synthesis of patterned magnetic nanostructures with in-plane and perpendicular to the plane magnetization
Abstract
Patterned arrays of ferromagnetic nanoparticles of Co, Ni, and FeCo have been synthesized from their ultrathin metal films on SiO substrate by nanosecond laser-induced self-organization. The morphology, nanostructure, and magnetic behavior of the nanoparticle arrays were investigated by a combination of electron, atomic force, and magnetic force microscopy techniques. Transmission electron microscopy investigations revealed a granular polycrystalline nanostructure, with the number of grains inside the nanoparticle increasing with their diameter. Magnetic force measurements showed that the magnetization direction of the Co and Ni nanoparticles was predominantly out-of-plane while those for the FeCo alloy was in the plane of the substrate. This difference in behavior is due to the dominating influence of magnetostrictive energy on the magnetization as a result of residual thermal strain following fast laser processing. Since the magnetostriction coefficient is negative for polycrystalline Co and Ni, and positive for FeCo, the tensile residual strain forces the magnetization direction of the negative magnetostriction materials out-of-plane and the positive magnetostriction materials in-plane. This demonstrates a cost-effective non-epitaxial technique for the fabrication of patterned arrays of magnetic nanoparticles with tailored magnetization orientations.
Department of Physics and Center for Materials Innovation, Washington University in St. Louis, MO 63130
Department of Materials Science and Engineering, University of Tennessee, Knoxville, TN 37996
Department of Chemical and Biomolecular Engineering, University of Tennessee, Knoxville, TN 37996
1. Introduction
Fabrication of patterned nanostructures consisting of discrete nanoparticles whose physical properties (e.g. magnetic, semiconducting, optical) can be reliably controlled by shape, size, and spacing, in conjunction with processing parameters, is of prime importance in the field of nanotechnology. Arrays of magnetic nanoparticles can be used for many applications, including high density magnetic data storage [1] to non-volatile and high speed magnetic random access memories (MRAM) [2], opto-electronics [3], and biological sensor applications [4, 5]. One of the important challenges in the applications of magnetic nanoparticles is the control of magnetic orientation of each nanoparticle, which can provide additional advantages. For example, particles with perpendicular to the plane anisotropy enable higher density for the same signal-to-noise ratio [6] and lower read and write errors [7], compared to particles with in-plane magnetization. In the absence of an external magnetic field, the magnetic moment of a ferromagnetic material aligns spontaneously along a preferred direction. This direction corresponds to the minimum magnetic energy, which is determined by intrinsic material parameters such as crystalline anisotropy, as well as extrinsic parameters related to the processing conditions, such as shape, size, and strain. Therefore, achieving desired magnetic orientation and switching behavior requires control of magnetic energy through the choice of materials and processing parameters. For instance, epitaxial thin film growth technique can be used to synthesize single crystal magnetic nanodots, where the magnetocrystalline anisotropy uniquely determines the magnetization direction [8].
In this work, we demonstrate magnetic orientation control in polycrystalline nanoparticles through non-epitaxial means. We have synthesized ordered magnetic nanoparticle arrays with the magnetization direction tailored either in-plane or perpendicular to the plane. The magnetic nanoparticle arrays were produced on amorphous SiO2 surfaces by nanosecond (ns) laser-induced self organization of nm thick ferromagnetic metal films. In this process, the ns laser pulse melts the film, which then undergoes a spontaneous change in morphology. Application of multiple pulses leads to self-organized nanoparticles with predictable particle size and interparticle spacing. The self-organization is a result of spinodal dewetting [9, 10, 11] or thermocapillary driven flow [12, 13, 14]. We have used this approach previously to synthesize single-domain Co [15] and Fe nanoparticles [16], which showed particle size-dependent magnetic anisotropy behavior. Here we have applied this technique to orient the magnetization direction of the nanoparticles either in-plane or perpendicular to the substrate plane. We have chosen two elemental ferromagnets with negative magnetostriction coefficient, , (= -30 ppm for Co and = -34 ppm for Ni) and one alloy, FeCo, with positive magnetostriction coefficient ( = +84 ppm) [17, 18, 19]; the quoted values of are for polycrystalline materials. The ensuing investigations of magnetic properties show that single-domain nanoparticles of Co and Ni have preferential perpendicular (out-of-plane) magnetic orientation, while those of FeCo have preferential in-plane orientation. The reason for this difference was attributed to the coupling of strain (tensile), generated within the nanoparticles by the substrate during rapid thermal processing, to the magnetostriction. The opposite sign of the magnetostriction coefficients for Co and Ni compared to FeCo is responsible for their different orientations.
2. Experimental Details
A thin film of Co ( nm) was deposited using electron beam evaporation (e-beam), while Ni ( nm), and FeCo ( nm) films were deposited using pulsed laser deposition (PLD) technique on commercially available optically smooth SiO/Si(100) substrates under ultra high vacuum ( Torr). The thermally grown oxide (SiO) layer was 400 nm thick. Prior to evaporation, the samples were cleaned in an ultrasonic bath with acetone, followed by methanol and de-ionized water. The ingot for PLD used for FeCo alloy was made by repeated arc-melting of a stoichiometric mixture of Co and Fe (4N pure, Alfa Aesar). The arc-melting was performed in a water-cooled copper hearth under a high purity TiZr-gettered argon atmosphere. The thicknesses of the films were determined by in-situ quartz crystal thickness monitor and calibrated electron dispersive x-ray spectroscopy (EDS) measurements. The films were irradiated with a Nd:YAG pulsed laser beam (266 nm wavelength, 9 ns pulse width, and 50 Hz repetition rate) under high vacuum. The energy density of the laser pulses ( mJ/cm) was chosen to be slightly above the melt threshold [20]. Approximately 3000 laser pulses were required to achieve the pattern with arrays of nanoparticles. Two types of laser irradiation experiments were performed. For the case of Ni and FeCo, a spatially uniform single beam was incident perpendicular to the substrate surface to produce nanoparticle arrays by spinodal dewetting [9, 10, 11]. For Co, two beam laser-interference irradiation was performed to produce a 1-dimensional ordered nanoparticle array [12].
The resulting nanoparticle arrays were characterized by scanning electron microscopy (SEM, Hitachi S-4500) and by transmission electron microscopy (TEM, JEOL 2100F) using a 200 KeV beam. The TEM samples were prepared by a chemical etching method [21]. Tapping mode atomic force microscopy (AFM) and zero-field magnetic force microscopy (MFM), using a Digital Instruments Dimension 3000 instrument, were performed on the nanoparticle arrays to obtain the topographic image, and magnetization direction, respectively. A silicon cantilever, coated with a few tens of nm thick CoCr alloy (Asylum Research, ASY), was used in the MFM measurements at a scan height of 50 nm. To rule out any influence of the MFM-tip on the measurement, MFM was performed in different directions ( and ) and at different heights (, and nm) from the sample. The orientation of the magnetization of individual nanoparticles was determined by comparing the MFM image contrast of the nanoparticles with simulated images [15].
To determine the residual thermal strain, finite element simulations were performed on - nm diameter hemispherical nanoparticle on top of nm thick SiO2 substrate under the processing conditions. This was accomplished using the COMSOL software package for a 2-D axi-symmetric geometry, where the particle is perfectly adhesed to the substrate. The model is set to be stress-free at the melting point of the nanoparticle, and the stresses and strains generated during cooling to room temperature due to thermal contraction are determined. The substrate is assumed to be elastic, and the particle is modeled as both a purely elastic (in which case the yield stress is infinite) and elastic-perfectly plastic (in which case the standard yield strength, , of the material is used) solid [22]. The yield strength, , of annealed pure Co (400 MPa) and pure Ni (300 MPa) was determined by converting large depth hardness data by means of the tabor relation, Hardness = 3 [23, 24, 25]. The average stresses within the particle were converted to elastic strain by Hooke’s law, resulting in two tensile in-plane principal elastic strains, corresponding to the radial and hoop strains (in cylindrical geometry) [22]. The various materials parameters used and results obtained are tabulated in table 1.
3. Results
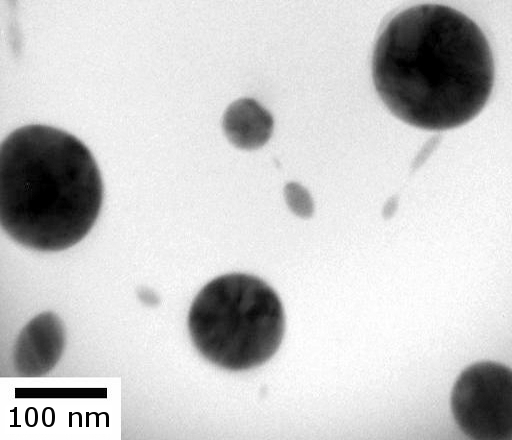
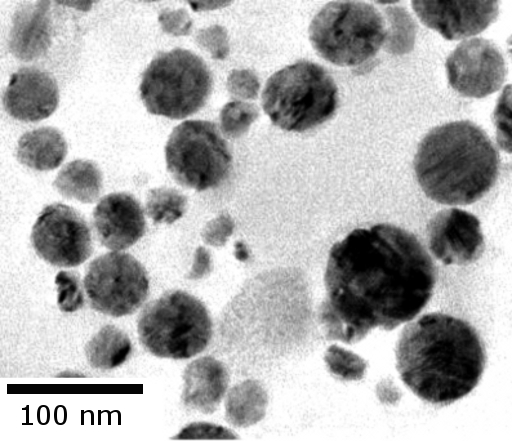
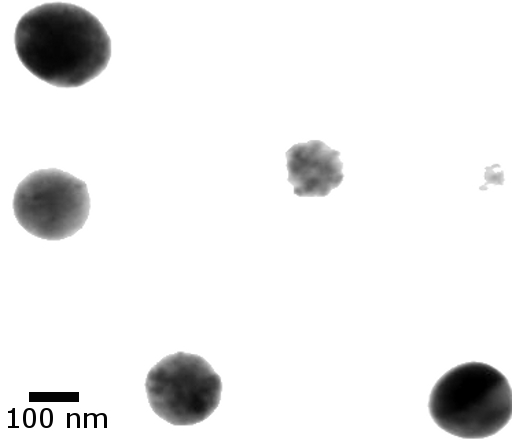
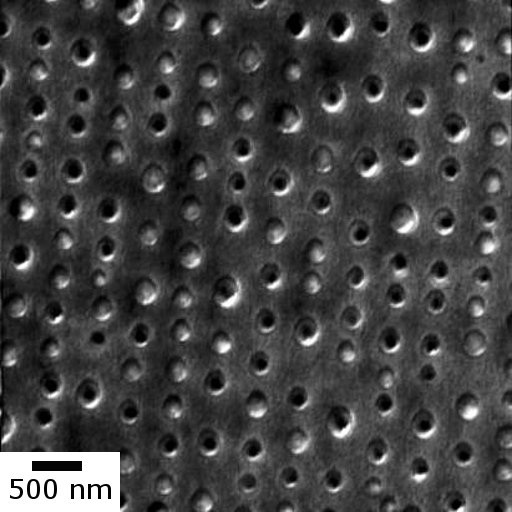
The microstructural studies on the arrays of Co, Ni and FeCo particles are shown in Fig.1. Figure1(a) is the bright field (BF) TEM micrograph of Co nanoparticles. Detailed microstructural analysis for Co particles, published in ref. [15], revealed a granular microstructure with random orientation of the grains inside the nanoparticles. The number of grains increased with increasing nanoparticle size from 1 grain (i.e. single crystal) for the smaller particles ( nm) to 20-30 grains for the bigger particles ( nm), with small statistical variation when different similar size particles were compared. Figure1(b) is the BF TEM image for the array of Ni nanoparticles. These also indicate a granular nanostructure with random grain orientation. Similar to Co, the very small Ni particles ( nm) are single grained while the bigger particles have multiple grains (e.g., nm particles show nearly 20 grains). The TEM image of FeCo nanoparticles [shown in Fig.1(c)] also showed similar granular behavior. The main difference was the large statistical variation in the number of grains from particle to particle, even when the size was similar (e.g., a small fraction of nm size particles had only 2-5 grains, while the majority had more than 15 grains).
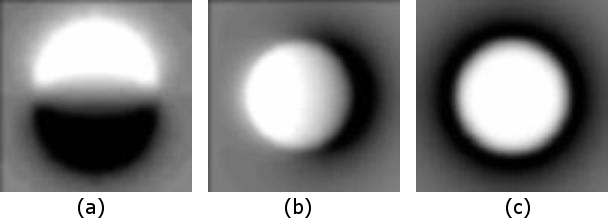
Figure2 shows the AFM (2(a)) and zero-field MFM (2(b)) images of an array of Co nanoparticles produced by two beam irradiation. The separation between the rows of particles is nm, consistent with the separation of the interference fringes from the two beams. The regular 1D pattern of the nanoparticles along the lines is clearly evident. A 2D pattern can also be formed using three beam irradiation [14]. The average particle diameter was measured to be nm. The corresponding MFM image in Figure 2(b) shows that the image contrast of the particles is either uniformly dark with a bright periphery or uniformly bright with a dark periphery. When compared with the simulated MFM image contrast of single domain particles with different magnetization directions (Fig.3), it is clear that all particles in Fig.2(b) are single domain and have their magnetization oriented perpendicular to the substrate plane; the exactly opposite image contrast of the two groups is due to their magnetization pointing either up or down. The single domain behavior of such large diameter particles, exceeding that of theoretically calculated single domain size of 60 nm for single crystal Co particles [26, 17], is possibly due to strong exchange coupling among the grains in these polycrystalline nanoparticles.
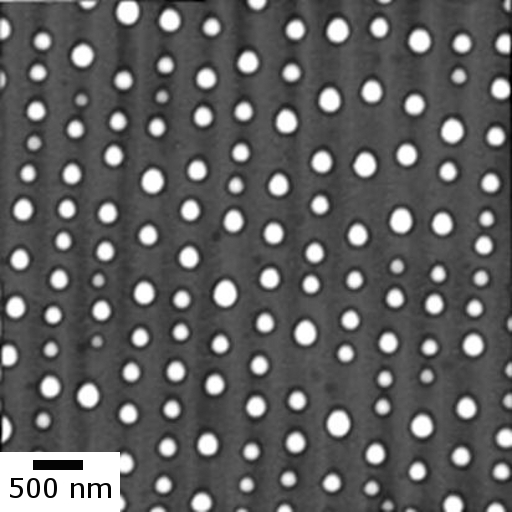
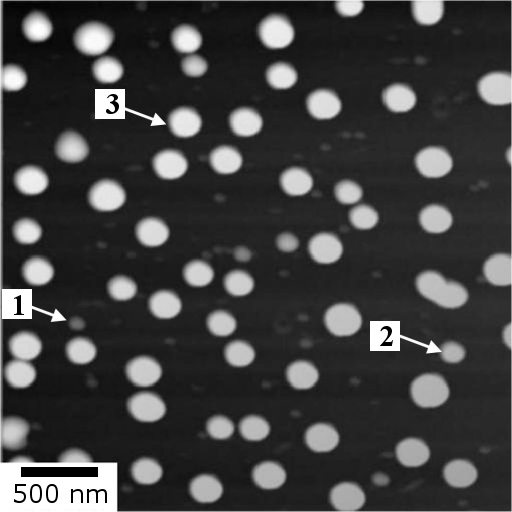
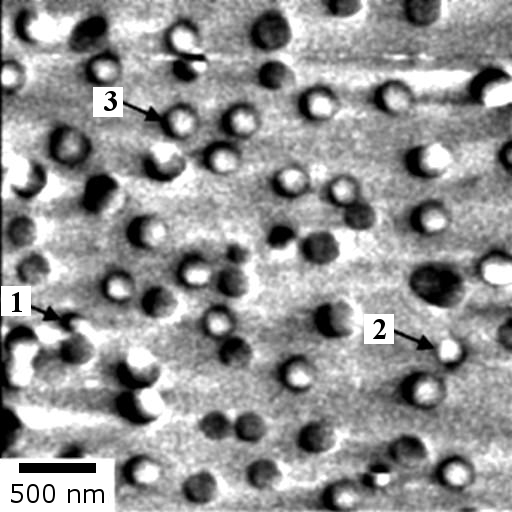
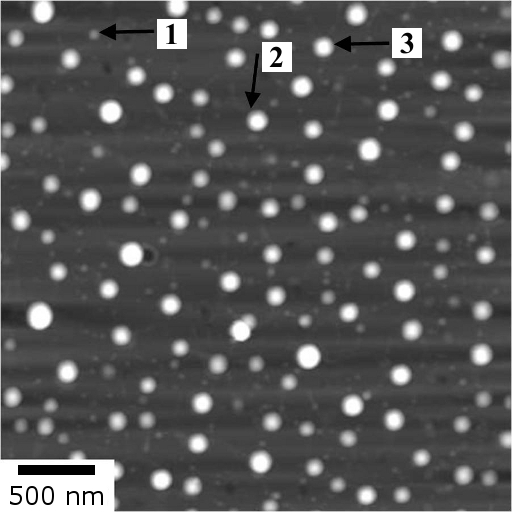
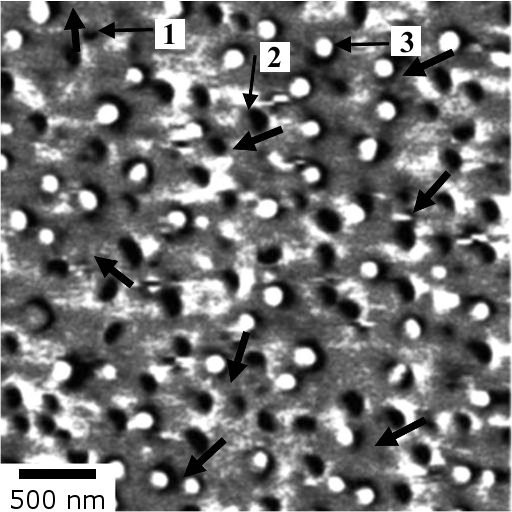
The AFM and MFM images for the Ni array produced by a single beam irradiation, is shown in Figure4(a) and 4(b), respectively. Due to self-organization by spinodal dewetting, the particles have a characteristic interparticle spacing (~ 615 nm) and a fairly narrow particle size distribution ( nm). Compared to the two beam irradiation, the spatial distribution of these particles do not follow any pattern, however. Similar to Co, the contrast in the MFM image [Fig.4(b)] indicates that almost all particles (similar in size to that marked as # 3) have their magnetization perpendicular to the substrate plane, either up or down. A few particles (e.g. marked as 2 in Figure4(a)) have their magnetization at an angle to the plane; only the smallest particle (marked as 1) of about 75 nm in diameter is oriented at a small angle to the plane. Again, the nanoparticles have a multi-grained microstructure, but are single domain up to about 220 nm diameter, which is slightly larger than the previously reported value of ~ 180 nm for spherical single grain Ni nanoparticle [27].
The AFM and the MFM images on an array of FeCo nanoparticles, produced by a single beam irradiation of a nm film are shown in Figures5(a) and (b), respectively. The average particle diameter is nm with about ~ 580 nm separation. The particles with diameters nm and nm, indicated as and in the AFM and MFM images, show in-plane () magnetization. In stark contrast to Co and Ni nanoparticles, most of the FeCo nanoparticles (around 70 %) show in-plane magnetization while the rest (e.g. number 3) are at a small angle () to the plane. These multigrain particles remain single domain up to about nm in diameter. These results clearly show a difference in the orientation of the magnetization of the nanoparticles with respect to the substrate plane when the magnetostriction coefficient changes sign.
The average in-plane elastic thermal strains determined from the finite element simulations were found to be independent of particle size since the only length scale present in the problem is the ratio of particle diameter to the size of the SiO2 substrate, which is sufficiently large. The larger of the two (radial versus hoop strain) average in-plane elastic strains is given in Table1, along with the material parameters used in the simulation [28]. Only the average elastic component of strain is reported due to its contribution to the magnetostrictive energy. With no mechanism to relieve internal stresses, the elastic solutions (corresponding to the columns with yield stress in table 1) represent an upper bound on the average elastic strains. The average elastic strain is found to be lower for the elastic-perfectly plastic simulations (corresponding to the columns with finite values of yield stress in table 1) due to the presence of large plastic deformations. The yield strength chosen and the nature of the elastic-perfectly plastic simulations neglects any size, strain hardening and cooling rate affects, which may significantly reduce plastic deformations consequently increasing average stresses and elastic strains within the particle [22, 29]. For this reason, the elastic-plastic simulations are assumed to be a lower bound of the resulting average elastic strain.
4. Discussion
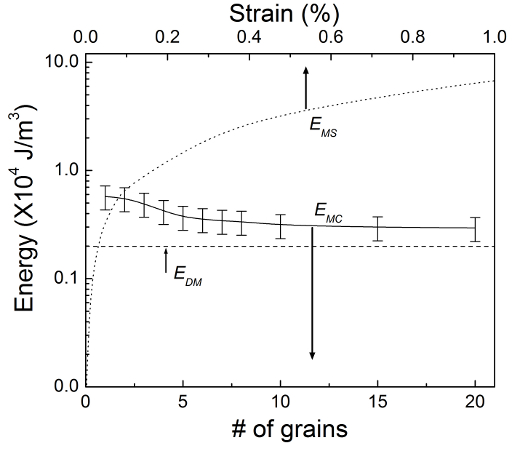
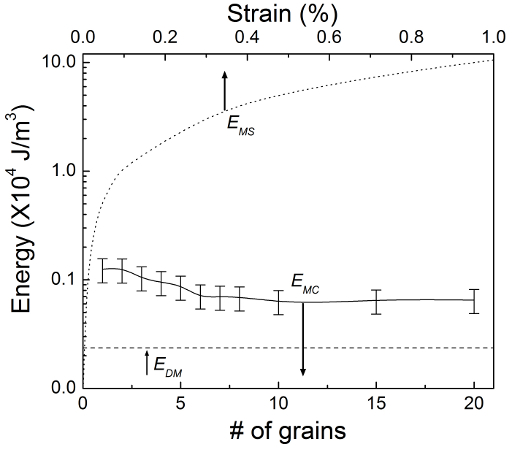
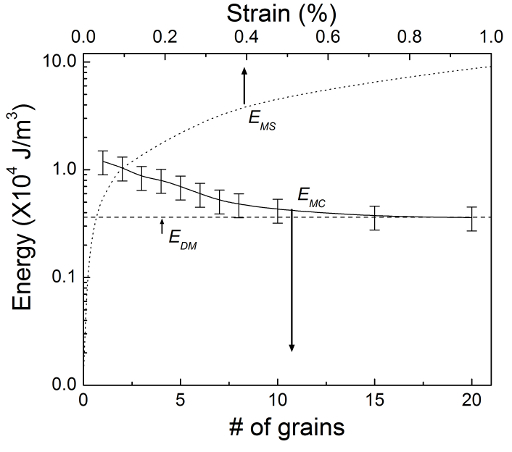
To understand this difference, we now focus on the various contributions to the magnetic energy of a nanoparticle. The magnetocrystalline anisotropy, which depends on the crystal structure, is significant only for single crystal or polycrystalline particles with preferred crystallographic orientation of the grains. For random crystallographic orientation of the grains, such as the case here, the contribution of crystalline anisotropy scales inversely with the number of grains [30]. We have estimated that the crystalline anisotropy is at least one to two orders of magnitude smaller than the single crystal value for nanoparticles that contain more than 20 grains (see Fig.6 and [15]). Because of the large interparticle separation (400 to 600 nm), dipolar interaction energy is also small ( J/m). The shapes of these nanoparticles are nearly hemispherical as has been determined by the AFM measurements. The estimated contact angles were , , and , for Co, Ni, and FeCo, respectively. For the average particle size and separations, using the known saturation magnetizations (1400, 485, and 1922 Gauss for Co, Ni, and FeCo, respectively [17]), the demagnetization energy was estimated to be , , and J/m for Co, Ni, and FeCo, respectively (see horizontal lines in Fig.6(a-c)). To estimate the magnetostrictive energy, we have used the maximum theoretical elastic strain value of 0.1% for both Co and Ni, and 0.24% for FeCo, obtained from simulation (see Table1). In addition, the magnetostrictive energy contribution (EMS) was calculated as a function of strain (%) in the particles. Fig.6 show such plots for Co, Ni, and FeCo, along with the magnetocrystalline energy, EMC, and demagnetization energy, EDM, as a function of number of grains in the nanoparticles. The calculated values of EMS for maximum strain present in Co, Ni and FeCo particles are, , and J/m, respectively. It clearly shows that, EMS dominates over other energy terms (EMC or EDM), even when a very small amount of strain () is present in these magnetic particles. The dominance of the magnetostrictive energy, therefore controls the magnetization direction of the nanoparticles.
With this reasoning, the difference in the behavior of magnetization direction for the nanoparticles of Co and Ni versus FeCo can be understood. Melting under the 9 ns laser pulse and the subsequent solidification during cooling is associated with large cooling rates, of the order of K/s [20]. One consequence of this quenching is a residual intrinsic biaxial tensile strain within the nanoparticles because of the thermal expansion mismatch between the metal and the SiO substrate [15]. For an in-plane tensile strain, the magnetization will be perpendicular to the substrate plane when the is negative, as is the case for Co and Ni. On the other hand, for positive values of , the magnetization will be in-plane, as is the case for FeCo. One point needs to be clarified, however. A fairly significant number of FeCo nanoparticles (about 30%), also show slightly out of plane () magnetization. Interestingly, as mentioned above, the TEM analysis of FeCo showed large statistical variations in the number of grains in the same diameter nanoparticles. The magnetocrystalline anisotropy contribution cannot be completely neglected when the number of grains is small. For example, the magnetocrystalline anisotropy energy for 2 grains was calculated to be J/m, compared to an order of magnitude smaller value of J/m for 15 grains (anisotropy constant J/m [17]). The magnetocrystalline energy, therefore, may compete with the magnetostrictive energy for particles containing smaller number of grains and orient the magnetization slightly off from the in-plane direction. The same argument may be applied to the in-plane magnetization of smaller Ni nanoparticles. Moreover, some statistical variation in the amount of strain in particles of the same size, or a variation due to the different number of grains in the particles, may also be partly responsible for the above observations.
5. Conclusion
In conclusion, we have synthesized magnetic nanoparticle arrays of Co, Ni, and Fe50Co50 using laser-induced self-organization from ultrathin films deposited on SiO surfaces. The resulting nanoparticles are hemispherical in shape with polycrystalline microstructure. An extensive study of the orientation of the magnetization as a function of nanoparticle size was performed using zero-field MFM. This revealed that the single-domain magnetic nanoparticles of Co and Ni were primarily oriented out-of-plane. On the other hand, nanoparticles of Fe50Co50 were primarily oriented in-plane. The reason for this difference was attributed to the difference in the sign of magnetostriction coefficients. Magnetic energy arguments showed that the magnetostrictive energy dominates among all other contributions, when some residual tensile strain is present in the nanoparticles due to the fast cooling process following the ns pulsed laser irradiation. As a result, metals with negative magnetostriction coefficient (Co, and Ni) show out-of-plane magnetization while, positive magnetostriction coefficient materials (Fe50Co50) showed in-plane magnetization. This demonstrates a cost-effective, non-epitaxial, laser-based processing technique for the production of one- and two-dimensional arrays of magnetic nanoparticles with controlled magnetization directions.
Acknowledgments
RK acknowledges support by the National Science Foundation through CAREER grant NSF-DMI-0449258, and NSF-CMMI-0855949, while RK and AKG acknowledge grant NSF-DMR-0856707. AKG and HK also acknowledge support from CMI . HK would also like to acknowledge Vanessa Ramos for her inputs in the preparation of this manuscript.
References
- [1] M. Todorovic, S. Schuttz, J. Wong, and A. Scherer Appl. Phys. Lett., vol. 74, p. 2516, 1999.
- [2] S. Y. Chou, P. R. Krauss, and L. Kong J. Appl. Phys., vol. 79, p. 6101, 1996.
- [3] M. Saleno, J. R. Krenn, B. Lamprecht, G. Schider, H. Ditlbacher, N. Felidj, A. Leitner, and F. R. Aussenegg Opto-Electron. Rev., vol. 10, p. 217, 2002.
- [4] S. R. Dave and X. Gao Wiley Interdisciplinary Reviews: Nanomedicine, 2009.
- [5] R. S. Molday and D. MacKenzie J. Immunol. Methods, vol. 52, p. 353, 1982.
- [6] H. N. Bertram and M. Williams IEEE Trans. Magn., vol. 36, p. 4, 2000.
- [7] M. Albrecht, S. Ganesan, C. T. Rettner, A. Moser, M. E. Best, R. L. White, and B. D. Terris IEEE Trans. Magn., vol. 39, p. 2323, 2003.
- [8] H. M. Hwang, S. W. Shin, J. H. Kang, J. Lee, J. H. Lee, J. H. Song, J. Y. Choi, H. H. Lee, and H. S. Lee J. Korean Phys. Soc., vol. 49, pp. 1016–1019, 2006.
- [9] H. Krishna, N. Shirato, C. Favazza, and R. Kalyanaraman Phys. Chem. Chem. Phys., vol. 11, p. 8136, 2009.
- [10] C. Favazza, J. Trice, H. Krishna, R. Kalyanaraman, and R. Sureshkumar Appl. Phys. Lett., vol. 88, p. 1531181, 2006.
- [11] C. Favazza, R. Kalyanaraman, and R. Sureshkumar Nanotechnology, vol. 17, p. 4229, 2006.
- [12] C. Favazza, J. Trice, R. Kalyanaraman, and R. Sureshkumar Appl. Phys. Lett., vol. 91, p. 043105, 2007.
- [13] J. Trice, C. Favazza, D. Thomas, H. Garcia, R. Kalyanaraman, and R. Sureshkumar Phys. Rev. Lett., vol. 101, no. 1, p. 017802, 2008.
- [14] A. K. Gangopadhyay, H. Krishna, C. Favazza, C. Miller, and R. Kalyanaraman Nanotechnology, vol. 18, p. 485606, 2007.
- [15] H. Krishna, C. Miller, L. Longstreth-Spoor, Z. Nussinov, A. K. Gangopadhyay, and R. Kalyanaraman J. Appl. Phys., vol. 103, no. 7, p. 073902, 2008.
- [16] H. Krishna, N. Shirato, A. K. Gangopadhyay, and R. Kalyanaraman Proc. SPIE, vol. 7039, p. 703909, 2008.
- [17] B. D. Cullity, Introduction To Magnetic Materials. Addison-Wesley Publishing Company, 1972.
- [18] R. C. Hall J. Appl. Phys., vol. 30, p. 816, 1959.
- [19] B. E. Lorenz and C. D. Graham IEEE Trans. Magn., vol. 40, p. 2751, 2004.
- [20] J. Trice, D. Thomas, C. Favazza, R. Sureshkumar, and R. Kalyanaraman Phys. Rev. B, vol. 75, p. 235439, 2007.
- [21] L. Longstreth-Spoor, J. Trice, H. Garcia, C. Zhang, and R. Kalyanaraman J. Phys. D: Appl. Phys., vol. 39, p. 5149, 2006.
- [22] G. F. Dieter, Mechanical metallurgy (3rd ed.). McGraw Hill, New York, 1986.
- [23] A. A. Karimpoor, U. Erb, K. T. Aust, and G. Palumbo Scripta Mat., vol. 49, pp. 651–656, 2003.
- [24] Z. Zong, J. Lou, O. O. Adewoye, A. A. Elmustafa, F. Hammad, and W. O. Soboyejo Mat. Sci. and Eng. A, vol. 434, pp. 178–187, 2006.
- [25] D. Tabor, The Hardness of Metals. Clarendon Press, Oxford, 1951.
- [26] C. Kittel Phys. Rev., vol. 70, p. 965, 1946.
- [27] X. Liu, U. Meridor, P. Zhao, G. Song, A. Frydman, and A. Gedanken J. Magn. Magn. Mat., vol. 301, p. 13, 2006.
- [28] G. A. Alers, J. R. Neighbours, and H. Sato J. Phys. Chem. Solids, vol. 13, p. 40, 1960.
- [29] Q. Ma and D. Clarke J. Mater. Res., vol. 10, p. 853, 1995.
- [30] R. M. H. New, R. F. W. Pease, and R. L. White IEEE Trans. Magn., vol. 31, p. 3805, 1995.
| Property | SiO2 | Cobalt | Nickel | Fe50Co50 | |||
| Thermal expansion coeff. | 0.55 | 13 | 13.4 | 12.4 | |||
| Melting temperature | (K) | 1768 | 1728 | 1748 | |||
| Young’s modulus | E (GPa) | 72 | 209 | 200 | 82.7 | ||
| Poisson’s ratio | 0.17 | 0.31 | 0.31 | 0.31 | |||
| Yield strength | (MPa) | 400 | 250 | ||||
| Avg. in-plane elastic strain | 0.10 | 0.04 | 0.11 | 0.5 | 0.24 | ||
