Strong Lensing as a Probe of the Mass Distribution
Beyond the Einstein Radius
Strong lensing has been employed extensively to obtain accurate mass measurements within the Einstein radius. In this article, we use strong lensing to probe mass distributions beyond the Einstein radius. We consider SL2S J08544-0121, a galaxy group at redshift with a bimodal light distribution and with a strong lensing system located at one of the two luminosity peaks separated by . The main arc and the counter-image of the strong lensing system are located at 5 and 8, respectively, from the lens galaxy centre. We find that a simple elliptical isothermal potential cannot satisfactorily reproduce the strong lensing observations. However, with a mass model for the group built from its light-distribution with a smoothing factor and a mass-to-light ratio M/L, we obtain an accurate reproduction of the observations. We find M/L = 98 27 ( band, solar units, not corrected for evolution) and = 20 9 (2 confidence level). Moreover, we use weak lensing to estimate independently the mass of the group, and find a consistent M/L in the range 66-146 (1- confidence level). This suggests that light is a good tracer of mass. Interestingly, this also shows that a strong lensing only analysis (on scales of 10) can constrain the properties of nearby objects (on scales of 100). We characterise the type of perturbed strong lensing system allowing such an analysis: a non dominant strong lensing system used as a test particle to probe the main potential. This kind of analysis needs to be validated with other systems since it could provide a quick way of probing the mass distribution of clusters and groups. This is particularly relevant in the context of forthcoming wide field surveys, which will yield thousands of strong lenses, some of them being perturbed enough to pursue the analysis proposed in this paper.
Key Words.:
Gravitational lensing: strong lensing – Galaxies: groups –1 Introduction
Gravitational lensing probes the mass distribution projected along the line of sight. When the surface mass density of a lens is larger than a critical threshold, i.e. in the strong lensing (SL) regime, the light from a background source galaxy is lensed into multiple images. These multiple images provide strong observational constraints on the projected mass distribution of the lens within the Einstein radius. Since the discovery of the first gravitational arc in the galaxy cluster Abell 370 twenty years ago (Lynds & Petrosian, 1986; Soucail et al., 1987; Richard et al., 2010), strong lensing has been widely used to probe the mass distribution of structures at different scales: galaxies (see, e.g. the SLACS survey, Koopmans et al., 2006), galaxy clusters (see, e.g. Halkola et al., 2006) and recently galaxy groups (Cabanac et al., 2007; Limousin et al., 2009; Belokurov et al., 2009).
1.1 Perturbing a Strong Lensing System
Because most of the galaxies in the Universe are part of larger structures, either groups or clusters, so are many SL systems (see, e.g. Kundic et al., 1997; Fassnacht & Lubin, 2002; Faure et al., 2004; Morgan et al., 2005; Williams et al., 2006; Momcheva et al., 2006; Auger et al., 2007; Tu et al., 2008; Auger et al., 2008; Grillo et al., 2008; Treu et al., 2009; Inada et al., 2009). A mass distribution located at a small angular distance from a strong lens may induce measurable perturbations in the lensing signal. Not taking this external perturbation into account can seriously bias the results inferred from the SL modelling as shown by Keeton & Zabludoff (2004): they found that if the environment is neglected, SL modelling of double-image lenses largely overestimate both the ellipticity of the lens galaxy () and the Hubble constant (). In contrast, models of four-image lenses in which perturbations by the environment are incorporated as a tidal shear, recover the ellipticity reasonably well, while still overestimating the Hubble constant (). They argue that most of the biases are due to the neglected convergence from nearby massive groups or clusters of galaxies. More generally, the topic of modelling a lens with an external mass perturbation has been addressed by different authors (see, e.g Keeton et al., 1997; Kochanek et al., 2001; Keeton & Zabludoff, 2004; Oguri et al., 2005, 2008; Dye et al., 2007, and references therein).
To summarise, a precise SL modelling can be affected by external mass distributions, and people have tried to take this bias into account in order to improve the SL modelling. As observations become more and more accurate, we can expect to be more and more sensitive to external mass distributions near strong lenses. In this article, we propose to exploit this external effect by using the perturbations measured in SL modelling as probes of the external mass distribution.
1.2 The “Ring” Test in Abell 1689
We first remind the reader of a previous attempt we made to locally probe the potential of the galaxy cluster Abell 1689 with a perturbed SL system. In the core of galaxy cluster Abell 1689, Limousin et al. (2007) reported SL systems (“rings”) formed around three elliptical galaxies located 100 away from the cluster centre, i.e. the transitional region between the strong and weak lensing regimes. These SL systems should be sensitive to the external shear and convergence produced by their parent cluster (Kochanek & Blandford, 1991). Based on simulations, Tu et al. (2008) showed that such strong lenses could be used to probe the cluster potential locally. They applied this method to the three rings discovered in Abell 1689, and found that solely modelling these three rings (i.e. without including any other multiply-imaged systems that are also produced by the cluster) provides strong evidence for bimodality of the cluster core; it is not possible to model simultaneously the three rings assuming a unimodal mass distribution for the cluster. This bimodality confirms previous parametric SL studies of Abell 1689 (Miralda-Escude & Babul, 1995; Halkola et al., 2006; Limousin et al., 2007; Leonard et al., 2007; Saha et al., 2007; Okura et al., 2008). More importantly, this result shows that SL features of 1-2-wide Einstein rings actually contain information on the mass distribution of the parent cluster, i.e. on a much larger scale than their Einstein radii. In other words, this study suggests that strong lenses can be used to probe mass distributions beyond their Einstein radius. In this article, we further develop this idea on another perturbed SL system located in a galaxy group, SL2S J08544-0121.
All results are scaled to a flat, CDM cosmology with =0.3, =0.7 and a Hubble constant H0=70 km s-1 Mpc-1. In this cosmology, 1 corresponds to a physical transverse distance of 4.94 kpc at . All images are aligned with the WCS coordinates, i.e. north is up and east is left. Magnitudes are given in the AB system. Luminosities are given for the band, in solar units, not corrected for passive evolution. Ellipticities are expressed as , and position angles are given counterclockwise with respect to the west. Shear and convergence are computed for a source redshift of =1.268.
2 SL2S J08544-0121: Presentation & Data
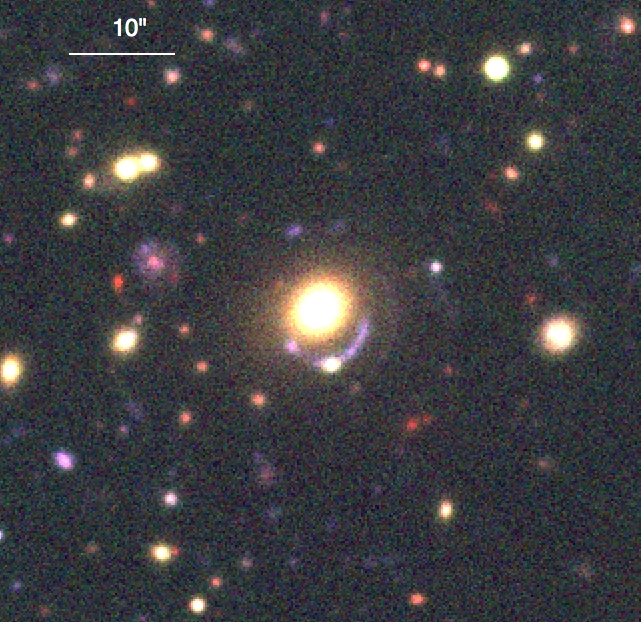
SL2S J08544-0121 is part of the Strong Lensing Legacy Survey (SL2S, Cabanac et al., 2007) , which collects SL systems in the Canada France Hawaii Telescope Legacy Survey (CFHTLS). SL2S J08544-0121 is a galaxy group at presented by Limousin et al. (2009) which contains a SL system (Fig. 1).
2.1 Ground-Based Imaging
SL2S J08544-0121 has been observed in five bands as part of the CFHTLS. The -band data are used to build luminosity maps from isophotal magnitudes of elliptical group members and to perform a weak-lensing analysis.
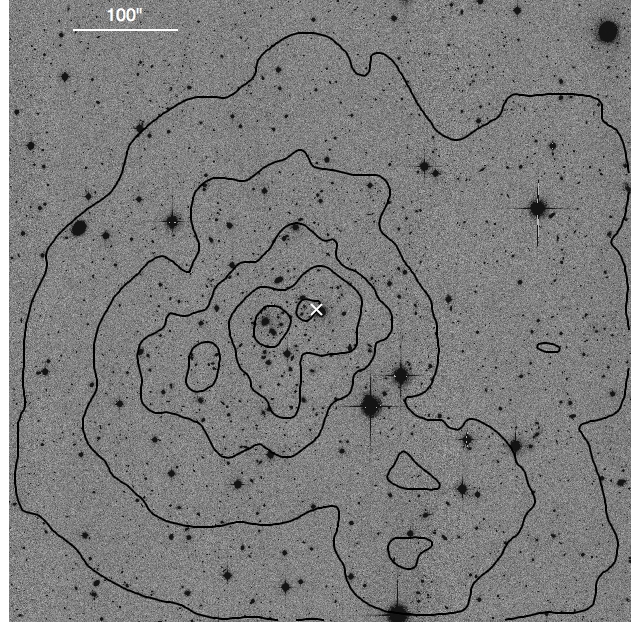
The bottom panel of Fig. 1 shows a 10’ 10’ CFHTLS -band image. The white cross gives the location of the strong lens. We draw luminosity isodensity contours of 105, 3105, 106, 3106 and 107 L☉ kpc-2. The top-right panel also shows a CFHTLS 1-arcmin2 colour image centred on the lens.
2.2 Space-Based Imaging
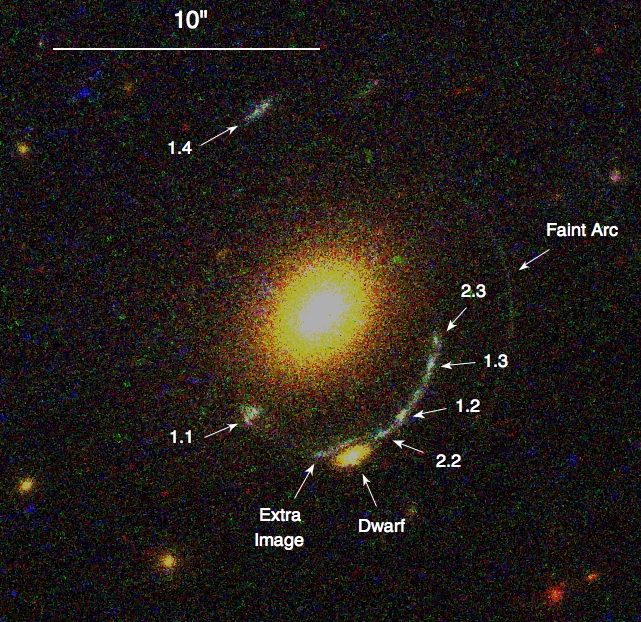
The strong lensing features detected from ground-based images have been observed with the Hubble Space Telescope (HST). Observations were done in snapshot mode (C15, P.I. Kneib, ID 10876) in three bands with the ACS camera (F475, F606, and F814). Figure 1 shows a colour image of the strong lens based on these observations. We report two multiply-imaged systems: the first system is bright and forms a typical cusp configuration perturbed by a satellite galaxy (labelled Dwarf on Fig. 1). The second system is a very faint arc located west of the lens at a larger radius. It is not possible to reliably identify individual images on the faint arc. Moreover, given its faintness, spectroscopy is hopeless with current facilities, as the surface brightness is ca. 31 mag arcsec-2, and therefore it is not used in the following analysis. As can be appreciated on Fig. 1, the HST data brings significant amounts of additional information on the lensed features.
2.3 Spectroscopy
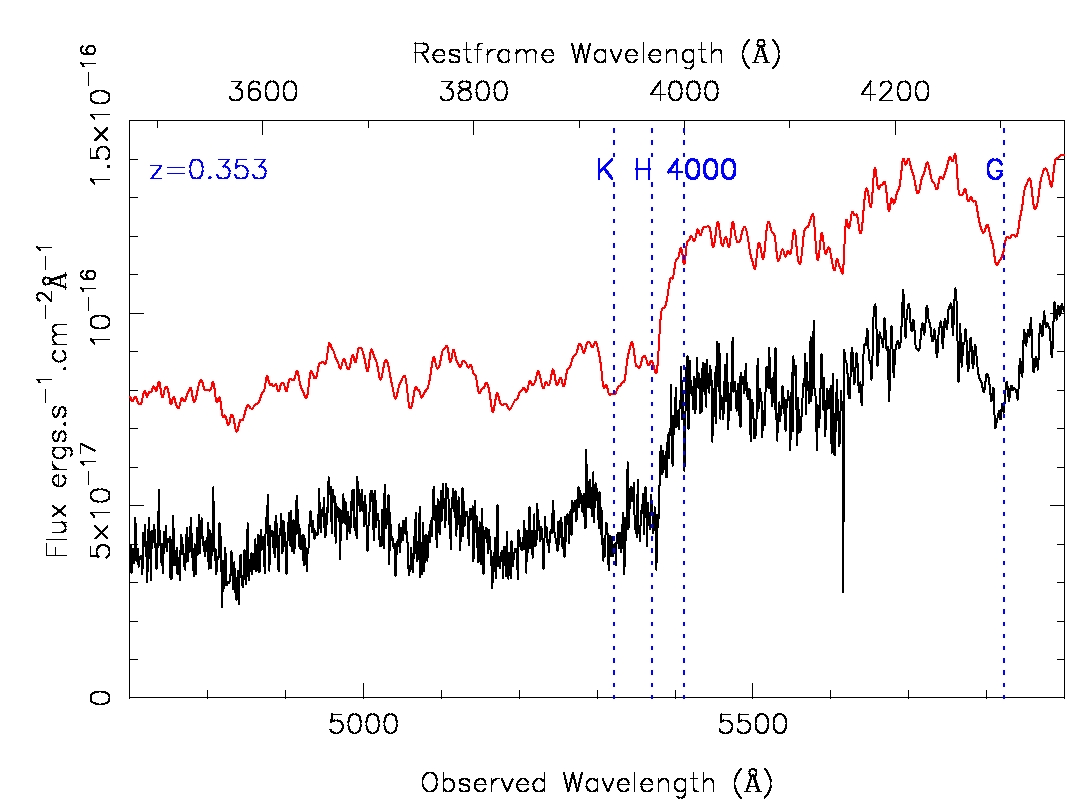
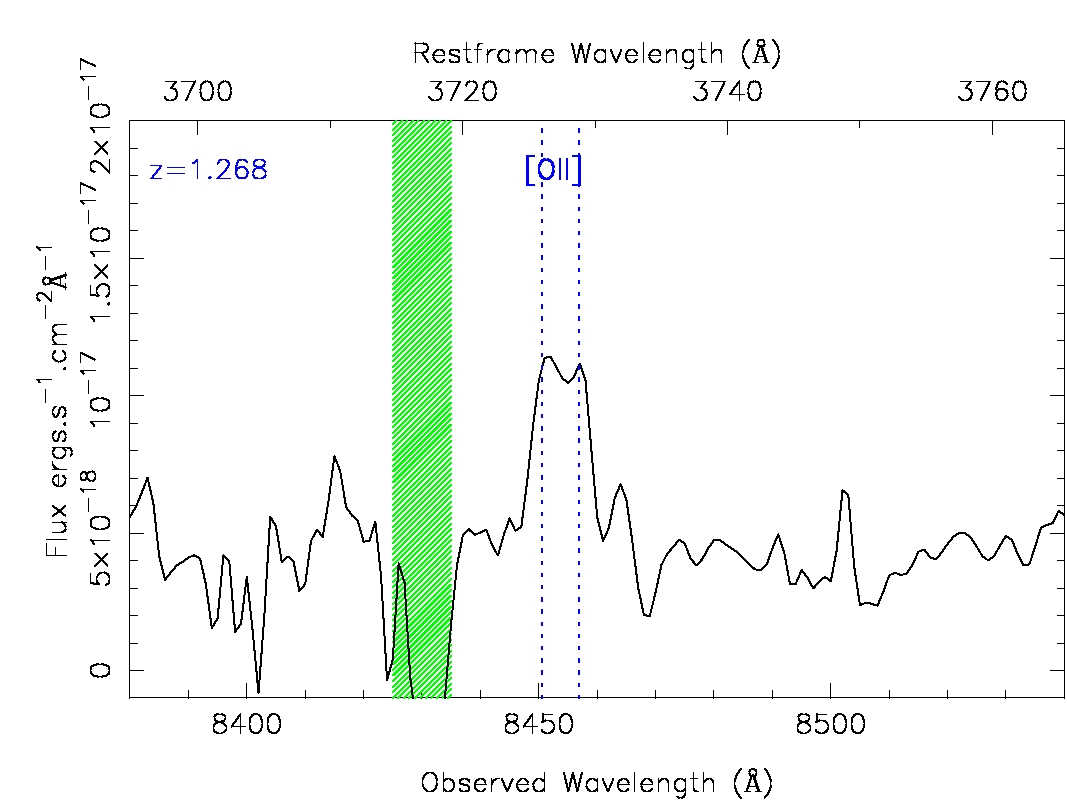
We have used the Low Resolution Imager and Spectrograph (LRIS, Oke et al., 1995) on the Keck telescope to measure the spectroscopic redshift of both the lens and the brightest arc of the SL2S J08544-0121 system. On January 14 2007, we obtained 300 seconds on the lensing galaxy and 4 exposures of 900 seconds each on the arc, using a 1.0″ wide slit. A 600 lines mm-1 grism blazed at 4000 Å and a 400 lines mm-1 grating blazed at 8500 Å were used in the blue and red channels of the instrument, both light paths being separated by a dichroic at 5600 Å. The corresponding dispersions are 0.6/1.85 Å and resolutions are 4.0/6.5 Å in the blue/red channel. The resulting extracted spectra are shown in Fig. 2. The lens presents a typical elliptical spectrum at with prominent H and K CaII lines, 4000 Å break, and G band. The spectrum of the arc shows a strong emission line at 8454 Å, resolved in a doublet separated by Å . This gives us an unambiguous redshift determination of with [OII] emission.
2.4 Global Properties
The luminosity contours of SL2S J08544-0121 are elongated in the east-west direction. The SL deflector is populated by a single bright galaxy. Note (Fig. 1) that the innermost luminosity isodensity contour at 107 L☉ kpc-2 encompasses the SL system but also two bright galaxies located 54 east from the SL system, making this light distribution bimodal. This is the only group of the sample presented by Limousin et al. (2009) for which the luminosity isodensity distribution is not clearly dominated by the lens, making this configuration rather exceptional: the large Einstein radius () indicates a significant mass concentration associated with this lens, but the luminosity isodensity distribution is actually bimodal.
3 Modelling the Lens
In this Section, we attempt to reproduce the SL multiple images using a single elliptical isothermal potential centred on the bright galaxy. All optimisations are performed in the image plane using the Lenstool software (Jullo et al., 2007). We quantify the goodness of the fit by using the image plane RMS and the corresponding . When necessary, we compare the fits using the Bayesian Evidence.
3.1 Observational Constraints
As explained in Section 2.2, we do not use the faint arc in the analysis and focus on the bright multiply-imaged system. This system is composed of 4 main images: 1.1, 1.2, 1.3 and 1.4. Additional images are produced by the satellite (dwarf) galaxy. These are not considered in the analysis because we do not want to complicate the modelling by adding a sub-halo for the satellite galaxy. We also make the assumption that, given its small size, the satellite galaxy does not influence images 1.1 to 1.4. This assumption will be discussed in Section 8 and addressed further in a forthcoming publication. Since the merging arc composed of images 1.2 and 1.3 is well resolved, we can safely associate two other images on this arc, namely 2.2 and 2.3 (Fig. 1). Their counter-images expected near images 1.1 and 1.4 are not safely identified, therefore we do not use them in the analysis. Indeed, parametric strong lensing analyses are highly sensitive to misidentifications of images and we prefer to use only the images we are confident in. This gives us a total of 8 observational constraints.
3.2 Shape of the Bright Galaxy
In this subsection, we describe the properties of the light distribution of the bright galaxy populating the strong lensing deflector. We use the IRAF task ellipse to measure the shape of its isophotes. We find an ellipticity of and a position angle of 395 degrees at 2 from the centre. A closer inspection of the galaxy centre clearly reveals a double core even though the outer isophotes are elliptical. The above measurements therefore correspond to the superposition of the light from each component. The spectrum of the galaxy presented in Fig. 2 does not show features of another galaxy at a different lens redshift along the line of sight. Given the similar colours of these two components, the bright galaxy may be the result of a recent merger.
3.3 Positional Uncertainty
The sizes of the multiple images have been estimated using the IRAF task imexamine. They range from 0.11 to 0.15, with a mean of 0.13. Therefore, the positional uncertainty is set to 0.13”. We note that this positional uncertainty may seem large for HST data but we stress that we are not in the case of point-like objects (quasar lensing) where the astrometric precision can reach 0.01. In our case, the images are extended and the depth of the snapshot observations does not allow us to resolve better the conjugated points with imexamine. We note that large positional uncertainties are often used in the case of extended images (see, e.g. Oguri, 2010).
3.4 Mass Model
The lens potential is parametrised by a dual Pseudo Isothermal Elliptical Mass Distribution (dPIE, see Elíasdóttir et al., 2007). The 3D density distribution of the dPIE is:
| (1) |
This distribution represents a spherical system with scale radius , core radius and central density .
This profile is formally the same as the Pseudo Isothermal Mass Distribution (PIEMD) described in Limousin et al. (2005). Its scale radius is set to 250 kpc, i.e. larger than the range where the observational constraints are found. Allowing to vary produces models with core radii much smaller than the range of radii over which we have observational constraints. Therefore, we can set = 0, and the dPIE profile are close to isothermal in the range of interest. The remaining free parameters of the dPIE profile are:
-
- the halo centre position (X,Y), which is allowed to vary within 3 of the light distribution centre
-
- the halo ellipticity , which is forced to be smaller than 0.6, as suggested by numerical simulations (Jing & Suto, 2002)
-
- its position angle , which is allowed to vary between 0 and 180 degrees
-
- The fiducial velocity dispersion111linked to the central density by: which is allowed to vary between 200 and 900 km/s.
We emphasise that this fiducial velocity dispersion is not the Spherical Isothermal Sphere velocity dispersion. It is usually smaller, and we refer the reader to Elíasdóttir et al. (2007) for a self-contained description of the dPIE profile.
3.5 Results: Bad Optimisation
Results of the optimisation are given in Table 1. This first optimisation results in a poor fit to the data, with the RMS error of image positions in the image plane (i.e. significantly larger than the assumed positional uncertainty of 0.13) and a reduced of 29. The halo position is found to coincide with the light distribution centre within error bars. The halo ellipticity is at the upper bound of the input prior, and the position angle is equal to 18 deg. Only when we allow the halo ellipticity to reach values as high as 0.9 are we able to reproduce the observational constraints (RMS equals to 0.06 for , 19.5 degrees, and the halo centre is offset from the light distribution centre by one arcsecond.
We conclude that a single potential does not satisfactorily reproduce the observational constraints. We have used the lens modelling method based on Halkola et al. (2006, 2008) in parallel to our method, and found that the observational constraints used in this work require an external shear component in order to be properly reproduced. In the rest of the paper, we include the contribution of the external mass distribution in the lens modelling.
| Model | (km s-1) | RMS | log(Evidence) | Prior | |||||
|---|---|---|---|---|---|---|---|---|---|
| 1 Lens | -0.240.12 | -0.020.10 | 0.597 | 17.91.6 | 4767 | 0.38 | 86/3 | -62 | 0.6 |
| Ext. Perturb. | 0.010.05 | -0.260.08 | 0.4990.04 | 21.50.9 | 4473 | 0.05 | 0.96 | -20 | 0.6 |
4 An External Mass Perturbation Based on the Light Distribution: Does Light traces Mass?
The large scale properties of SL2S J08544-0121 shown on Fig. 1, together with the failed modelling attempted in the previous Section, suggest the need to take into account an external mass perturbation. In order to test the hypothesis that light traces mass, this external perturbation will be mapped from the known light distribution properties.
4.1 Luminosity Maps
The first step is to build luminosity maps of SL2S J08544-0121 from which we will derive the external mass perturbation properties. To identify group members, we select all galaxies having a colour difference smaller than 0.15 magnitudes from the bright galaxy deflector (Limousin et al., 2009). Because we want to describe the perturbation of the galaxy group on the SL system, this luminosity map should not take into account the light coming from the galaxies populating the SL deflector. Therefore, we select all group members apart from the bright galaxy populating the deflector and the associated satellite galaxy. This partial group luminosity is referred to as Lext hereafter. From this catalogue, we generate smoothed luminosity maps, and hence the mass maps, assuming mass follows light. An important ingredient of this procedure is the smoothing scale of the luminosity maps. Since this influences the properties of the derived mass maps, we adopt the smoothing scale as a free parameter for describing the external mass perturbation.
We use the following smoothing scheme: the 10’ 10’ CFHTLS -band image is divided into cells of size pixels, which translates into 0.186 (since the pixel size equals 0.186). We compute the rest-frame -band luminosity of each galaxy located in a given cell with
| (2) |
where is the -band isophotal magnitude of the galaxy, is the solar absolute magnitude in the band, DM is the distance modulus, and the k-correction factor that is estimated from elliptical templates by Bruzual & Charlot (2003) using single-burst stellar formation models. Then we sum up the luminosities of all galaxies in each cell to get the total luminosity for the cell. The resulting luminosity isodensity map is then convolved with a Gaussian kernel of width . This gives an angular smoothing scale that equals 0.186 . Figure 3 shows three luminosity maps, where we distribute the same total luminosity Lext for three smoothing scales. We draw luminosity isodensity contours of 107 and 108 L☉ arcsec-2. One can appreciate how the smoothing scale influences the shape of the luminosity isodensity contours.

4.2 From Light Map to Mass Map
Once a luminosity map with a given smoothing scale is obtained, we assume a constant mass-to-light ratio Mext/Lext to convert it into a mass map. This Mext/Lext is the second free parameter describing the perturbation produced by the galaxy group. Since we have excluded the bright galaxy populating the deflector when building the luminosity map, this mass map can be considered as the external mass perturbation. Therefore we refer to the mass contained in this map as Mext. Then, we use the algorithm developed by Jullo & Kneib (2009) to transform this mass map into a grid of analytic circular dPIE potentials, supported by Lenstool.
We model the mass distribution of SL2S J08544-0121 with a 5′ hexagonal grid of dPIE potentials. In order to build an adaptive grid where the resolution follows the 2-D mass density, we recursively split the input mass map into equilateral triangles until the mean surface mass density per triangle is lower than 107 M☉ arcsec-2. Then we place a dPIE potential at each node of the grid with the following parameters: core radii are set to the local grid resolution and cut-off radii . In Jullo & Kneib (2009), we found that such values of ensured a smooth and extended density profile. We estimate the dPIE central velocity dispersions by inverting the equation
| (3) |
where is the surface mass density at the grid nodes location, and is a mapping matrix whose coefficients depend of the dPIE core and cut-off radii (see Jullo & Kneib, 2009). In order to prevent negative , we invert equation 3 by a mean-square minimisation technique. The density threshold (for splitting the cells into triangles) controls the grid resolution, and might thus be considered as an important parameter. However, we have tried to use smaller thresholds, down to 105 M☉ arcsec-2, and the results were unchanged. Therefore, we keep the 107 M☉ arcsec-2 threshold because the corresponding mass maps require less mass clumps. We also force the algorithm to stop after 4 levels of splitting. On average, a grid cell contains about 200 dPIE potentials.
4.3 Modelling the Lens including the External Perturbation
We now model the SL system, taking into account the external mass perturbation parametrised by a smoothing scale and a mass-to-light ratio Mext/Lext. We generated mass maps with smoothing scales ranging from 1 to 40 in steps of 2.5 and mass-to-light ratios from 10 to 190 in steps of 20. Each mass map is then included in the modelling of the SL system. This modelling is performed in the image plane. We note that these two extra parameters describing the external mass perturbation are not treated the same way as the five parameters of the deflecting halo. For each set of parameters (, Mext/Lext), we optimise the 5 parameters of the halo. Parameters for the strong lens deflector are the same as in Section 3.4. For each set of parameters (, Mext/Lext), we quantify the goodness of the SL modelling using the image plane RMS, the corresponding and the Bayesian Evidence.
Since our goal is to constrain the galaxy group as a whole, in the following we use M/L corresponding to the total mass-to-light ratio of the group; i.e. M (L) is the sum of the external mass (luminosity) perturbation and the mass (luminosity) of the lens. We checked that degeneracies of each mass component near the lens are small. For the range of parameters (, Mext/Lext) investigated in this work, we compute Mext/Mlens in a circle of radius 10 centred on the lens. This ratio falls between 10-7 and 10-5.
Total masses and luminosities are computed within a region of 10’ 10’ centred on the lens. At the redshift of the group, it corresponds to 3 3 Mpc2 (Fig. 1).
5 Results: Properties of SL2S J08544-0121
For a certain range of parameters characterising the external mass perturbation we obtain excellent fits to the observed constraints. We present first the best-fit model, and then the derived constraints on the galaxy group properties. We emphasise that what we achieve here is to constrain the properties of the galaxy group as a whole (on scales of 100) based on a local SL analysis only (on scales of 10).
5.1 Best-Fit Model for the Lens
The modelling results are given in Table 1. The best-fit model has a total mass-to-light ratio of ( band, solar units, not corrected for evolution) and a smoothing scale of (Fig. 4). The RMS error between observed and modelled image positions in the image plane is 0.05, yielding a reduced of 0.96. This is a significant improvement compared to the modelling without external mass perturbation, which had RMS = 0.38. To compare quantitatively the two models (i.e. mass models with and without the inclusion of external perturbations), we compute the Bayesian evidence values of the two models. The evidence takes into account the additional complexity of the new model with the extra parameters for the external perturbations. The difference in the evidence of the two models, which is the relative probability of the models given the data (assuming the two models are equally probable a priori), is . The data therefore rank the perturbed model much higher than the simple model.
We find the position of the halo to coincide with the centre of the light distribution. The modelled position angle of the halo is 21.5 deg. Comparing this value to the position angle of the light distribution is complicated due to the bimodal light distribution of the bright galaxy (Section 3.2). In particular, a merger will affect the light and mass distributions so that agreement may not necessarily be expected.
5.2 Constraints on the Group as a Whole
differences between models with different and M/L values are translated into confidence levels, which are drawn on Fig. 4. Considering the 2 contour, we find M/L = 9827 ( band, solar units, not corrected for evolution) and = 209.
5.3 Is Mass Traced by Light ?
We are able to reproduce accurately the observational constraints when considering an external mass perturbation drawn from the light distribution. Because our SL analysis is sensitive to the mass, this finding is consistent with the hypothesis that light is a good tracer of mass. We note, however, that we have not demonstrated the uniqueness of the smoothed light model.

6 Local Effect of Large Scale Perturbation
In this Section, we propose to explain why a local SL analysis is able to constrain global properties of the galaxy group hosting the lens. First, we investigate the impact of the external perturbation on the local SL modelling (i.e. on the local image positions).
6.1 Lensing Properties of the External Perturbation
The lensing properties of a mass distribution are commonly parametrised by a shear and a convergence (see, e.g. Schneider et al., 1992, for the definition of these quantities). Here we estimate the mean shear and convergence experienced locally by the lens for each set of parameters (, Mext/Lext) by averaging and generated by the perturbation within a 7 square encompassing all the multiple images.
Figure 5 shows and maps generated by an external perturbation of fixed mass (5.71014 M☉) for different values of (reported on each panel). These maps have been generated for a source redshift of 1.268. Red crosses indicate the lens position. One can appreciate how the experienced shear and convergence are correlated with the smoothing scale.
6.2 Shape of the Constraints

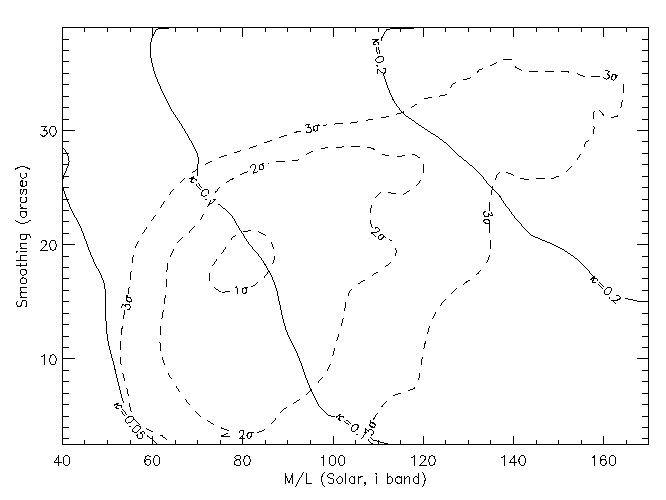
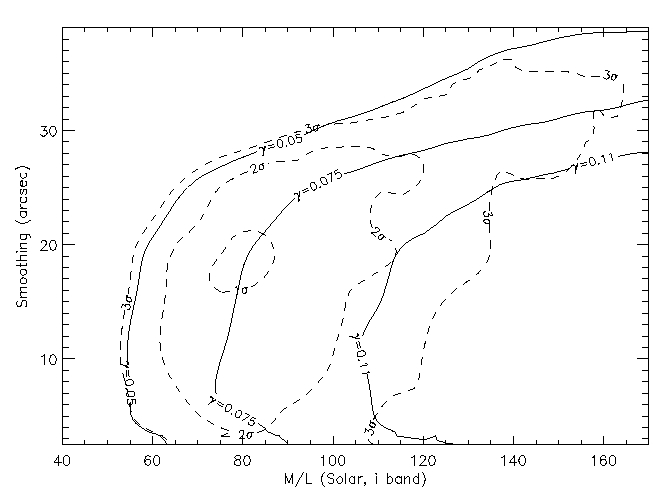
Figure 6 shows contours of and overlaid on the results from Fig 4. We see that the constraints inferred from the SL analysis do not follow contours but do follow contours. In particular, the best model generates a shear of 0.075. We interpret the shape of the constraints as follows: one needs to generate a shear value of 0.075 with a mass distribution parametrised by a smoothing scale and a total mass. For a given total mass, the smoother this mass distribution (the higher ), the smaller the generated shear. Therefore, the smoother the mass distribution, the higher the total mass in order to generate a given shear level.
6.3 Why Closed Contours ?
Shear, Convergence, and Beyond
Figure 6 suggests that the observational constraints require locally an external shear component of 0.075. However, our analysis rejects some external mass perturbations characterised by such a shear (Fig. 4). This suggests, as found by Keeton & Zabludoff (2004), that the shear approximation fails to capture all of the environmental effects. In other words, the shape of the contours for the constraints follows the curves of constant shear. However, the contours do close, which means that the constraints are sensitive to more than the shear, most probably to higher order terms beyond the shear that are naturally provided by the modelling proposed in this work.
In addition, we estimate the shear experienced by images 1.1, 1.2, 1.3 and 1.4. To do so, we consider all models falling in the 1 contour. For each model, we compute the shear experienced by the images, and from these numbers, we estimate the mean shear and the associated standard deviation. The corresponding shear values for the images listed above are 0.075, 0.074, 0.073 and 0.073 respectively, with a typical uncertainty of 0.01. Therefore, each image does experience the same shear value within the error bars. We investigate further the differences between our approach and a constant external shear approach in the Appendix.
7 Mass-to-Light Ratio from Weak Lensing
We have presented constraints on the mass-to-light ratio of galaxy group SL2S J08544-0121 based on a local SL analysis. In this Section, we aim to constrain the mass-to-light ratio of SL2S J08544-0121 from an independent weak lensing (WL) analysis, which is intrinsically more sensitive to the projected mass distribution on large scales. The goal is to check whether the M/L ratios inferred from the two techniques are consistent.
For a detailed description of our WL methodology see Limousin et al. (2009). Here we give a brief reminder. We select as background sources all galaxies with -band magnitudes in the range 21.5-24. The resulting galaxy number density is 13.5 arcmin-2. The completeness magnitude in this band is 23.91 and the seeing is 0.51. A Bayesian method, implemented in the Im2shape software (Bridle et al., 2002), is used to fit the shape parameters of the faint background galaxies and to correct for the PSF smearing. From the catalogue of background galaxies, Limousin et al. (2009) performed a one-dimensional WL analysis. They fit a Singular Isothermal Sphere (SIS) model to the reduced shear signal between 150 kpc and 1.2 Mpc from the group centre, finding an Einstein radius of 5.42.1. In order to relate the strength of the WL signal to a physical velocity dispersion characterising the group potential, Limousin et al. (2009) estimate the mean geometrical factor using the photometric redshift catalogue from the T0004 release of the CFHTLS-Deep survey 222http://www.ast.obs-mip.fr/users/roser/CFHTLS_T0004/ (Ienna & Pelló, 2006). They find km s-1. This translates into a total mass within the considered square of 5.32.0 1014 M☉. Because the total luminosity is 5 1012 L☉, we find a mass-to-light ratio of 10640 ( band, solar units, not corrected for passive evolution).
This is comparable to the M/L constrained by SL only. The good agreement (Fig. 4) between the two methods gives support to the analysis based on SL only.
8 Discussion
8.1 Mass is Traced by Light
An external mass perturbation derived from the light of the group members allows us to fit accurately the observed constraints. Because the observed constraints are sensitive to mass rather than light, this suggests that light is a good tracer of mass. We note that this result brings forth an efficient way of taking into account an external mass perturbation in SL modelling. Indeed, this perturbation is fully described with only two parameters, the mass-to-light ratio and the smoothing scale. In contrast, describing this perturbation parametrically using a mass clump would require at least three parameters (position and velocity dispersion), unless independent data constrain one or more of these parameters (see, e.g. Tu et al., 2009, where X-ray observations allow one to constrain the group centre).
8.2 What is the source of the Constraints ?
Why does our SL analysis allow us to infer properties on the whole galaxy group? We claim that this is due to the perturbed state of the SL system of SL2S J08544-0121. Most of the perturbed signal of the multiply imaged system comes from image 1.4, because it is located farther from the lens centre () than images 1.1, 1.2 and 1.3 (). If we remove image 1.4 from the set of observational constraints, we are able to fit very well the remaining images without considering any external mass perturbation (the lens being modelled as in Section 3.4.) In that case, we get RMS = 0.03 and a reduced equals to 0.03. Therefore, ignoring image 1.4 prevents us from putting any constraints on the external mass perturbation, i.e. the host galaxy group. This shows that image 1.4 yields the constraints presented in this work. This finding will help us diagnose the type of the SL systems to which our new analysis technique can be applied (see Section 8.5).
We note that the SL analysis presented here is very simple since we just conjugate a couple of images with each other. In particular, we do not use the constraints coming from the whole Einstein ring. More sophisticated methods fully take into account arc surface brightness constraints (see, e.g. Warren & Dye, 2003; Suyu et al., 2006; Barnabè & Koopmans, 2007). We are aware that we ignore some information that could allow us to put stronger constraints on the galaxy group. On the other hand, the basic level of the SL analysis done here emphasises even more the prospects of this method.
8.3 The Satellite Galaxy
We have assumed that the satellite galaxy does not produce significant shear on the images used as constraints. However, one could argue that neglecting this satellite galaxy effectively produces the claimed constraints from the SL analysis. This is not likely – due to the location of the satellite galaxy with respect to the multiple images (Fig. 1), the satellite galaxy may produce a marginal shear on on images 1.1, 1.2 and 1.3, but is unlikely to have any significant influence on image 1.4, the image that yields most of the constraints. Indeed, the distance between the satellite galaxy and image 1.4 is 13. We note that we do not quantify the bias that could result under our working assumption.
Besides, a paper focusing on the properties of the satellite galaxy (Suyu & Halkola, submitted to A&A) shows that even with the satellite galaxy included in the lens model, an external shear of roughly the same magnitude is needed to fit the observed constraints.
8.4 Choice of the Lens’ Scale Radius
The dPIE scale radius is where the logarithmic slope of the 3D density profile smoothly decreases from -2 to -4. The scale radius of the lens is set to 250 kpc in the present analysis. We have also done a complete analysis for a scale radius of 400 kpc as a sanity check and found that the results inferred for the group do not change significantly. To understand why, we superimposed critical lines of the best-fit parameters of Table 1, for a source redshift of 1.268 (without external perturbation), and the critical lines of the best-fit parameters of Section 5.1 (with external mass perturbation). We find that the external mass perturbation generates a critical line shift of 1.3. In parallel, we investigated the critical lines shifts between various scale radii; increasing from 250 kpc to 400 kpc and decreasing from 250 kpc to 100 kpc. The shifts are 0.12, an order of magnitude smaller than the shift due to the external mass perturbation.
8.5 Looking for Perturbed SL Systems
We propose to characterise the kind of perturbed SL systems one should target in order to perform analyses similar to the one presented in this work. From the ring test done in Abell 1689 (Tu et al., 2008, see Section 1.3) and the analysis presented in this paper, we hint at the need for a non-dominant SL system to be used as a test particle for probing the main potential.
This is linked to the global geometry of the structure hosting the SL system: to be affected by a perturbation, the SL system should not be at the centre of the structure. Indeed, if the lens studied in this paper would have dominated the whole group potential, image 1.4 would have been located at a similar distance from the lens centre as images 1.1, 1.2 and 1.3.
The Cosmic Horseshoe (Belokurov et al., 2007; Dye et al., 2008) illustrates this point: it is an almost complete Einstein ring of radius 5 containing a luminous red galaxy in its centre. As revealed by the SDSS photometry, this galaxy is the brightest object in the group of 26 members and it dominates the group light distribution. No external shear is required in the model of the Cosmic Horseshoe SL system, which is already suggested by the nearly perfect circle outlined by the ring.
To summarise, we should look for multiply imaged systems where one of the images is found at a larger radial distance than the other images of the SL system.
8.6 SL2S J08544-0121: Further Evidences for a Bimodal Mass Distribution from Spectroscopy of Group Members
We have shown that the modelling based on strong lensing only provides strong hints for a bimodal mass distribution: the first mass component is clearly associated with the strong lensing deflector, and the second one that perturbs the strong lensing configuration seems, to first order, to be associated with the second light peak of the bimodal light map. This suggests a dynamically young structure in the process of formation. A spectroscopic survey of the group further supports this hypothesis: we measured redshifts for 36 galaxies along the direction of SL2S J08544-0121 by using spectroscopic data acquired with FORS2 at the ESO Very Large Telescope (VLT), and confirmed the presence of a high concentration of galaxies at (Muñoz et al., in preparation). A careful analysis of the redshift distribution of galaxies around this peak reveals two close structures with a radial velocity difference of . This result is in agreement with the interpretation of our strong lensing only analysis.
9 Conclusion
We propose a method to constrain the dark matter distribution of galaxy groups and clusters. Exploiting information contained in perturbed SL systems, we use the SL geometry to probe the main potential of the host structure responsible for that perturbed state.
We show that the SL only constraints on the mass-to-light ratio of SL2S J08544-0121 are in good agreement with WL constraints obtained independently, supporting the reliability of the proposed method. Moreover, the SL only analysis provides strong hints for a bimodal mass distribution, which is confirmed by the spectroscopic survey of galaxy group members.
We advocate the need for a dedicated search of perturbed SL systems in the HST archive in order to test and validate further this method, which is particularly promising in the light of future large surveys that will yield thousands of SL systems, some of them being perturbed enough to perform the test presented in this paper.
Acknowledgement
ML acknowledges Bernard Fort, Masamune Oguri & Phil Marshall for related discussions. ML acknowledges the anonymous referee for a detailed report, and Christopher Kochanek for insightful comments on the submitted version of this paper. ML acknowledges the Centre National d’Etudes Spatiales (CNES) and the Centre National de la Recherche Scientifique (CNRS) for their support. ML est bénéficiaire d’une bourse d’accueil de la Ville de Marseille. The Dark Cosmology Centre is funded by the Danish National Research Foundation. We thank the Danish Centre for Scientific Computing at the University of Copenhagen for providing a generous amount of time on its supercomputing facility. EJ is supported by the NPP, administered by Oak Ridge Associated Universities through a contract with NASA. Part of this work was carried out at Jet Propulsion Laboratories, California Institute of Technology under a contract with NASA. JR acknowledges support from an EU Marie-Curie fellowship. SHS is supported in part through the Deutsche Forschungsgemeinschaft (DFG) under project SCHN 342/7-1, and AH by the DFG cluster of excellence ’Origin and Structure of the Universe’. JPK acknowledges CNRS for its support.
References
- Auger et al. (2007) Auger, M. W., Fassnacht, C. D., Abrahamse, A. L., Lubin, L. M., & Squires, G. K. 2007, AJ, 134, 668
- Auger et al. (2008) Auger, M. W., Fassnacht, C. D., Wong, K. C., et al. 2008, ApJ, 673, 778
- Barnabè & Koopmans (2007) Barnabè, M. & Koopmans, L. V. E. 2007, ApJ, 666, 726
- Belokurov et al. (2009) Belokurov, V., Evans, N. W., Hewett, P. C., et al. 2009, MNRAS, 392, 104
- Belokurov et al. (2007) Belokurov, V., Evans, N. W., Moiseev, A., et al. 2007, ApJ, 671, L9
- Bridle et al. (2002) Bridle, S., Kneib, J.-P., Bardeau, S., & Gull, S. 2002, in The shapes of galaxies and their dark halos, Proceedings of the Yale Cosmology Workshop , New Haven, Connecticut, USA, 28-30 May 2001. Edited by Priyamvada Natarajan., ed. P. Natarajan, 38–+
- Bruzual & Charlot (2003) Bruzual, G. & Charlot, S. 2003, MNRAS, 344, 1000
- Cabanac et al. (2007) Cabanac, R. A., Alard, C., Dantel-Fort, M., et al. 2007, A&A, 461, 813
- Dye et al. (2008) Dye, S., Evans, N. W., Belokurov, V., Warren, S. J., & Hewett, P. 2008, MNRAS, 388, 384
- Dye et al. (2007) Dye, S., Smail, I., Swinbank, A. M., Ebeling, H., & Edge, A. C. 2007, MNRAS, 379, 308
- Elíasdóttir et al. (2007) Elíasdóttir, Á., Limousin, M., Richard, J., et al. 2007, ArXiv e-prints, 710
- Fassnacht & Lubin (2002) Fassnacht, C. D. & Lubin, L. M. 2002, AJ, 123, 627
- Faure et al. (2004) Faure, C., Alloin, D., Kneib, J. P., & Courbin, F. 2004, A&A, 428, 741
- Grillo et al. (2008) Grillo, C., Lombardi, M., Rosati, P., et al. 2008, A&A, 486, 45
- Halkola et al. (2008) Halkola, A., Hildebrandt, H., Schrabback, T., et al. 2008, A&A, 481, 65
- Halkola et al. (2006) Halkola, A., Seitz, S., & Pannella, M. 2006, MNRAS, 372, 1425
- Ienna & Pelló (2006) Ienna, F. & Pelló, R. 2006, in SF2A-2006: Semaine de l’Astrophysique Francaise, ed. D. Barret, F. Casoli, G. Lagache, A. Lecavelier, & L. Pagani, 347–+
- Inada et al. (2009) Inada, N., Oguri, M., Shin, M., et al. 2009, AJ, 137, 4118
- Jing & Suto (2002) Jing, Y. P. & Suto, Y. 2002, ApJ, 574, 538
- Jullo & Kneib (2009) Jullo, E. & Kneib, J. 2009, MNRAS, 395, 1319
- Jullo et al. (2007) Jullo, E., Kneib, J.-P., Limousin, M., et al. 2007, New Journal of Physics, 9, 447
- Keeton et al. (1997) Keeton, C. R., Kochanek, C. S., & Seljak, U. 1997, ApJ, 482, 604
- Keeton & Zabludoff (2004) Keeton, C. R. & Zabludoff, A. I. 2004, ApJ, 612, 660
- Kochanek & Blandford (1991) Kochanek, C. S. & Blandford, R. D. 1991, ApJ, 375, 492
- Kochanek et al. (2001) Kochanek, C. S., Keeton, C. R., & McLeod, B. A. 2001, ApJ, 547, 50
- Koopmans et al. (2006) Koopmans, L. V. E., Treu, T., Bolton, A. S., Burles, S., & Moustakas, L. A. 2006, ApJ, 649, 599
- Kundic et al. (1997) Kundic, T., Hogg, D. W., Blandford, R. D., et al. 1997, AJ, 114, 2276
- Leonard et al. (2007) Leonard, A., Goldberg, D. M., Haaga, J. L., & Massey, R. 2007, ApJ, 666, 51
- Limousin et al. (2009) Limousin, M., Cabanac, R., Gavazzi, R., et al. 2009, A&A, 502, 445
- Limousin et al. (2005) Limousin, M., Kneib, J.-P., & Natarajan, P. 2005, MNRAS, 356, 309
- Limousin et al. (2007) Limousin, M., Richard, J., Jullo, E., et al. 2007, ApJ, 668, 643
- Lynds & Petrosian (1986) Lynds, R. & Petrosian, V. 1986, in Bulletin of the American Astronomical Society, 1014–+
- Miralda-Escude & Babul (1995) Miralda-Escude, J. & Babul, A. 1995, ApJ, 449, 18
- Momcheva et al. (2006) Momcheva, I., Williams, K., Keeton, C., & Zabludoff, A. 2006, ApJ, 641, 169
- Morgan et al. (2005) Morgan, N. D., Kochanek, C. S., Pevunova, O., & Schechter, P. L. 2005, AJ, 129, 2531
- Oguri (2010) Oguri, M. 2010, ArXiv e-prints
- Oguri et al. (2008) Oguri, M., Inada, N., Blackburne, J. A., et al. 2008, MNRAS, 391, 1973
- Oguri et al. (2005) Oguri, M., Keeton, C. R., & Dalal, N. 2005, MNRAS, 364, 1451
- Oke et al. (1995) Oke, J. B., Cohen, J. G., Carr, M., et al. 1995, PASP, 107, 375
- Okura et al. (2008) Okura, Y., Umetsu, K., & Futamase, T. 2008, ApJ, 680, 1
- Richard et al. (2010) Richard, J., Kneib, J., Limousin, M., Edge, A., & Jullo, E. 2010, MNRAS, 402, L44
- Saha et al. (2007) Saha, P., Williams, L. L. R., & Ferreras, I. 2007, ApJ, 663, 29
- Schneider et al. (1992) Schneider, P., Ehlers, J., & Falco, E. E. 1992, Gravitational Lenses (Berlin: Springer-Verlag)
- Soucail et al. (1987) Soucail, G., Fort, B., Mellier, Y., & Picat, J. P. 1987, A&A, 172, L14
- Suyu et al. (2006) Suyu, S. H., Marshall, P. J., Hobson, M. P., & Blandford, R. D. 2006, MNRAS, 371, 983
- Treu et al. (2009) Treu, T., Gavazzi, R., Gorecki, A., et al. 2009, ApJ, 690, 670
- Tu et al. (2009) Tu, H., Gavazzi, R., Limousin, M., et al. 2009, A&A, 501, 475
- Tu et al. (2008) Tu, H., Limousin, M., Fort, B., et al. 2008, MNRAS, 1169
- Warren & Dye (2003) Warren, S. J. & Dye, S. 2003, ApJ, 590, 673
- Williams et al. (2006) Williams, K. A., Momcheva, I., Keeton, C. R., Zabludoff, A. I., & Lehár, J. 2006, ApJ, 646, 85
Appendix A Taking an External Mass Perturbation Into Account: Comparison with Other Approaches
We have proposed in this article a way of taking into account an external mass perturbation in a strong lensing (SL) modelling. Here we try other possible and more conventional approaches: i) a constant external shear profile and ii) a Singular Isothermal Sphere centred on the second high luminosity peak, which, by construction, is the main mass concentration perturbing the SL in the method proposed in this work.
A.1 A Constant External Shear
Although unphysical (any mass distribution will not generate shear only but also convergence), the external shear model is widely used and is often a good approximation. Here we address the modelling of the SL system with a constant external shear component parametrised by a position angle and a strength (). This modelling is performed in the image plane. Parameters of the potential describing the lens are set as in Section 3.4. The external shear strength is allowed to vary between 0 and 0.3. The upper limit corresponds to a very strong shear value: for comparison, the massive galaxy cluster Abell 1689 produces an average shear value of 0.23 at 50 away from its centre.
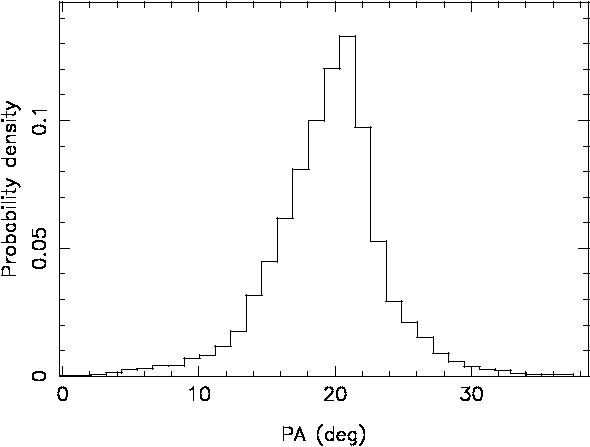
We are able to get a very good fit, with . The best model corresponds to a circular halo for the lens () centred on the bright galaxy (X = -0.36, Y = 0.07), making its position angle (95 degrees) irrelevant. The lens fiducial velocity dispersion equals to 4508 km s-1 (1). The external shear is described by = 0.19, more than twice the one derived in Section 6.2 ( 0.075), and a position angle equal to 19.8 degrees.
The Lenstool software does explore the parameter space using a MCMC sampler (Jullo et al. 2007). Therefore, we can use these MCMC realisations in order to investigate the degeneracies between the different parameters. The following figures have been generated this way.
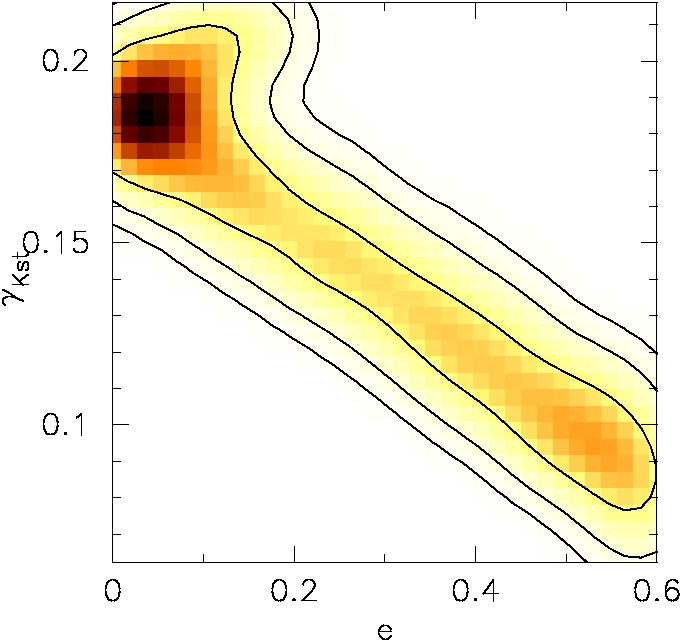
Figure 7 shows that there is a strong degeneracy between and . We see that the solution derived in Section 5.1 (i.e. an external shear of 0.075 and an ellipticity of 0.5) is included in the 1- contour. On the other hand, the position angle of the external shear is very well constrained to be 20 degrees. This position angle points towards the second high luminosity light clump. This suggests that, to first order, the external mass perturbation is dominated by this component. We note that the best-fit model needs an external shear of order 0.18, which is a pretty unlikely value in our case because it is comparable to what would be experienced at 100 from the centre of Abell 1689.
A.2 An SIS profile
The first order mass perturbation is associated to a second peak of high luminosity. We put an SIS mass distribution at the location of this second luminosity peak (X,Y = -53,10 wrt the lens). We allow its velocity dispersion to vary up to 800 km s-1, an upper limit motivated by the WL analysis of the full group (Section 7), and do the SL modelling with parameters set as in Section 3.4. We are able to get a very good fit, with . The lens halo is centred on the bright galaxy. Its ellipticity equals 0.43 and its position angle 272 deg. The lens fiducial velocity dispersion equals to 4417 km s-1 (1). The external shear and convergence generated by the SIS profile at the location of the multiple images are equal by definition, between 0.07 and 0.10.
We show on Fig. 8 the degeneracies between the lens halo ellipticity and the SIS profile velocity dispersion, related to the strength of the external shear experienced by the multiple images. We see that the solution derived in Section 5.1 (i.e. an external shear of 0.075, corresponding to 700 km s-1 and an ellipticity of 0.5) is included in the 1- contour.

A.3 Discussion
In each cases investigated in this Appendix, we find that the solution we have derived in Section 5.1 using our original method is consistent with solutions derived with more conventional methods.
We note that conventional methods exhibit strong degeneracies between the lens halo ellipticity and the strength of the external shear. These degeneracies are smaller in the case of the SIS profile (lens ellipticity is constrained between 0.3 and 0.6) compared to the case of a constant shear profile (ellipticity unconstrained between the allowed priors: 0 and 0.6). The main difference between the SIS profile and the constant shear profile is that the SIS profile generates both shear and convergence.
With respect to the lens itself, we note that all fitted fiducial velocity dispersions are consistent, whatever the method used to take into account the external mass perturbation. They fall between 433 km s-1 and 458 km s-1. This translates into a projected mass computed in a radius of 10 between 0.93 and 1.041013 M☉. This is expected because the mass of the lens within this radius is set by the location of the SL constraints and therefore does not depend much on the external mass perturbation (see also Section 4.3).