Hierarchical Self-Assembly of Asymmetric Amphiphatic Colloidal Particles
Abstract
From dumbbells to FCC crystals, we study the self-assembly pathway of amphiphatic, spherical colloidal particles as a function of the size of the hydrophobic region using molecular dynamics simulations. Specifically, we analyze how local inter-particle interactions correlate to the final self-assembled aggregate and how they affect the dynamical pathway of structure formation. We present a detailed diagram separating the many phases that we find for different sizes of the hydrophobic area, and uncover a narrow region where particles self-assemble into hollow, faceted cages that could potentially find interesting engineering applications.
I Introduction
Spontaneous assembly of components into large ordered aggregates is a ubiquitous phenomenon in nature, and is observed across all length scales. Aggregation of proteins into functional nanomachines Alberts , formation of viral capsids Watson ; Klug , packing of phospholipids into biological membranes Sackmann and assembly of colloidal particles into macroscopic crystals Subramanian are just a few manifestations of this fundamental process. Because of advances in particle synthesis DeVries ; Schnablegger ; Hong ; Weller ; Hobbie , it is now possible to produce colloidal particles that are anisotropic both in shape and surface chemistry, thus providing an unlimited variety of building blocks that can spontaneously assemble into an unprecedented number of structures holding promise for the development of materials with novel functional, mechanical, and optical properties.
Although the generic features of particle aggregation can be described, at least phenomenologically, in terms of simple thermodynamic arguments Israelachvili ; Zhang ; Leckband ; Nagarajan , the details of the process are far from being understood. In fact, for self-assembly to take place, a very delicate balance between entropic and energetic contributions, coupled to a precise geometric character of the components, must be satisfied. In general, self-assembly is not to be expected unless a careful design of the building blocks has been performed beforehand, and this has inspired a large body of work dedicated to gain insight into how the geometry of the interparticle interactions and the shape of the particles themselves determine the dynamical pathway and structure they aggregate into. The ultimate goal is to be able to gather a sufficient understanding of the forward self-assembly process to then be able to develop tools that will allow us to tailor interparticle interactions to target desired structures. With this in mind, there is a clear necessity to explore a new dimension in the classical temperature/concentration phase diagrams: the geometry of the interactions (see reference glotzer2 for a recent perspective on the subject and a review of the relevant literature.)
Recently, the self-assembly pathway of Janus particles (spherical particles with one hemisphere hydrophobic and the other hydrophilic) has been described in some detail Hong2 both experimentally and numerically. Janus particles are important because they represent what is probably the simplest model where one can explicitly study and ask fundamental questions about the role of surface anisotropy in colloidal aggregation. What was found is a rich behavior in terms of both the dynamics of self-assembly, and the final structure of the aggregates. Specifically, by tuning the repulsion between the hydrophilic hemispheres, one can drive the system into two distinct phases. In one phase particles form a gas of small clusters composed of 4 to 13 particles, in the other phase, at large salt concentration, particles organize into long, branched, worm-like structures formed by cooperative fusion of the small clusters. Such particles are a particular type of a wider class of patchy particles, the self-assembly of a wide variety of which has been studied previously glotzer ; sciortino .
Inspired by these experimental results, in this paper we go one step forward and explore dynamics and structure formation of anisotropic amphiphatic particles. While the dividing surface between hydrophobic and hydrophilic regions in Janus particles is set at the equator, we shall consider particles in which this boundary is located at an arbitrary latitude on the particle’s surface, and we systematically study how, at a fixed concentration, these particles self-assemble depending on the size of the hydrophobic region. We thus explore a key “anisotropy dimension” proposed in glotzer2 as related to the self-assembly of these particles.
This system is quite interesting because one can easily predict the formation of a wealth of different structures as a function of the location of the dividing surface. For instance, we know that when the hydrophobic region covers a small area, particles can only assemble into dumbbells. We know that when the dividing surface is placed to slightly larger values, so that more particles can share the same hydrophobic surface, particles condense into small stable clusters. We also know the structures resulting from self-assembly of Janus particles, and of course, in the limit of full coverage, we recover an isotropic potential which is known to lead to the formation of an FCC crystal. Using this simple system we can study systematically the formation of aggregates whose structure ranges from zero dimensions (dumbbells and meso-particles) to three dimensions (FCC crystals), and we can analyze how the specificity of the local inter-particle interactions correlates to the final self-assembled structure and its dynamics.
II Methods
We model the amphiphatic character of the particles via an interaction potential that depends on both the separation between particle surfaces and the angle between particle axes, so that a precise shape and extent of the interaction may be defined. Our choice of the interaction potential is inspired by the model introduced in reference Hong2 that has been used to analyze actual experimental data of Janus Particles.
The potential presented in Hong2 was specifically tailored to describe the physical properties of Janus particles at different salt concentrations, . At low and intermediate salt concentrations, the repulsion between the charged hemispheres constrains particles to interact head-on, with angular deviations that depend in a nontrivial way on . However, the more interesting structure formation (worm-like clusters) appears at large salt concentrations, where the role of electrostatic interactions becomes negligible. In this limit, particles can freely rotate, once in contact, within the boundaries of the hydrophobic regions. These regions can therefore be appropriately described by a short-ranged, isotropic attractive potential that acts within the boundaries of that region. Similarly, the hydrophilic region is well-characterized by a simple short-ranged repulsive interaction. The potential used in our paper reflects this phenomenological behavior and has the following form:
where is the distance between particles, is the angle between the axis of particle 1 and the axis between particle centers, and is the analogous angle for particle 2. is a symmetric repulsive interaction that accounts for the particle excluded volume, and has the form of a shifted-truncated Lennard-Jones potential:
accounts for the attraction between the hydrophobic surfaces on the particles. If is the distance between the particle surfaces,
| (1) |
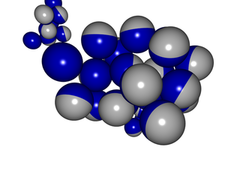
and it extends up to . Finally, is a smooth step function that modulates the angular dependence of the potential, and is equal to 1 within the region and decays to zero following the expression at the tail of the angular range, i.e when (with ). This particular value of has been selected to generate a sufficiently smooth potential at the Janus interface. See Fig. 1 for an illustration of .

The parameters set in our model are compatible with colloidal particles of size in aqueous solution kept at a salt concentration sufficiently large to screen the electrostatic repulsion between the hydrophilic regions of any two particles Hong2 .
The system is evolved using Molecular Dynamics simulations with a Langevin thermostat at constant room temperature, , in a cubic box with periodic boundary conditions. Our system contains particles kept at a constant volume fraction . We have chosen this concentration because it is comparable with those used in experimental studies on Janus Particles Hong2 , so that our work could have a grounding experimental reference that our results could be compared to for . Each simulation runs for a minimum of steps with a time step . All quantities in this paper are expressed in standard dimensionless units.
III Results and discussion
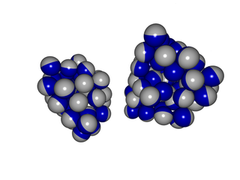
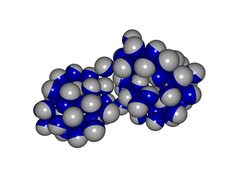
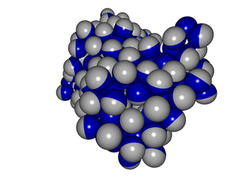
Our goal is to understand how particles condense into stable three-dimensional aggregates via the process of self-assembly, and how the specificity of the geometry of the interaction is reflected in the final structure. Figure 2 reports one of the main results of our simulations. It shows a diagram indicating the self-assembly lines separating the structures obtained for different values of and , with a typical resolution of one degree for , and 0.1 for the binding energy.

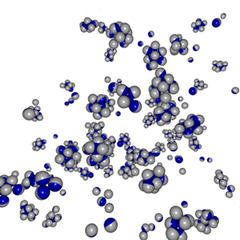


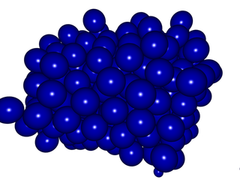
As expected, a rich variety of structures arises depending on the position of the dividing surface , and particles’ binding energy, . Notice that, consistent with recent numerical simulations on self-assembly of viral capsids chandler , and chaperonins geissler , intermediate ordered aggregates are extremely sensitive to the size of the hydrophobic region and self-assembly occurs in a very narrow region. At low binding energy the system is in a gas state. For small values of and moderate values of (Fig. 2(a)) particles aggregate into small clusters of 4 to 13 particles (meso-particles) including icosohedral structures like those seen in wilber . For , self-assembly yields worm-like extended structures (Fig. 2(b)), as has been observed previously for Janus spheres Hong2 . As the angular location of the hydrophobic region increases from to we find, in order of appearance, self-connected worm-like structures (Fig. 2(c)), flat-crystalline bilayers (Fig. 2(d)), faceted hollow cages (Fig. 2(e)) (similar to structures seen in the self-assembly of cone-shaped particles glotzer3 ; glotzer4 , yet not restricted to specific magic numbers of particles.), amorphous fluid blobs (Fig. 2(f)), and finally FCC crystals (Fig. 2(g)).
Apart from the possible relevance of phases (d) and (e) for practical applications, we want to point out that none of these structures arises following a simple particle-by-particle growth mechanism, but rather by two-to-three step hierarchical self-assembly. The first step typically involves the formation of more- or less-structured meso-particles (depending on ). Next, small clusters organize into either extended worm-like aggregates, which then coalesce or deform to produce the final structure, or into larger fluid clusters that, once beyond some threshold size, spontaneously organize into structured aggregates.
It is of particular interest to discuss in some detail the dynamical pathway of structure formation relative to phases (c), (d) and (e) as they all form via a complex three step mechanism (the dynamical pathway leading to structures in region (b) is identical to what was found in reference Hong2 and we refer the reader to that paper for a thorough description.) Surprisingly, the common precursor to all of them is the worm-like structure stable at . Self-connected worm-like aggregates are a consequence of the improved flexibility of the worm-like structures. As increases, so does the ability of particles to rotate about their axes. The net result is that the branching ends of the clusters begin to connect, thus forming topologically nontrivial aggregates.
To quantify the statistical difference between the aggregates found in regions (b) and (c), we measure their average radius of gyration as a function of cluster size. Results are shown in Fig. 3, and clearly indicate how as increases, the typical size of the aggregate decreases accordingly, resulting in more compact structures. The low statistics for large clusters prevent us from making any meaningful estimate of the chains size exponent.

We also measure the angular probability distribution function, , between neighboring particles in clusters containing at least 50 particles. Fig. 4 shows in regions (b), (c) and (d). shows a clear double peaked shape in region (d), where the aggregates assume a planar bilayer configuration, but the more intriguing difference is between region (b) and (c), highlighted in the insert of the figure. Region (b) is characterized by a peak at , and less distinguishable peaks at and ; overall there is a large probability for all possible orientations. These data suggest that branched worm-like aggregates have a roughly circular cross-section with particles oriented in a disordered fashion, but for a slight preference for a few selected angles (remnants of the meso-particle structures they self-assembled from), and an anti-parallel neighbor opposite to most particles. In contrast, region (c) is characterized by a more distinct double-peaked function, with each peak close to . This is consistent with a cross section that has flattened with respect to structures in region (b), and indicates that each branch of the aggregate is acquiring bilayer-like features. The dashed line separating regions (b) and (c) shows where in the diagram the strings acquire sufficient flexibility to begin to form complex self-connected aggregates.
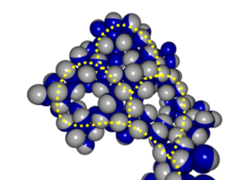
This observation is quite interesting when related to the dynamic pathway leading to phase (d). In fact, bilayers are formed by either coalescence of co-planar loops, as shown in Fig. 5, or by branch alignment. This transition occurs at , and it is driven by the large energy gain attained by the aggregates when each particle surrounds itself with the suddenly increased number of neighbors compatible with the enlarged hydrophobic region. This transition is quite sharp and represents a beautiful example of how a very small perturbation of the geometry of the local interaction can lead to completely different macroscopic structures.
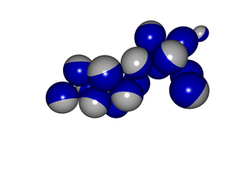
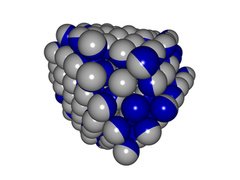
Finally, formation of finite-size faceted capsids does not occur by self-assembly of mis-oriented, disjoined bilayers, but via a mechanism which, once again, involves multiple steps. As we increase the size of the particles’ hydrophobic region, short worm-like clusters, which are now very flexible, immediately fold onto themselves to form small, amorphous fluid blobs. We find that these blobs tend to remain fluid-like, whereas larger ones morph into faceted cages via a mechanism similar to that described for the formation of bilayers. Fusion of fluid blobs, as illustrated in Fig. 6, is the main mechanism through which large blobs, which eventually turn into faceted cages, are generated. The dashed line between regions (d) and (e) indicates the onset of cage formation; however, a non-negligible number of planar aggregates are found to coexist with the faceted cages in region (e). It is worth stressing that these faceted cages can be considered as colloidal analogs of lipid vesicles; they are hollow, their inner walls are hydrophilic, and one could in principle consider using them as possible drug carriers, with edges and corners presenting convenient locations for outer surface tagging.
A statistical analysis of our data correlating size and structure for non-planar aggregates in region (e) indicates a clear preference for large clusters to develop into faceted hollow cages (see Fig. 7). What sets the onset cluster size for this transformation is a complex compromise between the geometric constraints imposed by the interparticle potential; the energy gain to close-pack particles in a bilayer, which grows with the number of particles ; the energy cost for sides and corners, which have on average fewer neighbors than in a fluids state and have an energy cost which grows as and respectively; and finally the entropy loss due to particle ordering. Clearly, as increases, at sufficiently large binding energy, planar configurations become the most stable, and this results in surface faceting.




When increases to even larger values, the geometric constraints imposed by the inter-particle potential become less restrictive, and planar bilayer configurations become less stable. Phase (f) is characterized by fluid, amorphous blobs which remain fluid at all sizes. Large clusters, formed by the smooth fusion of smaller ones, tend to contain smaller sub-clusters in their interior. This is the first sign indicating that aggregates begin to acquire a three-dimensional character, which eventually leads to the formation of clusters with FCC order, as inner and outer clusters begin to interact with each other. The location of the fluid to FCC transition is at , and was found by performing a structural analysis of the aggregates. Following auer ; ronchetti , we identified particles whose local orientation is compatible to FCC ordering via a local bond order parameter based on spherical harmonics. Given a particle , we consider
| (2) |
where runs over the neighbors of particle , from which a rotationally invariant order parameter correlating the orientation of neighboring particles and can be defined as
| (3) |
Figure 8 shows the degree of crystallinity as a function of across the angular range . is obtained by first averaging over the neighbors of each particle , and then by taking the average over all crystalline particles in a cluster. Clearly, once crystalline particles are formed, their degree of order in a face-centered cubic crystal structure is independent of .

The explanation of this behavior is purely geometrical. In fact, for sufficiently large , the hydrophilic area on each particle becomes so small that can be positioned among the 12 particles’ contact points resulting from an FCC crystal without affecting its structure. Simple geometric considerations suggest that the onset value should occur for an angular span of the hydrophobic region larger than . This value is compatible with our result because of the extra tail of in our definition of the potential angular dependence. A careful analysis of the model for decreasing values of , not shown here, does indeed result in a systematic shift of the crystallization onset to larger values.

At last, it is important to point out that, once again, the pathway leading to the formation of crystalline aggregates occurs in a two-step fashion. Particles first condense into a large, fluid aggregate, and then crystallize from within the cluster via a standard nucleation process. Figure 9 shows in the same plot the size dependence of the whole aggregate over time, versus the number of crystalline particles in it. Clearly, crystal formation begins long after the aggregate is formed, and the large fluctuations in the initial stages of crystal growth show the typical signature of crystal nucleation. These results are compatible with nucleation studies of isotropic colloidal particles interacting via a short-range attractive potential first observed in tenwolde , and highlight the crucial role played by meta-stable phases in the dynamics of crystal growth. In fact, we believe that this is the over-arching physics behind the rich dynamical phenomenology we find throughout this paper. Self-assembly proceeds, as predicted by Ostwald’s step rule in the context of crystal nucleation ostwald , in a step-wise fashion that accounts for the complex free energy landscape containing multiple meta-stable states. Although we have not looked at the stability of the different phases found in our simulations, planar and vesicular structures are also being observed in the study of the equilibrium properties of a model system similar to ours SciortinoX . It is also worth mentioning that we expect the precise location of the phase boundaries to be somewhat sensitive to the particular choice of the angular potential. Unfortunately, this is very hard to characterize experimentally near the Janus interface and there is not a unique way of modeling that boundary. Our phase diagram is therefore intended to serve mostly as a guide for experimentalists.
IV Conclusions
In this paper we used molecular dynamics simulations to study the self-assembly pathway of spherical amphiphatic colloidal particles. We uncovered a wealth of different aggregates whose structures span the three dimensional spectrum. Specifically, depending on the size ratio between the hydrophilic and hydrophobic regions, particles self-assemble into small micellar clusters, worm-like structures, planar bilayers, faceted and fluid cages, and finally FCC crystals. We described the hierarchical self-assembly pathway leading to most of these structures and discussed their connection to the geometry of local inter-particle interactions. Finally, we made precise predictions for the formation of hollow amphiphatic cages.
Although the morphology of some of our aggregates can be predicted by simple geometric considerations, the dynamics leading to their formation is far less trivial, and may play a crucial role in the efficiency of the self-assembly process. We believe that, apart from trivial cases, any procedure attempting to design inter-particle interactions to target specific structures could greatly benefit from taking into account the dynamics of structure formation in the design process.
References
- (1) B. Alberts at al., Molecular Biology of the Cell, 5th ed. (Garland Science, New York & Oxford, 2008).
- (2) F.H.C. Crick , J.D. Watson, Nature 177, 473 (1956).
- (3) A. Klug, D.L.D. Caspar, Advances in Virus Res 7, 225 (1960).
- (4) E. Sackmann, Canadian Journal of Physics 68,999, (1990).
- (5) G. Subramanian, V.N.Manoharan, J.D. Thorne, D.J. Pine, Advanced Materials 11, 1261 (1999).
- (6) G.A. DeVries, et al., Science 315, 358, (2007).
- (7) M. Li, H. Schnablegger,S. Mann, Nature 402, 393, (1999).
- (8) L. Hong, S. Jiang,S. Granick, Langmuir 22, 9495, (2006).
- (9) H. Weller, Philosophical Transactions of the Royal Society of London Series a-Mathematical Physical and Engineering Sciences 361, 229, (2003).
- (10) E. K. Hobbie et al., Langmuir 21, 10284 (2005).
- (11) J. N. Israelachvili, D. J. Mitchell, B. W. Ninham, Journal of the Chemical Society-Faraday Transactions II 72, 1525, (1976).
- (12) T. Hu, R. Zhang,B. I. Shkovskii, Physica a-Statistical Mechanics and Its Applications 387, 3059, (2008).
- (13) D. Leckband, J. Israelachvili, Quarterly Reviews of Biophysics 34, 105 (2001).
- (14) R. Nagarajan, E. Ruckenstein, Langmuir 7, 2934 (1991).
- (15) S. C. Glotzer and M. J. Solomon, Nature Materials 6, 557 (2007).
- (16) L. Hong, A. Cacciuto, E. Luijten and S. Granick, Langmuir 24, 621 (2008).
- (17) Z. Zhang and S. C. Glotzer, Nano Lett. 4, 1407 (2004).
- (18) H. Liu et al., J. Chem. Phys. 130, 044902 (2009).
- (19) M. F. Hagan and D. Chandler, Biophys. J. 91, 42 (2006).
- (20) S. Whitelam and P.L. Geissler, J. Chem. Phys. 127, 154101 (2007).
- (21) A. X. Wilber et al., J. Chem. Phys. 127, 085106 (2007).
- (22) T. Chen, Z. Zhang and S. C. Glotzer, PNAS 104, 717 (2007).
- (23) T. Chen, Z. Zhang and S. C. Glotzer, Langmuir 23, 6598 (2007).
- (24) S. Auer and D. Frenkel, Annu. Rev. Phys. Chem. 55, 333, (2004).
- (25) P. L. Steinhardt, D. R. Nelson, M. Ronchetti, Phys. Rev. B 28, 784 (1983).
- (26) P. R. ten Wolde and D. Frenkel, Science 277, 1975 (1997).
- (27) W. Z. Ostwald, Phys. Chem. 22, 289, (1879).
- (28) F. Sciortino, private communication.