Damped Lyman- systems in high-resolution hydrodynamical simulations
Abstract
We investigate the properties of Damped Lyman- systems (DLAs) using high-resolution and large box-size cosmological hydrodynamical simulations of a CDM model. The numerical code used is a modification of GADGET-2 with a self consistent implementation of the metal enrichment mechanism (Tornatore et al. 2007). We explore the numerical convergence of some relevant physical quantities and we vary the parameters describing the properties of galactic winds; the initial stellar mass function; the linear dark matter power spectrum and the metal enrichment pattern of the IGM (Intergalactic Medium) around DLAs. We focus on the properties of dark matter haloes that are likely to be the hosts of DLAs systems: we predict relatively low star formation rates ( /year) and metallicities around 0.1 , at least for the bulk of our haloes of masses between and hosting DLAs. For more massive haloes metallicities and star formation rates depend on the specific wind model. We find that strong galactic winds with speed of about 600 km/s, in an energy-driven wind scenario, are needed in order to match the observed column density distribution function for DLAs and the evolution of the neutral hydrogen content with redshift. The momentum-driven implementation of the galactic wind model, that relates the speed and mass load in the wind to the properties of the dark matter haloes, shows a behaviour which is intermediate between the energy-driven galactic winds of small ( km/s) and large ( km/s) velocities. At the contribution of haloes of masses between and , for DLAs below cm-2, to the column density distribution function, is significant. By interpolating physical quantities along line-of-sights through massive haloes we qualitatively show how different galactic wind models impact on the IGM around DLAs. Furthermore, we analyse statistics related to the velocity widths of SiII associated to DLAs: while the expanding shells of gaseous matter associated to the wind can account for the observed velocities, the metallicity in the wind seems to be rather clumpy and this produces an underestimation of the observed velocity widths. We outline possible solutions to this problem.
keywords:
cosmology: theory – intergalactic medium – galaxies: formation – quasars: absorption lines – methods: numerical1 Introduction
Damped Lyman- systems (DLAs) are defined as quasar (QSO) absorption systems with neutral hydrogen column density cm-2 (Wolfe et al., 1986). DLAs are considered as an important reservoir and/or sink of gas for the galaxy formation process in the high redshift universe and their neutral hydrogen content dominate the total neutral hydrogen budget over a large fraction of the cosmic history. The interplay between DLAs and galaxies is thereby fundamental and should be addressed by any galaxy formation model.
Significant observational efforts have been made in order to understand the nature of DLAs (e.g. Wolfe et al., 1995; Storrie-Lombardi & Wolfe, 2000; Rao & Turnshek, 2000; Prochaska et al., 2001; Péroux et al., 2003; Chen & Lanzetta, 2003; Prochaska et al., 2005), while, on the theoretical side, semi-analytical models and high-resolution hydrodynamical simulations are routinely performed to investigate the relation between DLAs and dark matter haloes and to match their observed properties (e.g. Katz et al., 1996; Gardner et al., 1997; Haehnelt et al., 1998; Maller et al., 2001; Gardner et al., 2001; Nagamine et al., 2004; Okoshi & Nagashima, 2005; Nagamine et al., 2007; Pontzen et al., 2008; Barnes & Haehnelt, 2008). Despite these efforts, the nature of DLAs is still unclear (for a review see Wolfe et al., 2005) and the interpretation of the large observed velocity width of low-ionization species is not unambiguous. In fact, the disk-like model of Prochaska & Wolfe (1997) in which DLAs are thick rotating disks with speed typical of a present-day spiral galaxies and the alternative model based on the assumption that DLAs are protogalactic clumps (Haehnelt et al., 1998) seem to be both viable. More precisely, Haehnelt et al. (1998) showed that while the velocity width profiles of DLAS can be reproduced by rotation in disks as well as protogalactic clumps, the velocity width distribution cannot be reproduced by rotation in disks in the context of a cold dark matter model.
In order to make significant progress in this field observational and theoretical/numerical efforts are needed to tackle the problem under many different aspects. Recently, the SDSS (Sloan Digital Sky Survey) has allowed to measure to an unprecedented precision the statistical properties of DLAs (incidence rates, column density distribution function, etc.) over a wide redshift range (Prochaska et al., 2005). Moreover, attempts to find the galaxy counterparts of DLAs represent the most promising way to understand their nature (e.g. Fynbo et al., 1999; Christensen et al., 2007). High-resolution spectroscopic studies have also played a crucial role since low-ionization metal lines, that are supposed to be good tracers of the neutral gas in DLAs, can be identified shedding light on the DLAs chemical and physical properties (Matteucci et al., 1997; Calura et al., 2003; Vladilo & Péroux, 2005; Vladilo et al., 2006; Prochaska & Wolfe, 2008; Vladilo et al., 2008). Here, we choose to focus on the role of feedback in the form of galactic outflows and its impact on the DLAs properties.
Recently, Pontzen et al. (2008) analysed several different hydrodynamical simulations with and without feedback using an approximate a-posteriori radiative transfer scheme. They matched most of the observed DLAs properties apart from a tension with the observed velocity widths. In their framework, haloes of virial masses between and were the main contributors to the DLA cross-section. Barnes & Haehnelt (2008) with a semi-analytical model claimed instead that in order to reproduce the velocity widths distribution the cross-section of haloes less massive than should be exponentially suppressed. Observations of the HI distribution in the local universe made by Zwaan et al. (2008) show that the link with galactic superwinds might be stronger than expected and favoured this explanation instead of the disk-like model to explain the observed velocity widths. Also some correlation properties of neutral hydrogen rich galaxies and HI absorbers in the local universe seem to be better fit when galactic winds are taken into account (Pierleoni et al., 2008). However, the situation is quite confusing and potential problems for this interpretation are extensively discussed in Prochaska et al. (2008).
In this work, we extend the analysis performed recently by Nagamine et al. (2007) that addressed the properties of DLAs in a CDM universe. The main differences can be summarized as follows and will be more extensively discussed later: we rely on simulations that have on average a factor 10 better mass resolution; we use a different version of the hydrodynamical code GADGET-2 that incorporates the dependence of the radiative cooling function on the global metallicity of the gas (following Sutherland & Dopita, 1993) and a self consistent metal enrichment model; we explore the effect of varying the stellar initial mass function and most of the parameters describing the wind model. As for the wind model we focus mainly on energy-driven scenarios but we allow for an extra simulation that is based on a momentum-driven wind. At least for the low-density IGM, this model seems to better fit some observational properties ( e.g. Oppenheimer & Davé, 2006, 2008). The goal is to see which DLAs properties can be reproduced by the hydrodynamical simulations and to investigate closely the impact of galactic winds both on the neutral hydrogen and on the metal distribution around galactic environments in the high redshift universe (mainly in the range ).
This work is intended as a preliminar quantitative attempt to match some observed properties of the metal and neutral hydrogen distribution using a self consistent chemo-dynamical code that has been already tested for the intra-cluster medium (Tornatore et al., 2007). After having addressed some global properties and evolution of IGM low-ionization species, we will focus on DLAs because their statistical properties are well measured over a wide redshift range and they could provide a useful benchmark for the physics implemented in our simulations.
This paper is organized as follows. In Section 2 we describe our set of simulations along with the two different galactic feedback implementations used: energy–driven and momentum–driven winds. In Section 3 we compare some global properties of the simulations: in particular temperature and metallicity relations (Section 3.1), star formation rates and evolution of ion species (Section 3.2). In Section 4 we focus on the neutral hydrogen distribution around galaxy-sized haloes and we study DLAs properties like the cross-section (Section 4.3), the incidence rate (Section 4.4) and the column density distribution function (Section 4.5). Section 5 is dedicated to the simulated QSO spectra extracted from our simulations, to study the velocity width distribution of low-ionization species (Section 5.1) and the correlation between metallicity and velocity widths (Section 5.2). Finally in Section 6 we summarize our main results and we draw some conclusions.
2 The simulations
We run a number of hydrodynamical simulations in order to explore the effect of changing box-size, numerical resolution, stellar initial mass function, prescription for energy feedback and nature of dark matter. We use a modified version of GADGET-2 , a parallel Tree-PM Smoothed Particle Hydrodynamics (SPH) code (Springel, 2005). The main modification consists in an accurate modelling of the chemical evolution which allows us to follow the metal release from Type II and Type Ia supernovae (SNII, SNIa), along with low and intermediate mass stars (LIMS). We refer to Tornatore et al. (2007); Fabjan et al. (2008); Borgani et al. (2008) for more details while we briefly outline in the following the most important features of the chemical enrichment model.
The simulations cover a cosmological volume (with periodic boundary conditions) filled with an equal number of dark matter and gas particles. The cosmological model chosen is a flat CDM with the following parameters: , , , , km/s/Mpc and , which are in agreement with the latest results from large scale structure observables such as the cosmic microwave background, weak lensing, the Lyman- forest and the evolution of mass function of galaxy clusters (Komatsu et al., 2008; Lesgourgues et al., 2007; Vikhlinin et al., 2008). The input linear dark matter power spectrum for the initial conditions has been generated at with CMBFAST (Seljak & Zaldarriaga, 1996) and includes baryonic acoustic oscillations. In one case only we change the initial linear dark matter power spectrum by running a warm dark matter (WDM) simulation with a modification (suppression at the small scales) of the initial power spectrum to account for a thermal dark matter particle of mass of 1.2 keV, which is in rough agreement with recent results obtained from Lyman- high-resolution QSO spectra at redshifts similar to those investigated here (Viel et al., 2008).
Radiative cooling and heating processes are included following the implementation of Katz et al. (1996). We assume a mean Ultra Violet Background (UVB) produced by quasars and galaxies as given by Haardt & Madau (1996), with the heating rates multiplied by a factor in order to better fit observational constraints on the temperature evolution of the Intergalactic Medium (IGM) at high redshift. This background gives naturally a at low redshift in agreement with recent observational measurements (Bolton et al., 2005; Faucher-Giguère et al., 2008). Multiplying the heating rates by the factor above (chosen empirically) results in a larger IGM temperature at the mean density which cannot be reached by the standard hydrodynamical code but aims at mimicking, at least in a phenomenological way, the non-equilibrium ionization effects around reionization (see for example Ricotti et al., 2000; Schaye et al., 2000; Bolton & Haehnelt, 2007). We follow self consistently the evolution of the following elements: H, He, C, O, Mg, S, Si and Fe. The contribution of metals is included in the cooling function adopting the tables of Sutherland & Dopita (1993), that assume the solar value for the relative abundances. In this paper we use the solar metallicity and element abundances given by Asplund et al. (2005).
The standard multiphase star formation criterion is used in which an effective prescription for the inter-stellar medium (ISM) is implemented (Springel & Hernquist, 2003). In this effective model, a gas particle is flagged as star forming whenever its density exceeds a given density threshold, above which that particle is treated as multiphase. With this prescription baryons are in the form either a hot or a cold phase or in stars, thereby this density threshold marks the onset of cold clouds formation. Following Tornatore et al. (2007) we set the threshold value to cm-3 in terms of the number density of hydrogen atoms.
The neutral hydrogen fraction is associated to each gas particle and is stored in each simulation snapshot. However, we follow Nagamine et al. (2004) to assign a-posteriori a new mass in neutral hydrogen to gas particles above the density threshold which reads:
| (1) | |||||
| (2) |
with the neutral hydrogen fraction that depends on the UVB used, the hydrogen mass of the particle ( and are determined self consistently inside the code), the fraction of mass in cold clouds and the star formation threshold. Here , where is the density of cold clouds and the total (hot + cold) gas density. Individual molecular clouds cannot be resolved at the resolution reachable in cosmological simulations, thus represents an average value computed over small regions of the ISM. We refer to Springel & Hernquist (2003) to better understand how this cold fraction is related to the physics of the ISM.
Besides including different contributions from SNII, SNIa and LIMS, our model of chemical evolution accounts for the age of various stellar populations. Metals are thereby released over different time-scales by stars of different mass. For the stellar yields we use: SNIa – Thielemann et al. (2003); SNII – Woosley & Weaver (1995); LIMS – van den Hoek & Groenewegen (1997). The mass-range for the SNII is , while for the SNIa is with a binary fraction of 10%. We also adopt the lifetime function given by Padovani & Matteucci (1993). Finally we use three distinct stellar inital mass functions (IMFs): a Salpeter, a Kroupa and an Arimoto-Yoshii IMF. Our reference choice is the functional form proposed by Salpeter (1955): , where is the IMF by mass and . Arimoto-Yoshii (Arimoto & Yoshii, 1987) IMF has , while Kroupa IMF (Kroupa, 2001) adopts a multi-slope approximation: for stellar mass , for and for .
| Run | Size (Mpc) | NGAS | mGAS () | soft. (kpc) | Wind (km/s) | IMF | zf | |
|---|---|---|---|---|---|---|---|---|
| SW | 10 | 1.5 | 600 | Salpeter | 2.25 | |||
| WW | 10 | 1.5 | 100 | Salpeter | 2.25 | |||
| MDW | 10 | 1.5 | -dependent(a) | Salpeter | 2.25 | |||
| SWKR | 10 | 1.5 | 600 | Kroupa | 2.25 | |||
| SWAY | 10 | 1.5 | 600 | Arimoto-Yoshii | 2.25 | |||
| SW10,448 | 10 | 1 | 600 | Salpeter | 3.00 | |||
| SW10,256 | 10 | 2 | 600 | Salpeter | 2.25 | |||
| SW20,512 | 20 | 2 | 600 | Salpeter | 3.00 | |||
| SW5,320 | 5 | 0.75 | 600 | Salpeter | 3.00 | |||
| SWWDM(b) | 7.5 | 0.75 | 600 | Salpeter | 3.00 |
2.1 Energy–driven winds
The implementation of galactic winds used is extensively described in Springel & Hernquist (2003) however, since this paper addresses the effects on the chemical enrichment of winds blowing from high density regions, we summarize here the major details of the original model and the modifications that we made.
In the multiphase model of Springel & Hernquist (2003) gas contained in dark matter haloes cool and settle into rotationally supported discs where the baryons are converted into stars. However, in the star-forming multiphase medium, it is plausible that not all of the hot gas in supernova remnants remains confined to the disc: supernova bubbles close to the surface of a star-forming region may break out of a disc and a galactic-scale wind associated with star formation may develop.
Basically, the wind mass-loss rate is assumed to be proportional to the star formation rate according to , where is the wind efficiency. Star-forming gas particles are then stochastically selected according to their star formation rate to become part of a blowing wind. Whenever a particle is uploaded to the wind, it is decoupled from the hydrodynamics for a given period of time (calculated as mentioned below) or till the density around drops below a given fraction of the density threshold set for the onset of the star formation, in order to effectively reach less dense regions. In our case, this limiting density for decoupling is . This allows the wind particle to travel ‘freely’ up to few kpc until it has left the dense star-forming phase, without directly affecting it: only outside the disc the hydrodynamical interactions within the halo could stop the wind. Unlike in Springel & Hernquist (2003), we decide here to fix the velocity of the winds, , instead of the fraction of the energy made available by SNII explosions to power galactic ejecta. Thus, four parameters fully specify the wind model: the wind efficiency , the wind speed , the wind free travel length and the wind free travel density factor .
The maximum allowed time for a wind particle to stay hydrodynamically decoupled is then . The parameter has been introduced in order to prevent a gas particle from getting trapped into the potential well of the virialized halo and in order to effectively escape from the ISM, reach the low density IGM and pollute it with metals. Nagamine et al. (2007) showed that global DLAs properties are relatively insensitive to the value of .
In this work, we will consider two values for the wind velocity: km/s (weak winds, WW) and km/s (strong winds, SW). In our implementation the parameter is kept fixed to the value 2. For a more quantitative description of the numerical implementations made and for an application to the intra-cluster medium physics we refer to the paper by Tornatore et al. (2007).
2.2 Momentum–driven Winds
In this Section we describe our implementation of the momentum–driven galactic winds, which have been first implemented in simulations by Oppenheimer & Davé (2006, 2008). These authors suggested that with this scheme of winds simulations reproduce the statistics of CIV absorption in the high–redshift IGM better than using the above energy-driven winds.
Observations of outflows from starbust galaxies have improved considerably in recent years. Martin (2005) found that the terminal wind velocity scales roughly linearly with circular velocity, with top winds speeds around three times the galaxy’s circular velocity. Rupke et al. (2005) studied a large sample of luminous infrared galaxies and found that, at least when combined with smaller systems from Martin (2005), those trends continue to quite large systems.
A feasible physical scenario for the wind driving mechanism is derived by noting that the observed scaling are well explained by a momentum–driven wind model such as that outlined by Murray et al. (2005). In such a scenario, the radiation pressure of the starbust drives an outflow, possibly by transferring momentum to an absorptive component (such as dust) that is hydrodynamically coupled with the gas component, which is then dragged out of the galaxy. Following Oppenheimer & Davé (2006, 2008) we test a single model (very close to their “mzw” run) based on momentum–driven winds. In such a model the wind speed scales as the galaxy velocity dispersion , as observed by Martin (2005). Since in momentum–driven winds the amount of input momentum per unit star formation is constant, this implies that the mass loading factor must be inversely proportional to the velocity dispersion. We therefore use the following relations:
| (3) |
where is the luminosity factor in units of the galactic Eddington luminosity (i.e. the critical luminosity necessary to expel gas from the galaxy), is the normalization of the mass loading factor and we add an extra kick to get out of the potential of the galaxy in order to simulate continuous pumping of gas until it is well into the galactic halo. The functional form of the luminosity factor includes a metallicity dependence for owing to more UV photons output by lower–metallicity stellar populations: , where Martin (2005) suggests: . The mass loading factor controls star formation at early times, so can also be set by requiring a match to the observed global star formation rate. Following Oppenheimer & Davé (2008) we set km/s. We determine directly from the simulation only for the most massive haloes, while for haloes with masses below (i.e. formed by less than 103 dark matter particles) we use the relation calibrated by Evrard et al. (2008), using a variety of N-body simulations:
| (4) |
where km/s is the normalization
at mass , is
the logarithmic slope and is defined as the total mass
within a sphere with mean interior density ( is the
critical density at redshift ). Even for this wind implementation
the particles are stochastically selected in the same way as for the
energy–driven scenario.
In Table I we summarize the main parameters of the cosmological simulations performed including the mass associated to the gas particles and the gravitational softening. All the simulations start at redshift . The reference simulations are SW (“Strong Winds”), WW (“Weak Winds”) and MDW (“Momentum–Driven Winds”) with a total of dark matter and gas particles in a 10 comoving Mpc box and Salpeter IMF. Furthermore, SWKR (Kroupa IMF) and SWAY (Arimoto-Yoshii IMF) explore the effects of a different IMF compared to the Salpeter one. Some simulations are intended to explore resolution and box-size effects like SW10,448, SW10,256, SW20,512 and SW5,320. The most CPU-time consuming run is the SW20,512, which significantly increase the statistics of dark matter haloes able to host DLAs. Finally, the SWWDM aims at exploring the effect of a modification in the initial linear dark matter power spectrum.
3 Global properties of the simulations
3.1 IGM temperature and metallicity relations at
In this Section we investigate two global properties of the IGM, namely its thermal and chemical state, focussing on the differences between the SW, WW and MDW runs at . A more detailed analysis of global IGM properties down to small redshifts is beyond the scope of this paper and will be presented in a future work.
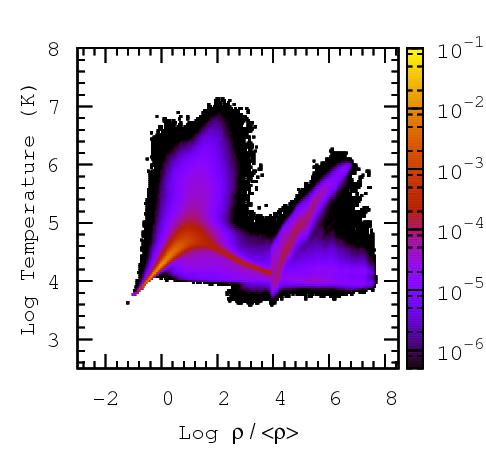
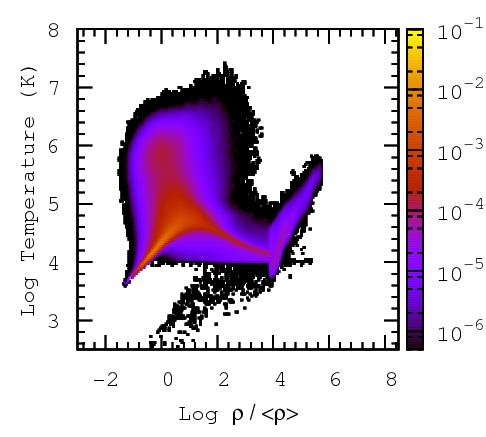
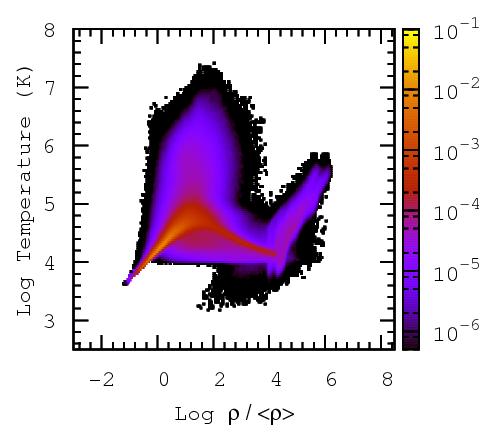
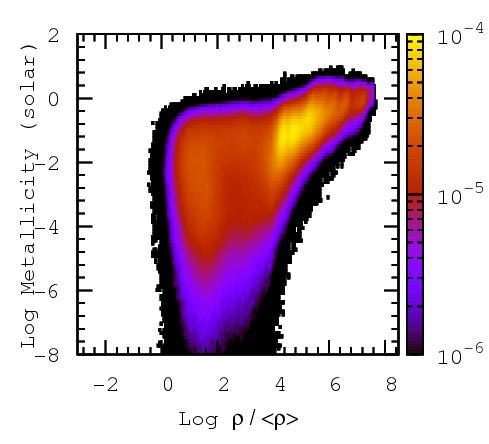
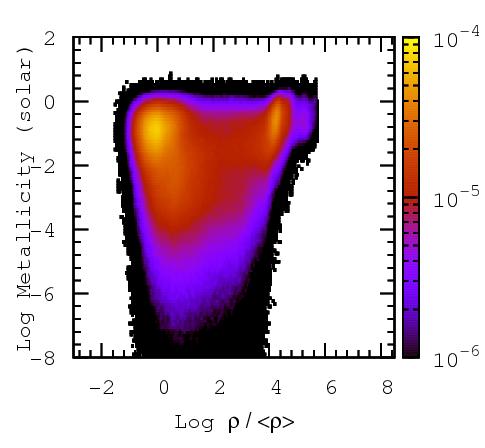
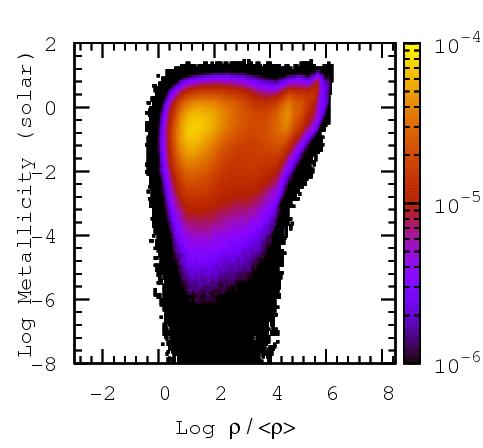
In Figures 1 and 2 we show the IGM temperature-density relation and the metallicity-density relation for the WW (left panel), SW (middle panel) and MDW (right panel) simulations. In these figures it is shown an “effective” temperature for the star-forming particles determined as the mean temperature weighted by the contribution in mass of the cold and the hot phases (see Section 2). In all cases the phase diagrams are color coded according to the gas mass fraction, as indicated by the vertical bars. For all the three runs a significant fraction in mass (about 10%) of the IGM resides in the tight power-law relation at around the mean density. Gas at this density is usually responsible for Lyman- forest absorption. At the IGM has a temperature at the mean density of about K and the slope of the temperature-density relation is around 1.6. In our simulations we assume photoionization equilibrium and under this assumption it is difficult to get values of , which however are in better agreement with the recent measurements of the Lyman- probability distribution function (Bolton et al., 2008). An IGM fraction between and is in the form of shock-heated gas at temperatures higher than K. The tail of cold gas at large densities resides in the inner parts of the haloes while at even larger densities, , and temperature, K, is associated to star-forming regions. We note a plume of cold and overdense gas particles that are below K and carry a fraction of mass of the order : these are gas particles that are in the wind phase. After these particles enter the wind regime they become hydrodynamically decoupled for a certain period of time (see Section 2.1). During this period they travel ‘freely’ towards regions in which both the density and the temperature are lower. As a consequence, when these particles re-couple to the hydrodynamics, their temperature drop because of the adiabatic expansion.
In Figure 2 we show the metallicity-density relation for the three simulations. In the SW case the gas that has been enriched spans a wide range of densities and can attain values that are very close to solar. Also gas that is below the mean density appears to be metal enriched at a high level in this simulation. The bulk ( in mass fraction) of the IGM is either in the form of gas at the mean density or in the form of very dense gas at about with metallicities of about 0.1 .
All the previous findings are particularly interesting when the WW (left panel) and SW (middle panel) runs are compared. For the WW temperature-density relation it is clear that the amount of shock-heated gas is signifcantly reduced and the region of the diagram at temperatures between and K is less populated. Thereby, strong galactic winds with speed of order 600 km/s heat the IGM significantly, while weaker winds with speed of order 100 km/s are less effective in doing this. The gas particles in the wind phase at are now fewer than in the SW case and at higher overdensity. Moreover, the star-forming high density tail is considerably more extended than in SW case confirming the less efficient feedback of WW in suppressing star formation. In contrast with the SW simulation, in the WW case there is slightly less metal-enriched underdense gas, while the metallicity gradient with density is steeper. Higher values of metallicities are now reached, which attain super-solar values at very high density. In the WW case the bulk of the enriched gas shifts from the mean density values of the SW case to a region which is about times denser than the mean.
We stress that the difference between the SW and WW simulation is only in the wind speed which is 600 and 100 km/s, respectively, while all the other parameters have been kept fixed. These values of the wind velocity have been chosen in order to embrace values suggested by observational studies of HI and CIV-galaxy correlation and Lyman- forest in close QSO pairs (Adelberger et al., 2005; Rauch et al., 2005), and observations of interstellar lines in ultraluminous infrared galaxies (Martin, 2005).
The right panels of Figures 1 and 2 show results for the MDW simulation. Looking at the temperature-density diagram one can easily see a general trend that is intermediate between those of the SW and WW runs. For example, the region associated to wind particles (cold and overdense particles below K) is less pronounced with respect to SW but not as negligible as the WW run. However the metallicity-density relation is quite different from the energy-driven implementation. In particular the metallicity reaches values slightly higher than SW and WW for the whole range of densities and most importantly there is much more enriched material around the mean density. This result suggests that MDW is more efficient in polluting the IGM above and around the mean density: this is due to the fact that, unlike for SW and WW, in MDW even small haloes contribute significantly to the enrichment. In fact, such small haloes have small velocity dispersion and correspondingly greater loading factors (see Eq. (3)) for their winds.
3.2 Star formation rates and evolution of ion species
In this Section we analyse the star formation rates (SFR) for the different simulations and the evolution of the neutral hydrogen content and of two ion species, CIV and OVI, that are usually observed in absorption in QSO spectra even at higher redshifts than those explored here (e.g. Becker et al., 2008; Ryan-Weber et al., 2009).
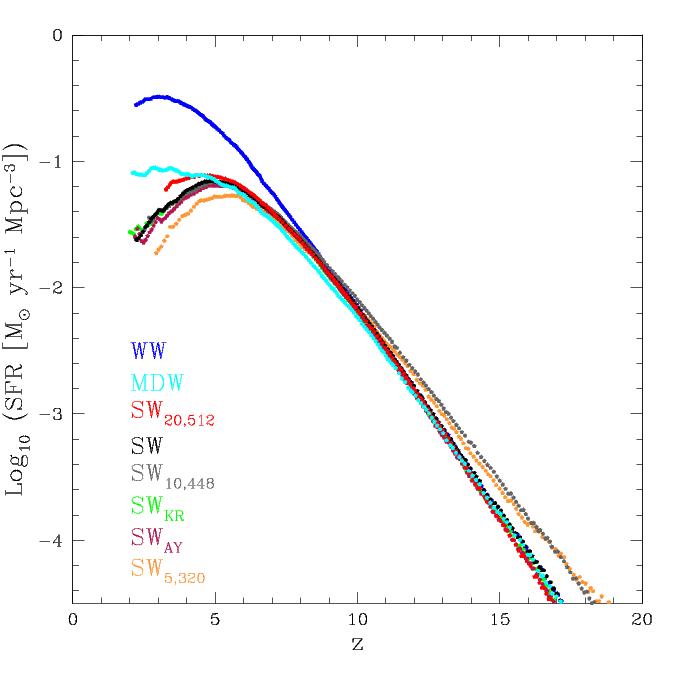
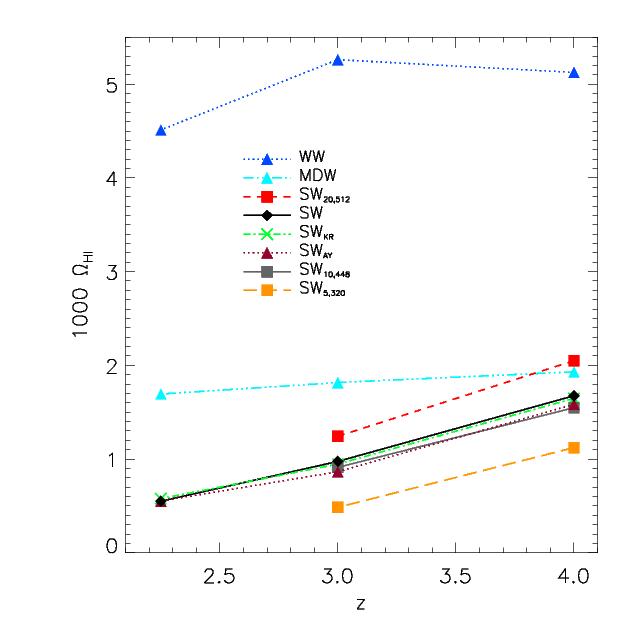
In the left panel of Figure 3 we show the total star formation rate of the simulated volume as a function of redshift. The WW simulation has nearly a factor 10 higher star formation rate compared to the others at . This means that the feedback mechanism induced by strong galactic winds is effective in paupering the metal-rich star-forming gas significantly decreasing the star formation rate. The SW20,512 and SW5,320 embrace all the SW runs and this is due to cosmic variance effects. We note negligible differences between the Salpeter IMF and the other two IMFs used (Kroupa and Arimoto-Yoshii), at least at the relatively high redshifts considered here. We underline, however, that we neglect the effect of assuming different IMFs on the observationally inferred cosmic star formation rate; this means that we do not change the star formation efficiency as it would be required in order to match the observables when the number of massive stars per unit mass of formed stars changes. That is because here we are more interested in the chemical and energetic effect of the IMF. We also point out the intermediate trend of the MDW, in between SW and WW. At very high redshift () the SW5,320 and SW10,448 show a higher star formation with respect to the other runs. This is due to the improved resolution of these simulations that can resolve higher densities at earlier times. The star formation rate of the SW10,448 at lower redshift agrees very well (in fact the black and the grey curves are nearly indistinguishable) with that of the SW simulation, which has the same box size but less particles. This confirms the numerical convergence of our simulations.
The behaviour shown in the star formation rate is very similar in nature to that of the total neutral hydrogen evolution of Figure 3 (right panel). Here we plot , which is defined as the contribution of neutral hydrogen to the total critical density (the values have been multiplied by 1000). The neutral hydrogen fraction is followed in the simulation self consistently with the assumed average UV background and not rescaled a-posteriori using a different UV background. Note again that the neutral hydrogen content of the WW simulation is about a factor 5 higher than that of the SW and this is due to the fact that in the WW simulation the gas is colder and more concentrated in the potential wells of galaxies and thereby is significantly more neutral. Even in this case the SW20,512 and SW5,320 simulations embrace all the SW runs as for the star formation rate plot. The SWKR and SWAY agree well with the SW confirming that feedback and resolution/box-size effects have more impact on the simulations than effects due to the particular choice of the IMF as long as the stellar spectra are not self consistently taken into account. The difference between WW and SW simulations is somewhat more pronounced than that found by Nagamine et al. (2004) and this is probably due to the fact that our simulations include metal cooling, thereby increasing the neutral hydrogen amount in the haloes (we will come back to this point later). The MDW is in between SW and WW and again the SW10,448 is in good agreement with the SW, demonstrating that, at least for these quantities, numerical convergence has been reached.
At the end of Section 4.5 we compute the DLAs contribution to the total neutral hydrogen content () and we compare it with the results of Pontzen et al. (2008) and the observational estimates of Prochaska et al. (2005) and Péroux et al. (2005).
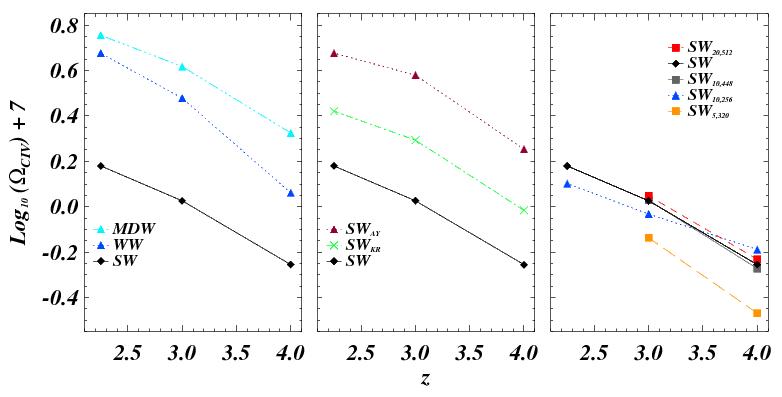
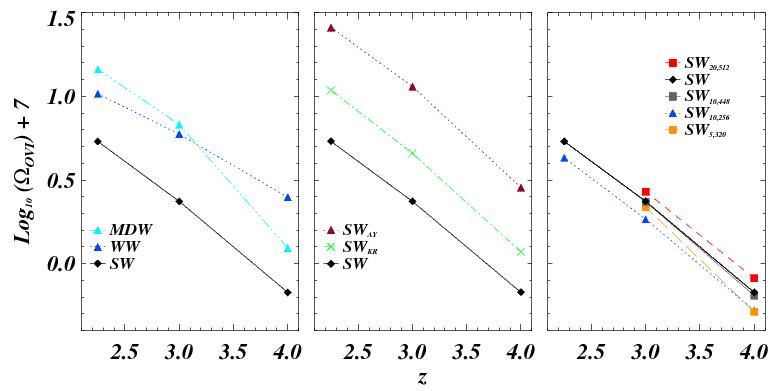
As a further check, in Figure 4 we plot the evolution of the contribution to the total density of two of the ions that trace the high redshift IGM at relatively low density and for which there are some observational constraints (Schaye et al., 2003; Aguirre et al., 2007): CIV ( 1548.204, 1550.781 Å) in the upper panels and OVI ( 1031.927, 1037.616 Å) in the lower panels. Although in the rest of the paper we will focus on the distribution of metals around DLA systems, we would like to address briefly the evolution of ionization species in the IGM as a whole. We use the redshift outputs at and we extract the values for and summing over all the gas particles. In order to obtain the ionization fraction for the two elements it is necessary to multiply the abundance of a given metal, carried by each particle, by its ionization fraction that depends on density and temperature. We use the CLOUDY code (Ferland et al., 1998) to compute a-posteriori the relevant fractions for each gas particles. We choose the HM05 option in CLOUDY, which consists of a UVB made by QSOs and galaxies with a 10% photon escape fraction and which is in agreement with other observational constraints (Bolton et al., 2005).
In Figure 4 we explicitly show how different effects impact on and : in the left panels we compare simulation with different wind strength and implementation (SW, WW and MDW); in the middle panels we test the effect of different IMF (SW, SWKR and SWAY); in the right panels we present resolution tests for all the SW runs (SW, SW5,320, SW10,256, SW10,448 and SW20,512). Here we discuss each panel of the figure:
-
•
Left Panels (feedback physics): for the SW simulations the total amount of the two ions increase by a factor of about 3 between and . The WW simulation contain times more OVI and CIV compared to the SW case. The reason is that with such weak winds the metals remain very close to the dense environments around galaxies and cannot reach the low-density IGM in contrast with the SW case (see for example Theuns et al., 2002). In these regions close to galaxies the ionization fractions are tipically larger than in the voids. The MDW CIV and OVI evolution is similar to the energy driven implementations although it has a higher normalization than SW and WW: this is due to the fact that in the former implementation the winds are more efficient in enriching the IGM around the mean density with metals and this produces larger values of and reached at .
-
•
Middle Panels (IMF): The trend in the redshift dependence of and is the same for SW, SWKR and SWAY, while there are differences in the normalization. The Kroupa and Arimoto-Yoshii IMFs result in values for the CIV and OVI density that are respectively 1.5 and 3 times higher than the standard Salpeter case. This is due to the fact that Salpeter IMF results in an excess of low mass stars, Kroupa IMF produces a smaller number of massive stars than the other two but twice as many stars in the range of mass , while with the Arimoto-Yoshii (or “top-heavy”) IMF there is a larger contribution from massive stars (see Figure 3 in Tornatore et al., 2007). For these reasons, the SWAY run produces more oxygen and carbon than the other simulations, while the SW run (with Salpeter IMF) is less efficient in producing these metal species and SWKR is in between the other two. Interestingly the MDW run with Salpeter IMF (triple-dot-dashed cyan lines in the left panels) produces more CIV than the SWAY, while the amount of OVI is comparable, confirming the high efficiency of momentum driven winds in enriching the IGM.
-
•
Right Panels (resolution tests): the aim of these two panels is to show that our analysis is robust against box-size and resolution effects. We plot and for all the SW runs and it is clearly evident the convergence of the results (especially for the and the SW10,448 simulation). As we already found for the SFR and the , the SW20,512 and SW5,320 simulations embrace all the SW runs.
A comparison of these findings with those by Oppenheimer &
Davé (2006, 2008)
shows that the evolution of is somewhat faster and
the normalization higher than what they find. In particular our MDW is
even more discrepant than SW and WW with respect to the analogous
momentum-driven winds simulation (“mzw”) by Oppenheimer &
Davé (2006).
However, it is difficult to compare properly given the different
resolutions, box-sizes, feedback implementations and details on
chemical evolution model used.
In the last part of this Section we briefly discuss the other simulations described in Table I. The simulations SW, SW10,448 and SW10,256 are characterised by the same box size but different number of particles, so that they allow us to carry out a test of stability of our results against numerical resolution. As already mentioned, for the SW10,448 the star formation rate trend at high redshift is similar to that of SW5,320 (the simulation with the highest resolution), while it agrees at lower redshift with SW, which has the same box size. Instead the SW10,256 has lower SFR (not plotted) than SW at high redshift because, for a given box-size, a lower number of particles means a lower number of structure resolved in the simulation and thereby a lower SFR. As for the evolution of , and , the SW10,448 follows the results of the SW almost perfectly. This is also true for other analysis made in this paper (phase diagrams, haloes properties, etc.), thus further confirming the numerical convergence of our results on these simulations properties. The run SWWDM has a different initial power spectrum respect all others simulations: power is suppressed at small scales due to free streaming of the dark matter particles that in this case are “warm” and have mass equal to 1.2 keV (corresponding to a suppression scale of around 50 comoving kpc). As a consequence, the star formation rate density at high redshift is significantly reduced with respect to the CDM case, with a correspondingly smaller number of haloes having mass comparable or smaller than the free-streaming mass scale. We run this simulation in order to test whether the modified could produce haloes that better fit the column density distribution function for small values of , that will be discussed in Section 4.5.
4 The neutral hydrogen distribution
In this Section we focus on the properties of the neutral hydrogen around the simulated galactic haloes. The aim is to study DLAs properties and statistics extracted from our simulations and to compare them with the latest observational data and the simulation results from other groups (Nagamine et al., 2004, 2007; Pontzen et al., 2008).
4.1 Identifying haloes
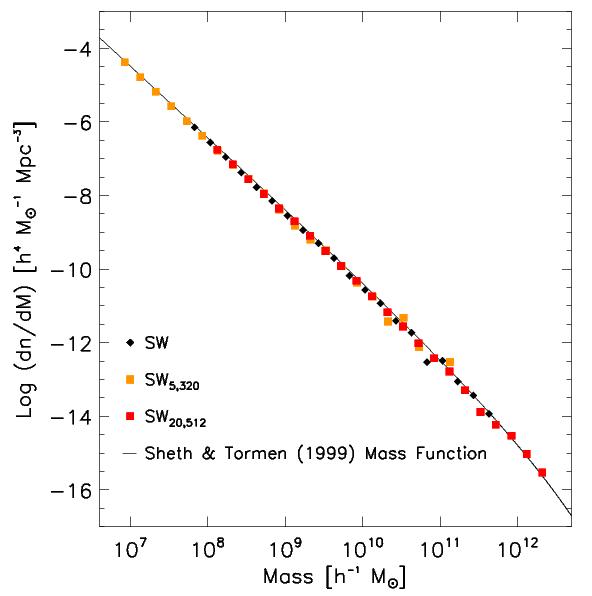
We identify haloes in the simulations by running a parallel Friends-of-Friends (FoF) algorithm with a linking length which is 0.2 times the dark matter mean interparticle spacing. The number of haloes of a given mass per unit mass and per unit volume as a function of their mass is shown in Figure 5 for the SW, SW5,320 and SW20,512 runs at redshift , along with the Sheth & Tormen (1999) mass function, so as to test at the same time the effect of resolution and of box size. Again, the SW20,512 and SW5,320 embrace the reference case SW: the mass function of SW5,320 extends to small halo masses due to its better resolution, while SW20,512 produce more massive haloes due to its larger box size. In our largest simulation we have three haloes above and about 1000 haloes of masses above at .
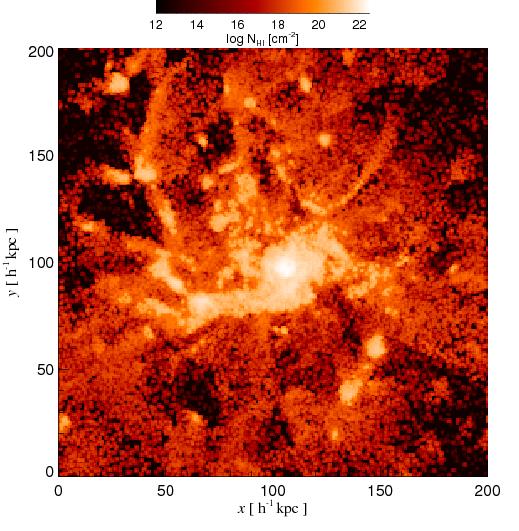
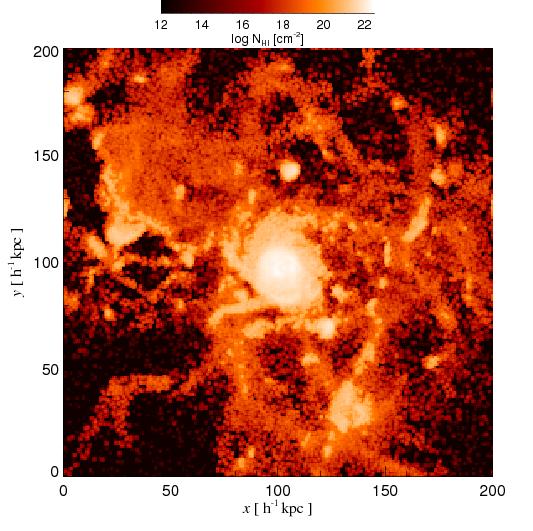
We follow the analysis made by Nagamine et al. (2004, 2007) to realize a mock DLA sample: after having identified the haloes and their center of mass, we interpolate with a TSC (Triangular Shaped Cloud) algorithm the comoving neutral hydrogen mass density around the center of mass of each halo on a cubic grid; then we ‘collapse’ the grid along a random direction and we obtain a set of neutral hydrogen column densities for each halo. Thus the column density reads:
| (5) |
with the proton mass and the linear dimension of the single grid cell. Here is the size of the box around the halo and is the number of grid points.
Tipically, for the most massive haloes, we use cubes of size 200 comoving kpc with grid points (kpc). In such a way, we increase the DLA total redshift path and we sample HI column densities along lines-of-sight per simulated box.
We have carried out some tests changing the number of grid points in order to study the effect of the sampling size on the neutral hydrogen distribution. The choice of the grid points number is crucial because too many points produce a sampling size below the resolution of the simulation and consequently an “oversampling” of the HI mass density with large statistical fluctuations, while too few points produce a smooth statistic which could not be representative of the real density field. At the end we found that the best compromise was to use grid points, corresponding to (which is also the typical value of the SPH smoothing length in the outskirts of the haloes), differently from Nagamine et al. (2004), who choose instead .
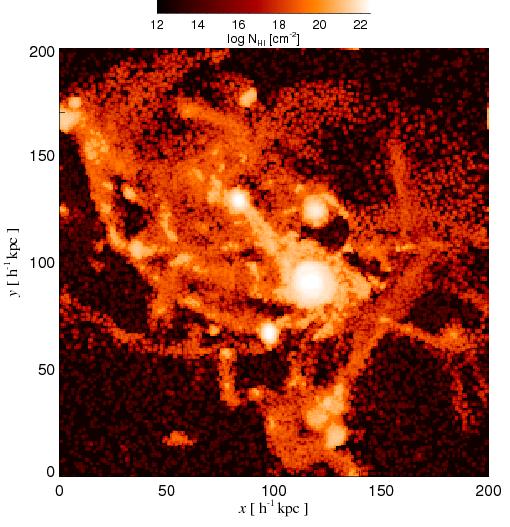
Figure 6 shows the HI column density maps extracted as explained above, but with a finer grid subdivision of 256 points, for the same massive halo in the WW (upper panel), SW (middle panel) and MDW (lower panel) runs at . The HI density at each pixel has been projected along the line-of-sight in the z direction. In the figure it is visible the effect of the winds: in the WW run (upper panel) high column density gas is more concentrated inside the central halo and inside some substructures. Also the column density values reached are higher than for the other runs. In the SW run (middle panel), the gas is more spread around the central haloes and the substructures. Finally if we consider HI column densities above the DLA limit of cm-2 we see that the central halo in the MDW run has the largest cross-section. We discuss further about this point in Section 4.3.
4.2 Properties of the haloes
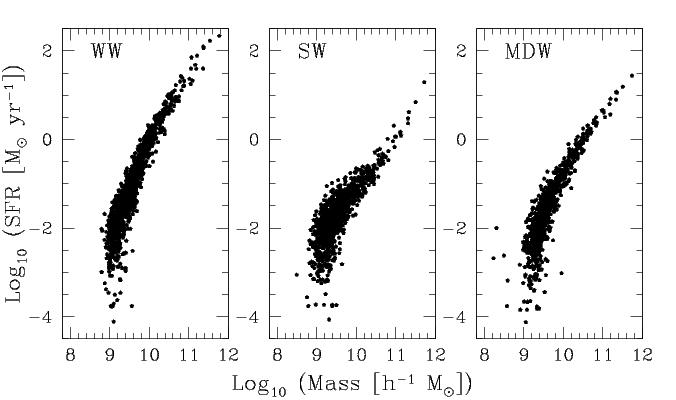
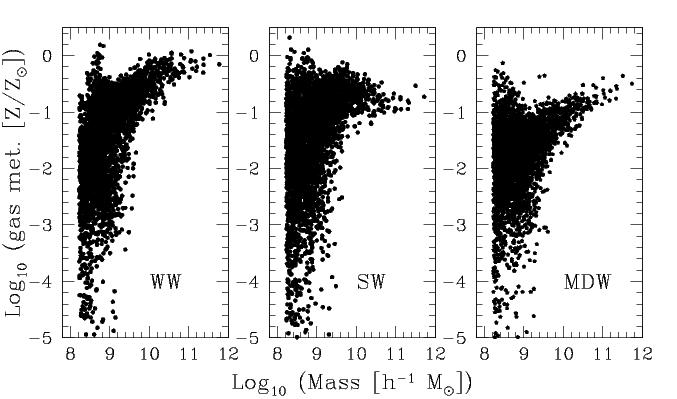
For the haloes identified with the FoF algorithm we compute mean quantities that could be relevant for the following analysis, such as the star formation rate inside each halo, the mass-weighted mean total metallicity and the mass-weighted mean neutral fraction of hydrogen (HI/H). We plot in Figures 7, 8 and 9 our findings at redshift , only for haloes having mass greater than , that are resolved with at least 100 dark matter particles. The properties of the haloes below , resolved with 1000 particles, should not be trusted at a quantitative level, but we prefer to show them in order to appreciate the increase in the scatter at low masses.
For the most massive haloes, the WW simulation shows very high star formation rates that are even a factor 100 larger than that of the corresponding haloes in the SW run: this is expected due to the smaller efficiency of the weak winds in suppressing star formation (see the left panel of Figure 3). The MDW run reaches nearly the same SFR values of the SW for the most massive haloes, while for intermediate mass haloes () the MDW haloes have higher SFR than SW ones. For the smallest haloes of around the SW run shows a slightly larger scatter in the SFR values. Overall, the bulk of the haloes, of masses between and , that are likely to host DLA systems, have star formation rates of about 0.1 /year. For haloes above the star formation rates are different between the models and usually around 1-30 /year. These star formation rates are in general agreement with those of the population of faint Lyman- emitters found recently by Rauch et al. (2008), in which a link between the Lyman- emitters and the DLAs is suggested.
For the same reasons metallicities of haloes in the WW run are higher than in the SW and MDW simulations (see Figure 8). Comparing this result with Figure 4, one can derive the following general picture: in the WW run metals remain locked inside the haloes (or stay close to the haloes), while in SW and MDW they are able to reach the IGM and enrich it: this is particularly true for the less massive haloes in the MDW. In fact, the MDW small mass haloes have in general metallicity lower than the corresponding SW and WW haloes. The wind implementation is thereby very effective in devoiding the galaxies of star forming cold gas that is enriched at a level of about 0.1 . The most important result of this panel is however that the different wind implementations show different mass-metallicity relations especially for haloes of masses above : while WW and MDW show a correlation (although with different amplitude), the SW results seem to produce very little correlation between mass and metallicity or possibly a weak anti-correlation. This different metallicity pattern in haloes could be important when compared with observation (e.g. Maiolino et al., 2008) and could possibly allow to discriminate between different feedback scenarios.
Finally we note that the largest metallicities appear to occur in haloes of small masses. There are two different motivations for this to happen. The first motivation is numerical: as we mentioned at the beginning of this Section, both these small haloes and the wind model are not well resolved, thereby their large metallicities are, at least partially, the result of some numerical artifact. Furthermore, we also checked that there is a physical motivation: these small haloes are strongly affected both by self enrichment at early epochs and by the metal enriched winds blowing from bigger haloes close to them. Addressing quantitatively these issues would require more numerical work, which is beyond the scope of this work.
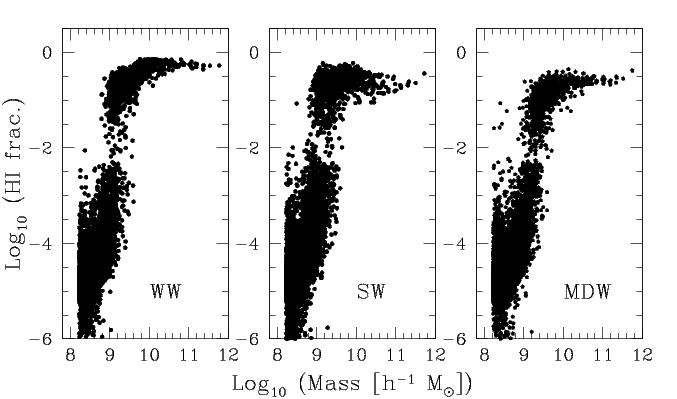
In Figure 9 we show the mass–weighted mean neutral fraction of hydrogen (HI/H) inside haloes, a quantity which is closely related to the DLA properties. The general trend reflects those of the right panel of Figure 3: for a given halo mass the WW simulation displays the highest value, while the SW and the MDW have comparable values. In all the panels, there are present two different sets of values: above and below HI/H 0.01. The first is associated to the most massive haloes and the second to the least massive ones. This is due to the fact that the most massive haloes contains many particles above the density threshold for which the neutral hydrogen fraction is equal to the fraction of mass in cold clouds (see Eqs. (1) and (2) in Section 2), boosting in this way the neutral hydrogen content of these haloes. Less massive haloes have instead neutral fractions that are set by the physical conditions of the gas and by the UVB background and are typically more ionized () than the most massive haloes.
| Redshift | Run | slope | |||
|---|---|---|---|---|---|
| SW | 0.57 | 3.83 | |||
| WW | 0.46 | 3.79 | |||
| MDW | 0.69 | 4.11 | |||
| SW | 0.77 | 3.75 | |||
| WW | 0.49 | 3.61 | |||
| MDW | 0.85 | 4.06 | |||
| SW | 0.62 | 2.99 | |||
| WW | 0.52 | 3.45 | |||
| MDW | 0.92 | 3.88 |
4.3 The DLA cross-section
For each halo of total mass we derive the DLA cross-sections, (in comoving units), by selecting and summing up the area of all the cells with a column density (determined as explained in Section 4.1) above cm-2. Next we fit a power-law relation of the form:
| (6) |
for all the simulations made. Results are shown in Figure 10 where we plot the cross-sections as extracted from the SW at with overplotted fits for SW itself (dashed black line), WW (blue dot-dashed line) and MDW (cyan triple-dot-dashed line). Fitting parameters and for each of these runs are show in Table II. The continuous red lines in the middle panel fit the upper and lower envelopes of the SW distribution at and were drawn with the aim of highlighting the scatter in the distribution of cross-sections expecially at low masses. The parameters of the upper envelope line are and (very similar to the WW case), while those of the lower envelope line are and . In the next section we discuss the effect of taking into account this scatter in a very conservative way.
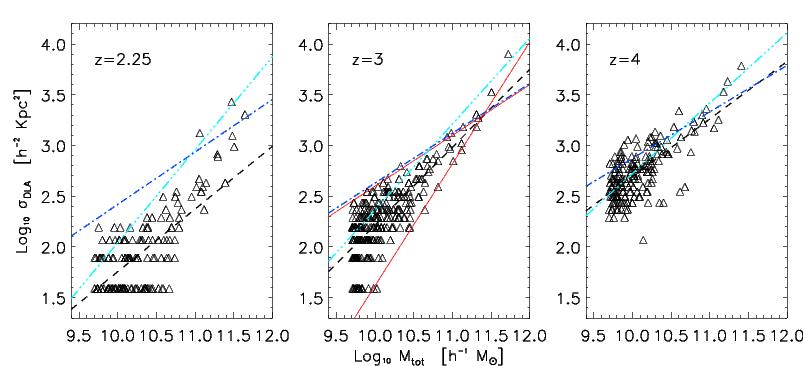
It is clear that for the WW simulation the cross-sections are larger than in the SW case for the small mass haloes: this is due to the fact that the wind is more effective in expelling cold gas from small mass haloes than from the most massive ones. For the most massive haloes the content of cold gas is much larger and this trend is inverted: the WW run has a smaller cross-section than in the SW and MDW cases because the cold gas is located very close to the dense galactic environments. The MDW trend reflects the fact that momentum-driven winds are more directly related to the halo properties: smaller mass haloes have greater loading factor and winds become very efficient as in SW case. On the contrary, for massive haloes the MD winds become less efficient: the cold blob of gas around the halo has a more regular shape than in the SW case and determines a larger cross-section than the SW. To sum up, as one can see from Figure 6, the qualitative trends are the following: for WW the gas is concentrated in the center of the haloes; the SW expels gas in a quite violent way and the shells of expanding material fragment; the MDW blows less gas but in a more homogeneous way than SW.
A comparison of the results from the SW run with those obtained by Nagamine et al. (2004, 2007) at similar resolution shows that we obtain on average a 20 per cent shallower slopes and 5% smaller parameters: this is likely to be due to the faster wind speed adopted for the strong wind case (600 km/s vs. 484 km/s) that will probably slightly reduce the normalization devoiding galaxies of cold gas. Furthermore, the fact that our simulations have the metal cooling implemented could result in a larger cross-section for smaller haloes because the quantity of cold gas increases, while for the most massive haloes the metal cooling enhances the amount of stars at the expenses of cold gas. These two effects determine a shallower slope for the cross-section fitting. In the WW case the run should be compared with the P3 run of Nagamine et al. (2004, 2007) even though the wind speed adopted in this study is 100 km/s vs. 242 km/s and the mass resolution is about 10 times better, but even in this case the trend is confirmed and we find a shallower slope, of about 40 per cent, and a smaller normalization value (by per cent).
In Figure 10 it is clearly visible, especially at redshift , a discretization in the cross-section values, more pronounced than in Nagamine et al. (2004, 2007). This is due to our final choice of the linear dimension of the single grid cell which is somewhat larger than that adopted by Nagamine et al. (2004).
4.4 The incidence rate of DLA systems
Having obtained the mean relation for the DLA cross-section as a function of halo mass from the previous Section, we are now able to calculate the cumulative number of DLAs per unit redshift (or rate of incidence) using the equation:
| (7) |
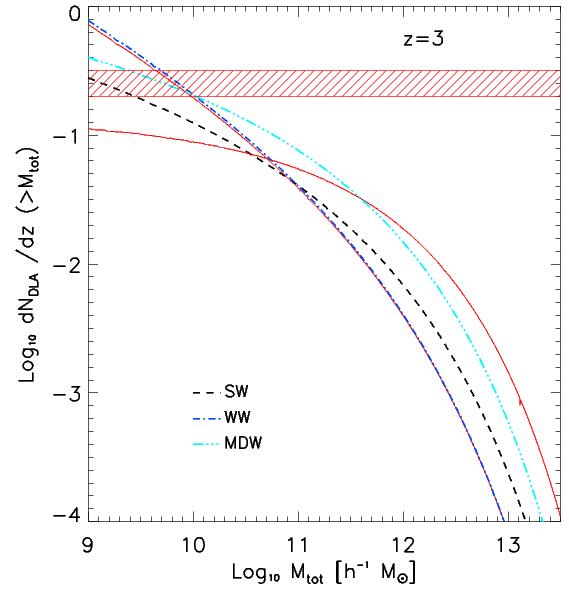
where is the Sheth & Tormen (1999) dark matter halo mass function and . Following Nagamine et al. (2004), we use this equation in order not to be sensitive to dark matter haloes with masses below the resolution limit of the simulation. This is a common problem when one tries to compute the number density of DLAs based on a cosmological simulation that does not resolve all small mass haloes that may host a DLA: the underlying assumption in the rest of the paper is that haloes below are not able to produce DLA systems. Moreover small box size simulations cannot produce very massive haloes. To overcome these limitations in Eq. (7) we convolved the Sheth & Tormen (1999) halo mass function with the measured relationship between DLA cross-section and halo mass, thereby correcting for incompleteness in the resolved halo abundance of our simulations. In doing this we extrapolate the power-law fit of Eq. (6) both at high and low masses. This relation presents an intrinsic scatter: looking at Figure 10 one can note that a given value corresponds to different halo masses, especially at low cross-sections. As mentioned in the previous section we check the impact of this scatter fitting the upper and lower envelopes of the cross-sections distribution of the SW run at .
In Figure 11 we show for SW, WW and MDW runs at . The three different runs have identical initial power spectrum and cosmological parameters so they all have the same theoretical dark matter halo mass function. Therefore the differences in Figure 11 reflects what we found in previuos Section about DLAs cross-sections (see in particular the central panel in Figure 10). In fact at low masses WW simulation produce haloes with cross-sections 3 times higher than SW and MDW, and correspondingly reaches higher values. At greater masses the trend is inverted and WW curve stays below the other two. As we expected curve for MDW simulation is always above the SW one and well above WW one in the high mass tail. The shaded region shows the observational estimate log()=0.10 at recovered by Nagamine et al. (2007) from the observational results based on SDSS QSO spectra of Prochaska et al. (2005). Finally, the continuous red lines show the results considering the scatter in the cross-section vs mass relation for the SW run. In one case (where the curve is almost equal to that of the WW case) one would need only haloes with mass greater than to fit the statistic, while in the other case one should go down to much less massive haloes, that are not well resolved by our simulations.
Our findings for the DLA abundance per unit redshift are slightly different than those obtained by Nagamine et al. (2007): moving to low masses their distribution tend to flatten, while ours are somewhat steeper and this is due both to the different values of the cross-section, the different dimension of the grid cells used, and the different cosmological parameters for the linear dark matter power spectrum (amplitude and slope). As a result, at low masses, the values in our simulations are about a factor greater than the corresponding ones of Nagamine et al. (2007), while at high mass the trend is inverted and our decreases somewhat more rapidly than Nagamine et al. results. To summarize, our results reproduce the observational data of Prochaska et al. (2005) slightly better than those of Nagamine et al. (2007) which slightly underpredict in the range of masses considered.
As far as the redshift evolution of DLA rate of incidence is concerned, the behaviour of the three different simulations reflects that of Figure 10. For the sake of brevity we do not show all the plots, but at the decreasing in at high masses is much more pronounced than at , due to a lack in massive haloes that have not already formed. At both WW and MDW curves stay always above the SW one and are more flattened than before down to low masses. The overall trend with redshift is the same of the left panel in Figure 6 of Nagamine et al. (2004).
4.5 The column density distribution function
In this Section we investigate the column density distribution function for DLAs usually plotted in the form of , where is the number of DLAs with HI column density in the range and absorption distances in the interval . The absorption distance is given by .
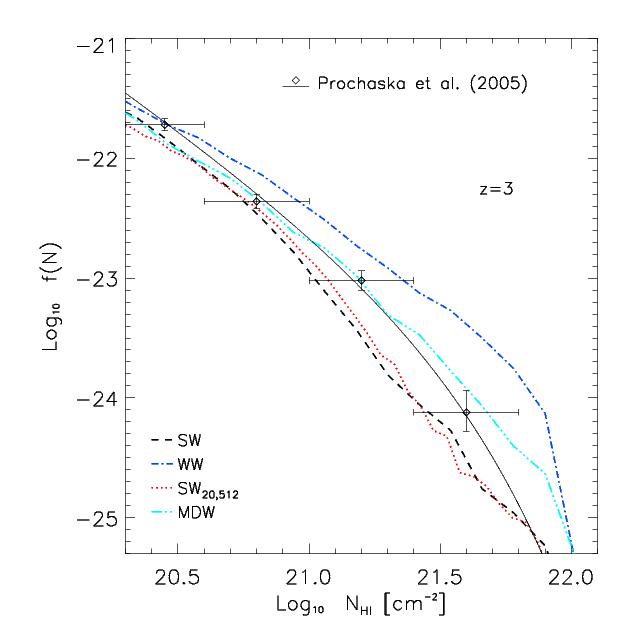
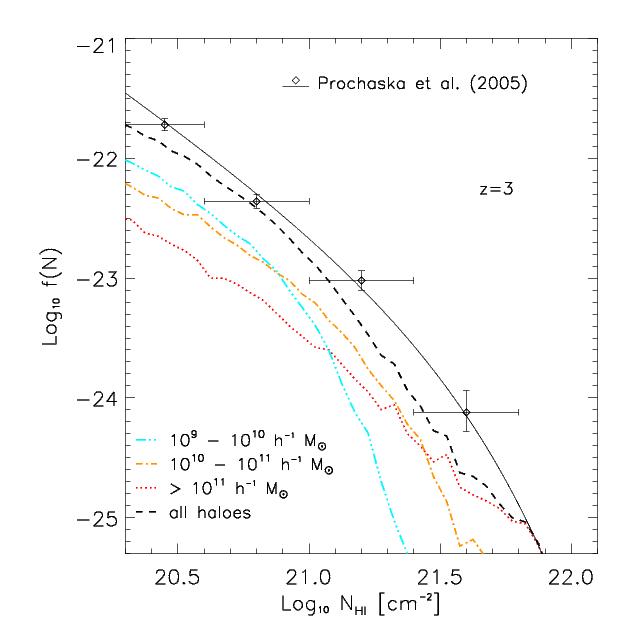
In the left panel of Figure 12 we show for the SW (dashed black line), WW (dot-dashed blue line), SW20,512 (dotted red line) and MDW (triple-dot-dashed cyan line) runs at . The data from SDSS are overplotted along with the -function fit (black diamonds and solid line) of Prochaska et al. (2005). SW20,512 is plotted to test the effect of different resolution and box size and its trend is similar to SW. Both are in quite good agreement with data especially at low and high column densities. Instead WW overpredicts the distribution function at large as was already found by Nagamine et al. (2004). Finally, MDW agrees extremely well with the data down to the smallest values. Comparing with the results of Nagamine et al. (2004, 2007) we find a better agreement with the observational data both for the SW and MDW, especially at low column density and at .
In the right panel Figure 12 we split the contribution of the different haloes to the total for the SW20,512 at . We use the SW20,512 run because the largest box size improves the statistics on the haloes. Looking at the figure one can easily see that haloes with masses above (dotted red line) contribute primarily to the large column densities, while the smallest haloes with masses in the range - (triple-dot-dashed cyan line) contribute significantly to the lower column densities, below cm-2. This is not surprising since on average more massive haloes have higher gas densities and corrispondingly produce larger HI column densities values.
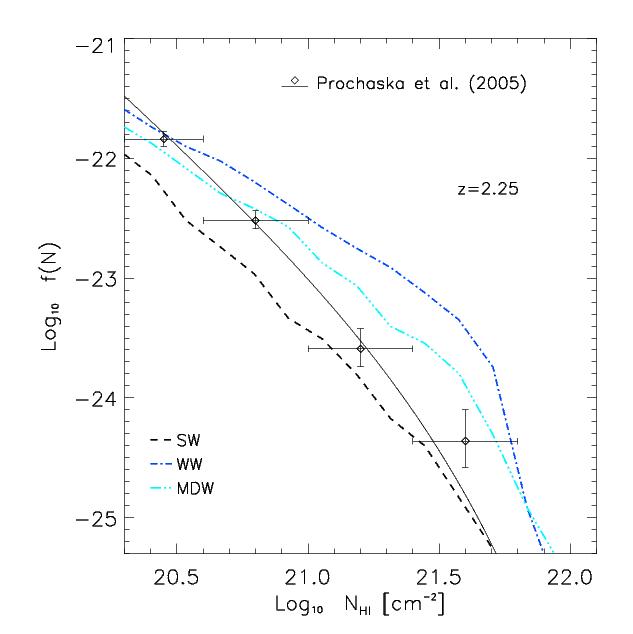
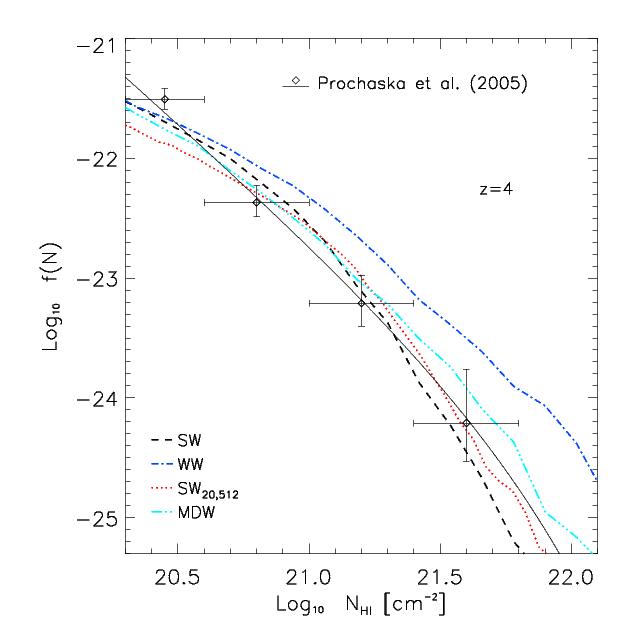
In Figure 13 we show the same as Figure 12 but at redshift (left panel) and (right panel), to check the redshift evolution of the column density distribution function. In the left panel, the results for SW20,512 are not shown because this simulation ended at . SW fits well the observational data for HI column densities larger than cm-2, but at lower column densities there is a discrepancy of about a factor 3. WW and MDW overproduce at high , but there is a better agreement with data at log, especially for the MDW run. At redshift (right panel) SW, SW20,512 and also MDW match very well the data while WW does not. The fact that MDW fits the data as well as SW at is due to the fact that high redshift momentum-driven winds behave quite similarly to energy-driven ones, while at lower redshift the two models tend to differ significantly in terms of velocities and loading factors. Thus, we conclude that the different wind implementations of the galactic wind feedback show distinct predictions for the redshift evolution, and in general the differences become larger when moving to . At the end the feedback model that reproduce better the data is the MDW model.
At the end of Section 3.2 we briefly discussed the SWWDM simulation. We run this simulation motivated by the poorer fit to observational data for the systems of column densities between cm-2 that was found in Nagamine et al. (2004, 2007) and Pontzen et al. (2008). Our reference runs (especially the SW) show a similar flattening trend and underproduce the number of these systems, by a smaller amount when compared to Nagamine et al. (2007). The idea is that using a different linear power sprectrum we could possibly modify the halo mass function and this could impact on the column density distribution function as well. We perform the same analysis of the other runs for SWWDM, but we find no statistical significant difference for the whole column density range. The smaller number of dark matter haloes, compared to CDM cosmology, is thus compensated by an increase in the cross-section, since in WDM the haloes are usually less concentrated. Thereby we decided not to consider this run anymore and we conclude that it appears unlikely that this statistic could be better fit by invoking modifications of the linear dark matter power spectrum such as warm dark matter.
Finally, we compute the total neutral gas mass in DLAs using:
| (8) |
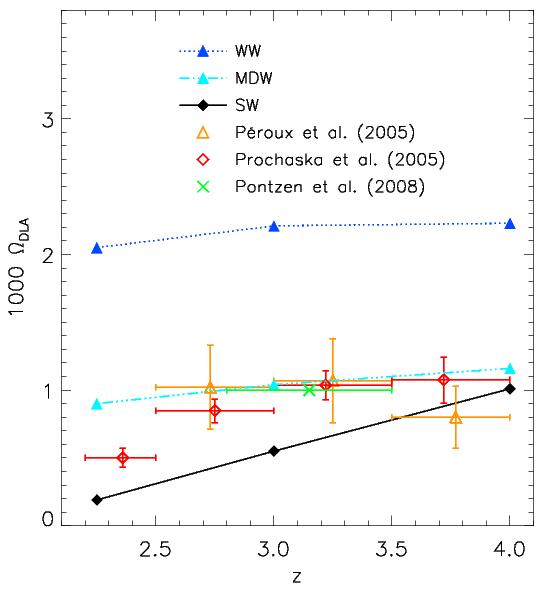
where is the proton mass, is the neutral hydrogen fraction of the gas and is the critical density at redshift . The integration limit goes from cm-2 (the lower column density limit for a system to be identified as DLA) to cm-2, this latter chosen to compare with the results of Pontzen et al. (2008).
In Figure 14 we show the evolution with redshift of for the SW (black solid line), WW (blue dotted line) and MDW (cyan triple-dot-dashed line) runs, along with the result of Pontzen et al. (2008) (green cross) and the observational estimate of Prochaska et al. (2005) (red diamonds) and Péroux et al. (2005) (orange triangles). The different simulations’ trends reflect those plotted in the right panel of Figure 3: the WW run produces the largest value while SW the smallest. The amount of neutral hydrogen in DLAs is about a factor two smaller than the total neutral hydrogen in the simulated volume. The MDW is in good agreement with the value found by Pontzen et al. (2008) ( in the redshift range ) and with the data by Péroux et al. (2005), while at redshift below it is slightly larger than the recent measurement made by Prochaska et al. (2005) using DLAs in SDSS spectra.
So far we did not comment much about self-shielding effects. A full treatment of the self-shielding would require radiative transfer and this again would be an approximate (usually a-posteriori) scheme. We decided to rely on the multiphase ISM model to implictly account for self-shielding motivated by the two following facts: many observational properties of DLAs have been reproduced in such a way (Katz et al., 1996; Nagamine et al., 2004, 2007); the recent results by Pontzen et al. (2008) seem to suggest that even when applying crude radiative transfer approximations the main properties of DLAs do not change significantly. However, to better check the impact of this criterion, we also apply a further approximation that is useful in order to decouple the star formation from the multiphase prescription and assume that the gas particles above densities of cm-3 are fully neutral (following Haehnelt et al., 1998). We recomputed the column density distribution function for a few simulations and found that the differences are not large. All the column density distribution function increase by a fixed overall amount of about 0.2 dex and are still in broad agreement with the observations. Since we believe that our multiphase ISM model is more refined and more physically motivated than this criterion we decided not to present results for this second simpler assumption.
5 Simulated QSO spectra
For each simulation performed we have extracted several physical quantities interpolated along lines-of-sight (LOSs) through the box, following the procedure of Theuns et al. (1998) (Appendix A4). The optical depths of the simulated QSO spectra are drawn in redshift space taking into account the effect of the IGM peculiar velocities along the line-of-sight, . As already mentioned in Section 2, our simulations follow self consistently the evolution of H, He, C, O, Mg, S, Si and Fe. Using the CLOUDY code (Ferland et al., 1998), we then determine the ionization fractions for some ions that trace the high redshift IGM: CIV ( 1548.204, 1550.781 Å), OVI ( 1031.927, 1037.616 Å) and SiII ( 1526.707 Å), with the possibility to extend the analysis to many others. The simulated flux of a given ion transition at the redshift-space coordinate (in km/s) is with:
| (9) |
where is the cross-section of the particular ion transition, is the Hubble constant at redshift , is the real-space coordinate (in km s-1), is the velocity dispersion in units of , is the Voigt profile.
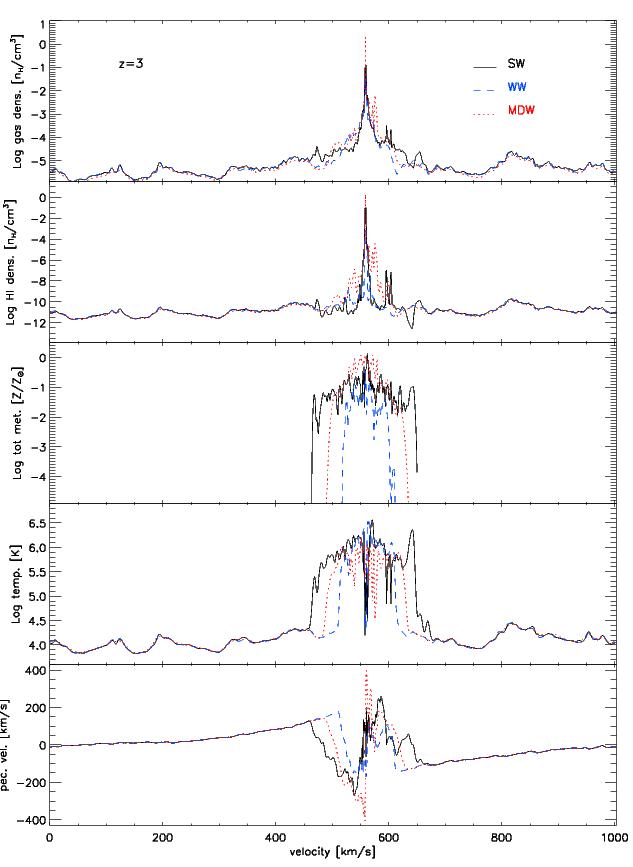
In Figure 15 we compare three LOSs along the center of mass (CM) of the second most massive halo in the SW, WW and MDW simulations, at redshift . We interpolate physical quantities along the LOS using the SPH kernel of each particle. The SW is represented by the continuous black line, the WW is represented by the dashed blue line and the MDW by the dotted red line. From top to bottom we show the gas density, neutral hydrogen density, total metallicity, temperature and peculiar velocity. The axis is in km/s and represents at a given redshift the size of the box in real space. Looking at the first two top panels it is visible a peak both in the gas and in the neutral hydrogen densities: this corresponds to the CM of the halo. All simulations have more or less the same structure for the peak in density but in the MDW case (red dotted line) it is a bit more extended than the other two. The metallicity panel clearly shows the effect of the different winds implementations and velocities. The SW run produces a distribution of metallicity more extended than MDW and WW while the WW distribution is narrower than the MDW one. This confirms the fact that for massive haloes MDW is less efficient than SW in extracting metals and distributing them in the surrounding IGM (because of the high velocity dispersion of massive haloes that results in a small loading factor for the wind particles even if the corresponding wind velocities are high). The temperature panel presents the same trends as the metallicity panel: the high temperature peak is larger for SW with respect to MDW and WW, demonstrating that the hot SW gas can be spread out to large distances. Quite interesting in this panel is the drop in temperature at the center of the halo where the gas density is high and the cooling efficient. The bottom panel shows the peculiar velocity field. One can clearly see the effect of the expanding wind: a strong discontinuity in the peculiar velocity produced by the shock, with a negative peak (shell coming toward the observer) and a positive one (shell expanding along the LOS in the opposite direction). Again the SW have the larger distribution and WW the narrower. MDW have larger peaks (in absolute values) than SW but not as extended, that are produced by a fast, but less mass-loaded, wind. We note that the peculiar velocity fields account for the observed wind velocities in local starburst galaxies and that these velocities do depend on the wind model.
5.1 Velocity width distribution
In this Section compare observational data and simulation predictions on the observed velocity width distribution for low-ionization species. We use the quantity defined as the extent in velocity (redshift space) that embraces 90% of the total integrated optical depth as in Prochaska & Wolfe (1997). The procedure to recover this statistics is the following: for every simulation we take one thousands spectra extracted along the CMs of the most massive haloes in the box. Then for every spectrum we compute the absorption profile of the ion considered (SiII, 1526.707 Å) and finally from this we determine the values of associated with that particular LOS (i.e with that particular DLA). To deal with the fact that SiII occurs in self-shielded regions we use the ISM multiphase model in the same way as we did for the HI. Following Eqs. (1) and (2), we assign to each particle in the LOS a mass in SiII:
| (10) | |||||
| (11) |
where is the mass in Si of the particle (determined self consistently inside the code), is the SiII fraction as determined by CLOUDY on the base of the temperature and the density of the particle, and are, respectively, the fraction of mass in cold clouds and the star formation threshold (see Section 2).
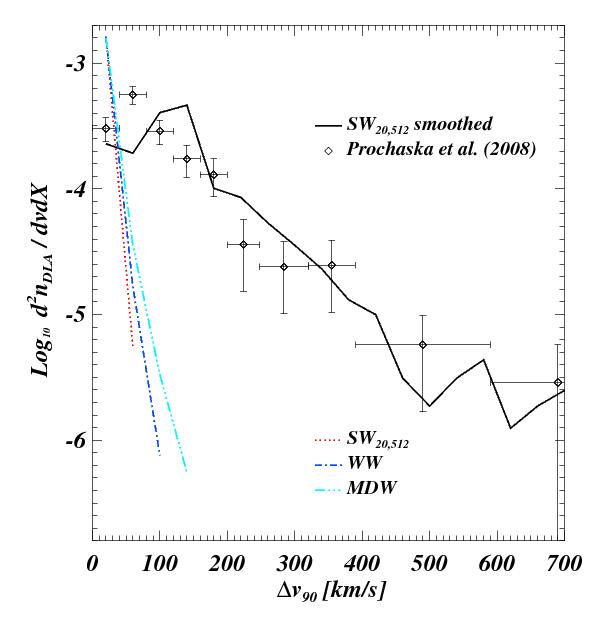
It is well known that the observed distribution of velocity widths has a median too large to be accomodated within standard cold dark matter cosmology (Prochaska et al., 2008; Pontzen et al., 2008). In the left panel of Figure 16 we show the DLA velocity width distributions at redshift for our reference runs SW20,512 (dotted red line), WW (dot-dashed blue line), MDW (triple-dot-dashed cyan line) along with observational data of Prochaska et al. (2008). The latter consist of a set of 113 measurements of metallicity, redshift and taken with HIRES, ESI and UVES/VLT spectrographs for DLAs in the redshift range . We consider this sample as a whole since it does not show any redshift evolution (Pontzen et al., 2008) and we compare with our outputs.
It is clear that our reference runs dramatically fail to reproduce observational data even to a larger extent than found byPontzen et al. (2008). In fact SW20,512, WW and MDW overpredicts the number of small velocity systems and at the same time they are not able to produce systems with velocity width greater than 100 km/s. As we expect, MDW does a better job than the other two runs, since it is more efficient in expelling metals, but it is yet far away from fitting data. Checking one by one a large number of extracted spectra we find that for a given LOS there is a significant number of small regions in the optical depth, all of them with sizes that are too small in redshift space. Basically our simulations, regardless to the particular wind implementation, spread around the haloes small clumps of enriched materials, that are in a wind phase, and are not able to enrich uniformly the surrounding IGM. This of course also results in the overproduction of small velocity systems seen in the left panel of Figure 16.
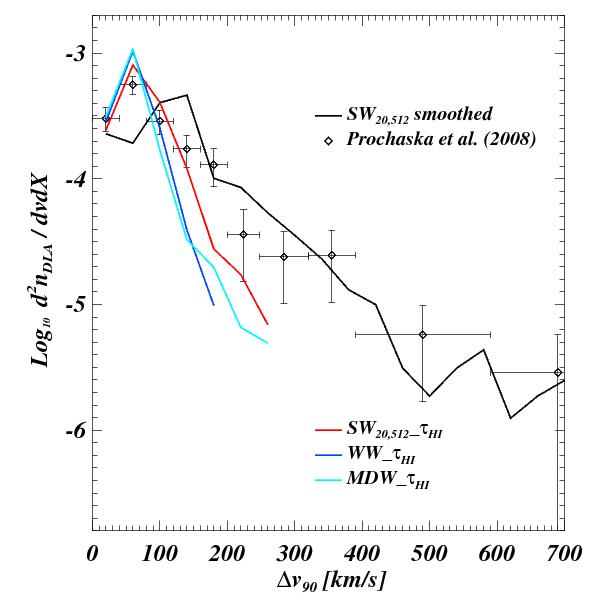
We checked that even using a simulation with higher resolution like SW10,448, which in principle should start enriching the IGM earlier, we are not able to reproduce observational data. To overcome the problem we follow two other post-processing criteria with the goal of finding out some guidelines to improve our future simulations: SW shown in both the panels of Figure 16 as the black solid line and the “” series plotted in the right panel of Figure 16.
For the series we take the original SW20,512, WW and MDW runs and then we follow Pontzen et al. (2008) assuming that SiII is perfectly coupled to HI so that for solar metallicity and . In this way SiII is spread more efficiently around and inside the haloes. Moreover here we sum, for a given LOS, all the different contribution due to the small metal clumps trying to mimic a more uniform enrichment. The results are shown in the right panel of Figure 16: SW is the solid red line, WW the solid blue line and MDW the solid cyan line. SW works better than the other two mostly because it has a greater number of bigger haloes where the is correspondingly higher (see below), but as one can see this post-processing procedure is not yet enough to match the observations. We find a trend similar to what Pontzen et al. (2008) showed in their Figure 9: all the different series reproduce the small velocity tail of the distribution but fail to produce systems with velocity width larger than 300 km/s.
Instead, for SW we extract simulated spectra after having increased the smoothing length associated to each particle along the LOS and having recomputed the metallicity. Basically we set the new smoothing length to 500 comoving kpc and the result is the SW curve (black solid). With this prescription we can fit very well observational data both at high and small velocities. Of course spreading the metals a-posteriori over a scale of hundred kpc is not self consistent but in this way we just want to see which phenomenological prescription can be used in order to fit the data.
Either a pre-enrichment of the IGM at higher redshift that could pollute the gas particles in a more uniform way (e.g. Tornatore et al., 2007) or some missing physical ingredient such as small scale turbulence that could be effective in mixing metals in a more efficient way at galactic scales (e.g. Scannapieco & Brüggen, 2008; Iapichino et al., 2008), could help in reproducing the observed values. From this point of view a smoothing scale of 500 kpc roughly corresponds to a velocity (in redshift space) of 50 km/s, values that are consistent with those presented in Scannapieco & Brüggen (2008).
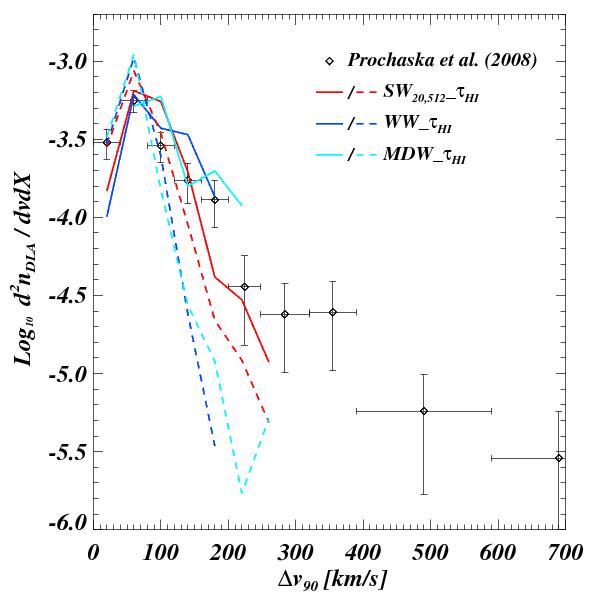
Finally, in Figure 17 we test the contribution to the DLAs velocity width distribution from haloes of different mass at . We use the three models that fit best the statistic, the series: SW (solid + dashed red lines), WW (solid + dashed blue lines), MDW (solid + dashed cyan lines). For the different runs, dashed lines refers to haloes with mass lower than and solid lines refers to haloes with mass larger than . As we expect, massive haloes produce much more systems with great velocity widths, while the less massive haloes produce more smaller velocity systems.
5.2 Correlation between Metallicity and Velocity Widths
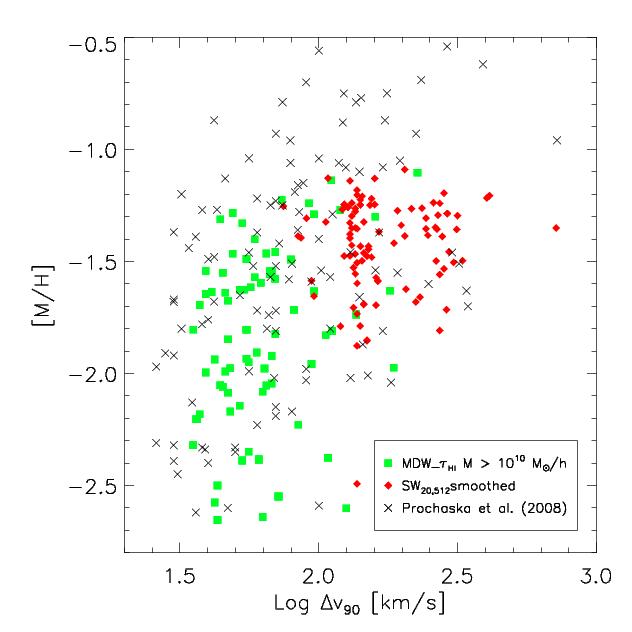
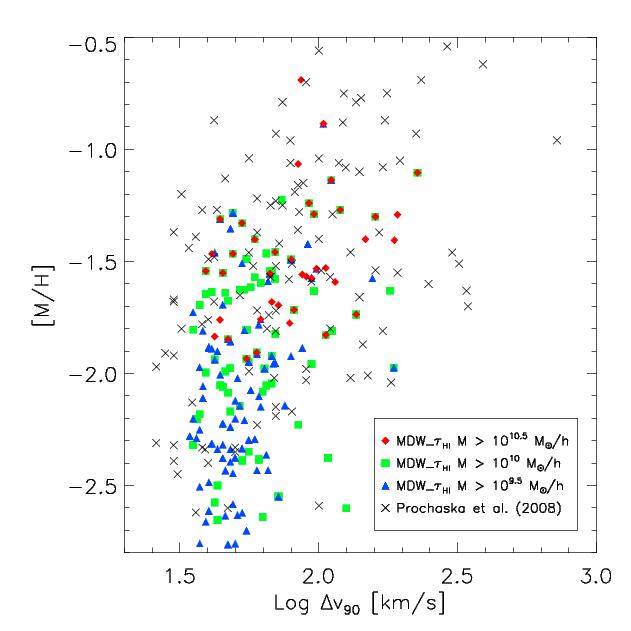
Observational data by Ledoux et al. (2006) and Prochaska et al. (2008) confirmed in the last years the existence of a positive correlation between low-ion velocity width and the metallicity of DLAs along a given sightline. We showed that our reference runs fail to reproduce the DLAs velocity width distribution so we use the two post-processing criteria presented in the previous Section (MDW and SW) to test metallicity-velocity widths correlation. In our simulations we compute the metallicities of DLAs by taking the average metallicity value for the given LOS in a region of 100 km/s in redshift space, centered at the location of the CM of each halo hosting a DLA.
In the left panel of Figure 18 we plot metallicities vs. velocity widths for 100 haloes randomly selected in a subsample of haloes with mass in the MDW (green solid squares) and SW (red solid diamonds), along with observational data by Prochaska et al. (2008) (black crosses). Green squares (MDW) show a weak correlation while correlation is negligible for the red diamond (SW). SW have in average both metallicities and velocity widths higher than MDW and this is not surprising due to the procedure of smoothing metallicity over a large scale. For this plot we use only haloes with masses above because we noted that for the most massive haloes the correlation is stronger. In the right panel of Figure 18 we clarify this point using the MDW run. Red diamonds refers to all the haloes with mass , green squares are the same green points of the left panel (a subsample of haloes with mass ), while blue triangles derive from a subsample of haloes with mass . It is evident that the correlation in this case is somewhat weaker. Instead, using a subsample of haloes at larger masses, we increase the value of , since faster winds are produced by more massive haloes, that usually are more metal rich at least when compared with smaller mass haloes. Thereby, if we restrict ourselves to haloes above the agreement is reasonably good, even though smaller mass haloes, as we saw in the previous sections, contribute to all of the other DLA statistical properties. We also note that in general the mean metallicities recovered from our simulations are somewhat smaller than the observed ones.
6 Discussion and Conclusions
In this paper we investigated the properties of DLAs in high-resolution hydrodynamical cosmological simulations. In particular, we focussed on the role of feedback in the form of galactic winds to quantify their impact on the neutral hydrogen and metal ion species content both on the global IGM and on the IGM around putative DLA sites. The analysis was made by comparing with the recent works of Nagamine et al. (2007) and Pontzen et al. (2008), but with important differences with respect to these previous analyses: higher resolution simulations (by a factor in mass) than Nagamine et al. (2004, 2007); statistics performed in a cosmological setting, like in Nagamine et al. (2004, 2007), but differently from Pontzen et al. (2008), who relied mainly on simulations of single objects; inclusion of metal cooling and an accurate chemo-dynamical code that follows self consistently the IGM enrichment (Tornatore et al., 2007); inclusion of different wind prescriptions (energy driven and momentum driven); modification of the stellar IMFs and the linear dark matter power spectrum in the initial conditions to explore the parameter space further.
The conclusions that we draw from our analysis can be summarized as follows.
-
-
The different feedback prescriptions that we explored (WW, weak energy-driven winds of 100 km/s; SW, strong energy-driven winds of 600 km/s; MDW, momentum driven winds) give distinct predictions for the gas distribution in metallicity-temperature and density. SW are effective in heating the gas particles at temperatures of K to a larger extent than MDW and WW. Also the metallicity-density distribution is different: WW and MDW show correlations in high-density regions (denser regions being more metal rich), while SW is more efficient in polluting the low-density IGM (Figures 1 and 2).
-
-
WW, SW and MDW have also an impact on global quantities of the simulations such as the cosmic star formation rates and the neutral hydrogen content. As for the latter, MDW and SW show agreement with data while in the WW the HI is clearly overproduced since the feedback is not as efficient. Also, the star formation rate for the WW run is higher than for the SW one (see Figures 3 and 14).
-
-
The evolution with redshift of CIV and OVI (two of the most common ion species observed in QSO absorption spectra) is similar in shape between the different runs but the normalization differ by up to a factor 3 (see Figure 4).
-
-
Focussing on the properties of the haloes that could host DLAs we find that haloes between at have similar SFR for the different wind models of about /yr, with large scatter, while more massive haloes have larger SFRs and the trend with mass depends on the specific wind model (Figure 7). The metallicities of the haloes as a function of mass is correlated for haloes of masses in the WW and MDW runs, while no correlation or possibly a weak anti-correlation is seen for the SW model. For less massive haloes below the scatter in metallicity is huge and span several orders of magnitude (Figure 8).
-
-
The cross-sections inferred from the different runs are in overall agreement with the results of Nagamine et al. (2004, 2007), although the values for shape and normalization are somewhat smaller for similar runs. This is likely to be due to the different prescriptions of the wind implementation and the metal cooling. The DLA incidence rate is in good agreement with the observed one by Prochaska et al. (2005) from SDSS data for MDW and SW, while is larger for WW. The incidence rate results clearly show that all the haloes whose masses are above contribute to the cross-section (Figures 10 and 11).
-
-
The column density distribution function at is in rough agreement with the data points for all the models (for MDW the agreement is better), while at lower redshifts there are larger differences and SW (WW) underpredicts (overpredicts) the number of DLAs. The WW run shows the largest discrepancies especially for the high column density DLAs, a feature that was already found by Nagamine et al. (2004). The contribution of haloes of masses between is particularly relevant for DLAs below cm-2, another hint that less massive haloes contribute to reproduce DLAs statistical properties (Figures 12 and 13).
-
-
Qualitatively, physical quantities interpolated along LOS that pierce the haloes show different behaviours (particularly in temperature and metallicity) in different models. Also the peculiar velocity fields look different (Figure 15) and the gas velocity gradient is in agreement with the observed wind velocities.
-
-
The distribution of velocity widhts of low ioniziation species (in our case SiII) reproduces the observed one (Prochaska et al., 2008) only for velocity widths below 100 km/s, while larger values are dramatically under-reproduced by our simulations. A slightly better agreement is obtained when SiII is supposed to faithfully trace the HI distribution (as done by Pontzen et al., 2008), but even in this case the observed distribution is underestimated. We can fit the observed velocity widths well only if we empirically smooth the metallicity of each gas particle over a region of 500 comoving kpc (Figure 16). We also find a trend of with the halo mass that goes in the expected direction: more massive haloes produce the larger values for (Figure 17).
-
-
The metallicity-velocity width correlations is broadly reproduced by the two models discussed above, even if the metallicity values are somewhat lower than the observed ones. If we split the contribution to the correlation by taking into account different ranges of masses, we find that there is good agreement if we restrict ourselves to the most massive haloes with (Figure 18). This is in agreement with Barnes & Haehnelt (2008), but in disagreement with other statistical properties of DLAs, that in order to be reproduced need less massive haloes as well.
Overall, we succeeded in reproducing most of the observed properties of DLAs in particular the column density distribution function and the incidence rate. It appears that the best agreement is given either by the SW or the MDW implementation, while the WW does not seem to fit the data. For the metal distributions, as traced by the velocity widths, the agreement is not good. This could be the hint that there are some pieces of physics missing in our treatment. Possible ingredients that are not considered here and that could help in easing the discrepancy are: radiative transfer effects in DLAs that have been either neglected so far (e.g. Nagamine et al., 2004) or approximately modelled (e.g. Pontzen et al., 2008): even if their impact seems to be not dramatic at least using our effective model description of the ISM, since the cold clouds are assumed to be fully self-shielded and the ambient medium to be optically thin, they could be important for large column density systems, especially when affecting the molecular hydrogen in star forming regions (Gnedin et al., 2008); small-scale turbulence and its impact on the metal diffusion at large scales, which has been recently investigated by Scannapieco & Brüggen (2008) and that can be effective in smoothing the metal distribution around DLAs; a pre-enrichment of the IGM, possibly produced by PopIII stars, at higher redshift than those considered here that could result in a smoother metallicity for the particles that are in a wind phase (e.g. Tornatore et al., 2007). We stress that all these effects are not considered in our simulations and their accurate description could be important to match the remaining still unexplained DLA properties.
Acknowledgments
The authors thank F. Biondi, A. Saro, E. Spitoni, A. Bignamini and G. Vladilo for many helpful discussions and acknowledge the anonymous referee for the helpful report. Numerical computations were done on the COSMOS (SGI Altix 3700) supercomputer at DAMTP and at High Performance Computer Cluster (HPCF) in Cambridge (UK) and at CINECA (Italy). COSMOS is a UK-CCC facility which is supported by HEFCE, PPARC and Silicon Graphics/Cray Research. The CINECA (“Centro Interuniversitario del Nord Est per il Calcolo Elettronico”) CPU time has been assigned thanks to an INAF-CINECA grant. This work has been partially supported by the INFN-PD51 grant, an ASI-AAE Theory grant and a PRIN-MIUR.
References
- Adelberger et al. (2005) Adelberger K. L., Shapley A. E., Steidel C. C., Pettini M., Erb D. K., Reddy N. A., 2005, ApJ, 629, 636
- Aguirre et al. (2007) Aguirre A., Dow-Hygelund C., Schaye J., Theuns T., 2007, ArXiv e-prints
- Arimoto & Yoshii (1987) Arimoto N., Yoshii Y., 1987, A&A, 173, 23
- Asplund et al. (2005) Asplund M., Grevesse N., Sauval A. J., 2005, in Barnes III T. G., Bash F. N., eds, Cosmic Abundances as Records of Stellar Evolution and Nucleosynthesis Vol. 336 of Astronomical Society of the Pacific Conference Series, The Solar Chemical Composition. pp 25–+
- Barnes & Haehnelt (2008) Barnes L. A., Haehnelt M. G., 2008, ArXiv e-prints
- Becker et al. (2008) Becker G. D., Rauch M., Sargent W. L. W., 2008, ArXiv e-prints
- Bolton & Haehnelt (2007) Bolton J. S., Haehnelt M. G., 2007, MNRAS, 374, 493
- Bolton et al. (2005) Bolton J. S., Haehnelt M. G., Viel M., Springel V., 2005, MNRAS, 357, 1178
- Bolton et al. (2008) Bolton J. S., Viel M., Kim T.-S., Haehnelt M. G., Carswell R. F., 2008, MNRAS, 386, 1131
- Borgani et al. (2008) Borgani S., Fabjan D., Tornatore L., Schindler S., Dolag K., Diaferio A., 2008, Space Science Reviews, 134, 379
- Calura et al. (2003) Calura F., Matteucci F., Vladilo G., 2003, MNRAS, 340, 59
- Chen & Lanzetta (2003) Chen H.-W., Lanzetta K. M., 2003, ApJ, 597, 706
- Christensen et al. (2007) Christensen L., Wisotzki L., Roth M. M., Sánchez S. F., Kelz A., Jahnke K., 2007, A&A, 468, 587
- Evrard et al. (2008) Evrard A. E., Bialek J., Busha M., White M., Habib S., Heitmann K., Warren M., Rasia E., Tormen G., Moscardini L., Power C., Jenkins A. R., Gao L., Frenk C. S., Springel V., White S. D. M., Diemand J., 2008, ApJ, 672, 122
- Fabjan et al. (2008) Fabjan D., Tornatore L., Borgani S., Saro A., Dolag K., 2008, MNRAS, 386, 1265
- Faucher-Giguère et al. (2008) Faucher-Giguère C.-A., Lidz A., Hernquist L., Zaldarriaga M., 2008, ApJ, 688, 85
- Ferland et al. (1998) Ferland G. J., Korista K. T., Verner D. A., Ferguson J. W., Kingdon J. B., Verner E. M., 1998, PASP, 110, 761
- Fynbo et al. (1999) Fynbo J. U., Møller P., Warren S. J., 1999, MNRAS, 305, 849
- Gardner et al. (2001) Gardner J. P., Katz N., Hernquist L., Weinberg D. H., 2001, ApJ, 559, 131
- Gardner et al. (1997) Gardner J. P., Katz N., Weinberg D. H., Hernquist L., 1997, ApJ, 486, 42
- Gnedin et al. (2008) Gnedin N. Y., Tassis K., Kravtsov A. V., 2008, ArXiv e-prints
- Haardt & Madau (1996) Haardt F., Madau P., 1996, ApJ, 461, 20
- Haehnelt et al. (1998) Haehnelt M. G., Steinmetz M., Rauch M., 1998, ApJ, 495, 647
- Iapichino et al. (2008) Iapichino L., Adamek J., Schmidt W., Niemeyer J. C., 2008, MNRAS, 388, 1079
- Katz et al. (1996) Katz N., Weinberg D. H., Hernquist L., 1996, ApJS, 105, 19
- Katz et al. (1996) Katz N., Weinberg D. H., Hernquist L., Miralda-Escude J., 1996, ApJ, 457, L57+
- Komatsu et al. (2008) Komatsu E., Dunkley J., Nolta M. R., Bennett C. L., Gold B., Hinshaw G., Jarosik N., Larson D., Limon M., Page L., Spergel D. N., Halpern M., Hill R. S., Kogut A., Meyer S. S., Tucker G. S., Weiland J. L., Wollack E., Wright E. L., 2008, ArXiv e-prints, 803
- Kroupa (2001) Kroupa P., 2001, MNRAS, 322, 231
- Ledoux et al. (2006) Ledoux C., Petitjean P., Fynbo J. P. U., Møller P., Srianand R., 2006, A&A, 457, 71
- Lesgourgues et al. (2007) Lesgourgues J., Viel M., Haehnelt M. G., Massey R., 2007, Journal of Cosmology and Astro-Particle Physics, 11, 8
- Maiolino et al. (2008) Maiolino R., Nagao T., Grazian A., Cocchia F., Marconi A., Mannucci F., Cimatti A., Pipino A., Ballero S., Calura F., Chiappini et al., 2008, A&A, 488, 463
- Maller et al. (2001) Maller A. H., Prochaska J. X., Somerville R. S., Primack J. R., 2001, MNRAS, 326, 1475
- Martin (2005) Martin C. L., 2005, ApJ, 621, 227
- Matteucci et al. (1997) Matteucci F., Molaro P., Vladilo G., 1997, A&A, 321, 45
- Murray et al. (2005) Murray N., Quataert E., Thompson T. A., 2005, ApJ, 618, 569
- Nagamine et al. (2004) Nagamine K., Springel V., Hernquist L., 2004, MNRAS, 348, 435
- Nagamine et al. (2007) Nagamine K., Wolfe A. M., Hernquist L., Springel V., 2007, ApJ, 660, 945
- Okoshi & Nagashima (2005) Okoshi K., Nagashima M., 2005, ApJ, 623, 99
- Oppenheimer & Davé (2006) Oppenheimer B. D., Davé R., 2006, MNRAS, 373, 1265
- Oppenheimer & Davé (2008) Oppenheimer B. D., Davé R., 2008, MNRAS, 387, 577
- Padovani & Matteucci (1993) Padovani P., Matteucci F., 1993, ApJ, 416, 26
- Péroux et al. (2005) Péroux C., Dessauges-Zavadsky M., D’Odorico S., Sun Kim T., McMahon R. G., 2005, MNRAS, 363, 479
- Péroux et al. (2003) Péroux C., McMahon R. G., Storrie-Lombardi L. J., Irwin M. J., 2003, MNRAS, 346, 1103
- Pierleoni et al. (2008) Pierleoni M., Branchini E., Viel M., 2008, ArXiv e-prints, 805
- Pontzen et al. (2008) Pontzen A., Governato F., Pettini M., Booth C. M., Stinson G., Wadsley J., Brooks A., Quinn T., Haehnelt M., 2008, MNRAS, 390, 1349
- Prochaska et al. (2008) Prochaska J. X., Chen H.-W., Wolfe A. M., Dessauges-Zavadsky M., Bloom J. S., 2008, ApJ, 672, 59
- Prochaska et al. (2005) Prochaska J. X., Herbert-Fort S., Wolfe A. M., 2005, ApJ, 635, 123
- Prochaska & Wolfe (1997) Prochaska J. X., Wolfe A. M., 1997, ApJ, 487, 73
- Prochaska & Wolfe (2008) Prochaska J. X., Wolfe A. M., 2008, ArXiv e-prints
- Prochaska et al. (2001) Prochaska J. X., Wolfe A. M., Tytler D., Burles S., Cooke J., Gawiser E., Kirkman D., O’Meara J. M., Storrie-Lombardi L., 2001, ApJS, 137, 21
- Rao & Turnshek (2000) Rao S. M., Turnshek D. A., 2000, ApJS, 130, 1
- Rauch et al. (2005) Rauch M., Becker G. D., Viel M., Sargent W. L. W., Smette A., Simcoe R. A., Barlow T. A., Haehnelt M. G., 2005, ApJ, 632, 58
- Rauch et al. (2008) Rauch M., Haehnelt M., Bunker A., Becker G., Marleau F., Graham J., Cristiani S., Jarvis M., Lacey C., Morris S., Peroux C., Röttgering H., Theuns T., 2008, ApJ, 681, 856
- Ricotti et al. (2000) Ricotti M., Gnedin N. Y., Shull J. M., 2000, ApJ, 534, 41
- Rupke et al. (2005) Rupke D. S., Veilleux S., Sanders D. B., 2005, ApJS, 160, 115
- Ryan-Weber et al. (2009) Ryan-Weber E. V., Pettini M., Madau P., Zych B. J., 2009, ArXiv e-prints
- Salpeter (1955) Salpeter E. E., 1955, ApJ, 121, 161
- Scannapieco & Brüggen (2008) Scannapieco E., Brüggen M., 2008, ApJ, 686, 927
- Schaye et al. (2003) Schaye J., Aguirre A., Kim T.-S., Theuns T., Rauch M., Sargent W. L. W., 2003, ApJ, 596, 768
- Schaye et al. (2000) Schaye J., Theuns T., Rauch M., Efstathiou G., Sargent W. L. W., 2000, MNRAS, 318, 817
- Seljak & Zaldarriaga (1996) Seljak U., Zaldarriaga M., 1996, ApJ, 469, 437
- Sheth & Tormen (1999) Sheth R. K., Tormen G., 1999, MNRAS, 308, 119
- Springel (2005) Springel V., 2005, MNRAS, 364, 1105
- Springel & Hernquist (2003) Springel V., Hernquist L., 2003, MNRAS, 339, 289
- Storrie-Lombardi & Wolfe (2000) Storrie-Lombardi L. J., Wolfe A. M., 2000, ApJ, 543, 552
- Sutherland & Dopita (1993) Sutherland R. S., Dopita M. A., 1993, ApJS, 88, 253
- Theuns et al. (1998) Theuns T., Leonard A., Efstathiou G., Pearce F. R., Thomas P. A., 1998, MNRAS, 301, 478
- Theuns et al. (2002) Theuns T., Viel M., Kay S., Schaye J., Carswell R. F., Tzanavaris P., 2002, ApJ, 578, L5
- Thielemann et al. (2003) Thielemann F.-K., Argast D., Brachwitz F., Hix W. R., Höflich P., Liebendörfer M., Martinez-Pinedo G., Mezzacappa A., Panov I., Rauscher T., 2003, Nuclear Physics A, 718, 139
- Tornatore et al. (2007) Tornatore L., Borgani S., Dolag K., Matteucci F., 2007, MNRAS, 382, 1050
- Tornatore et al. (2007) Tornatore L., Ferrara A., Schneider R., 2007, MNRAS, 382, 945
- van den Hoek & Groenewegen (1997) van den Hoek L. B., Groenewegen M. A. T., 1997, A&A Supp., 123, 305
- Viel et al. (2008) Viel M., Becker G. D., Bolton J. S., Haehnelt M. G., Rauch M., Sargent W. L. W., 2008, Physical Review Letters, 100, 041304
- Vikhlinin et al. (2008) Vikhlinin A., Kravtsov A. V., Burenin R. A., Ebeling H., Forman W. R., Hornstrup A., Jones C., Murray S. S., Nagai D., Quintana H., Voevodkin A., 2008, ArXiv e-prints
- Vladilo et al. (2006) Vladilo G., Centurión M., Levshakov S. A., Péroux C., Khare P., Kulkarni V. P., York D. G., 2006, A&A, 454, 151
- Vladilo & Péroux (2005) Vladilo G., Péroux C., 2005, A&A, 444, 461
- Vladilo et al. (2008) Vladilo G., Prochaska J. X., Wolfe A. M., 2008, A&A, 478, 701
- Wolfe et al. (2005) Wolfe A. M., Gawiser E., Prochaska J. X., 2005, ARA&A, 43, 861
- Wolfe et al. (1995) Wolfe A. M., Lanzetta K. M., Foltz C. B., Chaffee F. H., 1995, ApJ, 454, 698
- Wolfe et al. (1986) Wolfe A. M., Turnshek D. A., Smith H. E., Cohen R. D., 1986, ApJS, 61, 249
- Woosley & Weaver (1995) Woosley S. E., Weaver T. A., 1995, ApJS, 101, 181
- Zwaan et al. (2008) Zwaan M., Walter F., Ryan-Weber E., Brinks E., de Blok W. J. G., Kennicutt Jr. R. C., 2008, ArXiv e-prints