Large Low Temperature Specific Heat in Pyrochlore Bi2Ti2O7
Abstract
Both amorphous and crystalline materials frequently exhibit low temperature specific heats in excess of what is predicted using the Debye model. The signature of this excess specific heat is a peak observed in versus . To understand the curious absence of long-range ordering of local distortions in the crystal structure of pyrochlore Bi2Ti2O7, we have measured the specific heat of crystalline Bi2Ti2O7 and related compounds. We find that the peak in versus in Bi2Ti2O7 falls at a substantially lower temperature than other similar compounds, consistent with the presence of disorder. This thermodynamic evidence for disorder in crystalline Bi2Ti2O7 is consistent with quenched configurational disorder among Bi lone pairs produced by geometrical frustration, which could represent a possible realization of “charge ice”.
It is well known that at relatively low temperatures, typically in the range of 2 K to 30 K, amorphous systems exhibit a larger specific heat than the simple prediction of the Debye model. This excess specific heat manifests itself as a peak in versus , and is generally attributed to local low energy vibrational modes not accounted for in the Debye model. These low energy modes are observed in Raman spectraWinterling (1975) and from inelastic neutron scattering,Buchenau et al. (1986) where they give rise, in glasses, to the so-called “boson peak”.Zeller and Pohl (1971); Phillips (1972) The mechanisms responsible for these low energy modes have been discussed in terms of localized vibrations (“floppy modes”), domain wall motions of the glassy mosaic structure, and transverse phonon modes.Dove et al. (1997); Lubchenko and Wolynes (2003); Shintani and Tanaka (2008)
A number of crystalline materials also exhibit a low-temperature peak in . This peak can be attributed to van Hove singularities where the vibrational density of states (VDOS) crosses the Debye density of states, leading to a flattening of phonon dispersion curve.Safarik et al. (2006) This is nearly equivalent to stating that the local modes are responsible; in materials such as SiO2, the nature of the vibrations responsible for the peak in crystalline and amorphous samples are similar.Dove et al. (1997) As low temperature specific heat measurements can provide evidence for disorder in insulating crystalline compounds, we have used thermodynamic measurements to investigate displacive disorder in Bi2Ti2O7 and related systems.
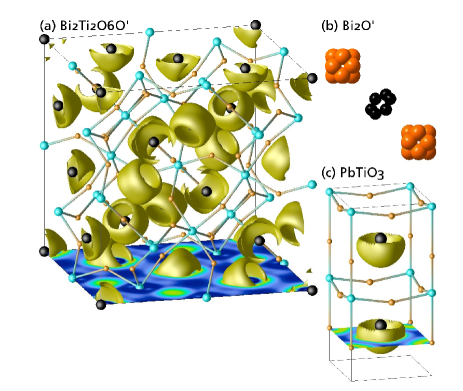
In this contribution, we examine the excess low temperature specific heat in a series of structurally- and compositionally-related crystalline compounds of interest as polar and dielectric materials. The pyrochlore compound Bi2Ti2O6O′ is compositionally and electronically related to the perovskite ferroelectric PbTiO3, in that the A site of the structure is occupied by a main group ion with the 6 configuration, and the B site is occupied by Ti4+ (structures displayed in FIG. 1). Both the A and the B site ions in these compounds are therefore susceptible to off-centering. This so-called stereochemical activity, and this is what drives the phase transition to a coherent, polar, tetragonal ground state in PbTiO3. The related pyrochlore compound Bi2Ti2O6O′ (more simply referred to as Bi2Ti2O7) shows no such phase transition and even at 2 K, the crystal structure is cubic.Hector and Wiggin (2004) However, in a manner that is common across many pyrochlore crystal structures with Bi3+ on the A site, Rietveld refinement of neutron diffraction data indicates that Bi is locally off-centered. This evidence for local distortion, in conjuction with the absence of ferroelectricity, suggests that that the Bi ions are displaced randomly into one of several distinct, but symmetric, sites about the equilibrium position as indicated in FIG. 1(b).Avdeev et al. (2002); Levin et al. (2002); Hector and Wiggin (2004); Zhou et al. (2004); Melot et al. (2006); Rodriguez et al. (2008)
The goal of this work is to explore whether there is any thermodynamic evidence for displacive disorder in Bi2Ti2O7 driven by geometric frustration on the pyrochlore lattice.Seshadri (2006); McQueen et al. (2008) Frustration of ferromagnetic Ising spins in compounds with the pyrochlore crystal structure are well known,Ramirez et al. (1999); Bramwell and Gingras (2001) with analogies having being drawn with the problem of hydrogen positions in the crystal structure of cubic ice , with its associated residual entropy.Pauling (1935) A similar analogy between ice and putative polar pyrochlores was suggested in reference Seshadri, 2006; that Bi2Ti2O7 may be a manifestation of “charge ice”. We emphasize that this disorder is expected to be driven by purely geometrical considerations and develop on well-ordered crystalline lattices, so this “charge ice” structure should be distinguished from the “charge glass” state observed in structurally disordered La2Cu1-xLixO4 and La2-xSrxNiO4.Park_PRL05
In order investigate the role of disorder on the low temperature heat capacity in crystalline systems we have measured the specific heat of Bi2Ti2O7, two isostructural compounds Y2Ti2O7 and Bi2NbInO7, as well as the ferroelectrics PbTiO3 and Bi4Ti3O12. Coherent lone pair displacements in the latter two systems produce a ferroelectric ground state, which suggests that residual displacive disorder should be minimal. The compound Y2Ti2O7 unlike the four others, has no lone pairs on the A site and can be expected to display the least disorder. All the samples are white to light yellow and highly electrically insulating in powder form.
The polycrystalline samples studied here, with the exception of Bi2Ti2O7, were prepared by ceramic routes and phase purity was verified using powder X-ray diffraction. Perovskite PbTiO3 was prepared from PbO and TiO2, with a 5% stoichiometric excess of PbO to balance losses due to volatilization. Pyrochlore Y2Ti2O7 was prepared from Y2O3 and TiO2. The Aurivilius phase Bi4Ti3O12 was obtained from appropriate stoichiometric starting ratios of Bi2O3 and TiO2. Bi2InNbO7 was prepared by reacting appropriate stoichiometric amounts of Bi2O3, Nb2O5, and In2O3, following the method reported by Zhou et al.Zhou et al. (2004) The Bi2Ti2O7 sample used in this study was prepared by low temperature routes and previously subject to neutron structure determination.Hector and Wiggin (2004) All specific heat measurements were carried out on Quantum Design Physical Properties Measurement Systems (PPMS). We used different techniques to extract the low temperature specific heat of these compounds. The Bi2Ti2O7, PbTiO3, and Bi4Ti3O12 powders were pressed into dense pellets, mounted to a calorimeter with thermal grease. The Bi2NbInO7 powder was cold sintered with Ag powder, with the specific heat contribution from the silver measured separately and subtracted. The specific heat of Y2Ti2O7 was measured both by mixing the loose powder with a small amount of thermal grease then compacted between aluminum plates with weighing paper and also by pressing it in a 1:1 ratio with silver. Both techniques yielded quantitively similar results, so we present only the data from Y2Ti2O7 mixed with thermal grease. The Bi2Ti2O7 and Y2Ti2O7 samples were separately measured down to 0.5 K using a PPMS system equipped with a 3He refrigerator, with the relaxation measured over two time-constants.
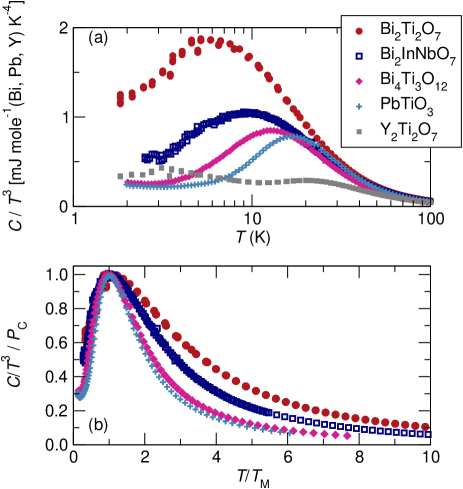
The specific heat capacities for all five samples are shown in FIG. 2(a). In order to more clearly emphasize the low energy features in the system, giving rise to specific heat in excess of the Debye contribution, we have plotted the specific heat as versus . All samples show a maximum when plotted in this manner, with the amplitude of the peak increasing monotonically with decreasing peak temperature. This peak indicates that the specific heat of these crystalline samples exceeds the Debye C(T) at low temperatures, and are consistent with previous measurements on crystalline PbTiO3, which has been shown to exhibit a peak at = 15 K.PTO_HC
As Y2Ti2O7 and Bi2Ti2O7, have the same crystal structure, one would expect that both compounds should exhibit similar vibrational DOS. Contrary to this expectation, we find that Bi2Ti2O7 has a much larger low energy density of states, which is partly due to the larger mass of Bi compared to Y. This larger mass cannot, however, fully explain the appearance of a low-energy peak; we attribute this excess heat capacity to the presence of disorder among Bi lone pairs. The lower temperature for the Bi2Ti2O7 peak relative to the Y2Ti2O7 peak is consistent with increasing disorder in the Bi pyrochlore arising from lone pair displacements, as discussed in more detail in the following. The other pyrochlore compound studied here, which is also expeced to displacive disorder on the A site, Bi2NbInO7, shows a relatively large, low-temperature peak in , although the amplitude of the peak, is smaller, and the temperature at which the peak maximum is found is higher that Bi2Ti2O7.
In order to compare the excess specific heat in the two pyrochlore compounds with other crystalline lone-pair active systems, we have also measured the low temperature specific heat of PbTiO3 and Bi4Ti3O12. It is seen in FIG. 2(a) that these compounds also display a distinct peak in , although the peaks fall at higher energy, and are smaller in magnitude than the peaks displayed by the two pyrochlore compounds with displacive disorder. The distinct difference in the excess specific heat of the lone-pair disordered compounds, Bi2Ti2O7 and Bi2NbInO7 from the lone-pair ordered compounds, PbTiO3 and Bi4Ti3O12 is seen in the scaled vs. plots displayed FIG. 2(b). The scaling was performed with respect to the individual peaks, at which is maximum, and the temperature where the maximum is found. While materials having both ordered and disordered distortions exhibit a specific heat peak, the lone-pair disordered compounds display a distinctly greater width in the distribution of the excess specific heat. This increase in the scaled full width half maximum (FWHM) of the Bi2Ti2O7 and Bi2NbInO7 curves indicates that the modes contributing to the excess entropy in these materials have a wider distributions of energies than in the ordered compounds. As a reference, the curve computed for a single mode Einstein oscillator is plotted as a solid line in FIG. 2(b). The relative width of this excess heat capacity peak, plotted on a semilog scale and measured at 70% of the maximum value, increases from 0.36 for PbTiO3 to 0.71 for Bi2NbInO7 and 1.05 for Bi2Ti2O7. This increase is similar to the broadening of the maximum in amorphous SiO2 relative to crystalline SiO2Liu and v. Löhneysen (1996), and can be associated with increasing disorder of the lone pair electrons in Bi2NbInO7 and Bi2Ti2O7.
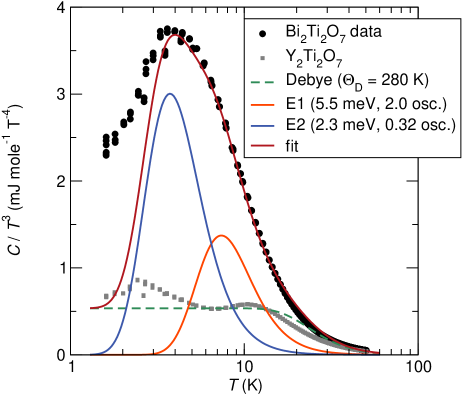
To quantitatively investigate these peaks, we fit the specific heat in FIG. 3 to the sum of a Debye contribution (), with two additional low energy Einstein modes (). This is equivalent to supposing that the VDOS can be modeled by a delta function as it crosses the Debye DOS, rather than the finite jump expected for van Hove singularities in 3D crystals. We included two separate Einstein modes as FIG. 2(b) indicates that the excess heat capacity cannot be fit by a single mode. While simplistic, this model allows us to relate the thermodynamic anomaly to microscopic properties in the samples. For all crystalline samples included in this study (Bi2Ti2O7, Y2Ti2O7, PbTiO3, Bi2NbInO7, and Bi4Ti3O12) we found that a suitable fit could be obtained using a Debye temperature of K. This emphasizes that the underlying lattice heat capacities of these different samples are similar, so that the significant differences in the low temperature heat capacities should be attributed to differences in the lone pair electron behaviour.
The low temperature can be modeled as a sum of Debye and Einstein terms with each Einstein oscillator giving a contribution:
| (1) |
to the specific heat. In this expression, is the spectral weight, the gas constant, and the mode energy. For Bi2Ti2O7 the first excitation has an energy of = 2.3 meV and an oscillator strength of = 0.32, while the second excitation falls at = 5.5 meV and has an oscillator strength of = 2. Similar fits were obtained for the other samples. We find that Bi2Ti2O7 has the lowest energy oscillator. The values of the oscillator strengths and energies for the different samples are given in Table 1. We find that for the lowest energy mode in these fits depends linearly on the temperature of the peak. Motivated by this result, which, within the constraints of our simple model, confirms that the peak temperature and vibrational mode frequencies are linearly related, we will discuss our data solely in terms of the peak temperature. This assumption allows us to avoid specific details of the fitting parameters, allowing a more general and robust analysis of the results.
| (meV) | (meV) | |||
|---|---|---|---|---|
| Bi2Ti2O7 | 2.3 | 0.32 | 5.5 | 2 |
| Bi4Ti3O12 | 3.6 | 0.7 | 6.7 | 5 |
| Bi2NbInO7 | 2.8 | 0.27 | 6 | 1.6 |
| PbTiO3 | 5.5 | 0.4 | 8 | 1.5 |
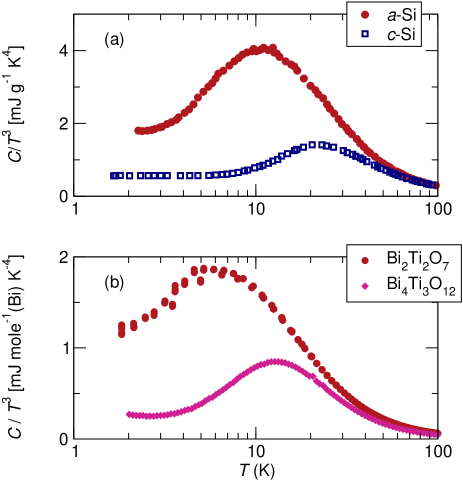
To more clearly demonstrate the influence of increasing disorder on the peak in heat capacity in crystalline materials, we compare our measurements with some other low temperature heat capacity studies on ordered and disordered crystals. We plot the excess low temperature heat capacity as versus ln T for amorphous SiO2 and crystalline quartz in FIG. 4(a), taken from Ref. pohl , and for Bi4Ti3O12 and Bi2Ti2O7 in FIG. 4(b). The lattice disorder present in amorphous SiO2 leads to a reduction in temperature of the excess heat capacity peak as compared to structurally well-ordered quartz; this peak shift is a signature of increasing disorder in otherwise similar systems. Qualitatively, this is similar to the shift in peak temperature between Bi4Ti3O12 and Bi2Ti2O7, despite the fact that both of these materials are crystalline and have very similar Debye temperatures and elemental constituents, and hence bare oscillator spectral weights, that are roughly the same. These measurements provide thermodynamic justification to support the suggestion that crystalline Bi2Ti2O7 has additional disorder as compared to Bi4Ti3O12.
Because there is no evidence for any lattice disorder in Bi2Ti2O7, the presence of a low-temperature peak provides empirical evidence suggesting that the lone pair electrons on Bi are disordered due to geometrical frustration, consistent with previous XRD studiesHector and Wiggin (2004). Increasing disorder in other crystalline systems has been observed to shift this heat capacity peak to lower temperatures, including oxides with chemical site disorder, such as Ca replacing Sr in the CaSrFeCoO5 brownmilleritebrownmillerite . This disorder-induced shift is also observed in metallic systems, although the size of the effect may be significantlly smaller than in insulatorsSafarik et al. (2006). It has also been noted that geometrical frustration present in systems having underconstrained degrees of freedom, such as ZrW2O8, can also lead to excess low temperature heat capacity in crystalline systemsRamirez and Kowach (1998). These results suggest that the downshift of the specific heat peak in displacively disordered, but still crystalline, Bi2Ti2O7 may be associated with the development of a frozen “charge-ice” state in these systems driven by geometrical frustration, rather than the frozen glassy state associated with structural disorder. Furthermore, by investigating the detailed phonon density of states in Bi2Ti2O7 and isostructural Y2Ti2O7 and correlating these results with heat capacity data, it may be possible to gain insight into the microscopic mechanisms giving rise to excess low temperature entropy in disordered systems.
In summary, we find that several insulating crystalline materials with lone pairs, and with the pyrochlore, perovskite, and Aurivillius crystal structures, exhibit an excess low temperature specific heat above the Debye background. The specific heat peaks in pyrochlores Bi2Ti2O7 and Bi2NbInO7 are however, distinctly broader and stronger, and are found to appear at lower temperatures than those of isostructural Y2Ti2O7 and compounds showing coherent coherent lone pair displacements (PbTiO3 and Bi4Ti3O12). We attribute this suppression of the excess specific heat to the presence of additional disorder in Bi2Ti2O7 and Bi2NbInO7 arising from incoherent frozen displacements of the Bi lone pair electrons. This suggests that Bi2Ti2O7 may be an example of a structurally well-ordered system with charge disorder introduced by geometrical frustration on the pyrochlore lattice.
This work was supported by the National Science Foundation under NSF CAREER DMR-06044823 (to GL) and DMR-0449354 (to RS), and by the Institute for Materials Research at Wayne State University. Work at Santa Barbara made use of MRSEC facilities supported by the NSF through DMR-0520415.
References
- Winterling (1975) G. Winterling, Phys. Rev. B. 12, 2432 (1975).
- Buchenau et al. (1986) U. Buchenau, M. Prager, N. Nücker, A. J. Dianoux, N. Ahmad, and W. A. Phillips, Phys. Rev. B 34, 5665 (1986).
- Zeller and Pohl (1971) R. C. Zeller and R. O. Pohl, Phys. Rev. B. 4, 2029 (1971).
- Phillips (1972) W. A. Phillips, J. Low Temp. Phys. 7, 351 (1972).
- Dove et al. (1997) M. T. Dove, M. J. Harris, A. C. Hannon, J. M. Parker, I. P. Swainson, and M. Gambhir, Phys. Rev. Lett. 78, 1070 (1997).
- Lubchenko and Wolynes (2003) V. Lubchenko and P. G. Wolynes, Proc. Natl. Acad. Sci. 100, 1515 (2003).
- Shintani and Tanaka (2008) H. Shintani and H. Tanaka, Nature Mater. 7, 870 (2008).
- Safarik et al. (2006) D. J. Safarik, R. B. Schwarz, and M. F. Hundley, Phys. Rev. Lett. 96, 195902(1 (2006).
- Hector and Wiggin (2004) A. L. Hector and S. B. Wiggin, J. Solid State Chem. 177, 139 (2004).
- Melot et al. (2006) B. Melot, E. Rodriguez, T. Proffen, M. A. Hayward, and R. Seshadri, Mater. Res. Bull. 41, 961 (2006).
- Avdeev et al. (2002) M. Avdeev, M. K. Haas, J. D. Jorgensen, and R. J. Cava, J. Solid State Chem. 169, 24 (2002).
- Levin et al. (2002) I. Levin, T. G. Amos, J. C. N. no, T. A. Vanderah, C. A. Randall, and M. T. Lanagan, J. Solid State Chem. 168, 69 (2002).
- Zhou et al. (2004) Q. Zhou, B. J. Kennedy, V. Ting, and R. L. Withers, J. Solid State Chem. 178, 1575 (2004).
- Rodriguez et al. (2008) E. E. Rodriguez, F. Poineau, A. Llobet, K. Czerwinski, R.Seshadri, and A. Cheetham, Inorg. Chem. 47, 6281 (2008).
- Seshadri (2006) R. Seshadri, Solid State Sci. 8, 259 (2006).
- McQueen et al. (2008) T. M. McQueen, D. V. West, B. Muegge, Q. Huang, K. Noble, H. W. Zandbergen, and R. J. Cava, J. Phys. Condens. Matter 20, 235210(1 (2008).
- Ramirez et al. (1999) A. P. Ramirez, A. Hayashi, R. J. Cava, R. Siddharthan, and B. S. Shastry, Nature 399, 333 (1999).
- Bramwell and Gingras (2001) S. T. Bramwell and M. J. P. Gingras, Science 294, 1495 (2001).
- Pauling (1935) L. Pauling, J. Am. Chem. Soc. 57, 2680 (1935).
- (20) T. Park, Z. Nussinov, K.R. Hazzard, V.A. Sidorov, A.V. Balatsky, J.L. Sarrao, S.W. Cheong, M.F. Hundley, J.S. Lee, Q.Z. Jia, J.D. Thompson, Phys. Rev. Lett. 94, 017002 (2005).
- (21) W.N. Lawless, T. Nakamura, M. Takashige, S.L. Swartz, J. Phys. Soc. Japan 52, 207 (1983).
- Liu and v. Löhneysen (1996) X. Liu and H. v. Löhneysen, Europhys. Lett. 33, 617 (1996).
- (23) R.C. Zeller, R.O. Pohl, Phys. Rev. B 4, 2029 (1971).
- (24) A.I. Rykov, K. Nomura, T. Mitsui, M. Seto, Physica B 350, 287 (2004).
- Ramirez and Kowach (1998) A. P. Ramirez and G. R. Kowach, Phys. Rev. Lett. 90, 4903 (1998).