Calibration of Low-Frequency, Wide-Field Radio Interferometers Using Delay/Delay-Rate Filtering
Abstract
We present a filtering technique that can be applied to individual baselines of wide-bandwidth, wide-field interferometric data to geometrically select regions on the celestial sphere that contain primary calibration sources. The technique relies on the Fourier transformation of wide-band frequency spectra from a given baseline to obtain one-dimensional “delay images”, and then the transformation of a time-series of delay images to obtain two-dimensional “delay/delay-rate images.” Source selection is possible in these images given appropriate combinations of baseline, bandwidth, integration time and source location. Strong and persistent radio frequency interference (RFI) limits the effectiveness of this source selection owing to the removal of data by RFI excision algorithms. A one-dimensional, complex CLEAN algorithm has been developed to compensate for RFI-excision effects. This approach allows CLEANed, source-isolated data to be used to isolate bandpass and primary beam gain functions. These techniques are applied to data from the Precision Array for Probing the Epoch of Reionization (PAPER) as a demonstration of their value in calibrating a new generation of low-frequency radio interferometers with wide relative bandwidths and large fields-of-view.
1 Introduction
The rapid growth of the capabilities of digital signal processing is enabling a new generation of interferometric arrays based on large numbers of antennas and/or wide instantaneous frequency coverage. Current examples of such arrays include the Expanded Very Large Array111http://www.aoc.nrao.edu/evla (EVLA), the Allen Telescope Array222http://ral.berkeley.edu/ata (ATA), the LOw Frequency ARray333http://www.lofar.org (LOFAR), the Precision Array for Probing the Epoch of Reionization444http://astro.berkeley.edu/~dbacker/eor (PAPER), the Murchison Widefield Array555http://haystack.mit.edu/ast/arrays/mwa (MWA), the Long Wavelength Array666http://lwa.unm.edu (LWA), the Karoo Array Telescope777http://www.kat.ac.za (KAT), and the Australia Square Kilometer Array Prototype888http://www.atnf.csiro.au/projects/askap (ASKAP). The increase in the number of elements in these arrays is a result of requirements for larger collecting areas and a trend towards smaller individual antenna elements. This trend reflects an evolving curve of array cost versus antenna element size (Weinreb & D’Addario 2001) whose minimum is shifting towards smaller antennas (with diameter ) as the cost of array correlation (scaling as ) drops relative to the materials cost of producing the array antennas (scaling approximately as ).
The smaller individual elements of new arrays have larger fields-of-view (FoVs) that result in faster surveying speeds. However, when many parameters are poorly known, a larger FoV complicates early array calibration by decreasing the extent to which a single source dominates the correlated flux between antennas. Without isolation of sources, self-calibration cannot be performed as a direct computation using raw data, but rather must rely on a priori models of the sky and primary beam response pattern to divide out the baseline-dependent interference pattern (Cornwell & Fomalont 1989). This interference pattern is illustrated by the sum over sources in the basic measurement equation for interferometric response to a set of point sources:
| (1) |
where are antenna indices, is radio frequency, is time, is the complex frequency-dependent electronics gain, is the antenna beam gain in the source direction with unit normalization toward the zenith, is the source flux, is the geometric delay for baseline in the direction , and is the non-geometric, relative electrical path delay. Both , and , are typically factorized into antenna-based gains and delays, respectively. Accurate solutions for the internal degrees of freedom in an array, especially for such parameters as the spatial variation of antenna beam gains, requires access to a variety of calibration sources. Wide-field arrays have the problem that their FoV nearly always includes sources so bright that their sidelobes conceal lesser sources useful for calibration. The need to remove sources whose phase and amplitude solutions are not of interest in order to access sources that are useful for calibration can be a time-consuming and distracting process.
However, advances in feed design and processing bandwidth are also increasing the amount of frequency data available in the latest interferometers. Wide-bandwidth data with sufficient channel resolution make the delay transform–the Fourier transform of a frequency spectrum–a powerful tool defining delay patterns (see §2.2 of Thompson et al. (2001)) that separate sources on the sky. In the following sections, we discuss techniques for using the delay (D) transform and its analog along the time axis, the delay-rate (DR) transform, to separate the fluxes of strong celestial sources. Through the construction of delay/delay-rate (DDR) filters, we demonstrate how sources may be isolated to facilitate self-calibration in wide-FoV, wide fractional bandwidth interferometers. Following the development of these calibration techniques, we demonstrate their application to data from PAPER (Bradley et al. 2005), a low-frequency, non-phase-tracking, dipole array whose steradian FoV and 100-MHz bandwidth motivated this work.
2 The Delay (D) Transform
The frequency spectrum of visibilities on a measured baseline as a function of time reflects an interference pattern between the complex vectors corresponding to each coherently added point source in the primary beam (Eq. 1). As discussed in the previous section, the calibration process may be significantly simplified provided that the several interfering components present in the data of each channel may be separated from one another. This so-called “source separation” should ideally be tunable in its precision, so that coarse separation may be achieved using poorly characterized parameters, and increasingly accurate calibration improves the achievable separation. For a single baseline, there are only two parameters available for separating sources: frequency and time. In the next two sections, we will discuss techniques for using both of these parameters to separate the flux of point sources.
Within the spectrum of a baseline at a given time, each source exhibits a linearly varying phase versus frequency, reflecting the geometric group delay associated with the projection of the baseline in the direction of the source.
| (2) |
where are baseline components with units of length in the radial, eastern, and northern polar directions, respectively, is the source declination, and is the source hour angle as a function of sidereal time . The geometric delay is frequency-independent, and can be extracted using a Fourier transform between frequency (F)-domain and delay (D)-domain coordinates:
| (3) | ||||
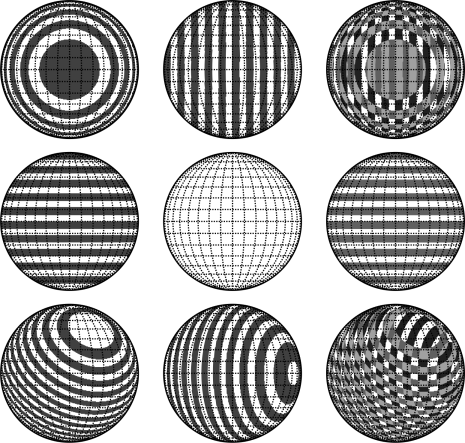
As illustrated above, this D transform maps the flux from each interfering source to the corresponding delay, which will typically include a systematic, non-geometric delay owing to the relative electrical signal path delays between antennas and . While this procedure is effective as a first step in source separation, the D transform does not result in a one-to-one mapping of the celestial sphere to delay coordinates; sources that lie in a plane perpendicular to the baseline vector share the same geometric delay (see Fig. 1). Furthermore, frequency-dependent interferometer gains create a convolution kernel that spreads the gain of a source in D domain, resulting in an effective delay resolution. For a flat passband, this resolution is approximately related to the bandwidth sampled by the interferometer , and translates to a ring of finite width at the intersection of the celestial sphere with a plane of constant delay. Given the finite D-domain resolution, we will hereafter assume that is sampled in “delay bins” of width .
The ring on the sky defined by a delay bin centered on can be translated into coordinates of right ascension and declination using Eq. 2. In celestial coordinates, the width and orientation of a delay ring evolve with time, as expressed using partial derivatives of Eq. 2 with respect to and :
| (4) | ||||
Given the time-variable orientation of the delay ring containing the fixed point on the celestial sphere , and looking ahead to the next section where we will show how the flux in a delay ring can be further localized using delay-rates, we will ignore the parametric nature of a delay ring and simply compute an average full-width in corresponding to by averaging Eq. 4 over :
| (5) | ||||
The angular width of a delay filter may be approximated to order-of-magnitude as
| (6) |
where represents the bandwidth used in the delay transform and is the length of the baseline involved. For a 100-MHz bandwidth and a 1-km baseline, a delay filter has a resolution of approximately 20 arcminutes.
3 Delay-Rate (DR) Filtering
The delay of a source on the celestial sphere changes with time owing to the rotation of the components of a baseline with the Earth. From Eq. 2, the rate-of-change of delay of a source at is given by:
| (7) |
where is the rotation rate of the Earth. By phasing visibilities to a source with time variable phase using the current best calibration parameters, it is possible to stop the fringe of a source so that a Fourier transform of the time axis over the interval will add visibilities coherently into an area near zero delay-rate:
| (8) | ||||
A filter near zero delay-rate along the axis (the Fourier complement to ) has a resolution determined by (the resolution of a delay filter divided by time window used in the DR transform). Note that any time-variable gain (for example, the non-tracking primary beam of a PAPER dipole) enters as a convolution kernel along the delay-rate axis. Such a filter restricts flux to a ring where the celestial sphere intersects the plane parallel to and the Earth’s rotational axis (see Fig. 1). As in the case of the D transform, this ring has a time-variable width and orientation with respect to a fixed point on the celestial sphere that can be described using partial derivatives of Eq. 7:
| (9) | ||||
Similarly, the average full width of this filter in celestial coordinates around the phase center can be described by averaging Eq. 9 for :
| (10) | ||||
An order-of-magnitude estimate of the angular width of a delay-rate filter is given by
| (11) |
where represents the bandwidth used in the delay transform, is the length of the baseline involved, and is the time interval used in the delay-rate transform. Using a 1-km baseline, a bandwidth of 100MHz, and 1 hour of data, a delay-rate filter has a resolution of approximately 1 degree.
4 A Combined Delay/Delay-Rate (DDR) Filter
By phasing visibility data for a baseline (possibly using imperfect calibration) to a point and performing Fourier transformations along both the frequency and time axes, it is possible to apply a DDR filter near the origin in delay/delay-rate space that selects for a restricted area near the phase center. The fundamental resolution of this filter is determined by the minimum bounds placed by Equations 5 and 10, but wider filters may be constructed by selecting multiple bins along both the and axes. After a filter has been applied in DDR domain (either to null or extract a region near the phase center), one can then apply the inverse Fourier transformations to return to the frequency-time (FT) domain. The data may then be unphased from the specified source, if desired, to return to the original phase center. This filtering process is described using matrix operator notation as:
| (12) |
where is the phasor to a point on the celestial sphere, represents a Fourier transform, and is a gain function representing the spatial filter desired.
The DDR filtering process requires that the width of the convolution kernels associated with the frequency-dependent electronics gain, antenna beam gain, and source flux spectra in Eqs. 3 and 8 be small compared to the filter width needed to isolate strong sources. While this may often be the case for smoothly varying functions characterizing the response of analog systems and the wide-band emission of celestial sources, the excision of faulty data, particularly data containing radio-frequency interference (RFI), challenges this assumption by introducing sharp features into an otherwise smoothly varying function. The effects of nulling data in a spectrum before constructing a “delay image” bear many similarities to the effects of incompletely sampling an aperture in traditional synthesis imaging. In fact, the effects of constructing a delay image with an incompletely sampled passband can be compensated for by using the same deconvolution techniques used in synthesis imaging.
A variant of the CLEAN (Högbom 1974) algorithm, adapted to a complex function in one dimension for a celestial sky dominated by a handful of point sources, is a particularly fast and robust algorithm for deconvolving the effect of passband gaps (Roberts et al. 1987). In one-dimensional, complex CLEAN, a fraction of the largest magnitude feature (by bin) of the “dirty image”–the Fourier transform of the spectrum containing nulled data–is iteratively propagated to a model deconvolved image after being divided by the gain of the “dirty beam”. This model is then used to derive residuals between the predicted dirty image and the actual one, and these residuals are used as the dirty image in the next iteration. In the DDR imaging case, the dirty beam consists of the Fourier transform of the sampling function reflected in the data. This deconvolution process can be illustrated as a modification of Eq. 12:
| (13) |
where represents a sampling function whose singularity (having multiplied some data by zero) makes it non-invertible, but whose effects can nonetheless be undone in approximation, represented by , via an iterative one-dimensional deconvolution along the delay and delay-rate axes. In order for complex CLEAN to converge, it is vital that the estimated gain of the dirty beam reproduce the phase of the main lobe of the complex kernel. For a mostly sampled aperture, it is a reasonable assumption that the phase of the peak response of the kernel can be taken as the phase of the overall gain for estimating updates to the clean image and for incorporating the final residuals of the CLEAN process. These residuals represent what is left after the CLEAN process has converged to a specified tolerance.
The computational complexity of the CLEAN algorithm scales between and with the number of data samples, depending on the number of image-domain pixels whose magnitude exceeds the specified termination tolerance. Since the computational complexity of the Fourier transform operation involved in DDR imaging scales as , the relative computational expense of CLEANing is sensitive to this tolerance. Provided that one specifies a termination tolerance that matches the degree to which a few strong point sources dominate data, the additional computational expense of the CLEAN operation is negligible. The open-source software toolkit Astronomical Interferometry in PYthon999http://pypi.python.org/pypi/aipy (AIPY) contains an implementation of DDR imaging, with the option of using one-dimensional complex CLEAN along both delay and delay-rate axes to remove the effects of nulled data.
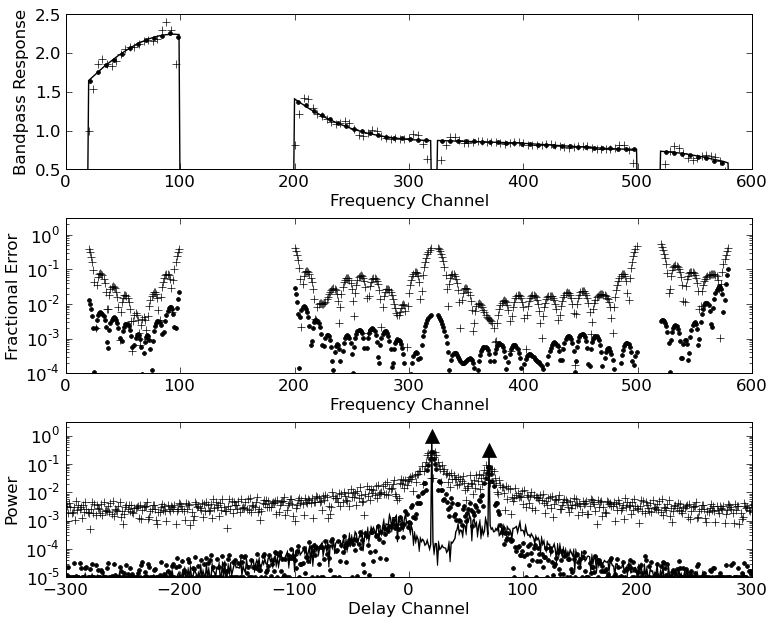
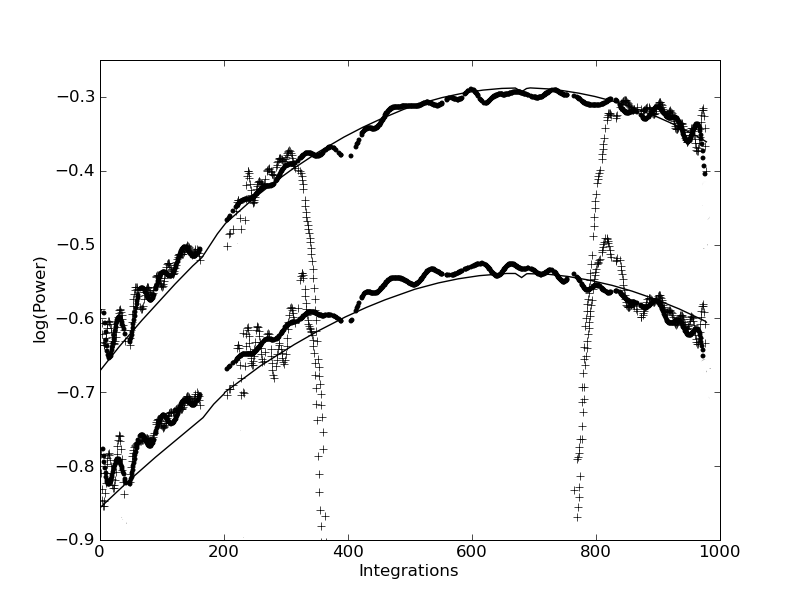
A priori knowledge of the shape of the passband can be incorporated into the model of the dirty beam to decrease the footprint of sources in the deconvolved image. However, direction-dependent gains and frequency-dependent source fluxes pose the same problems as in standard imaging (Bhatnagar et al. 2008; Conway et al. 1990)–namely that the kernels of these effects change per source, so that deconvolution cannot be performed using a single dirty beam. Provided that sources are sufficiently separated in DDR domain so that the convolution kernels representing the passband, source spectrum, and primary beam do not adversely affect source isolation, the kernels of these functions can be used to reconstruct the corresponding FT-domain functions. After nulling interfering sources, deconvolving by a sampling function, and extracting a swath in DDR domain around the source at phase center, the remaining point-spread function reveals the effects of the convolution kernels associated with the frequency-dependent electronics gain, antenna beam gain, and source flux spectra in Eqs. 3 and 8. Having preserved these functions (smoothed by a factor determined by the size of the swath extracted), one can transform DDR data back into FT domain to reveal their combined effect. Given a model source spectrum, one has direct access to each baseline’s response to that source versus time and frequency. This process is modeled in Figure 2 and applied to real data in Figure 3.
After using DDR filtering to isolate a source while retaining information about the bandpass and primary beam, classic single-source self-calibration (Jennison 1958; Pearson & Readhead 1984) can be used to produce the closure phase and amplitude quantities from which antenna-based calibration parameters can be deduced. Because DDR filtering is sensitive to the orientation of a baseline relative to strong celestial sources, the degree to which sources may be isolated varies between baselines. For this reason, it may be necessary to manually exclude certain baselines from the self-calibration process at times when source separation is particularly problematic. For arrays consisting of many more than 4 antennas, this necessity does not significantly impact the accuracy of self-calibration.
5 Shortcomings of DDR Filters
The pair of rings defined by the delay and delay-rate bins specified in a filter intersect at two points on the celestial sphere (see Fig. 1). As a function of time, one of these points of intersection remains centered on the specified phase center while the other swings around the sky in a pattern that depends on the orientation of the baseline and the location of the phase center. Thus, a defined filter achieves the desired result averaged over time, but at any given time it sees two separate areas on the sky with equal weight. For some baseline orientations, one of these areas can be attenuated by the primary beam, but this is not generally the case.
The effect of having a “double-lobed” response has minimal impact on source-isolation procedures. An effective method for isolating a source consists of applying a series of narrowly tailored nulling filters aimed at other strong sources in the field-of-view, followed by a relatively coarse extracting filter aimed at the desired source. This technique has the advantage of maintaining sufficient range around the desired phase center for accommodating imperfect calibration and for reconstructing beam and passband shapes, while minimizing the probability that a secondary lobe of this wide filter sweeps across another strong source.
The complex effects of the secondary lobe of DDR filters suggest exercising caution when constructing maps using data where such filters have been used to excise certain sources. Though such filters can indeed be used effectively in these situations, one should remain cognizant of the fact that an attenuating filter of changing size has been swept across wide regions of the sky at a variable rate. However, with increasing numbers of baselines at unique orientations, the relative contribution of any single secondary lobe of a DDR filter decreases. As a result, this technique may have particularly useful applications to spatial imaging with large arrays of widefield antennas.
6 Application to PAPER Calibration
The Precision Array for Probing the Epoch of Reionization (PAPER) is an experiment aimed at detecting fluctuations in 21cm emission from neutral hydrogen at redshifts to as it is ionized in the first epoch of star formation (Bradley et al. 2005). To this end, interferometric arrays of dipole elements have been deployed at the NRAO site in Green Bank101010The National Radio Astronomy Observatory (NRAO) is owned and operated by Associated Universities, Inc. with funding from the National Science Foundation., which we call PGB, and at the proposed Murchison Radio-astronomy Observatory (MRO) site in Western Australia111111We acknowledge the Wajarri-Yamatji people of Australia as the Native Title Claimants of the purposed MRO lands and thank them for allowing scientific activity on the site., which we call PWA. These arrays are being steadily expanded in a series of deployments with the ultimate goal of correlating more than one hundred antennas in the low-interference environment of Western Australia. Currently, PAPER has deployed a 4-element array at MRO (PWA-4) and a 16-element array in Green Bank (PGB-16), with a typical antenna spacing of 200m.
The PAPER dipole element has a broad (125-185 MHz) frequency response owing to a modified sleeved dipole design, with a smooth, single-lobe primary beam to facilitate the exacting calibration that is necessary for this experiment. Each antenna maintains a fixed pointing toward the zenith as the sky rotates through–all PAPER data is taken as a “drift scan”. The full-width at half-maximum (FWHM) of the primary beam is nearly , and extends from horizon to horizon without a null. The wide FoV and large relative bandwidth of the PAPER experiment have complicated progress towards an accurate first-order calibration for the reasons outlined in §1. In particular, the RFI environment at the Green Bank site is such that wide swaths in frequency and time must be excised before the data is usable for astronomical purposes. The preceding DDR filtering and CLEANing techniques were designed precisely to combat this problem so that source fluxes can be separated to facilitate self-calibration.
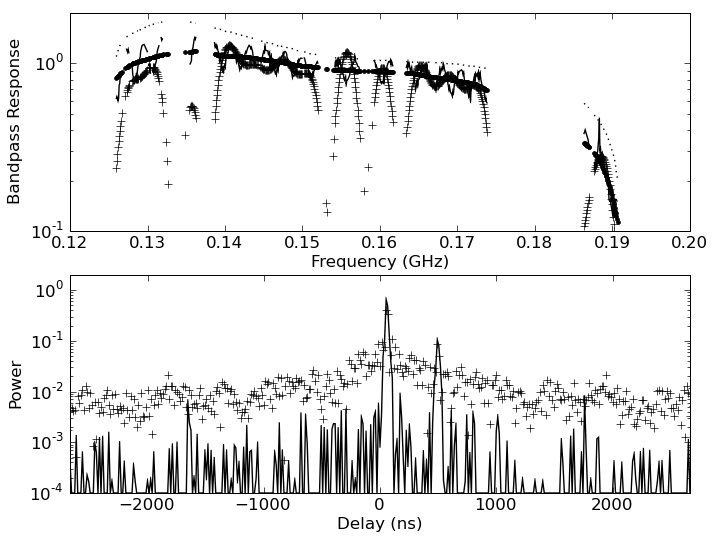
In Figure 3, we demonstrate the application of a delay filter to an integration from one baseline of PGB-16. The substantial sidelobes in D domain that result from RFI excision smear Cyg A and Cas A (the two dominant sources) together, corrupting the attempt to isolate Cyg A via a delay filter and to use that source to calibrate system gain. By applying one-dimensional CLEAN using the kernel that results from the D transform of the sampling function, the sidelobes in D domain can be reduced dramatically. With cleanly separated spikes attributable to Cyg A and Cas A, the flux of Cyg A may be extracted with greater fidelity. By extracting a swath around the desired source, we preserve a convolving kernel in D domain that retains information about the source spectrum and smooth bandpass function. A smooth estimate of the passband may be obtained by Fourier transforming this kernel back into F domain and dividing by a known source spectrum. Notice in Figure 3 how a smooth passband resembling the auto-correlation spectrum of one of the antennas has been constructed from the response of Cyg A. The difference between the auto-correlation and cross-correlation spectrum of Cyg A is attributable to galactic synchrotron emission that is resolved out by the baseline being used.
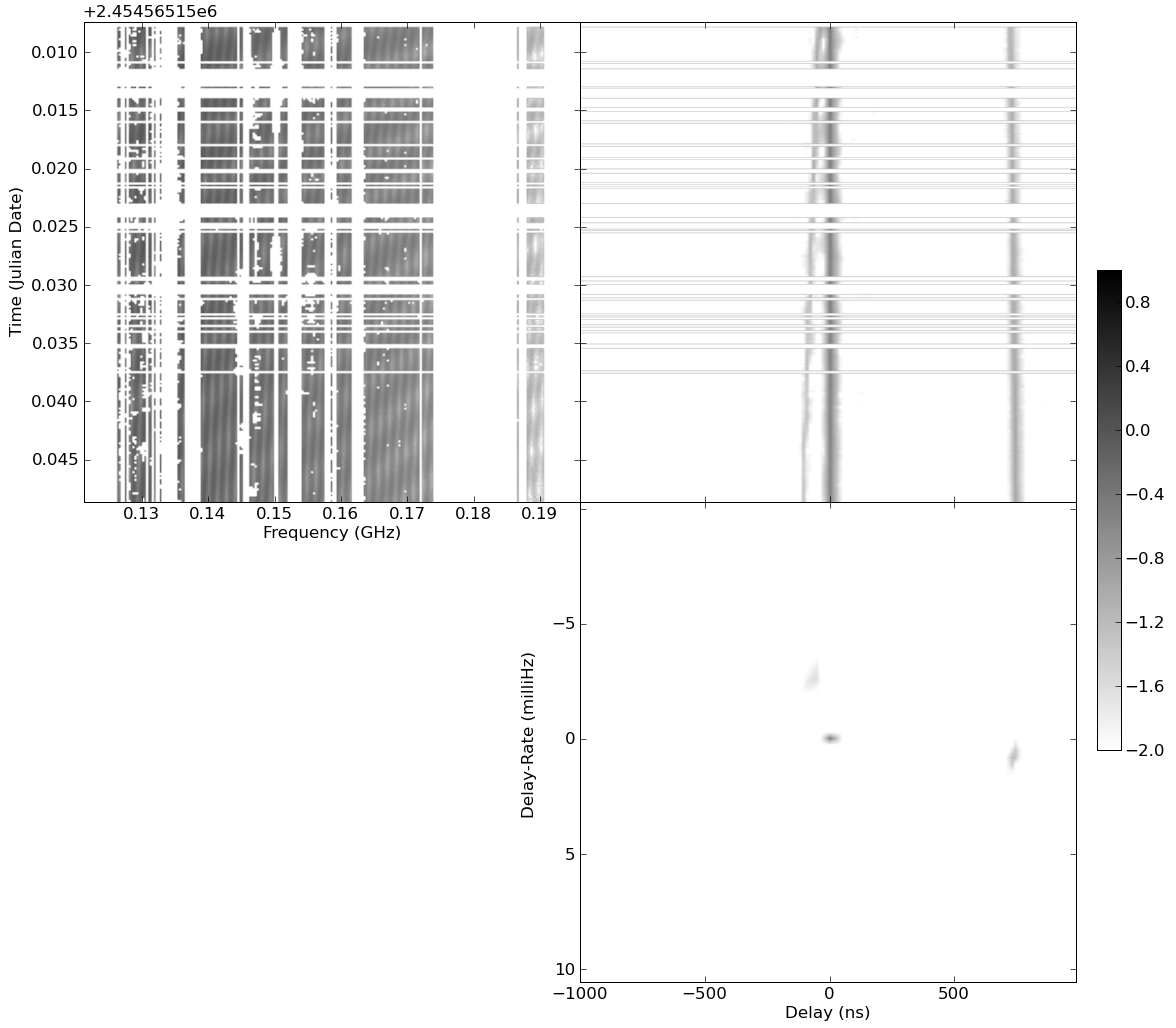
There are cases for which pure delay filtering is inadequate for separating sources. The left side of Figure 4 illustrates a waterfall plot of the delay spectrum of a baseline over the course of four hours, during which the delay tracks of Cas A (center) and Cyg A (right to left) cross as the sources drift through the primary beam. In this case, a naive D-domain filter for suppressing Cyg A and extracting Cas A cuts a swath out of the derived spectrum for Cas A (see Fig. 5) and corrupts the attempted derivation of the primary beam shape as Cas A drifts through it. But as the right side of Figure 4 illustrates, the DR transform provides another axis that can be used to separate the fluxes of the sources involved. Filtering in DDR-domain, we are able to track the spectrum of Cas A through its intersection in the D domain with Cyg A, and compare it to a beam model predicted through computer simulation. As was the case for delay filtering, we can preserve information about changing source flux (in this case, caused by drifting through the primary beam) by selecting a swath around the source in DR domain containing the kernel that represents the Fourier transform of the time-dependent gain.
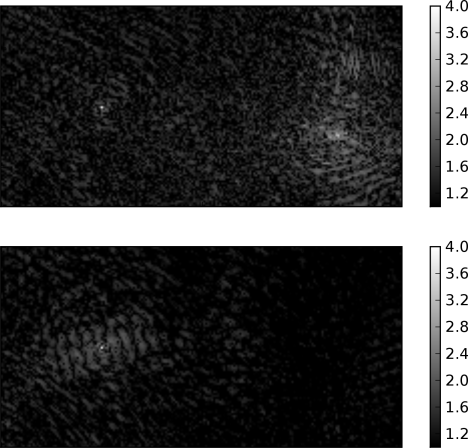
Finally, having used source isolation to self-calibrate PGB-8 data, we demonstrate an application of the same DDR filtering techniques to 2-dimensional aperture synthesis imaging. Figure 6 demonstrates how a wide-field image of Cyg A and Cas A (top) can be filtered to remove Cyg A by applying the appropriate DDR filter to data from each baseline. Though this technique can be very effective in removing broad sidelobes associated with a strong celestial source, one must beware of the effects of the secondary lobes of these filters (§5), which in this case have increased the sidelobes associated with Cas A (Fig. 6, bottom). The secondary lobe of one of the baselines has swept across the region of sky containing Cas A, leaving a grating interference pattern that represents the contribution that visibilities measured by that baseline should have made to the image, as modeled by the dirty beam used for deconvolving the dirty 2-dimensional image. The absence of this contribution appears as the missing fringe pattern with an inverted sign. Though such filtering can prove valuable in removing strong sources to reveal weaker ones lost in sidelobes, it is clear that the resultant images are corrupted as a result, and that accurate imaging will require the visibilities predicted from these corrupted images to be compared with the measured ones, possibly using iterative sky/visibility modeling to converge on an accurate image.
7 Conclusion
We have described a technique for isolating source fluxes by Fourier transforming FT-ordered data from an individual baseline into DDR domain, applying filters, and then performing the inverse transforms. The ability to isolate sources vastly simplifies the calibration of interferometric arrays with wide fields-of-view where self-calibration would otherwise require an accurate a priori sky model to account for multiple strong sources within the primary beam. Imprecise calibration and wide filters can be used initially to select wide areas around sources that encompass calibration errors and allow improved calibrations to be obtained. As calibration improves, these filters can be more narrowly tailored to allow the extraction of bandpass and beam functions from their corresponding DDR-domain kernels, and ultimately such filters can even be used in combination with traditional aperture synthesis imaging to eliminate the sidelobes of strong sources and reveal weaker celestial sources.
While such filters have many desirable qualities such as minimal reliance on prior calibration and geometric widths that are independent of frequency, the fact that such filters have a time-variable orientation with respect to the celestial sphere and a secondary response lobe that sweeps across a large area on the sky limit their usefulness for precision imaging. However, combined with a modeling process that feeds estimates of the sky from such images into model visibilities that are compared with measured data, DDR filters may constitute an important imaging tool even for high dynamic-range applications.
References
- Bhatnagar et al. (2008) Bhatnagar, S., Cornwell, T. J., Golap, K., & Uson, J. M. 2008, A&A, 487, 419
- Bradley et al. (2005) Bradley, R., Backer, D., Parsons, A., Parashare, C., & Gugliucci, N. E. 2005, in Bulletin of the American Astronomical Society, 1216–+
- Conway et al. (1990) Conway, J. E., Cornwell, T. J., & Wilkinson, P. N. 1990, MNRAS, 246, 490
- Cornwell & Fomalont (1989) Cornwell, T. & Fomalont, E. B. 1989, in Astronomical Society of the Pacific Conference Series, Vol. 6, Synthesis Imaging in Radio Astronomy, ed. R. A. Perley, F. R. Schwab, & A. H. Bridle, 185–+
- Högbom (1974) Högbom, J. A. 1974, A&AS, 15, 417
- Jennison (1958) Jennison, R. C. 1958, MNRAS, 118, 276
- Pearson & Readhead (1984) Pearson, T. J. & Readhead, A. C. S. 1984, ARA&A, 22, 97
- Roberts et al. (1987) Roberts, D. H., Lehar, J., & Dreher, J. W. 1987, AJ, 93, 968
- Thompson et al. (2001) Thompson, A. R., Moran, J. M., & Swenson, Jr., G. W. 2001, Interferometry and Synthesis in Radio Astronomy, 2nd Edition (Interferometry and synthesis in radio astronomy by A. Richard Thompson, James M. Moran, and George W. Swenson, Jr. 2nd ed. New York : Wiley, c2001.xxiii, 692 p. : ill. ; 25 cm. ”A Wiley-Interscience publication.” Includes bibliographical references and indexes. ISBN : 0471254924)
- Weinreb & D’Addario (2001) Weinreb, S. & D’Addario, L. 2001, Cost Equation for the SKA, Tech. Rep. 1
