Evidence for strongly coupled charge-density-wave ordering in three-dimensional RE5Ir4Si10 compounds by optical measurements
Abstract
We report optical spectra of Lu5Ir4Si10 and Er5Ir4Si10, exhibiting the phenomenon of coexisting superconductivity or antiferromagnetism and charge density wave (CDW) order. We measure the maximum value of the charge density wave gap present on part of the Fermi surface of Lu5Ir4Si10, corresponding to a ratio , well above the value in the limit of weak electron-phonon coupling. Strong electron-phonon coupling was confirmed by analyzing the optical conductivity with the Holstein model describing the electron-phonon interactions, indicating the coupling to phonons centered at 30 meV, with a coupling constant . Finally we provide evidence that approximately 16% of the Fermi surface of Lu5Ir4Si10 becomes gapped in the CDW state.
I Introduction
Charge-density-wave (CDW) formation was demonstrated peierls to be the consequence of an interaction between phonons connecting nested sides of the Fermi surface (FS) and metallic electrons in the system. For a particular phonon mode with wavevector a charge density modulation is induced leading to a rearrangement of the original atom positions which tend to open a gap at the FS. When the temperature of the system decreases below the transition temperature , a full gap can be ideally opened and the system can undergo a metal-insulator transition (MIT), also known as Peierls transition peierls ; gruner . Experimentally the density wave formation was demonstrated in many quasi-monodimensional compounds like K0.3MoO3 travaglini84 ; travaglini81 ; degiorgi91 , also known as “blue bronze”, NbSe3 perucchi04 ; fournel86 ; sridhar85 , TaSe3 sridhar85 and in different families of organic materials (TTF-TCNQ and Bechgaard salts schwartz98 ; henderson99 ; giamarchi04 ).
For weak electron-phonon interactions, also known as the weak coupling regime, the relation between the value of the gap and the mean-field CDW transition temperature obeys the relation well known for the case of BCS superconductivity. In the situation where the weak electron-phonon coupling condition is not fulfilled, deviations from the standard BCS-like scenario are expected. For a purely monodimensional system long range order develops at the transition temperature ; the ground state is characterized by a coherence length that represents the spatial dimension of the coupled e-h pair.
McMillan mcmillan77 proposed a description beyond the weak-coupling limit. He pointed out that, since in the weak coupling regime the phonon frequencies are modified over a small region of the reciprocal space, the phonon entropy is unimportant with respect to the electrons’ entropy. In the opposite case of a short coherence length, the phonon contribution to entropy dominates over the electron’s contribution. In the strong coupling regime the ratio exceeds the weak-coupling limit by a factor of 2 for realistic values of the electron-phonon coupling. This theory has been successfully applied to practical cases where a CDW transition was accompanied by anomalously large changes in specific heat, thermal conductivity as well as thermoelectric power. For example it could explain the anomalies observed in -TaSe2 vescoli98 ; mcmillan77 .
In this regard Lu5Ir4Si10 has many interesting properties that deviate from the standard weakly coupled CDW behavior and shows signatures of a strongly coupled systemramakrishnan07 ; becker99 . In this compound the CDW and the superconducting transitions were found at T K and T K and the two states coexist below the superconducting transition as confirmed via X-ray-diffraction becker99 . The first intriguing aspect is that the anisotropy of the material () is much lower than expected for typical monodimensional systems. Furthermore the system does not go through a pure metal-insulator transition across . It remains metallic down to the superconducting transition where eventually the resistivity drops to zero. The other interesting aspect concerns its thermodynamical properties, which show the anomalies characteristic of strongly coupled systems. The specific heat, thermal conductivity and thermoelectric power measurements becker99 ; jung03 ; kuo01 , indicate a large specific-heat jump ( J/mol K for a polycrystalline sample kuo01 and J/mol K for a single-crystal sample becker99 ) developing in a very narrow temperature range () accompanied by a significant entropy variation (kuo01 , becker99 , where gas constant). The relative size of the specific heat variation has been compared to the expected value predicted assuming a weak coupling approximation; the result showed an important deviation from this latter value giving , where represents the electronic contribution to the specific heatkuo01 . All these features imply strong couplingmcmillan77 .
The isostructural compound Er5Ir4Si10 on the other hand shows two CDW transitions: the first one at 155 K is a transition to an incommensurate CDW state while at 55 K another transition establishes the final commensurate CDW state. Also in this case the CDW instability originates apparently from a 3D system, since the resistivity ratio along the two main principal axis . The substitution of lutetium with erbium adds a net magnetic moment, which creates at low temperature ( K) an anti-ferromagnetically ordered state without displaying any signature of superconductivity as observed for the Lu5Ir4Si10 compound. Also in this case it has been shown that the charge-density-wave state and the antiferromagnetic ordering coexist below the Neel temperature.
In this paper we report a study of the optical properties of Lu5Ir4Si10 and Er5Ir4Si10 single crystals in the temperature range between 20 K and room temperature and in the spectral region between 0.01 and 4 eV. The optical spectra of the two compounds are almost identical, but the detailed temperature dependence is different due to differences in the manner in which the CDW order evolves as a function of temperature in the two materials. For both materials the plasma frequency along the main optical axes turns out to be relatively isotropic, around for the ratio . Detailed analysis of the CDW gap and the spectral weight of Lu5Ir4Si10 reveals that about 16% of the Fermi surface becomes gapped, and that the CDW phenomenon is in the strong coupling limit of McMillan’s theory of electron-phonon coupling in CDW systems.
II Experimental methods
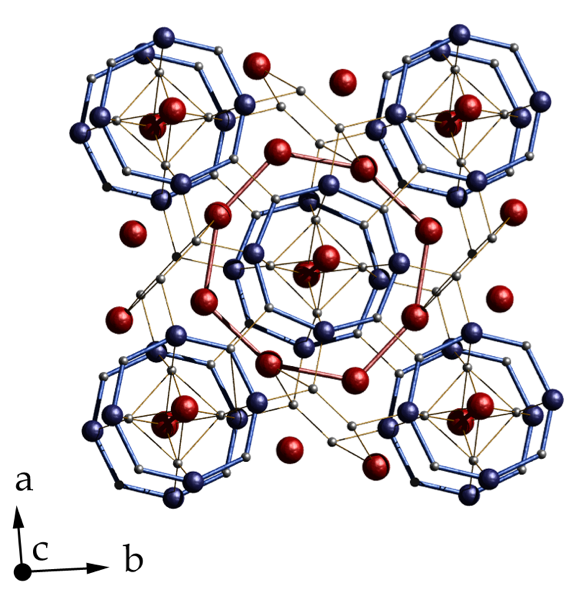
RE5Ir4Si10 single-crystals were grown using a modified Czochralski technique as described in Refs. becker99 ; menovsky . Its crystal structure belongs to the tetragonal Sc5Co4Si10 family (P4/mbm), thus the a and b-axis are degenerate , while the c-axis size is . The atom positions are represented in Fig. 1; the dark (blue) lines are the Ir-Si-Ir bonds around the RE atoms placed in the corners and at the center of the main cell, while the thick (red) lines are the RE-RE bonds. The five RE atoms seated at the corners and in the center of the cell surrounded by four Ir atoms interleaved with Si atoms are separated by a network of eight RE atoms in the ab plane. This description becker99 was introduced to explain the two-fold nature of this class of compounds: on the one hand the CDW transition is a signature of monodimensionality, while on the other hand a constant metallic behavior below indicates that the transport perpendicular to the chains is not completely forbidden. By analyzing the distances between atoms in the main cell it was found that RE atoms in the corners and in the center of the unit cell have the shortest interatomic distance with respect to all the other bonds; this suggests that the monodimensional conducting channel is the RE-RE chain developing along the c-axis (perpendicular to the paper sheet). Accordingly, the RE network around the central site can be viewed as a channel of conductivity perpendicular to the chains.
The crystals (surface area mm2 and thickness mm) were oriented with a Laue camera, and polished with diamond sand paper of 0.1 m grain size until a flat and mirror-like quality surface was obtained. The samples, whose optically treated surface contained the ac plane of the crystal, were mounted on a conical copper holder using silver paint to guarantee an optimal thermal contact, and aligned with respect to the optical spectrometers using a He-Ne laser source.
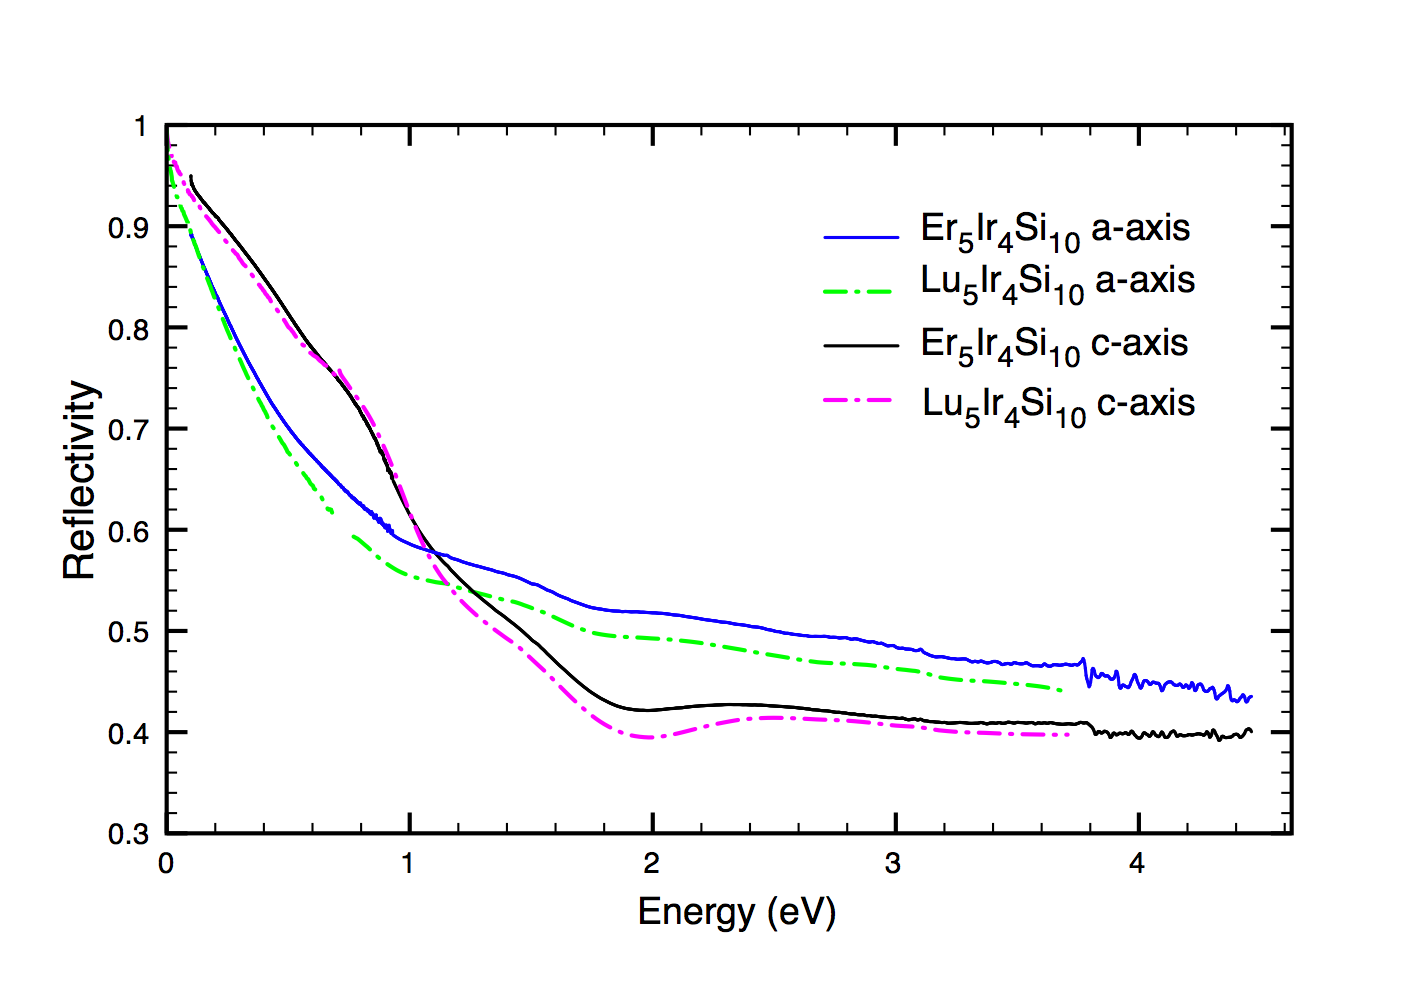
The optical reflection of Lu5Ir4Si10 and Er5Ir4Si10 were measured in the wavelength range from 50 cm-1 (6.2 meV) up to 30000 cm-1 (3.8 eV) using two different techniques: Fourier-transform spectroscopy in the infrared range and ellipsometry for the visible and UV region. In the infrared ( meV) we used a custom-made optical cryostat, whose stability allowed reflected signal variations on the order of to be measured, in combination with a Bruker 113 spectrometer. The samples were mounted in a quasi-normal incidence configuration and the absolute value of the reflectivity was calculated by taking as a reference measurement a gold layer evaporated in situ. We acquired data continuously during slow temperature sweeps ranging from 295 K down to 20 K (1 K of resolution) and we used a rotating polarizer in order to measure the response of the a- and c-axis orientations. Figure 2 shows the experimental reflectivities for the two samples along the a- and c-axis. The comparison reveals large similarities in the infrared and visible response of the two materials. In both cases the c-axis has a more metallic response below 1.3 eV in agreement with its smaller dc resistivity becker99 . The much higher infrared reflectivity along the c-axis confirms that the chains parallel to the c-axis (Fig. 1) are the preferred conductivity channels in this class of compounds. The and -axis reflectivity curves cross at 1 eV. The lower c-axis reflectivity above this energy is caused by the higher value of Im along the -axis, as shown in Fig. 3. The different values of Im along the and axis reflect the anisotropy in the optical matrix-elements of the interband transitions.
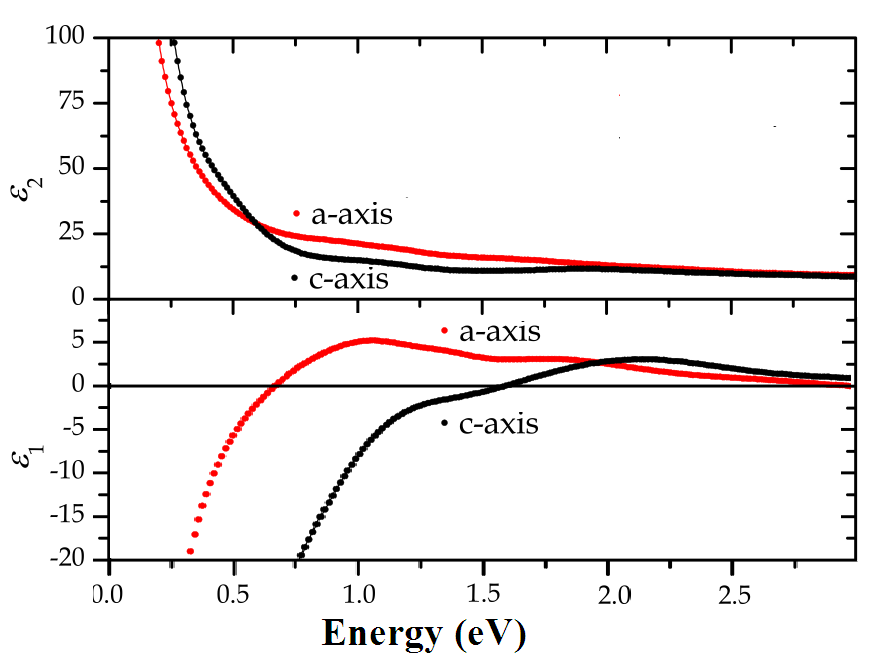
In the ellipsometry measurements we used an angle of incidence of 74∘ with respect to the normal to the sample surface. A UHV cryostat with a base pressure of mbar was used, resulting in no noticeable absorption of gas on the sample surface during cooling. The a- and c-axis responses were obtained rotating the sample in the cryostat. The alignment of the crystal axis with respect to the incoming polarized light was carefully checked in order to reduce the alignment error to values smaller than 1∘. The screened plasma energies , defined as , are directly visible in the ellipsometric data (Fig. 3). The plasma energy is strongly anisotropic: 0.69 eV along a and 1.61 eV along c. This anisotropy is due to a stronger screening by the interband transitions along the a-axis and does not reflect the real anisotropy of the free carrier spectral weight(see section VI)
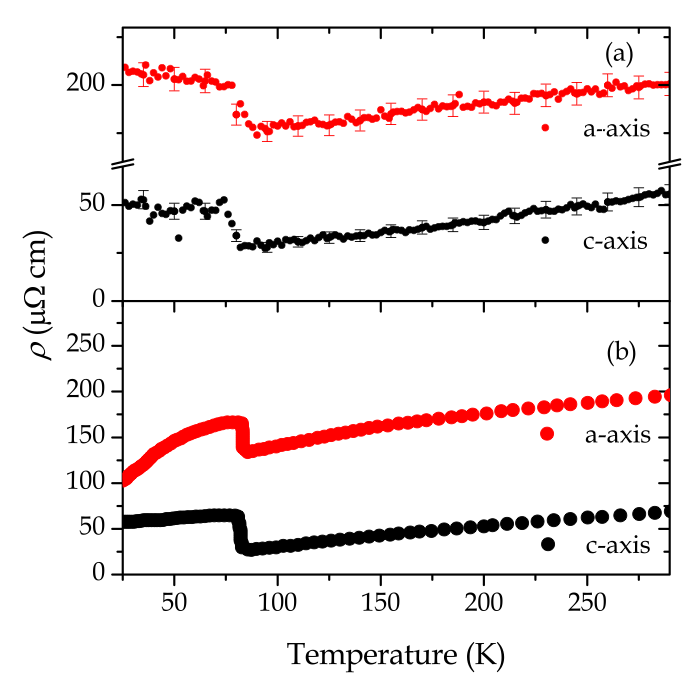
In order to obtain the real and imaginary part of the optical conductivity along the - and the -axis in the entire frequency range, we used a variational routine yielding the Kramers-Kronig consistent dielectric function which reproduces all the fine details of the infrared reflectivity spectra while simultaneously fitting to the ellipsometrically measured complex dielectric function in the visible and UV-rangealexey . In contrast to the ”conventional” Kramers-Kronig transformation of the reflectivity spectra, this procedure anchors the phase of the reflectivity to the phase in the visible range measured directly with ellipsometrybozovic90 . To check the reliability of our data analysis, we compare in Fig. 4 the inverse optical conductivity extrapolated to zero frequency, with the dc resistivity measured on the same sample using the 4 terminal methodbecker99 . Upon reaching the lowest temperature, the optical a-axis departs progressively (up to a factor 2) from the four-probe . This discrepancy finds a natural explanation in the observation that, along the , the Drude peak is weak compared to the interband transitions (see section III). When we lower the temperature below , the Drude-peak narrows, and the Drude optical conductivity decreases in the measured frequency range ( 6 meV). Consequently the extrapolation of the -axis optical conductivity below 6 meV (for which we use the Drude model) becomes less reliable at low temperatures.
III Temperature dependence of the optical constants
Er5Ir4Si10
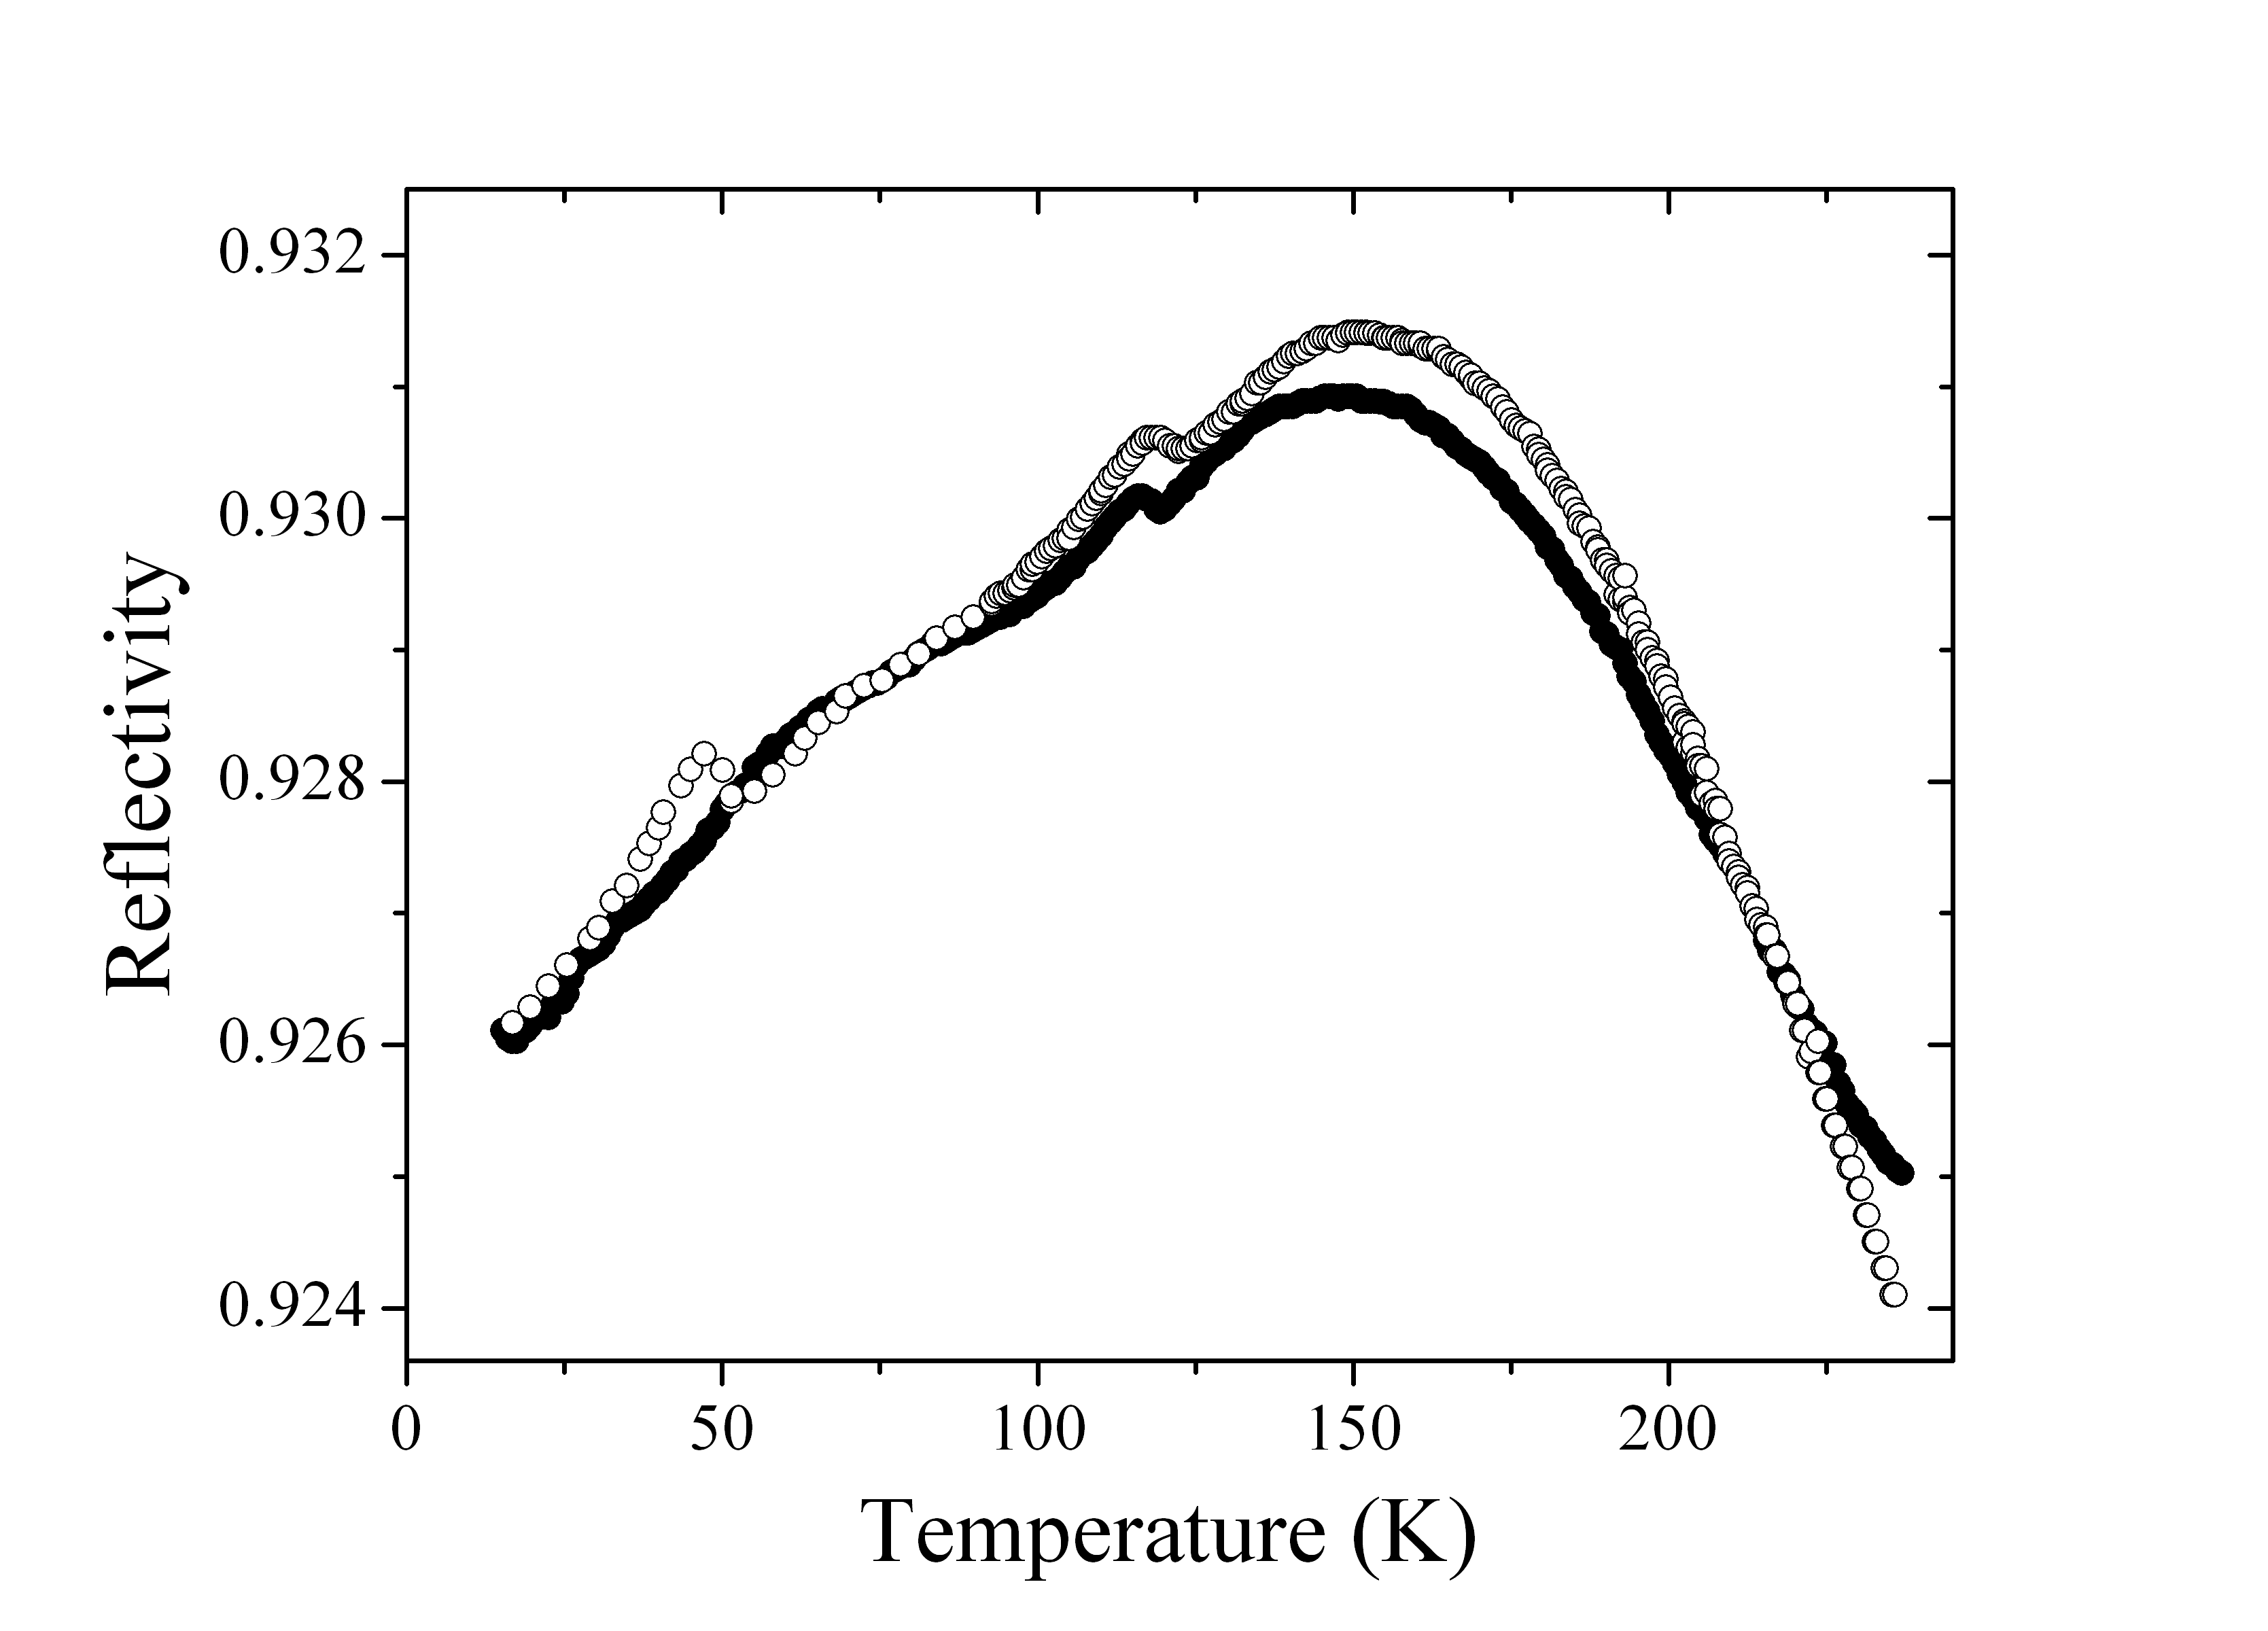
As noted in Sec. I, the Er based compound should show two separate transitions at two different temperatures. The temperature dependence of the reflected signal at 186 meV, shown in Fig. 5, reveals these two transitions at 148 and 53 K, consistent with previously published transport data galli2000PRL ; jung03 . The low temperature transition shows a clear temperature hysteresis, consistent with the transport results. The absolute change of the signal at the two phase transitions is only of the order of for light polarized along the -direction, wile the CDW transition was not observable at all in the -axis optical spectra of Er5Ir4Si10. The CDW induced changes in reflectivity are hence a factor 10 weaker than in Lu5Ir4Si10. Also the DC resistivity has a completely different behaviorjung03 , showing a weak (about 5%) stepwise increase below 148 K, and a gradual decrease below 53 K. Whereas Lu5Ir4Si10 transforms directly from the metallic phase to a CDW at 83 K, in Er5Ir4Si10 these two phases are separated by an incommensurate CDW between 55 and 155 K. The two phase transitions in Er5Ir4Si10 are therefore of a qualitatively different nature than the metal to CDW transition in Lu5Ir4Si10, resulting in weaker changes of the optical properties. For Er5Ir4Si10 a broad shoulder is observed in the specific heat at the lower transition. At the upper transition there is a peak, which is a factor of two smaller as compared to Lu5Ir4Si10jung03 . All experimental data therefore indicate that the Fermi surface gappings are smaller in Er5Ir4Si10 as compared to Lu5Ir4Si10.
Lu5Ir4Si10
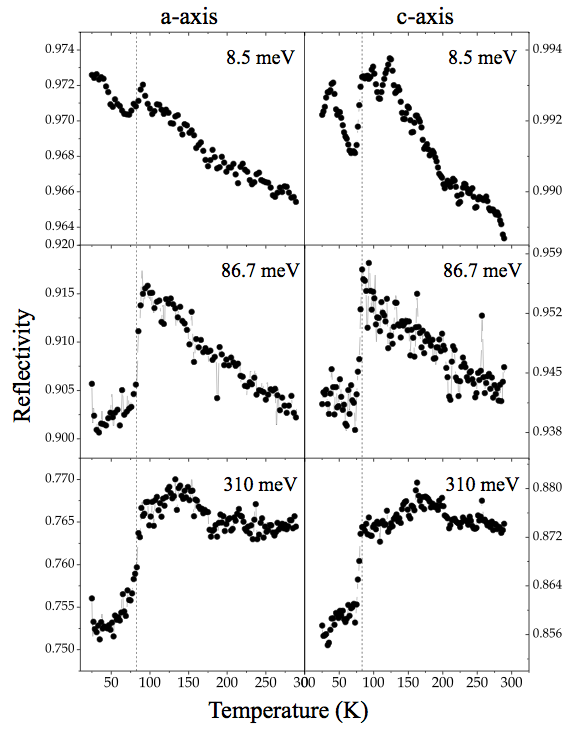
From the anisotropy observable in the reflectivity curves, the sample appears to be more reflecting at low frequency for light polarized along the c-axis, Fig. 2. The CDW transition is visible in the temperature dependent spectra, Fig. 6, as a depletion of the reflectivity below . The drop in reflectivity while cooling the sample is present at all frequencies. We stress that, even though the changes in reflectivity at the transition are extremely clear in the data, the absolute reflectivity variation is less than in the low frequency region. The abrupt change in reflectivity that we observe is located at 78 K, very close to K measured using transport techniques. This temperature has been defined as the maximum of .
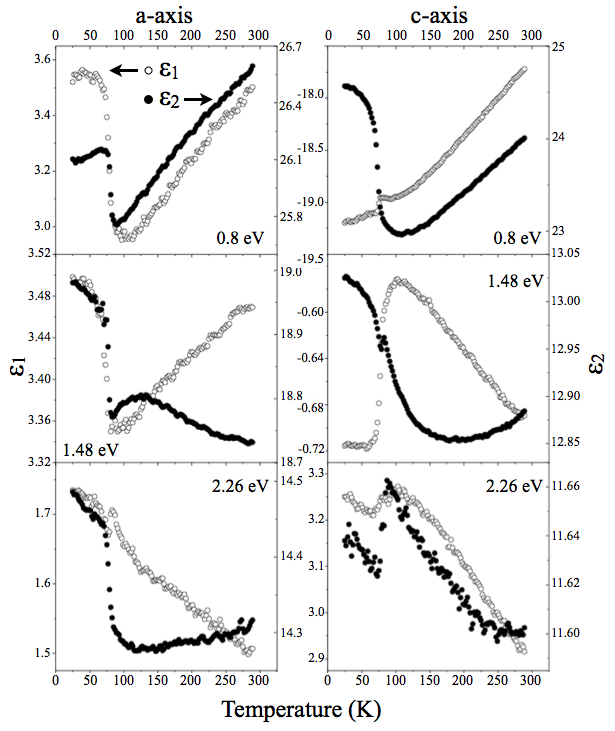
The temperature evolution of the real and imaginary part of the dielectric function (Fig. 7), shows a clear signature of the CDW transition up to frequencies as high as 2.3 eV. The temperature dependence close to does not follow the same trend for all the frequencies: along the c-axis (right column of Fig. 7) increases upon cooling at for eV and decreases at higher frequencies. The same behavior is present for along both axes but with a different frequency dependence.
For the Er5Ir4Si10 the effects observed at the two transitions (158 K and 53 K) are less than 0.05% in absolute reflectivity. For this material the influence of the two phase transitions on the optical spectra is too weak to allow a meaningful spectral analysis of the CDW induced features. The CDW induced changes are much larger in the Lu5Ir4Si10 samples, where we observe a step-like change of the optical constants at TCDW at all infrared and optical frequencies and polarizations. The abrupt changes within 10 K around the transition at 83 K justify our approach in some of the subsequent sections of this paper, which is to to characterize the CDW induced change of the optical conductivity by comparing spectra measured 20 K below TCDW with those taken 20 K above TCDW.
IV Strong coupling analysis of the free carrier response
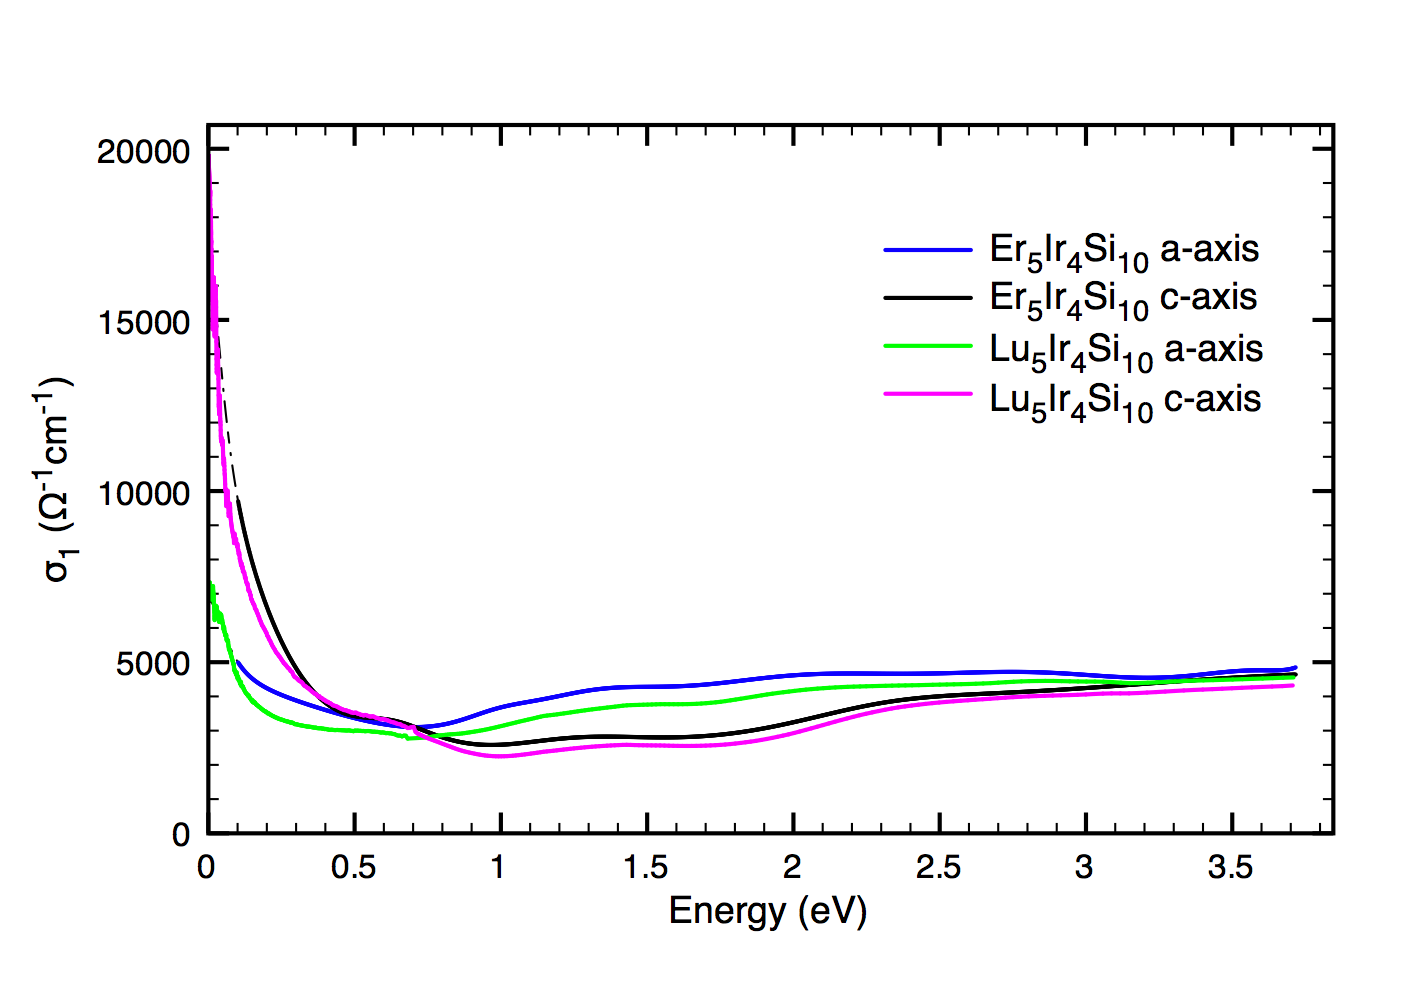
The conductivity curves, displayed in Fig. 8, show the expected narrow Drude peak at low frequencies. In addition the series of minima and maxima for energies larger than 0.5 eV clearly reveals the presence of interband transitions. Later in this section we will see, that the onset of interband transitions in this compound may even be at energies as low as 0.1 eV. It would be very useful to carry out ab initio theoretical investigations of the electronic structure of these compounds in relation to the observed optical conductivity. However, a detailed study of the band structure of this material is lacking at the moment. In particular such a study would provide useful information on the energy and optical strength of the interband transitions, and the unrenormalized plasma frequencies. According to Gruner gruner and Kim kim91 , the CDW has an associated low frequency mode that represents the collective mode of the ordered state. In our experiments the lowest measured energy was 6.2 meV. For this reason the collective mode contribution, which lies at even lower energies, was not directly measured; in our Drude-Lorentz model this contribution is included and hidden in the the low frequency Drude response.
The optical conductivity of interacting electrons is described by the extended Drude modelgoetze72 ; allen77
| (1) |
where the quantities and represent, respectively, the frequency dependent scattering rate and the mass enhancement due to inelastic scattering of the electrons. Their values are obtained from the experimentally measured optical conductivity via simple inversion formulas:
| (2) |
| (3) |
In the above equations the presence of the squared plasma frequency ( is the carrier density and is the band mass of the free charge carriers) requires the definition of a cutoff frequency so that can be determined directly by integrating the optical conductivity
| (4) |
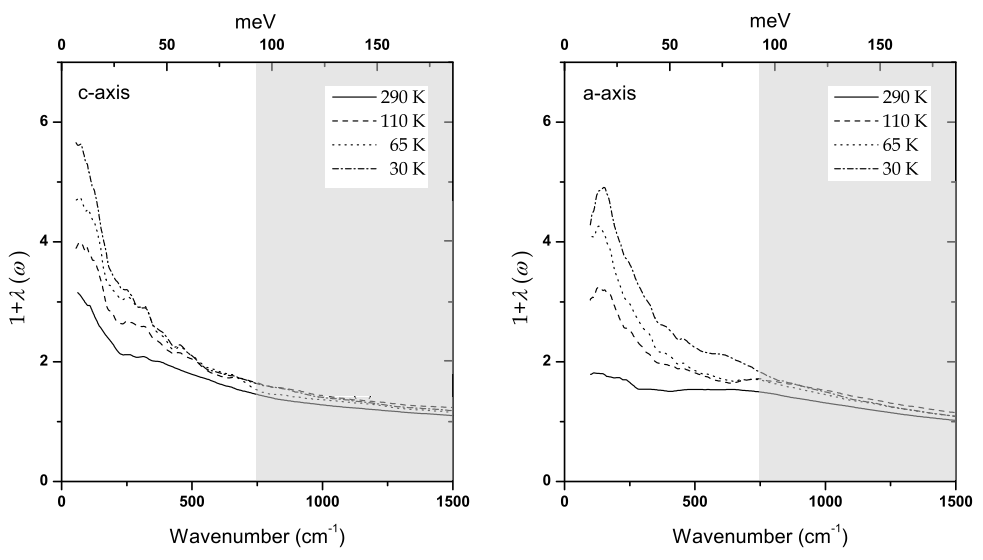
Usually is fixed in a frequency region that allows us to exclude from the integral (4) the interband transition contributions. In our particular case, choosing = 745 (meV) for both polarizations the values of the plasma energies are 4.3 eV and 3.5 eV for the c and a-b axes respectively. An important aspect for the following discussion is, that the temperature variations of the plasma frequencies are negligible ( %) between 4K and 300 K. It is important to keep in mind, that the graphs presenting the frequency dependent scattering rate and the effective mass have a consistent physical meaning only in the frequency region where the contributions from interband transition are negligible. The energy regions where we believe that interband transtions are important, will be presented as shaded areas.
In Fig. 9 the effective-mass is shown for different temperatures above and below the transition. The mass enhancement is similar for the two optical axis. Above 700 cm-1 the mass enhancement is less pronounced and tends to saturate. Later in this section we will address the cause of this high mass-enhancement, and attribute it to strong coupling to phonons at 200 cm-1 (-axis) and 200 cm-1 (-axis).
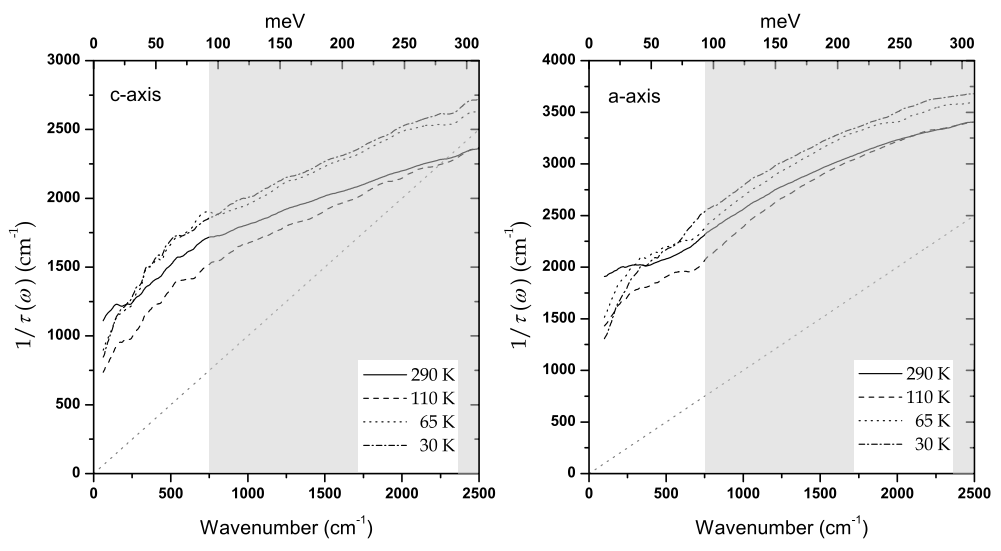
The frequency-dependent scattering rate along the -axis presented in Fig. 10 reveals a negative curvature, with a linear part above cm-1 . This linear section is absent from the a-axis curve. However, interband transitions contribute strongly to the optical conductivity along the -axis (see Fig. 8), which influences the fine details of , especially at higher frequencies. For both optical axis the behaviour of the scattering rate at low frequencies deviates from the typical electron-electron scattering, , predicted for a standard Fermi liquid as experimentally observed in typical 3D metals vandereb2001 ; valla1999 . This peculiarity has been found in several other 2D layered compounds, in particular 2H-TaSe2 and 2H-NbSe2 dordevic2001 ; dordevic2003 ; valla2000 and in all the high-temperature cuprate superconductors (HTSC) basov2002 ; puchkov1996 where shows a linear frequency dependence. Another analogy with the above materials is an abrupt change in the slope of at low frequencies; in our data this kink-like feature is visible at around cm-1 for both crystal orientations. Even if the frequency dependence of in Lu5Ir4Si10 looks similar to the one observed in HTSC and other quasi-2D layered compounds, its temperature dependence is quite different from these cases: in the under-doped HTSC a progressive suppression of the low frequency scattering rate is observed for temperatures below the pseudogap temperature. The behavior in Lu5Ir4Si10 is similar to the behavior found along the ab plane in 2H-NbSe2 dordevic2003 where the increase of temperature results in a frequency-independent contribution to the scattering rate, which is progressively added to the curve. When the temperature is reduced from 290 K to we observe a progressive reduction of the scattering rate, as expected for a typical metallic system.
In the CDW state part of the Fermi surface is gapped, which has two important consequences:
(i) Part of the free charge carriers is removed from the material, and as a result which we use to make the conversion from to and (Eqs. 2 and 3), becomes reduced. In the next subsection we will estimate this reduction to be 15-17%, but the results shown in Figs. 9 and 10 have not been corrected for this reduction. Indeed, when the temperature is lowered below , we observe a sudden increase of over the entire frequency region. The change is of the order of 15% for the c-axis and of 10% for the a-axis when comparing the curves relative to K and K.
(ii) The spectral weight removed from the free carrier contribution is transferred to the optical transitions across the CDW gap. Since the CDW order results in a reduction of the Brillouin-zone, the transitions across the CDW gap should be regarded as interband transitions in the infrared range. As pointed out above, the contributions of interband transitions should in principle be subtracted from the optical spectra before we calculate and . Since this would be an ambiguous procedure, we have not attempted to do so, and consequently the and graphs should in principle contain ’spurious’ contributions for temperatures below where the CDW gap has opened. In practice these spurious effects are rather weak in the present case; even the artifacts which are carried over to the experimental , which we present below, turn out to be quite subtle.
The modification to the electronic properties of metals due to electron-phonon interactions can be described using the Holstein formalism holstein64 ; allen71 ; dolgov95 in the normal state. Starting from the single-electron Greens function and introducing the electron-phonon dependent self-energy, it is possible to derive the expression for the frequency dependent scattering rate
| (5) | |||||
where the transport Eliashberg functioneliashberg1960 ; eliashberg1963 , , corresponds to the phonon density spectrum multiplied by the electron-phonon coupling constant, and is the residual scattering by impurities. We used a standard numerical least-squared fitting routine to obtain the spectral function , which we model as a series of Einstein modes, for which the variational parameters are the intensities and the frequencies :
| (6) |
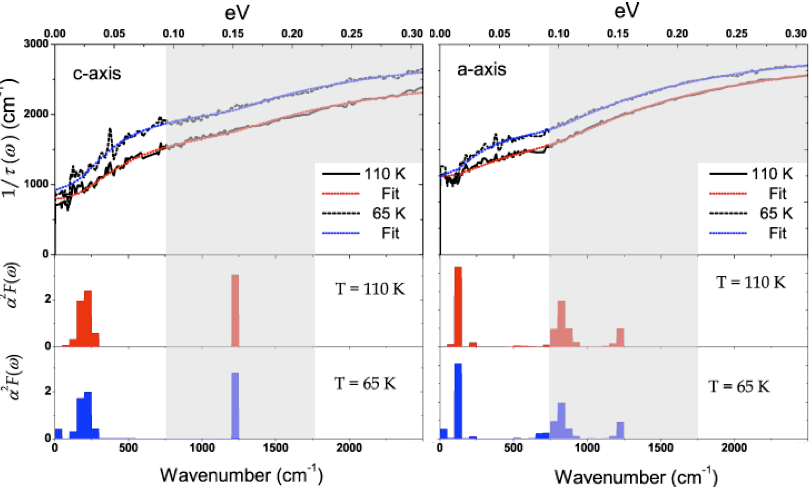
The result of the fitting procedure is presented in Fig. 11 where the experimental data at K and K are compared with those extracted from the fit. Since the phonon density of states and the electron-phonon coupling are in principle temperature dependent, all temperature dependence observed in and should be explained by the thermal factors of Eq. 5. An important consistency check on the strong coupling analysis is then to verify the temperature dependence of the output generated by the fit. Indeed, the resulting spectral densities, shown in the lower panels, are remarkably independent of temperature, thus confirming the correctness of the strong coupling model in the present case.
The results of the analysis are presented in Fig. 11: the frequency dependent scattering rate below 500 cm-1 originates from a mode centered at 200 cm-1 (c-axis), having a width of about 100 cm-1. Along the a-axis a peak is seen at 125 cm-1, with a width of 50 cm-1. As discussed in the introduction, due to the small Drude weight along the -axis interband transitions are particularly clearly visible in the -axis spectra in Fig. 8. While with the experimental information at hand we are not able to disentangle interband and intraband transitions unambiguously, both the -axis and -axis optical conductivities have absorption bands as low as 0.5 eV, possibly extending to much lower energy. The conspicuous curvature in the -axis scattering rate shown in Figure 10 is further indication that interband transitions mix in above approximately 65 meV. Hence part of the scattering contributions present in this frequency region is due to interband transitions overlapping with the tail of the Drude peak. The peaks generated by the fitting routine above 65 meV should therefore probably be disregarded disregarded as a physical contribution to .
(i) Concentrating now on the frequency range below 500 cm-1, we notice first of all, that is remarkably independent on temperature, despite the relative large changes seen in , , and . This is a strong indication, that the latter temperature dependence is correctly described by the thermal factors of the strong coupling formalism used here, which have their origin in the Fermi-Dirac statistics of the electrons at the Fermi-surface, and the Bose-distribution function of the phonons to which they are coupled.
(ii) In the second place we notice the occurrence of a conspicuous low-frequency (25 cm-1) mode in in the CDW phase. We believe that this mode is an artifact, which has been generated by attempting to fit gap-related features with a model which does not describe the gap. This implies that, while our analysis correctly provides , , and for , some caution is necessary for these quantities when . Artifacts imported by the incorrect treatment of the partial gapping of the Fermi surface turns out to be subtle: an unphysical zero-frequency mode appears in , and becomes unrealistically large. These problems do not affect the results for . The best estimate is therefore obtained for T=110 K, where along the most conducting direction (the c-axis) .
V The Charge Density Wave gap
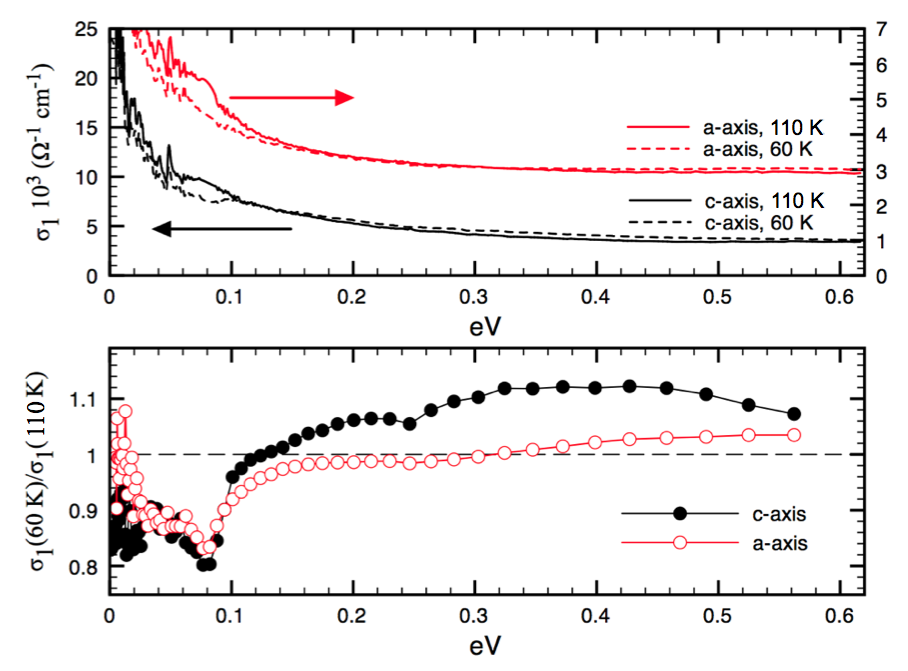
As pointed out in the previous section, the CDW gap related suppression of imports a subtle and unphysical zero-frequency contribution in the fitted . In order to single out the gap-related features in the optical conductivity spectra, we examine the relative change across the transition temperature. The evolution of across is summarized in the upper panel of Fig. 12. The low frequency spectra of the optical conductivity are plotted for 60 K (dotted lines) and 100 K (full lines). The optical conductivity of the Lu5Ir4Si10 sample becomes significantly reduced for frequencies below 80 meV when the material enters the CDW state. The most likely reason for this reduction is the opening of a CDW gap on part of the Fermi surface. The fact that the change in the optical conductivity appears in both polarization directions implies, that the Fermi velocities of the states which become gapped are not uniquely along the a or the c-direction. The ratio (lower panel of Fig. 12) highlights the CDW induced changes of , i.e. a suppression of below 80 meV while at higher energies the conductivity increases. This behavior is in qualitative agreement with a partly gapped Fermi surface, with a momentum dependent gap having a maximum value 80 meV. The partial gapping implies that the Fermi surface is at least strongly warped, or perhaps even entirely 3 dimensional. The decreased conductivity below the CDW gap is compensated by an increase of the conductivity above the gap due to direct optical transitions between occupied and empty bands of the translational symmetry broken CDW state. This gap value corresponds to the ratio , which is clearly much larger than the weak coupling value for an isotropic gap.
A recent infrared study (T = 147 K) of polycrystalline Lu5Rh4Si10 samplesliu2005 has also revealed a large gap over Tc ratio, , with a Fermi surface gapping of the order of 4%. Accordingly the Rh polymorph of Lu5Ir4Si10 can also be characterized as a strongly coupled CDW.
VI CDW induced change of free carrier density
Information on the temperature dependence of the carriers and the percentage of the CDW gapped part Fermi surface can be obtained from analyzing the optical spectral weight
| (7) |
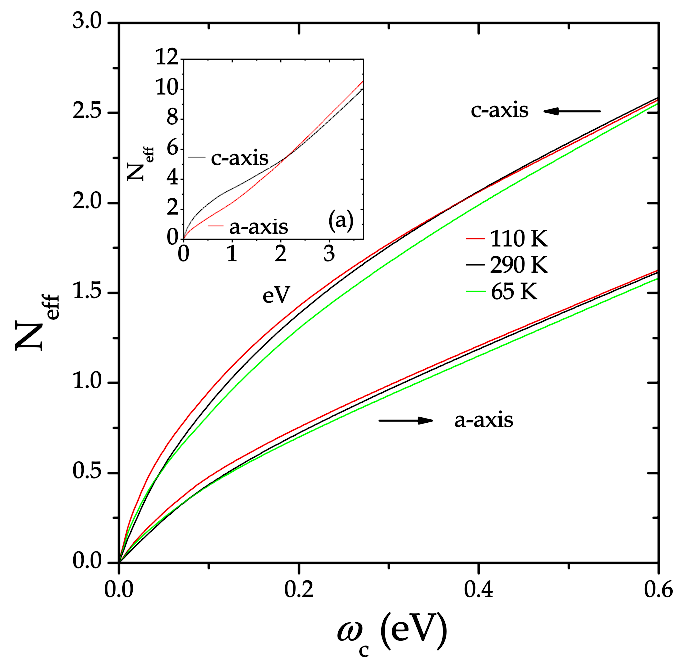
In the limit the effective number of charges should equal the total number of electrons in the system. The dynamics of crossing a transition temperature quantifies the redistribution of the carriers in the energy spectrum of the system. In Fig. 13 is plotted versus for three different temperatures and for the two polarization directions for eV; the inset shows the same quantity over the full measurement range for K. From the temperature dependence of , a noticeable drop in the SW function is clearly visible for both axis cooling the sample across indicating a reduction of effective number of carriers. Both along the and the -axis the low and high temperature merge at approximately 3 eV, which is equivalent to a full recovery of the SW.
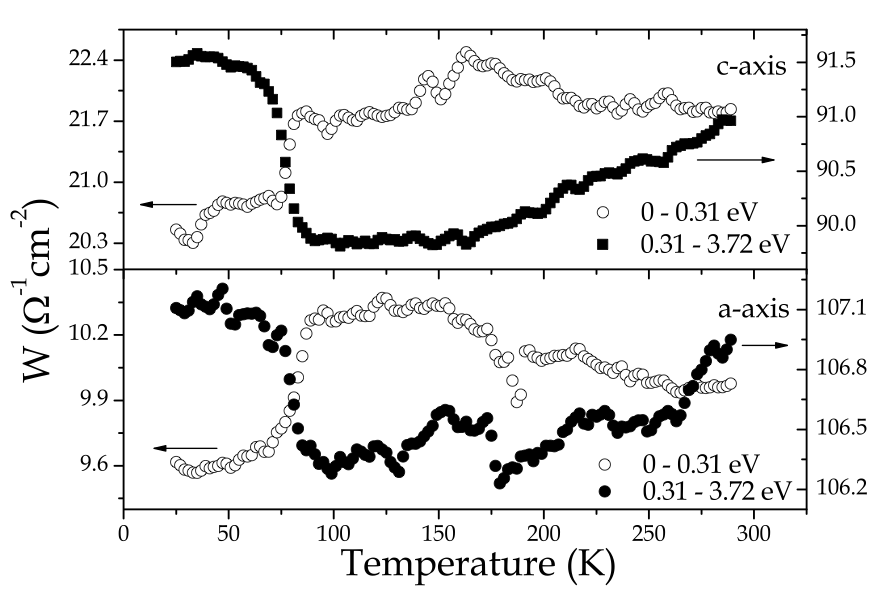
The SW for different temperatures is plotted in the inset of Fig. 14 for an eV along both crystal orientations. The graph shows that the low energy SW (represented with open markers) is decreasing abruptly below . The SW above (i. e. ) has the opposite behavior which suggests that the loss of SW at low frequencies is compensated by an increase of SW at higher energies. This behavior is consistent with the CDW model where the opening of a gap at the Fermi surface causes a spectral weight transfer from the region within the gap to the energy region of transitions across the CDW gap. The sudden change of spectral weight in a narrow temperature between 80 and 75 K implies that the CDW gap opens almost discontinuously at the phase transition.
Using the information given by the SW, we quantify the percentage of Fermi surface that becomes gapped at the transition by analyzing the temperature variation of the integrated optical spectral weight. For this purpose we define
| (8) |
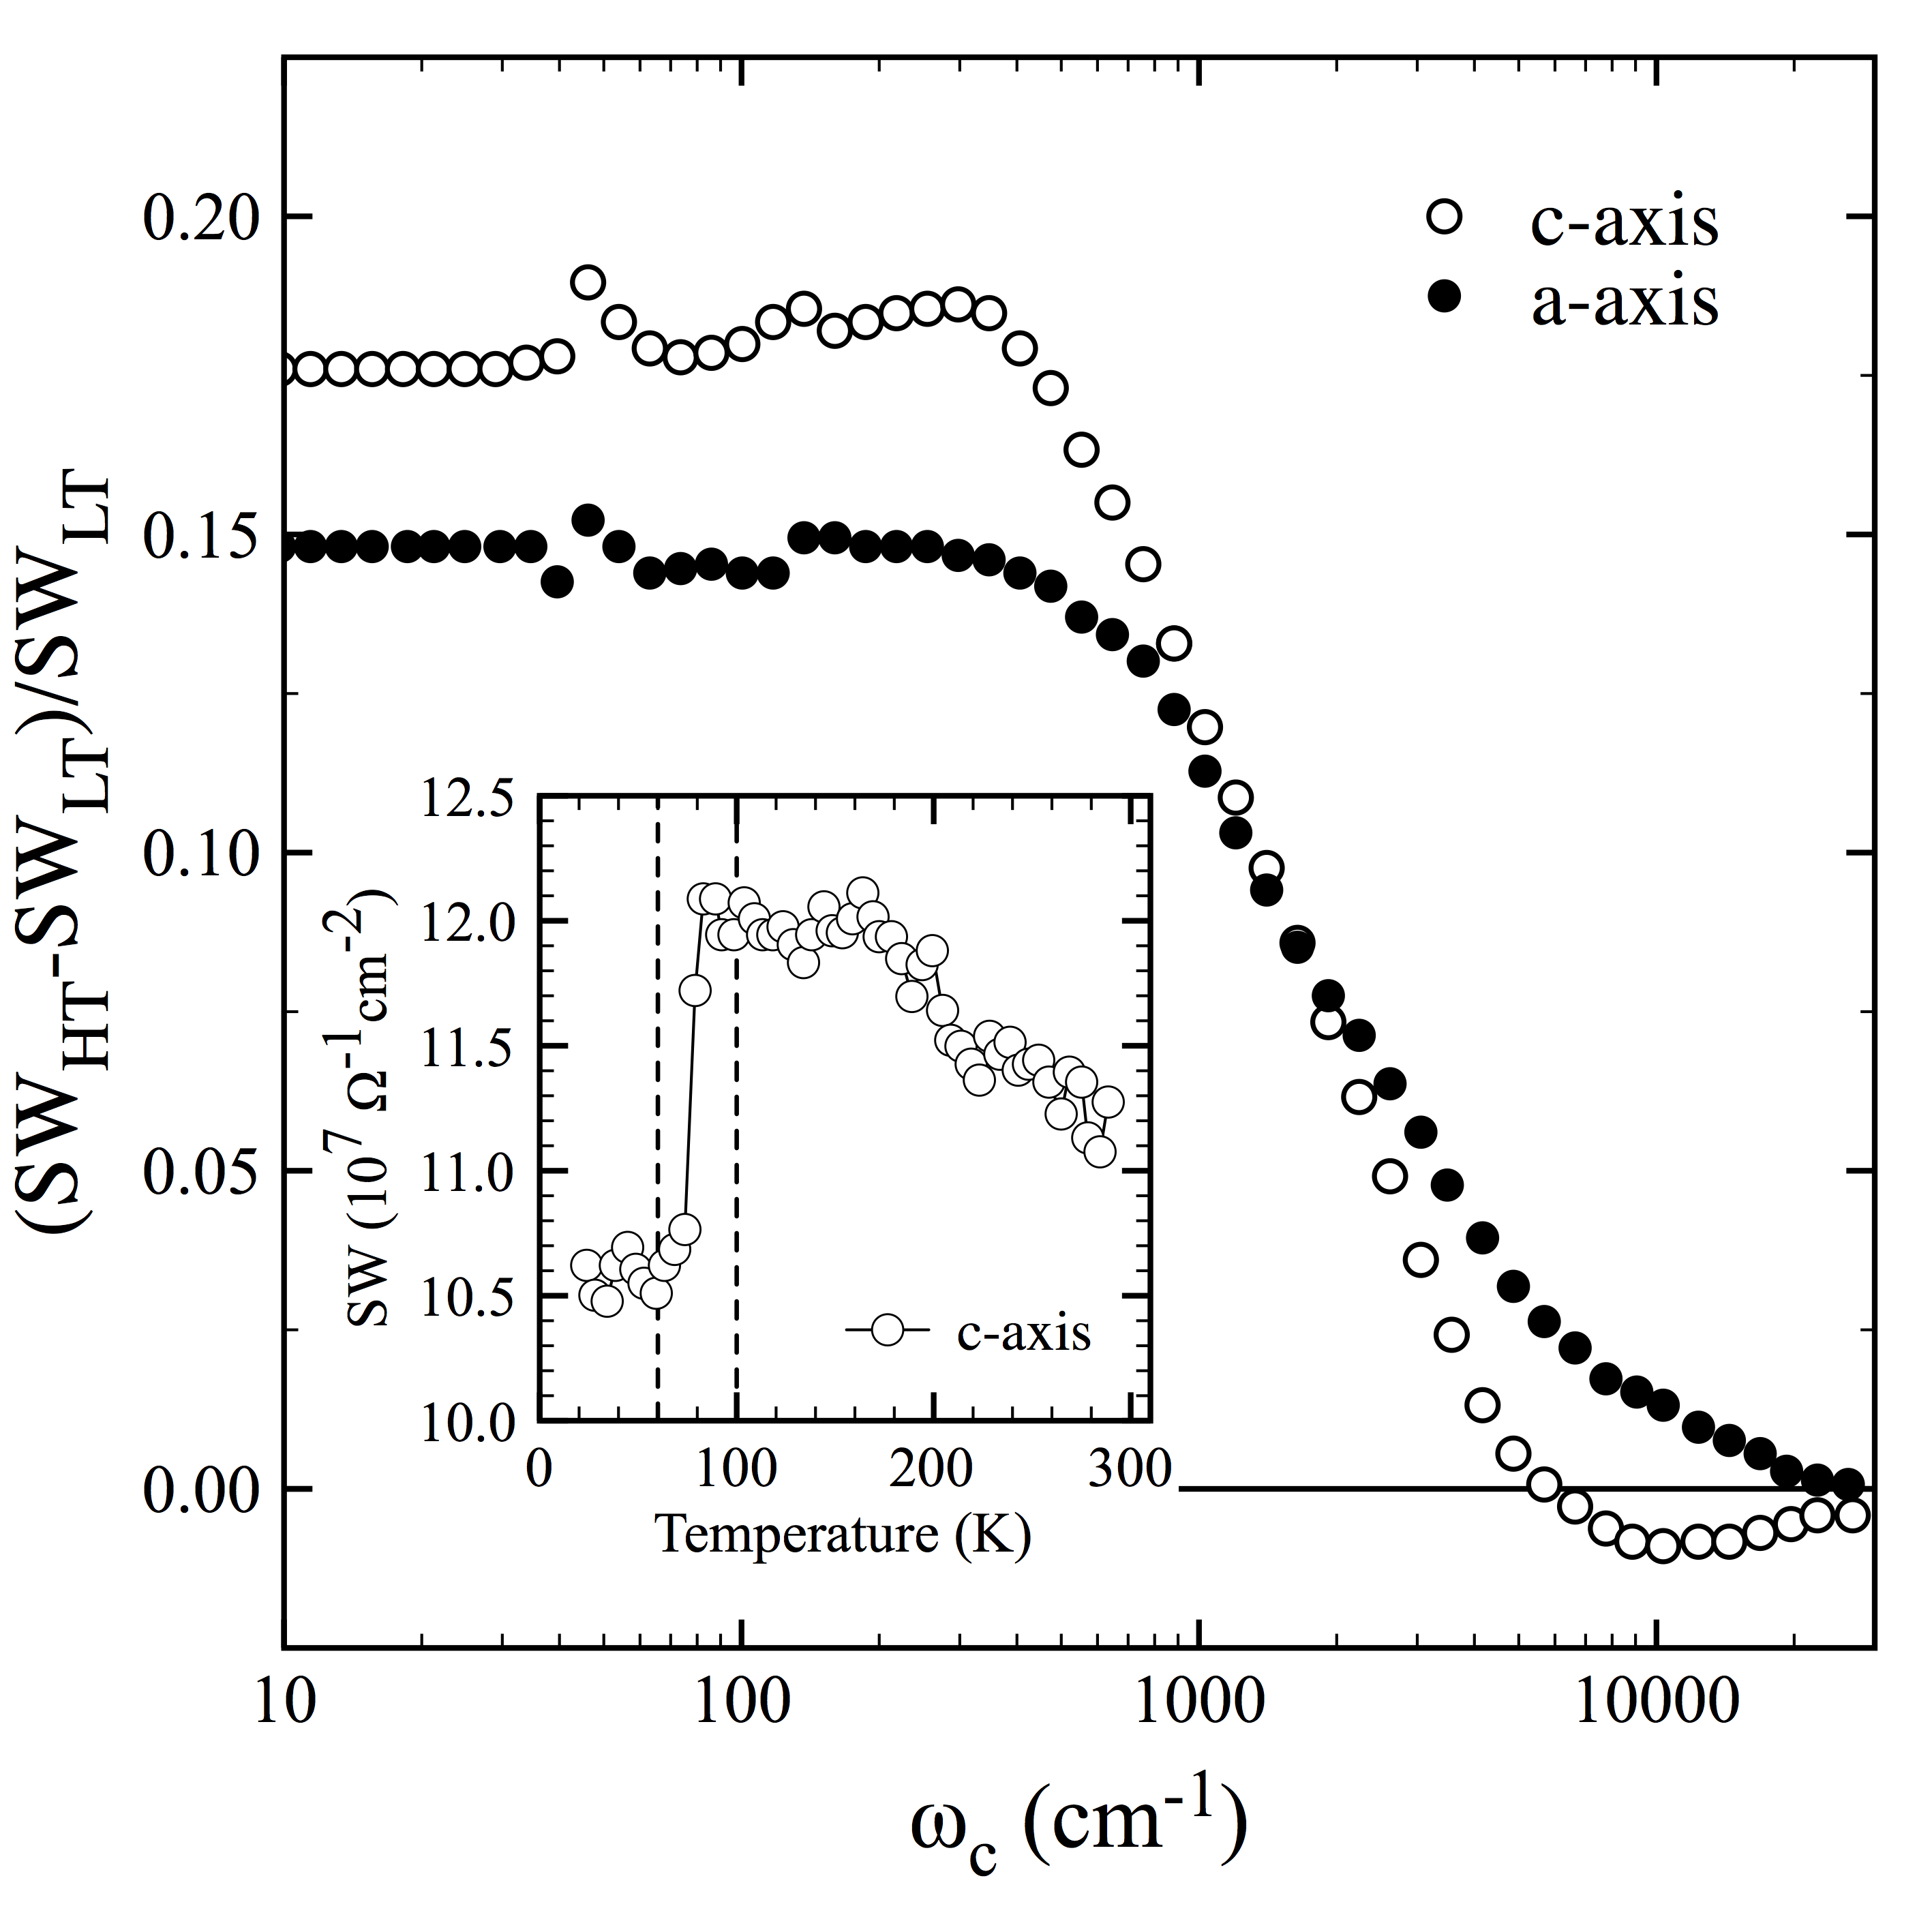
This quantity, shown in Fig. 15, vanishes for eV, because all low energy spectral weight removed by the gap is recovered at 3 eV. For energies larger than the Drude width and smaller than the gap corresponds to the percentage increase of carriers by closing the gap. The temperature dependence of SW is shown in the inset of Fig. 15 for meV (1000 cm-1 ): a clear drop in is visible at meaning that a certain amount of carriers is removed from the frequency region below and transferred at higher frequencies. We observed the same behavior along the a-axis. We see that all optical data imply a gap induced removal of about 15-17% of the free carrier spectral weight. Based on the increase of the superconducting temperature at the critical pressure of 21 kbar, Shelton et al.shelton1986 estimated that 36 % of Fermi surface which becomes gapped by the CDW. In view of the indirectness of this method, the latter value is not inconsistent with the 15-17 % change in free charge carrier density obtained from the optical spectral weight analysis.
VII Conclusions
We have studied the optical response of two members of the RE5Ir4Si10 family: Lu5Ir4Si10 and Er5Ir4Si10. The experimentally determined temperature dependent optical constants showed, for both samples, sudden, first order like, changes at . This behaviour has been observed also in other experiments kuo01 ; becker99 and indicates the absence of fluctuations which characterize a CDW system of weakly coupled one-dimensional chains, and the presence of a positive feedback mechanism in the CDW order, probably resulting from a coupling of the CDW order parameter to a static periodic modulation of the lattice parameter. This observation is compatible with the observation, that the entropy change at the CDW transition in Lu5Ir4Si10 is dominated by strong phonon contributions. Both samples of the RE5Ir4Si10 family have optical characteristics of an 3D material with modest anisotropy of the plasma frequencies and effective mass of the conduction electrons, although the observed CDW transition clearly indicates that some () portions of the Fermi surface are nested below . The Eliashberg function was obtained from a fit for both crystallographic directions, showing clear evidence for strong coupling () of the electrons to phonons centered at 30 meV. From a careful analysis of the free carrier spectral weight, we estimated the amplitude of the CDW gap to be 80 meV, implying .
VIII Acknowledgments
We gratefully acknowledge stimulating discussions with F. Marsiglio and S. Ramakrishnan. This work is supported by the Swiss National Science Foundation through Grant No. 200020-113293 and the National Center of Competence in Research (NCCR) Materials with Novel Electronic Properties-MaNEP.
References
- (1) R. E. Peierls, “Quantum Theory of Solids” Oxford University Press (1955)
- (2) G. Gruner, “Density waves in solids” Perseus Publishing (1994)
- (3) L. Degiorgi and B. Alavi and G. Mihaly and G. Gruner, Phys. Rev. B 44, 7808 (1991)
- (4) G. Travaglini and P. Wachter, Solid State Comm. 1981, 559 (1981)
- (5) G. Travaglini and P. Wachter, Phys. Rev. B 30, 1971 (1984)
- (6) A. Fournel and J. P. Sorbier, M. Konczykowski, P. Monceau, Phys. Rev. Lett. 57, 2199 (1986)
- (7) A. Perucchi, L. Degiorgi and R. E. Thorne, Phys. Rev. B 69, 195114 (2004)
- (8) S. Sridhar, D. Reagor and G. Gruner, Phys. Rev. Lett. 55, 1196 (1985)
- (9) T. Giamarchi, S. Biermann, A. Georges and A. Lichtenstein, J. de Physique IV, 114, 23 (2004)
- (10) W. Henderson, V. Vescoli, P. Tran, L. Degiorgi and G. Gruner, Eur. Phys. J. B 11, 365 (1999)
- (11) A. Schwartz, M. Dressel, G. Gruner, V. Vescoli, L. Degiorgi and T. Giamarchi, Phys. Rev. B 58, 1261 (1998)
- (12) W. L. McMillan, Phys. Rev. B 16, 643 (1977)
- (13) V. Vescoli, L. Degiorgi, H. Berger and L. Forro, Phys. Rev. Lett. 81, 453 (1998).
- (14) S. Ramakirshnan, and J.A. Mydosh, J. Magn. Magn. Materials 310, 207 (2007).
- (15) B. Becker, N. G. Patil, S. Ramakrishnan, A. A. Menovsky, G. J. Nieuwenhuys, J. A. Mydosh, M. Kohgi, and K. Iwasa, Phys. Rev. B 59, 7266 (1999).
- (16) M. H. Jung, H. C. Kim, A. Migliori, F. Galli and J. A. Mydosh, Phys. Rev. B 68, 132102 (2003)
- (17) Y. K. Kuo, C. S. Lue, F. H. Hsu, H. H. Li and H. D. Yang, Phys. Rev. B 64, 125124 (2001)
- (18) A. A. Menovsky and J. J. M. Franse, J. Cryst. Grouth 65, 286 (1983)
- (19) A. B. Kuzmenko, Rev. Sci. Instrum. 76, 083108 (2005)
- (20) I. Bozovic, Phys. Rev. B textbf42, 1969 (1990).
- (21) T. W. Kim, S. Donovan, G. Gruner and A. Philipp, Phys. Rev. B 43, 6315 (1991)
- (22) F. Galli, S. Ramakrishnan, T. Taniguchi, G. J. Nieuwenhuys, J. A. Mydosh, S. Geupel, J. Ludecke and S. van Smaalen, Phys. Rev. Lett. 85, 158 (2000)
- (23) W. Goetze, P. Woelfle, Phys. Rev. B, 6, 1226 (1972).
- (24) J. W. Allen, and J.C. Mikkelsen, Phys. Rev. B 15, 2952 (1977).
- (25) T. Valla, A. V. Fedorov, P. D. Johnson and S. L. Hulbert, Phys. Rev. Lett. 83, 2085 (1999)
- (26) J. W. van der Eb, A. B. Kuzmenko and D. van der Marel, Phys. Rev. Lett. 86, 3407 (2001).
- (27) S. V. Dordevic, D. N. Basov, R. C. Dynes, and E. Bucher, Phys. Rev. B 64, 161103(R) (2001)
- (28) S. V. Dordevic, D. N. Basov, R. C. Dynes, B. Ruzicka, V. Vescoli, L. Degiorgi, H. Berger, R. Gaal and L. Forro, Eur. Phys. J. B 33, 15 (2003)
- (29) T. Valla, A. V. Fedorov, P. D. Johnson, J. Xue, K. E. Smith and F. J. DiSalvo, Phys. Rev. Lett. 85, 4759 (2000)
- (30) D. N. Basov, E. J. Singley and S. V. Dordevic, Phys. Rev. B 65, 054516 (2002)
- (31) A. V. Puchkov, D. N. Basov and T. Timusk, J. Phys.: Condens. Matter 8, 10049 (1996)
- (32) T. Holstein, Ann. Phys. (N. Y.) 29, 410 (1964).
- (33) Allen, P.B. Electron-phonon effects in the infrared properties of metals, Phys. Rev. B 3, 305 (1971)
- (34) O. Dolgov and S. Shulga, J. Supercond. 8, 611 (1995)
- (35) G. M. Eliashberg, Sov. Phys. JETP 11, 696 (1960)
- (36) G. M. Eliashberg, Sov. Phys. JETP 16, 780 (1963)
- (37) H. L. Liu, G. S. Wu, J. L. Her and H. D. Yang, Phys. Rev. B 72, 205102 (2005)
- (38) R. N. Shelton, L. S. Hausermann-Berg, P. Klavins, H. D. Yang, M. S. Anderson and C. A. Swenson, Phys. Rev. B 34, 4590 (1986)