Extrinsic and intrinsic nucleosome positioning signals
Abstract
In eukaryotic genomes, nucleosomes function to compact DNA and to regulate access to it both by simple physical occlusion and by providing the substrate for numerous covalent epigenetic tags. While nucleosome positions in vitro are determined by sequence alone, in vivo competition with other DNA-binding factors and action of chromatin remodeling enzymes play a role that needs to be quantified. We developed a biophysical model for the sequence dependence of DNA bending energies, and validated it against a collection of in vitro free energies of nucleosome formation and a nucleosome crystal structure; we also successfully designed both strong and poor histone binding sequences ab initio. For in vivo data from S.cerevisiae, the strongest positioning signal came from the competition with other factors. Based on sequence alone, our model predicts that functional transcription factor binding sites have a tendency to be covered by nucleosomes, but are uncovered in vivo because functional sites cluster within a single nucleosome footprint, making transcription factors bind cooperatively. Similarly a weak enhancement of nucleosome binding in the TATA region for naked DNA becomes a strong depletion when the TATA-binding protein is included, in quantitative agreement with experiment. Predictions at specific loci were also greatly enhanced by including competing factors. Our physically grounded model distinguishes multiple ways in which genomic sequence can influence nucleosome positions and thus provides an alternative explanation for several important experimental findings.
1 Introduction
Genomic DNA is packaged into chromatin in eukaryotic cells. The building block of chromatin is the nucleosome, [1] a 147 base pair (bp) DNA segment wrapped in superhelical coils on the surface of a histone octamer. [2] The unstructured tails of the histones are the targets of numerous covalent modifications [1] and may influence how the ordered nucleosome array folds into higher order chromatin structures. Chromatin can both block access to DNA [3] and juxtapose sites far apart on the linear sequence. [4]
The regulation of gene expression by DNA-bound factors can be partially understood from their binding energies and thermodynamics. Nucleosomes formation energies vary by about 5 kcal/mol in vitro, [5] comparable to the variation of DNA-binding energies in other factors. It is then natural to ask whether the locations of nucleosomes in vivo can be predicted thermodynamically, either in isolation or in competition with other DNA-binding factors. Under this scenario, the role of chromatin and its remodeling enzymes would be catalytic, modifying the rate of assembly but not the final disposition of factors on DNA. The alternative is that chromatin remodeling within a regulatory unit actively positions nucleosomes to control access to the DNA, in analogy with motor proteins.
It has not been possible to quantify by genetics where living cells fall between these extremes. Recent computational approaches [6, 7, 8] have used collections of DNA positioning sequences isolated in vivo to train pattern matching tools that were then applied genome-wide. However, the training data may not be representative of direct histone-DNA binding if other factors reposition nucleosomes in vivo by exclusion. Furthermore, models based on alignments of nucleosome positioning sequences [6, 7] require a choice of background or reference sequence and it is known that nucleotide composition varies among functional categories of DNA.
2 Results and Discussion
Biophysical model of a nucleosome core particle. For these reasons we developed a biophysical model for nucleosome formation that resolves the energy into the sum of two potentials modeling the core histone-DNA attraction and the intra-DNA bending energy. The first potential is assumed to be independent of the DNA sequence since there are few direct contacts between the histone side chains and DNA bases. [9] For the DNA bending, we constructed an empirical quadratic potential [10, 11] using a database of 101 non-homologous, non-histone protein-DNA crystal structures.
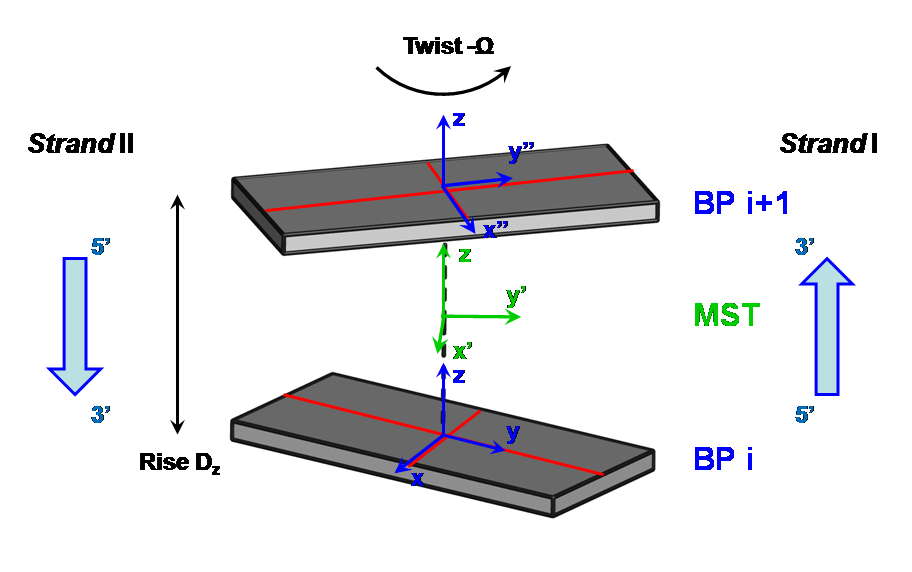
More specifically, we model DNA base stacking energies by defining three displacements (rise, shift, and slide) and three rotation angles (twist, roll and tilt) for each dinucleotide (Fig. 1a). [10] Together the six degrees of freedom completely specify the spatial position of bp in the coordinate frame of bp (Supporting Information (SI) Fig. 7). Geometric transformations based on these degrees of freedom can be applied recursively to reconstruct an arbitrary DNA conformation in Cartesian coordinates. Conversely, the atomic coordinates in a crystal structure allow the inference of the displacements and rotations for each dinucleotide (SI Methods). The elastic force constants in the quadratic DNA bending energy are inferred from the protein-DNA structural data by inverting a covariance matrix of deviations of dinucleotide geometric parameters from their average values. [10] Strongly bent dinucleotides (with one or more geometric parameters further than 3 standard deviations from the mean) are iteratively excluded from the data set (SI Methods). Our model does not use any higher order moments of empirical geometry distributions, which would lead to a non-quadratic elastic potential; nor are there sufficient data to model more than successive base pairs.
We assume that the histone-DNA potential is at minimum along an ideal superhelix whose pitch and radius are taken from the nucleosome crystal structure, [2] and varies quadratically when the DNA deviates from the superhelix. This sequence-independent term represents the balance between the average attractive electrostatic (and other) interactions between the histones and the DNA phosphate backbone, [12] and steric exclusion between the proteins and DNA.
The sum of the bending and histone-DNA potentials is minimized to yield the elastic energy and the dinucleotide geometries for each nucleosomal sequence (see Methods). Because the total energy is quadratic, energy minimization is equivalent to solving a system of linear equations and thus the algorithm can be applied on a genome-wide scale. There is no background in this model, but the results may depend on the choice of the protein-DNA structural data set. Since our bending energy is empirical and inferred from co-crystal structures, it lacks a physical energy scale. By comparison with the worm-like chain model our units can be converted to kcal/mol through multiplication by 0.26 (SI Methods). We position multiple nucleosomes and proteins bound to DNA using standard thermodynamics and enforce steric exclusion between bound entities in any given configuration (SI Methods). Our program DNABEND can compute the sequence-specific energy of DNA restrained to follow an arbitrary spatial curve.
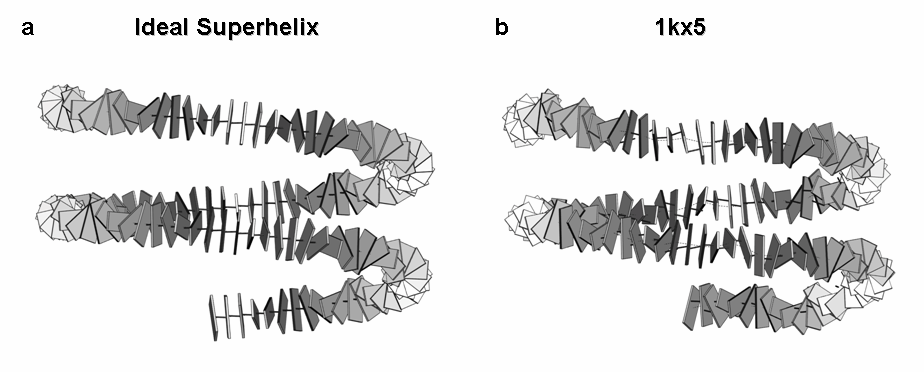
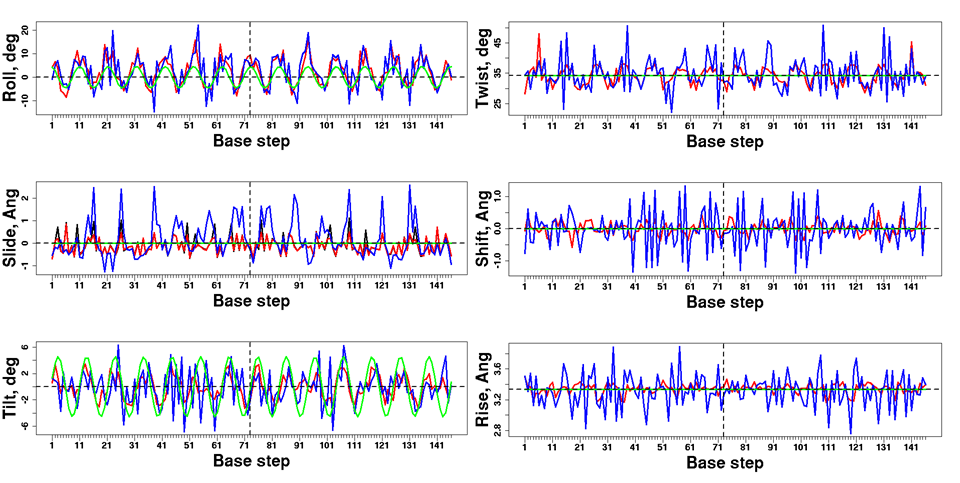
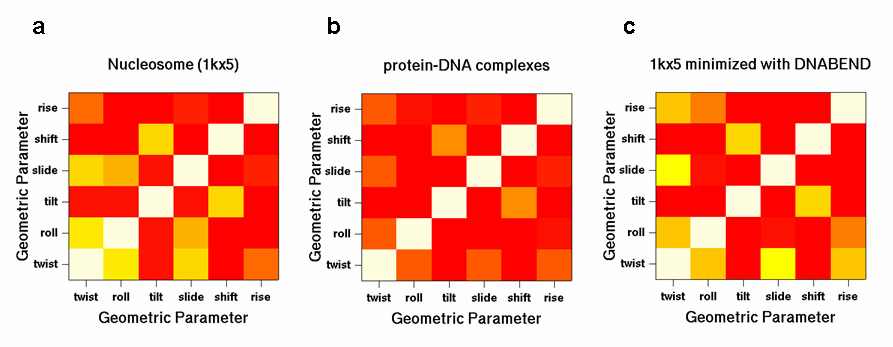
Analysis of DNA geometries from the nucleosome crystal structure. One way to validate DNABEND is to predict the DNA conformation in the high-resolution (1.9 Å) nucleosome crystal structure [2] (PDB code 1kx5) using only the DNA sequence. The DNABEND predictions are significantly correlated with the experimental geometries for twist, roll, tilt and slide (), but are less successful for shift and rise (SI Fig. 10), although the peak positions are generally correct. DNABEND does not reproduce rapid shift oscillations in the region between bps 35 and 105, and underestimates the magnitude of observed deviations in rise and slide. We under-predict slide since for certain key base pairs our training structures imply a much smaller mean value of slide (e.g. 0.18 Å for CA steps) than that observed in the nucleosome structures (0.91 Å for CA steps). Changing just this one mean value gives more reasonable magnitudes of slide (SI Fig. 10, black curve). Tolstorukov et al. also observed that slide is large and positive in the nucleosome crystal structure, and makes a significant contribution to the superhelical trajectory. [13] Because nucleosomal DNA is highly bent, different degrees of freedom are strongly coupled (SI Fig. 11a): for example, base pairs tend to tilt and shift simultaneously to avoid a steric clash. These couplings are much less pronounced in the non-histone protein-DNA complexes used to derive the elastic energy model (SI Fig. 11b), but nonetheless appear prominently when the 1kx5 DNA is positioned by DNABEND (SI Fig. 11c).
Analysis of available nucleosome crystal structures shows that the tight DNA wrapping is facilitated by sharp DNA kinks if flexible dinucleotides (e.g. 5’-CA/TG-3’ or 5’-TA-3’) are introduced into the region where the minor groove faces the histone surface. For other sequences and other structural regions the bending is distributed over several dinucleotides. [2] We substituted all possible dinucleotides into the 1kx5 atomic structure (keeping DNA conformation fixed), and computed the elastic energy for each sequence variant. The most sequence specific regions are those where the minor groove faces the histone octamer (SI Fig. 8a). The specificity is especially dramatic if DNA is kinked (e.g. at positions 109, 121 and 131; SI Fig. 10). [2] Although these positions are occupied by CA/TG dinucleotides in the crystal structure, the model assigns the lowest energy to TA dinucleotides, consistent with the periodic TA signal previously observed in good nucleosome positioning sequences [14] (SI Fig. 8b).
Comparison with in vitro measurements. DNABEND accurately predicts experimental free energies of nucleosome formation [5, 15, 16] (Fig. 2a, SI Fig. 12a). In contrast, the alignment model of Segal et al. [6] trained on yeast nucleosomal sequences has little predictive power for the sequences in this set, most of which were chemically synthesized. DNABEND also correctly ranks sequences selected in vitro for their ability to form stable nucleosomes, or to be occupied by nucleosomes in vivo (Fig. 2b). [17, 6] Because the alignment model is constructed using the latter set it assigns anomalously low (more favorable) energies to some of the sequences from it, and higher (less favorable) energies to the artificial sequences known from experiment to have excellent binding affinities. [17, 5] Finally, DNABEND correctly ranks mouse genome sequences selected in vitro on the basis of their high or low binding affinity [18, 19] (), whereas the alignment model has less resolution (), though on average it does assign better scores to the high affinity set (SI Fig. 12b).
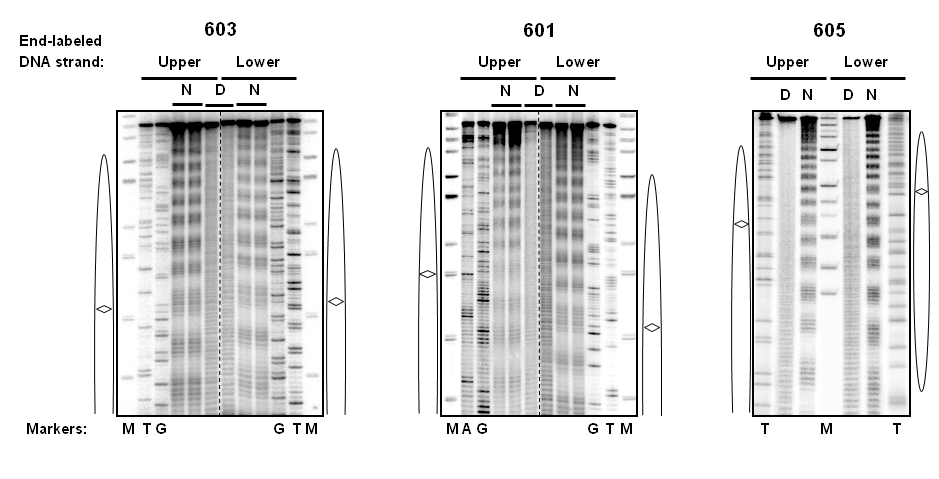
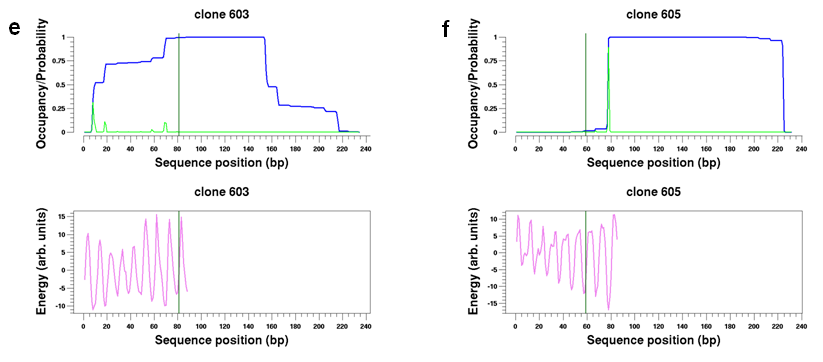
A further test of how DNABEND actually positions nucleosomes on DNA can be provided by a collection of sequences where in vitro positions are known with 1-2 bp accuracy. We have determined nucleosome positions on synthetic high-affinity sequences 601, 603, and 605 [17] using hydroxyl radical footprinting (SI Figs. 13 and 14), and obtained 3 more sequences from the literature. [13] The measured position is always within 1-2 bp of a local minimum in our energy, and that energy minimum in 5 out of 6 cases is within 0.5-1.0 kcal/mol of the global energy minimum (SI Fig. 15; note that the total range of sequence-dependent binding energies is kcal/mol).
We also asked if DNABEND could be used to design DNA sequences with high and low binding affinities for the histone octamer. Free energies of computationally designed sequences were measured in vitro using salt gradient dialysis [5, 20] (SI Table 1, SI Methods). The free energy of the designed best sequence was lower than the free energy of the designed worst sequence, although only by 1.6 kcal/mol, which is less than the experimentally known range of free energies (SI Table 1, SI Fig. 12a). These results underscore both the ranking power and the limitations of our current DNA mechanics model.
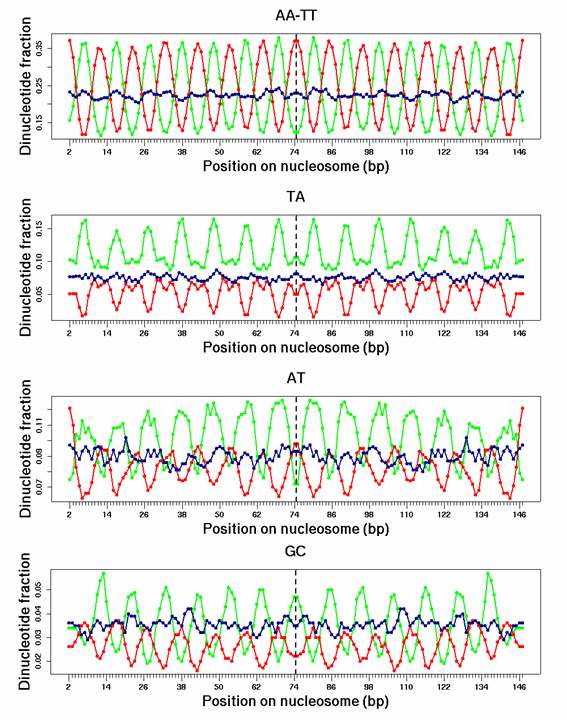
Periodic dinucleotide distributions in high and low energy sequences. DNABEND-selected nucleosome sequences exhibit periodic dinucleotide patterns that are consistent with those determined experimentally: [17] for example, with lowest energy sequences, 5’-AA/TT-3’ and 5’-TA-3’ dinucleotide frequencies are highest in the negative roll regions (where the minor groove faces inward), while 5’-GC-3’ frequencies are shifted by bp (SI Fig. 16). Surprisingly, the distributions of AT and AA/TT, TA dinucleotides are in phase, despite a very low flexibility of the former (SI Fig. 8b). It is possible that AT steps are used to flank a more flexible kinked dinucleotide. We estimate the energy difference between the best and the worst 147 bp nucleosome forming sequences to be 15.2 kcal/mol, with the energies of 95% of genomic sequences separated by less than 6.4 kcal/mol (SI Methods). This is larger than the experimental range (SI Fig. 12a) because nucleosomes cannot be forced in experiments to occupy the worst-possible location on a DNA, but instead tend to find the most favorable locations with respect to the 10 bp helical twist.
Prediction of nucleosome positions in the yeast genome. We use nucleosome energies (computed using the 147 bp superhelix) and the binding energies of other regulatory factors to construct a thermodynamic model in which nucleosomes form while competing with other proteins for access to genomic sequence. A typical configuration thus contains multiple DNA-bound molecules of several types and explicitly respects steric exclusion. We take all such configurations into account using dynamic programming methods [21] that enable us to compute a Boltzmann-weighted statistical sum and thus the probability for each factor to bind DNA starting at every possible position along the genome (Fig. 1b, SI Methods). [6] We also compute the occupancy of each genomic bp, defined as its probability to be covered by any protein of a given type (Fig. 1b). There are two adjustable parameters for each DNA-binding factor: the temperature, which determines how many factors are bound with high probability, and the free protein concentration, which determines the average occupancy. With our choice of parameters (which have not been optimized, rather, were fixed to allow for comparison with previous studies - SI Methods), the average nucleosome occupancy is 0.797, and stable, non-overlapping nucleosomes (with ) cover 16.3% of the yeast genome.
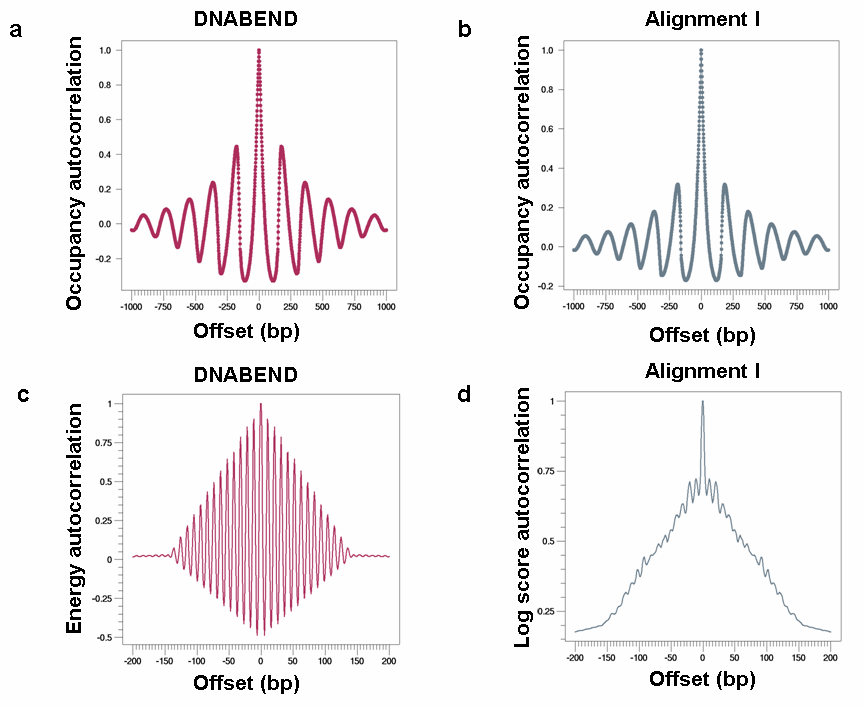
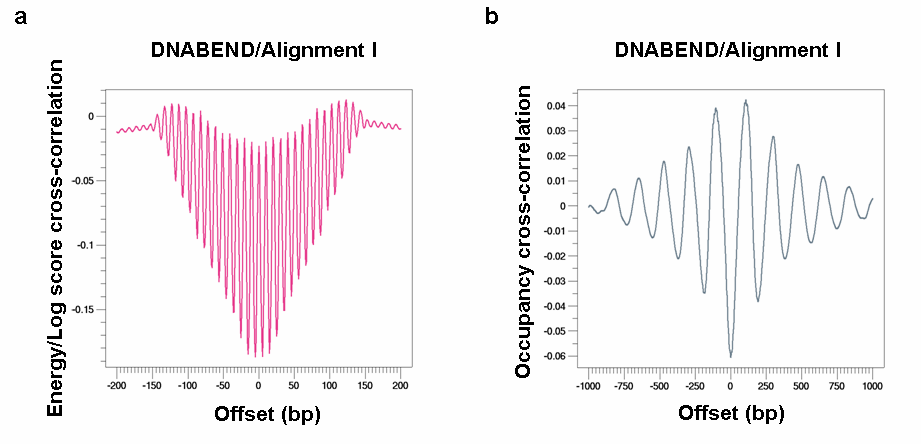
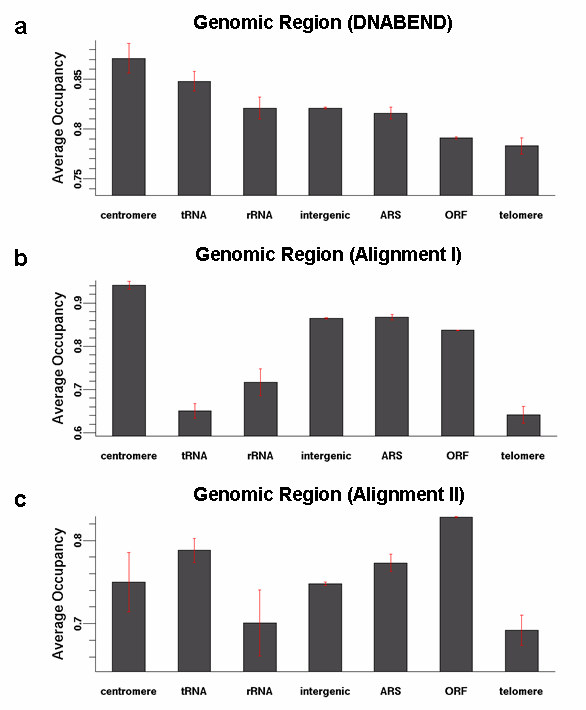
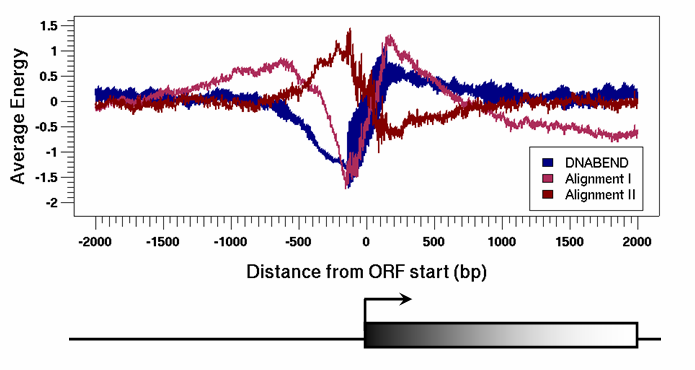
Bioinformatic models based on alignments of nucleosome positioning sequences. Several existing analyses of nucleosome positions are based on alignment models, and these in turn explicitly [6] or implicitly [7] include a background model. We examined the sensitivity of one alignment-based approach to the choice of background by implementing it in two different ways: alignment model I is identical to Segal et al. [6] and uses genomic background for one strand and uniform background for the other, while alignment model II employs genomic background for both strands (SI Methods). Comparing two models allows us to separate more robust predictions from those that depend strongly on the implementation details. Although the alignment models correlate well with each other (), we find a small negative correlation between DNABEND-predicted occupancies and energies and those from the alignment model I (SI Fig. 18). DNABEND energies are strongly correlated if two nucleosomes are separated by a multiple of 10 bp, and anti-correlated if the nucleosomes are separated by a multiple of 5 bp, which puts the helical twist out of phase (SI Fig. 17c). Log scores predicted by the alignment model exhibit weaker oscillations (SI Fig. 17d), probably due to ambiguities in aligning the training sequences.
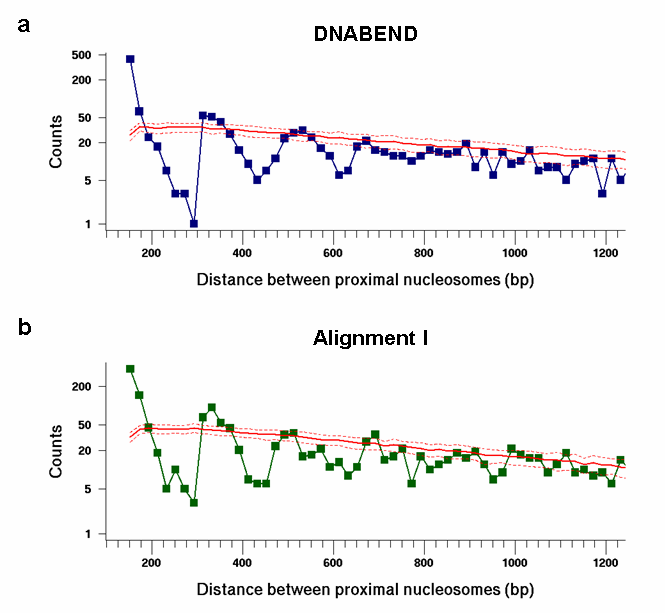
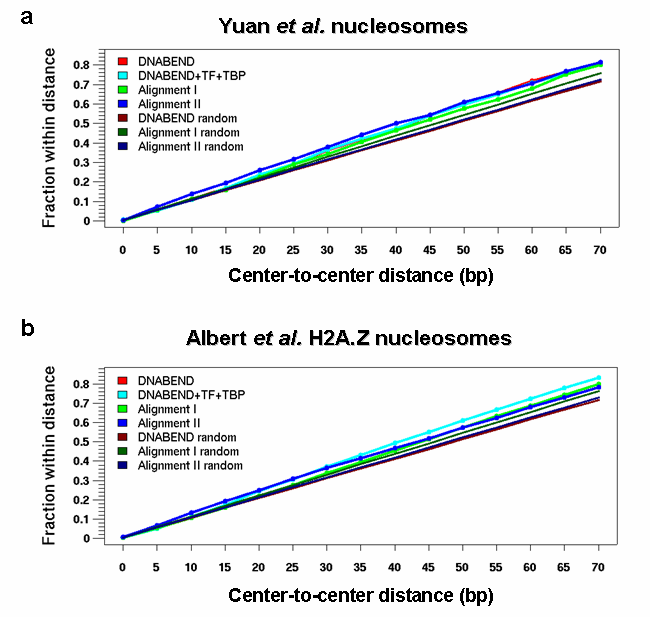
Because all three models make somewhat different predictions of average nucleosome occupancies in broad genomic regions (SI Fig. 19), additional experimental data are required to establish which model is the most accurate. In contrast, all models predict that the distribution of center-to-center distances between proximal stable nucleosomes (with ) exhibits strong periodic oscillations (SI Fig. 20). However, similar oscillations occur in a non-specific model where we first create a regular nucleosomal array and then randomly label a given fraction of nucleosomes as stable (data not shown). Because steric exclusion is respected by every model, nucleosomes form regular arrays (SI Figs. 17a,b) which help induce the observed periodicity in the positions of stable nucleosomes.
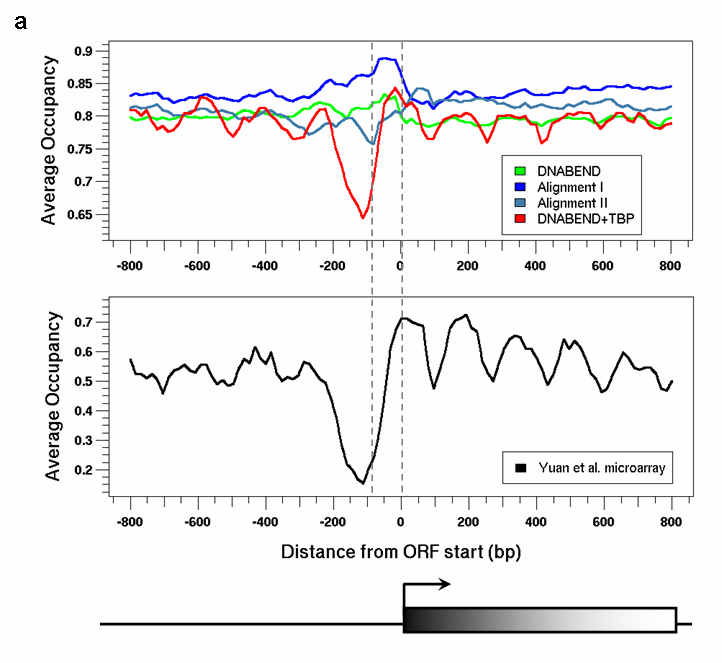
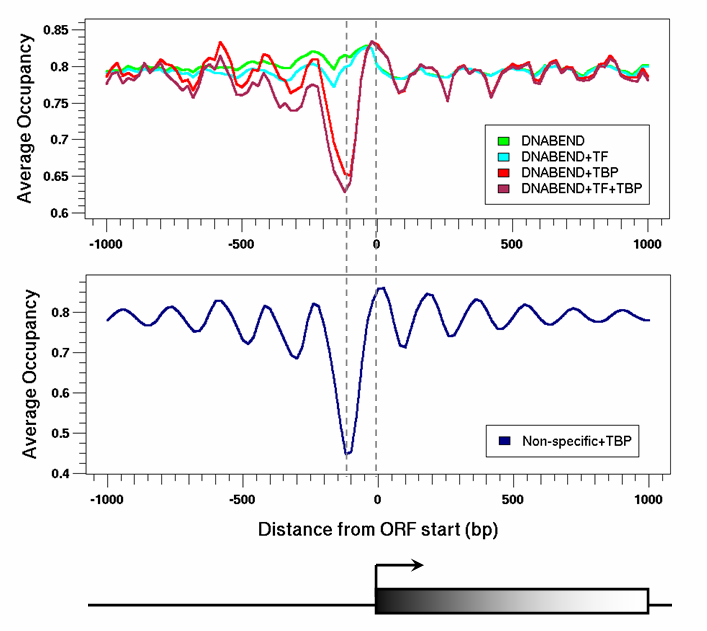
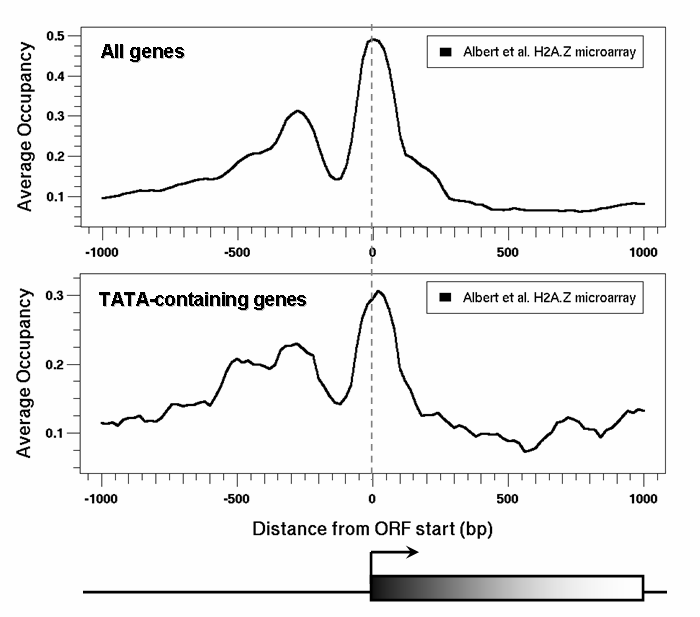
Nucleosome depletion upstream of the ORFs. Microarray-based maps of in vivo nucleosome positions show striking depletion of nucleosomes from the promoter regions (Fig. 3a). [22, 23] We find that this depletion is difficult to explain using nucleosome models alone. However, the nucleosome-free region upstream of the open reading frames (ORFs) becomes much more pronounced when TATA box-binding proteins (TBPs) and other factors bind their cognate sites (Fig. 3a, SI Fig. 21). Displaced nucleosomes are re-arranged in regular arrays on both sides of factor-occluded sites, [24, 25] creating the characteristic oscillatory structure around the nucleosome-free region which includes the occupancy peak over the translation start observed in both regular [22] and H2A.Z [26] nucleosomes (Fig. 3a and SI Fig. 22). Similar oscillations occur when non-specific nucleosomes compete with TBP (SI Fig. 21), making intrinsic nucleosome sequence preferences hard to disentangle from the larger phasing effects in this data set.
Nucleosome occupancy of TATA boxes. Nonetheless, nucleosome stabilities can play a crucial role in gene activation: for example, DNABEND predicts that both TATA boxes in the promoter of the yeast MEL1 (-galactosidase) gene are occupied by a stable nucleosome, in agreement with the extremely low level of background gene expression observed in MEL1 promoter-based reporter plasmids [27, 28] (Fig. 1b). In contrast, the TATA elements of the CYC1 promoter were shown to be intrinsically accessible in vivo, [30, 29] resulting in high background expression levels. Consistent with these findings, we predict that one of the CYC1 TATA boxes has intrinsically low nucleosome occupancy, and moreover that the nucleosome is easily displaced in competition with TBP (Fig. 1b).
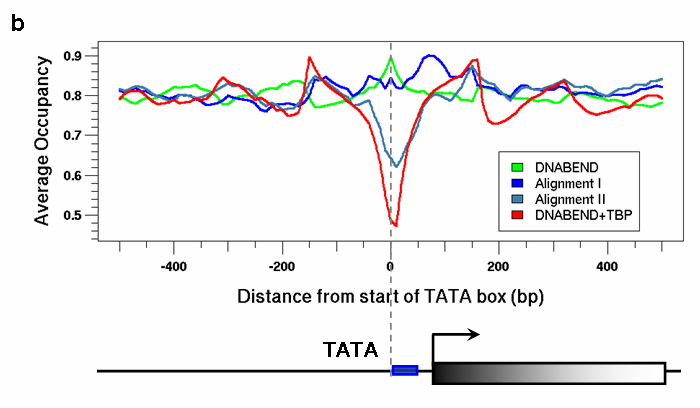
It has been suggested that TATA box-containing genes may be repressed through steric exclusion of TBP by a nucleosome placed over the TATA box. [31] In agreement with this hypothesis, in the absence of other factors DNABEND predicts slightly higher nucleosome occupancy over TATA boxes (Fig. 3b). Stress-induced genes are TATA-rich and may be nucleosome-repressed under non-stress conditions. [31] Thus, this prediction of DNABEND can be tested experimentally by measuring nucleosome occupancy over TATA boxes of stress-induced genes in non-inducing conditions, genome-wide (to ensure adequate statistics which were not provided by the data sets available to us, [22] although it was found in a very recent genome-wide study of nucleosome occupancy in yeast that promoters of stress-induced genes tend to be covered by nucleosomes when cells are grown in YPD media, whereas the transcription start site for the typical gene was nucleosome-free [32]).
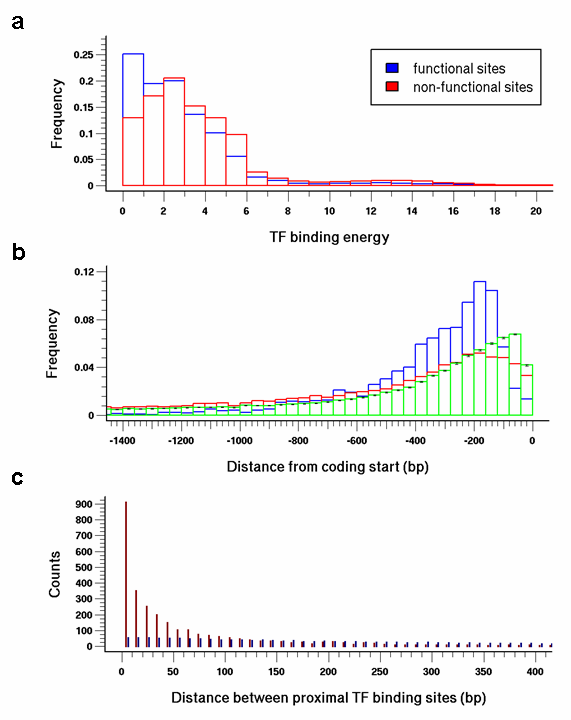
Nucleosome-induced TF cooperativity and nucleosome depletion over TF binding sites. It has been known from chromatin immunoprecipitation experiments that some near-consensus DNA sequences are not occupied by their cognate transcription factors (TFs), while poorer sites may be occupied. [33] Thus it is natural to ask whether histone binding preferences can help distinguish functional and non-functional TF binding sites. Segal et al. found that nucleosome occupancy was intrinsically smaller at functional sites [6] (SI Fig. 24a), while DNABEND predicts the opposite (Fig. 4a, upper panel) (but see contrary low resolution data from Liu et al. [35]). However, if TFs are allowed to compete with nucleosomes at all sites, the nucleosomes become preferentially depleted (and the TF occupancy becomes higher) at the functional sites (Fig. 4a, lower panel). This depletion is not due to the slightly more favorable binding energies of the functional sites (SI Fig. 25a), because it is reversed when their positions are randomized within intergenic regions (SI Fig. 24c). Furthermore, DNABEND-predicted nucleosomes are not depleted over functional sites simply because they are less stable - Fig. 4a showed the opposite. In fact, functional sites tend to occur just upstream of the ORFs (SI Fig. 25b), where DNABEND-predicted nucleosomes exhibit enhanced stability (SI Fig. 23). The only remaining possibility is that the depletion of DNABEND-predicted nucleosomes is caused by the spatial clustering of functional binding sites (Fig. 4b, SI Fig. 25c). In this scenario several DNA-binding proteins cooperate to evict the nucleosome and thus enhance their own binding, in a phenomenon known as the nucleosome-induced cooperativity (Fig. 4c). [36, 34] The cooperativity does not depend on direct interactions between TFs and requires only that two or more TF sites occur within a 147 bp nucleosomal footprint (Fig. 4d). A model in which TFs compete with nucleosomes for their cognate sites provides the best explanation for the strong nucleosome depletion over functional sites observed in microarray experiments [22] (Fig. 4e). Although it is not yet conventional to do so, [33] it would be trivial to reward clustering within 147 bp in codes that predict regulatory sites.
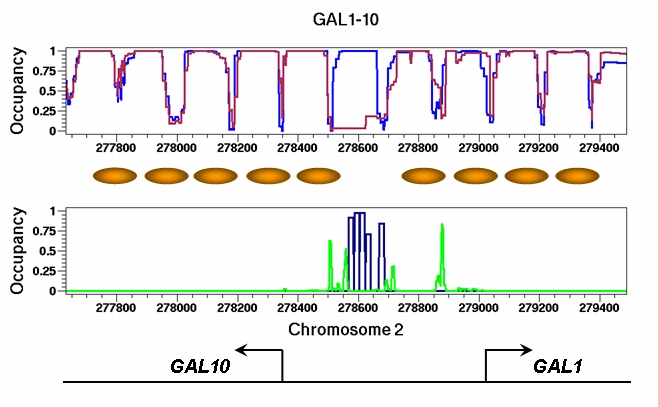
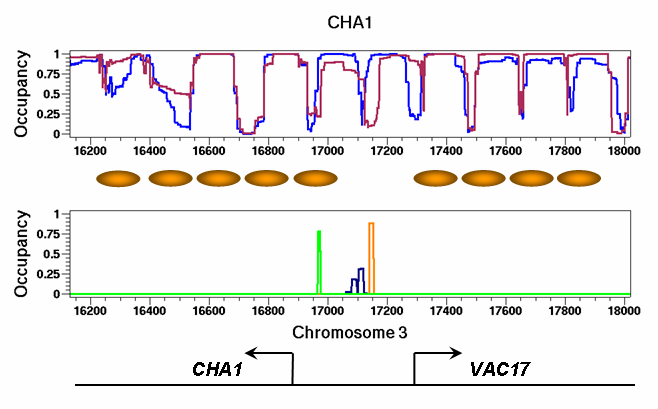
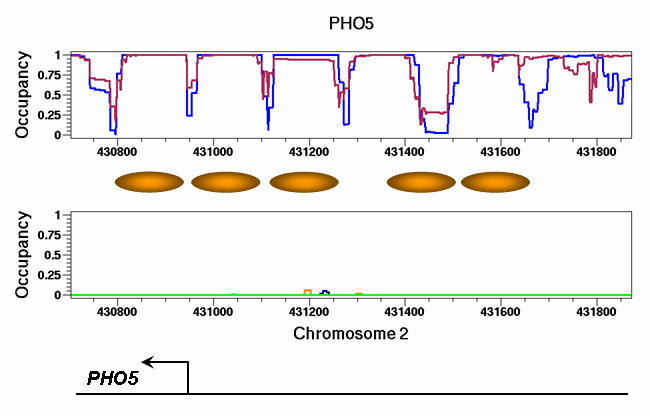
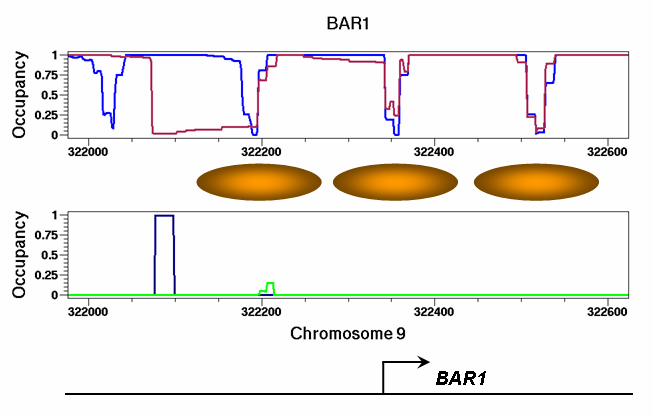
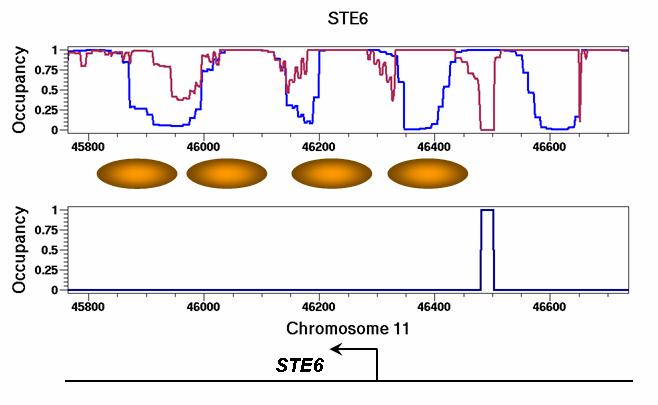
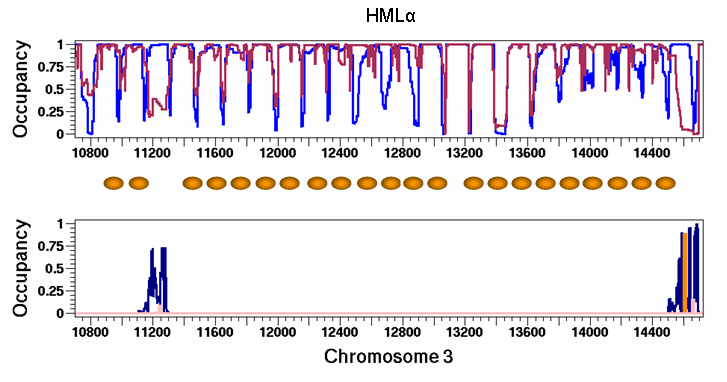
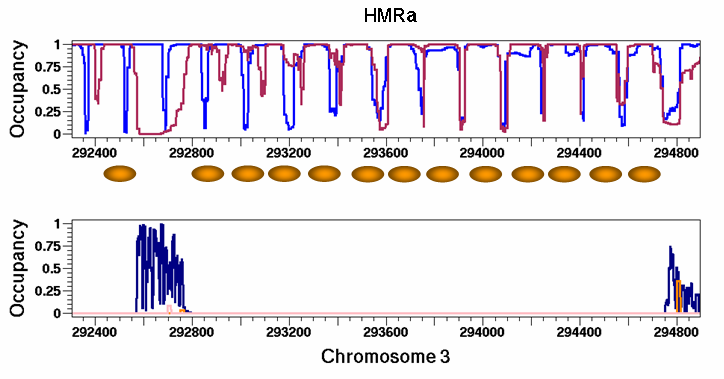
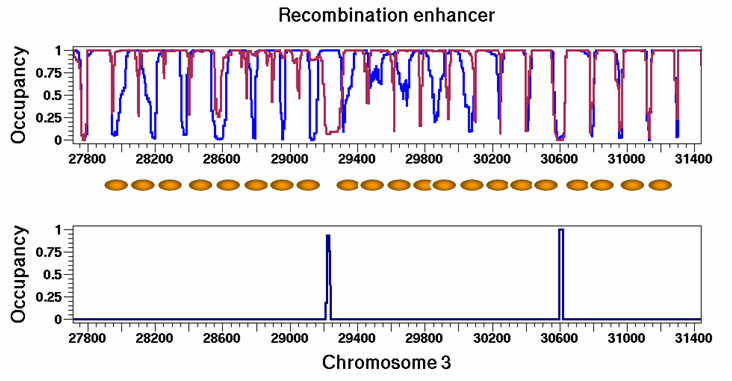
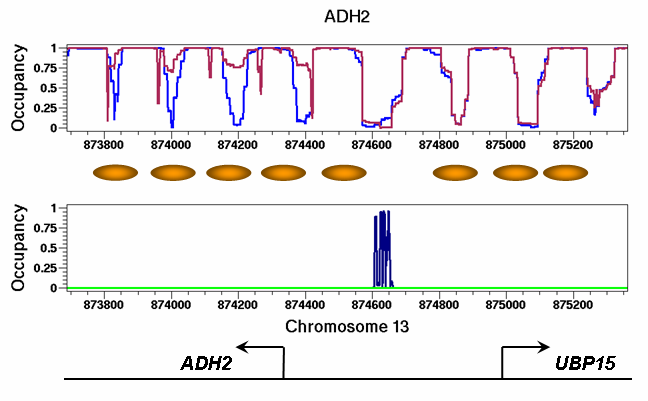
Predictions of experimentally mapped nucleosome positions. We used a set of 110 nucleosome positions reported in the literature for 13 genomic loci to see how well DNABEND predictions match in vivo chromatin structure (Fig. 5, SI Figs. 26a-n). The predictive power of nucleosome models improves considerably when sequence-specific factors are included (Fig. 5), though not in genome-wide sets (SI Fig. 27); this result may be due to the lack of accurate genome-wide knowledge of TF binding sites and energies. For example, at , , and recombination enhancer loci, nucleosomes are positioned in regular arrays whose boundaries are determined by the origin recognition complex, Abf1, Rap1, and Mcm1/MAT bound to their cognate sites (SI Figs. 26f-h).
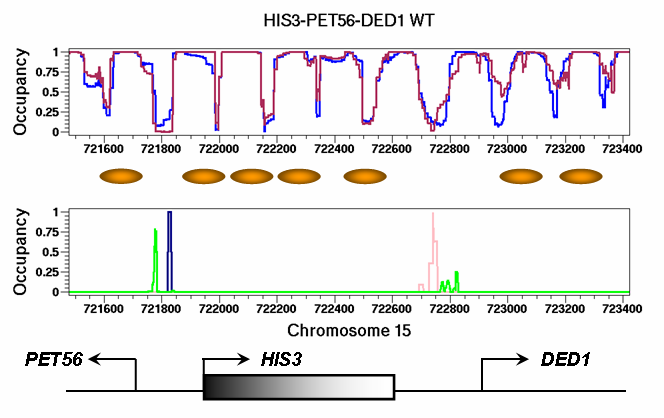
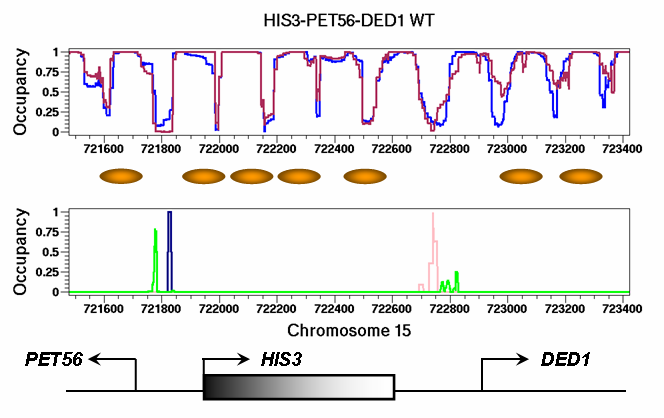
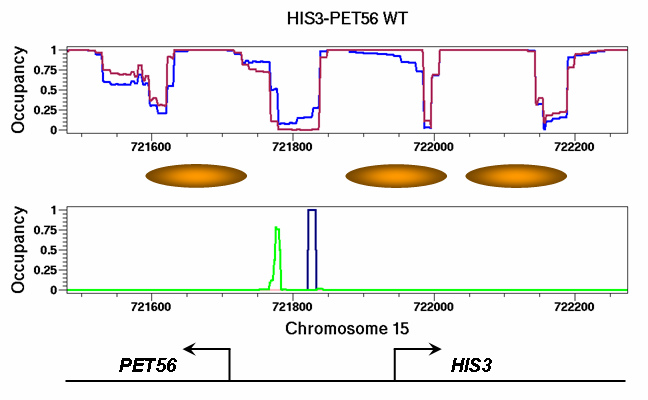
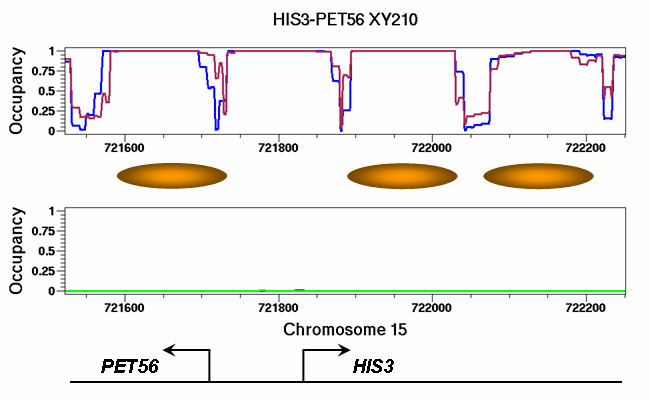
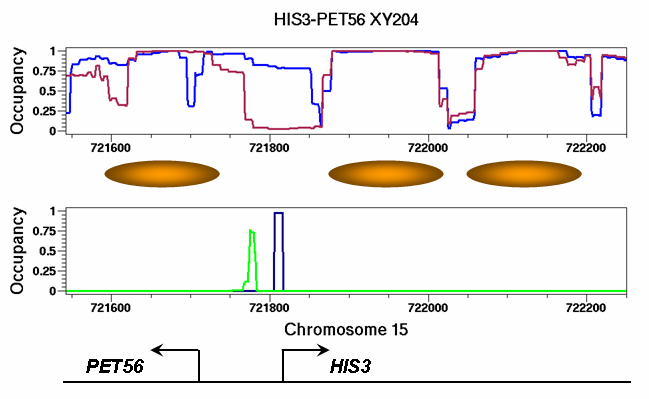
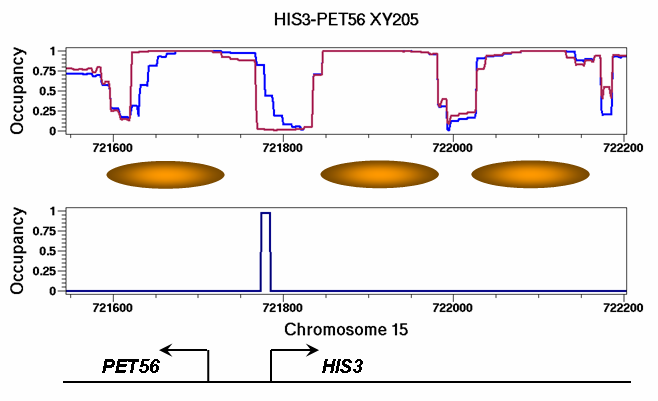
Both intrinsic sequence preferences and boundaries created by other factors contribute to positioning nucleosomes: on one hand, at the GAL1-10 locus a nucleosome covering a cluster of GAL4 sites is evicted, making bp of promoter sequence accessible to TBP and other factors (SI Fig. 26a), as observed in vivo. [37] On the other hand, GCN4 and ABF1 sites at the HIS3-PET56-DED1 locus are intrinsically nucleosome-depleted, because histones have lower affinity for HIS3-PET56 and DED1 promoters (Fig. 6, SI Fig. 26k). [38] DNABEND correctly predicts chromatin re-organization caused by sequence deletions in the HIS3-PET56 promoter region: [38] sequence-dependent nucleosome positions are refined through the action of GCN4 and TBP to improve the agreement with experiment (SI Figs. 26l-n).
3 Conclusion
We have developed a DNA mechanics model capable of accurately predicting in vitro free energies of nucleosome formation, optimal base pairs in the minor and major grooves of nucleosomal DNA, and DNA geometries specific to each base step. We only get an agreement with the available genome scale data sets [22, 23] for nucleosome depletion from the TATA box and functional TF binding sites when we include competition with the relevant factors. In the absence of DNA-binding factors DNABEND predicts a weak enhancement of nucleosome occupancy over their sites and thus agrees with the conjecture, not yet demonstrated on a genome-wide scale, that nucleosomes provide a default repression. [31] The two alignment models we examined do not support this conjecture; it is conceivable that they have implicitly captured a hybrid signal from both nucleosomes and DNA-bound factors.
The highest quality data on generic nucleosome occupancy come from the specific loci summarized in Fig. 5. There is a relatively weak signal from all models in the absence of other factors, originating from a few correct predictions at short distances. Because DNABEND predicts correct binding energies, the weak signal suggests that nucleosomes positioned by thermodynamics on bare DNA have relatively weak correlation with in vivo positions, while inclusion of other factors substantially improves the picture. DNABEND presents a useful biophysical framework for analysis of in vivo nucleosome locations and TF-nucleosome competition. It will be interesting to examine its predictions for metazoan genomes, and to modulate gene expression levels in model systems through computational design of nucleosome occupancy profiles.
4 Methods
For full details, see SI Methods. DNABEND software and additional supporting data (including a S.cerevisiae nucleosome viewer) are available on the Nucleosome Explorer website: http://nucleosome.rockefeller.edu.
The total energy of a nucleosomal DNA is given by a weighted sum of two quadratic potentials:
| (1) |
where is the sequence-specific DNA elastic energy [10, 11] and is the histone-DNA interaction energy (see SI Methods). The potentials are quadratic with respect to deviations of global displacements and local angles from their ideal superhelical values. The weight is fit to maximize the average correlation coefficient between the distributions of geometric parameters observed in 1kx5 [2] and the DNABEND predictions (SI Fig. 10). The conformation adopted by the DNA molecule is the one that minimizes its total energy , yielding a system of linear equations:
| (2) |
where and is the number of dinucleotides. The nucleosome energies (assumed to be given by ) and the energies of other DNA-binding factors at each genomic position are then used as input to a dynamic programming algorithm [21] which outputs binding probabilities and bp occupancies for each DNA element.
Acknowledgments
A.V.M. was supported by the Lehman Brothers Foundation through a Leukemia and Lymphoma Society fellowship. E.D.S. was funded by the NSF grant DMR-0129848. J.W. acknowledges support from NIGMS grants R01 GM054692 and R01 GM058617, and the use of instruments in the Keck Biophysics Facility at Northwestern University. V.M.S. was supported by NSF (0549593) and NIH (R01 GM58650) grants. We thank Eran Segal, Michael Y. Tolstorukov, Wilma K. Olson, and Victor B. Zhurkin for useful discussions and for sharing nucleosome data.
References
- [1] Khorasanizadeh S (2004) The nucleosome: from genomic organization to genomic regulation. Cell 116:259–272.
- [2] Richmond TJ, Davey CA (2003) The structure of DNA in the nucleosome core. Nature 423:145–150.
- [3] Boeger H, Griesenbeck J, Strattan JS, Kornberg RD (2003) Nucleosomes unfold completely at a transcriptionally active promoter. Mol Cell 11:1587–1598.
- [4] Wallrath LL, Lu Q, Granok H, Elgin SCR (1994) Architectural variations of inducible eukaryotic promoters: preset and remodeling chromatin structures. Bioessays 16:165–170.
- [5] Thastrom A, Lowary PT, Widlund HR, Cao H, Kubista M, Widom J (1999) Sequence motifs and free energies of selected natural and non-natural nucleosome positioning DNA sequences. J Mol Biol 288:213–229.
- [6] Segal E, Fondufe-Mittendorf Y, Chen L, Thastrom A, Field Y, Moore IK, Wang JZ, Widom J (2006) A genomic code for nucleosome positioning. Nature 442:772–778.
- [7] Ioshikhes IP, Albert I, Zanton SJ, Pugh BF (2006) Nucleosome positions predicted through comparative genomics. Nat Genet 38:1210–1215.
- [8] Peckham HE, Thurman RE, Fu Y, Stamatoyannopoulos JA, Noble WS, Struhl K, Weng Z (2007) Nucleosome positioning signals in genomic DNA. Genome Res 17:1170–1177.
- [9] Luger K, Mäder AW, Richmond RK, Sargent DF, Richmond TJ (1997) Crystal structure of the nucleosome core particle at 2.8 Å resolution. Nature 389:251–260.
- [10] Olson WK, Gorin AA, Lu X, Hock LM, Zhurkin VB (1998) DNA sequence-dependent deformability deduced from protein-DNA crystal complexes. Proc Nat Acad Sci 95:11163–11168.
- [11] Morozov AV, Havranek JJ, Baker D, Siggia ED (2005) Protein-DNA binding specificity predictions with structural models. Nucl Acids Res 33:5781–5798.
- [12] Arents G, Moudrianakis EN (1993) Topography of the histone octamer surface: repeating structural motifs utilized in the docking of nucleosomal DNA. Proc Nat Acad Sci 90:10489–10493.
- [13] Tolstorukov MY, Colasanti AV, McCandlish DM, Olson WK, Zhurkin VB (2007) A novel roll-and-slide mechanism of DNA folding in chromatin: implications for nucleosome positioning. J Mol Biol 371:725–738.
- [14] Widom J (2001) Role of DNA sequence in nucleosome stability and dynamics. Q Rev Biophys 34:269–324.
- [15] Shrader TE, Crothers DM (1989) Artificial nucleosome positioning sequences. Proc Nat Acad Sci 86:7418–7422.
- [16] Shrader TE, Crothers DM (1990) Effects of DNA sequence and histone-histone interactions on nucleosome placement. J Mol Biol 216:69–84.
- [17] Lowary PT, Widom J (1998) New DNA sequence rules for high affinity binding to histone octamer and sequence-directed nucleosome positioning. J Mol Biol 276:19–42.
- [18] Widlund HR, Cao H, Simonsson S, Magnusson E, Simonsson T, Nielsen PE, Kahn JD, Crothers DM, Kubista M (1998) Identification and characterization of genomic nucleosome-positioning sequences. J Mol Biol 267:807–817.
- [19] Cao H, Widlund HR, Simonsson T, Kubista M (1998) TGGA repeats impair nucleosome formation. J Mol Biol 281:253–260.
- [20] Thastrom A, Bingham LM, Widom J (2004) Nucleosomal locations of dominant DNA sequence motifs for histone-DNA interactions and nucleosome positioning. J Mol Biol 338:695–709.
- [21] Durbin R, Eddy SR, Krogh A, Mitchison G (1998) Biological sequence analysis: probabilistic models of proteins and nucleic acids (Cambridge University Press, Cambridge, MA).
- [22] Yuan G, Liu Y, Dion MF, Slack MD, Wu LF, Altschuler SJ, Rando OJ (2005) Genome-scale identification of nucleosome positions in S.cerevisiae. Science 309:626–630.
- [23] Ozsolak F, Song JS, Liu XS, Fisher DE (2007) High-throughput mapping of the chromatin structure of human promoters. Nat Biotech 25:244–248.
- [24] Kornberg RD, Stryer L (1988) Statistical distributions of nucleosomes: nonrandom locations by a stochastic mechanism. Nucl Acids Res 16:6677–6690.
- [25] Fedor MJ, Lue NF, Kornberg RD (1988) Statistical positioning of nucleosomes by specific protein-binding to an upstream activating sequence in yeast. J Mol Biol 204:109–127.
- [26] Albert I, Mavrich TN, Tomsho LP, Qi J, Zanton SJ, Schuster SC, Pugh BF (2007) Translational and rotational settings of H2A.Z nucleosomes across the Saccharomyces cerevisiae genome. Nature 446:572–576.
- [27] Ligr M, Siddharthan R, Cross FR, Siggia ED (2006) Gene expression from random libraries of yeast promoters. Genetics 172:2113–2122.
- [28] Melcher K, Sharma B, Ding WV, Nolden M (2000) Zero background yeast reporter plasmids. Gene 247:53–61.
- [29] Chen J, Ding M, Pederson DS (1994) Binding of TFIID to the CYC1 TATA boxes in yeast occurs independently of upstream activating sequences. Proc Nat Acad Sci 91:11909–11913.
- [30] Kuras L, Struhl K (1999) Binding of TBP to promoters in vivo is stimulated by activators and requires Pol II holoenzyme. Nature 399:609–613.
- [31] Struhl K (1999) Fundamentally different logic of gene regulation in eukaryotes and prokaryotes. Cell 98:1–4.
- [32] Lee W, Tillo D, Bray N, Morse RH, Davis RW, Hughes TR, Nislow C (2007) A high-resolution atlas of nucleosome occupancy in yeast. Nat Genet 39:1235–1244.
- [33] MacIsaac KD, Wang T, Gordon DB, Gifford DK, Stormo GD, Fraenkel E (2006) An improved map of conserved regulatory sites for Saccharomyces cerevisiae. BMC Bioinformatics 7:113.
- [34] Adams CC, Workman JL (1995) Binding of disparate transcriptional activators to nucleosomal DNA is inherently cooperative. Mol Cell Biol 15:1405–1421.
- [35] Liu X, Lee C-K, Granek JA, Clarke ND, Lieb JD (2006) Whole-genome comparison of Leu3 binding in vitro and in vivo reveals the importance of nucleosome occupancy in target site selection. Genome Res 16:1517–1528.
- [36] Miller JA, Widom J (2003) Collaborative competition mechanism for gene activation in vivo. Mol Cell Biol 23:1623–1632.
- [37] Li S, Smerdon MJ (2002) Nucleosome structure and repair of N-methylpurines in the GAL1-10 genes of Saccharomyces cerevisiae. J Biol Chem 277:44651–44659.
- [38] Sekinger EA, Moqtaderi Z, Struhl K (2005) Intrinsic histone-DNA interactions and low nucleosome density are important for preferential accessibility of promoter regions in yeast. Mol Cell 18:735–748.
- [39] Basehoar AD, Zanton SJ, Pugh BF (2004) Identification and distinct regulation of yeast TATA box-containing genes. Cell 116:699–709.
- [40] Morozov AV, Siggia ED (2007) Connecting protein structure with predictions of regulatory sites. Proc Nat Acad Sci 104:7068–7073.
:
![[Uncaptioned image]](/html/0805.4017/assets/Figures/Figure1a_Dec2007.png)
![[Uncaptioned image]](/html/0805.4017/assets/Figures/Fig1b_April2008.png)
![[Uncaptioned image]](/html/0805.4017/assets/Figures/Figure2_Dec2007.png)
![[Uncaptioned image]](/html/0805.4017/assets/Figures/Figure4.png)

Supporting Information for:
Extrinsic and Intrinsic Nucleosome Positioning Signals
5 Supplementary Methods
5.1 DNA geometry
We model each DNA basepair as a rigid body and specify its position in space using a local coordinate frame attached to each basepair and defined using and (). Here are the orthonormal basis vectors of the local frame, and is its origin in the fixed global coordinate frame. Both the basis vectors and the vector to the origin can be expressed in terms of 6 independent parameters that are sufficient for reconstructing the spatial position of any rigid body. [1] Thus apart from a single global translation and rotation an arbitrary DNA conformation with basepairs is uniquely specified if sets of 6 geometric parameters are known. By convention, [2, 4, 5, 3] the geometric parameters are chosen to be the three angular degrees of freedom which define unit vectors of the local frame attached to the basepair in the local frame attached to the basepair , and the displacement vector which gives the origin of frame with respect to origin of frame : . Here are the helical twist, roll and tilt angles, and is the displacement vector with the x,y,z components called slide, shift and rise (Fig. 1a). [2, 3, 4, 5] Since the geometric parameters which specify the spatial position of the basepair are defined with respect to the frame rigidly attached to the previous basepair, their values capture local deviations in the DNA conformation. However, they can also be used to recursively construct the rotation matrix for the basepair in the global frame:
| (3) |
where each matrix is the product of three rotations:
| (4) |
Here,
Note that and are the rotation matrices around the y and z axes, respectively. The middle term on the right-hand side of Equation (4) introduces both roll and tilt with a single rotation through angle around a roll-tilt axis. The roll-tilt axis lies in the x-y plane of the mid-step coordinate frame (mid-step triad, or MST: Supplementary Fig. 7), and is in general inclined at an angle to the y-axis. [3] In this scheme, it is the mid-step triad that is used to transform the displacement vector into the fixed global frame: . Introducing a single roll-tilt rotation axis is preferable to separate roll and tilt rotations because it eliminates the non-commutativity problem associated with the roll and tilt rotation operations. [3, 4]
Similarly to the basepair rotation matrices, the mid-step triads are also constructed recursively:
| (5) |
where
| (6) |
Thus having a complete set of local geometric parameters is equivalent to knowing the global DNA conformation: first, the recursive relation (3) is employed to determine the orientations of all basepair coordinate frames (except for the first one which has to be fixed in space independently and thus provides the overall orientation and position of the DNA molecule). Second, Equation (5) is used to construct the MST frames, which are then employed to transform all local displacements into the global frame. Finally, all displacement vectors are added up vectorially to determine the origins of the basepair coordinate frames. If necessary, the basepair frames can then be used to reconstruct the positions of all DNA basepair atoms (using an idealized representation which neglects flexibility of bases in a basepair). Note that knowing a basepair coordinate frame is in general insufficient for predicting the positions of the phosphate backbone and sugar ring atoms because of their additional degrees of freedom. Finally we remark without showing the details of the calculations that the inverse problem is also well-defined: a full set of basepair and MST rotation matrices in the global frame is sufficient to reconstruct all local degrees of freedom . We have implemented the solution to the inverse problem following a previously published description. [4]
While the helical twist serves to rotate the consecutive DNA basepairs with respect to one another, introducing non-zero roll and tilt angles imposes curvature onto the DNA conformation. Indeed, if both roll and tilt are negligible is simply a rotation through around the z-axis (which coincides with the helical axis in this case), and is a rotation through around the same axis. The action of roll and tilt can be seen more clearly by considering the curvature vector, defined as the difference between the tangent vectors for two consecutive basepairs: . The expression for curvature is simplified in the limit of small roll and tilt: since the magnitude of roll () and tilt () are typically much smaller than the helical twist per basepair (), can be expanded to :
| (7) |
Because we are primarily interested in the magnitude of the curvature vector, we can compute it in the local frame of basepair : where is the z-axis unit vector. Using Equation (7) we obtain:
Thus in this limit the magnitude of the curvature vector contains equal contributions from both roll and tilt: . Furthermore, the roll and tilt contributions to curvature are shifted by with respect to one another.
Transformations between local and global descriptions of the DNA molecule are important because the sequence-specific DNA elastic energy is best described in terms of the local degrees of freedom , whereas it is the global coordinates that can be most naturally restrained to follow an arbitrary spatial curve.
5.2 Ideal superhelix
In nucleosome core particles the spatial curve used to restrain DNA conformation is an ideal left-handed superhelix with pitch and radius , described by the following parametric equation:
| (8) |
Using the arc length to parameterize the curve we obtain:
| (9) |
where . A local frame at position is given by a set of three orthonormal Frenet vectors (tangent, normal, and binormal):
| (10) |
We position sets of Frenet basis vectors equidistantly along the superhelical curve: (), where is the number of nucleosomal superhelical turns. Fitting an ideal superhelix to the high-resolution crystal structure of the nucleosome core particle [6] reveals that
| (11) |
In order to transform the slowly rotating Frenet basis vectors into the helically twisted local frames associated with DNA basepairs, we impose an additional helical rotation around the tangent vector :
| (12) |
Here is the cumulative helical twist, is the average helical twist from the structure, and the rotation specified by Equations (12) is performed in the basis. Similarly, the MST frames are located at (), and are rotated through to bring them into register with the helical twist.
A superhelix described by Equation (8) has constant curvature which is manifested by the constant difference between the consecutive tangent vectors: . This allows us to determine the length of the roll-tilt vector: (which also gives the maximum value of roll and tilt). In this idealized picture, roll and tilt can be assumed to make equal contributions to the curvature. Indeed, reconstruction of the local geometric parameters from the full set of helically twisted Frenet frames results in and , where Å and is the initial phase determined by the location of the first basepair. Thus twist and rise are constant for every basepair in the ideal superhelix, slide and shift are zero, whereas roll and tilt exhibit oscillations resulting from the superhelical curvature, and shifted by with respect to one another (Supplementary Fig. 10).
5.3 DNA conformational energy
The total DNA conformation energy is a weighted sum of two terms: the sequence-specific DNA elastic energy designed to penalize deviations of the local geometric parameters from their average values observed in the protein-DNA structural database, and the restraint energy which penalizes deviations of the DNA molecule from the nucleosomal superhelix. Thus all interactions (primarily of electrostatic nature) between the DNA molecule and the histone octamer are modeled implicitly by imposing the superhelical restraint.
DNA elastic energy. Using the local degrees of freedom , we represent the sequence-specific DNA elastic energy by a quadratic potential: [7]
| (13) |
where the sum runs over all consecutive dinucleotides (basesteps) and are the average values computed for the basestep type using a collection of oligonucleotides extracted from a set of 101 non-homologous protein-DNA structures. [8] The matrix of force constants is evaluated by inverting the covariance matrix of deviations of local geometric parameters from their average values (): [7]
| (14) |
Note that our elastic energy model utilizes only and first and second moments of the empirical geometry distributions, and thus disregards all non-Gaussian effects such as skewness and bimodality. Including higher order moments amounts to introducing non-quadratic corrections to the elastic energy model, which makes the computation much less tractable. This problem is partially alleviated however by removing dinucleotides from the data set if one or more of their geometric parameters are further than 3 standard deviations away from the mean. The mean is then recomputed and the procedure is repeated until convergence. [7] DNA elastic energy is a function of 10 basestep type - dependent average values for each of the 6 local degrees of freedom (all averages and covariances for the dinucleotides related by reverse complementarity are equal by construction), and of 15 independent force constants in each symmetric 6D matrix .
In order to be able to combine the DNA elastic term with the superhelical restraint term defined in the global frame, we apply the following coordinate transformation to Equation (13):
| (15) |
( and denote 3D unit and zero matrices, respectively). Applying to the local degrees of freedom leaves the angles (twist, roll, and tilt) invariant, but transforms the local displacements (shift, slide, and rise) into the global frame. To keep the elastic energy invariant, the force constants have to be transformed as well: . Equation (13) then becomes:
| (16) |
Finally, it is convenient to change variables so that all degrees of freedom are expressed in terms of their deviations from the ideal superhelix:
| (17) |
Note that all the transformations described in this section involve no additional approximations to the original DNA elastic energy (Equation (13)). Thus we are free to choose the most convenient rotation matrix in Equation (15), and use from the ideal superhelix in Equation (16).
Superhelical restraint energy. Superhelical restraint energy is used to bend nucleosomal DNA into the superhelical shape. We define the restraint energy as the quadratic potential:
| (18) |
where and are the nucleosomal and the ideal superhelix radius-vectors in the global frame ():
| (19) |
Then to the lowest order the difference between the radius vectors is given by:
| (20) |
where label the vector components, and
are the connectivity coefficients constructed as a product of the first derivative of the rotation matrix with respect to the frame angles and the ideal displacements in the local frame. The first term in Equation (20) represents the net change in the global radius vector caused by the changes in the displacements up to and including the basestep , while the second term reflects the change in the global radius vector resulting from modifying one of the rotation angles . Note that changing a single rotation angle at position affects every downstream basepair position linearly by introducing a kink into the DNA chain, whereas making a displacement change at that position simply shifts all downstream coordinates by a constant amount. The first derivative of the rotation matrix is evaluated as:
Upon substitution of the expansion (20) into the restraint energy we obtain an effective quadratic potential:
| (21) |
where , and the 6x6 matrix of force constants is given by three distinct 3x3 submatrices:
Here,
where
is the theta function, and is the Kronecker delta. couples displacements with displacements, couples displacements with angles (and thus has one connectivity coefficient), and couples angles with angles through two connectivity coefficients. Summing over some of the theta functions we obtain:
where .
Total energy and DNA conformation minimization. The total energy of nucleosomal DNA is given by:
| (22) |
where is the fitting weight introduced to capture the balance between favorable histone-DNA interactions and the unfavorable energy of bending DNA into the nucleosomal superhelix. We fit to maximize the average correlation coefficient between the distributions of geometric parameters observed in the high-resolution crystal structure of the nucleosome core particle (1kx5), [6] and the corresponding DNABEND predictions (Supplementary Fig. 10). This procedure yields for the 147 bp superhelix and for the 71 bp superhelix bound by the tetramer (bps 39 through 109 in the 147 bp superhelix). DNABEND is not very sensitive to the exact value of : we found a correlation of 0.99 between the free energies computed using and and the 71 bp superhelix (data not shown). Note that the total energy is a sum of two quadratic potentials written out in terms of the deviations of the global displacements and the local frame angles from their ideal superhelical values. Given the value of the fitting weight, the conformation adopted by the DNA molecule is the one that minimizes its total energy . Since the energy is quadratic, finding the energy minimum is equivalent to solving a system of linear equations:
| (23) |
The numerical solution of the system of equations (23) provides a set of geometric parameters corresponding to the minimum DNA energy: . These can be used to find the original geometric parameters in the local frame: .
Worm-like chain. According to the worm-like chain model, the energy required to bend a DNA molecule is sequence-independent and given by: [9]
| (24) |
where is the contour length of the molecule, is the persistence length (estimated to be Å), [9] kcal/mol, and is the unit tangent vector. The contour length of the ideal 147 bp superhelix is given by Å. From Equations (9) and (10) we obtain , and thus
In Fig. 2b, the mean and the standard deviation of DNABEND energies computed for chromosome III are . Equating the worm-like chain model estimate with the mean DNABEND energy, we obtain a scaling coefficient of 0.26 which can be used to express DNABEND energies in kcal/mol. This gives the difference of 15.2 kcal/mol between the best and the worst chromosome III sequences, and kcal/mol. Most sequences differ by or less in Fig. 2b and are thus separated by kcal/mol. A similar value of the scaling coefficient (0.21) arises from a linear model fit between experimental and DNABEND-predicted free energies in Supplementary Fig. 12a (red circles).
5.4 Predicting genome-wide occupancies of DNA-binding proteins
Chromatin structure plays an important role in regulating eukaryotic gene expression. [10, 11, 12, 13] Eukaryotic DNA is packaged by histones into chains of nucleosomes that are subsequently folded into nm chromatin fibers. Because arrays of nucleosomes form on chromosomal DNA under physiological conditions, in order to predict genomic nucleosomal occupancies we need to describe DNA packaged into multiple non-overlapping nucleosomes. Furthermore, nucleosomes may compete with other DNA binding proteins for genomic sequence. For example, several closely spaced TF binding sites may serve to displace the nucleosomes from the promoter region upon TF binding. To take the competition between nucleosomes and other factors into account we need to consider configurations with multiple regularly spaced nucleosomes (accomodating a 20-25 bp linker between the end of one nucleosome and the beginning of the next) as well as other DNA-binding proteins. The probability of any such configuration can be computed if we can construct a statistical sum (partition function) over all possible configurations. Though the sum has exponentially many terms and is thus impossible to evaluate by brute force for all but very short DNA sequences, it can nonetheless be efficiently computed with a dynamic programming algorithm. [14]
Here we develop the dynamic programming approach for a general case of objects of length that are placed on genomic DNA (i.e. occupy DNA basepairs). The objects could represent nucleosomes, TFs, or any other DNA-binding proteins. The binding energy of object with DNA at each allowed position is assumed to be known: , where is the number of basepairs. For nucleosomes we will carry out a genome-wide computation of DNA elastic energies as described above, while for other factors the energy landscapes will be constructed based on their binding preferences inferred from footprinting experiments, SELEX assays, bioinformatics predictions, etc. We assign index to the background which can be formally considered to be an object of length 1: . In the simplest case which we consider here the background energy is zero everywhere, but more sophisticated models could incorporate a global bias by making positions near DNA ends less favorable, etc.
We wish to compute a statistical sum over all possible configurations in which object overlap is not allowed (including the background “object”):
| (25) |
where is the total energy of an arbitrary configuration of non-overlapping objects, is the number of objects of type , and is the pre-computed energy of the object of type which occupies positions through .
It is possible to evaluate (or the free energy ) efficiently by recursively computing the partial statistical sums:
| (26) |
with the initial condition . The theta function is defined as:
| (27) |
It is computationally more efficient to transform Equation (26) into log space by defining the partial free energies :
| (28) |
with the initial condition . For numerical stability, we rewrite Equation (28) as an explicit update of the partial free energy computed at the previous step:
| (29) |
The free energy computed in the final step is the full free energy where all possible configurations are taken into account: . Since the algorithm proceeds by computing partial sums from 1 to N it is often called the forward pass. Similar equations can be constructed for the backward pass which proceeds from N to 1:
| (30) |
with the initial condition . We transform Equation (30) into log space by defining the backward partial free energies :
| (31) |
with the initial condition , or equivalently:
| (32) |
Note that by construction.
With the full set of forward and backward partial free energies we can evaluate any statistical quantity of interest. For example, the probability of finding an object of type at positions is given by:
| (33) |
Another quantity of interest is the occupancy of the basepair by object , defined as the probability that basepair is covered by any object of type : [15]
| (34) |
(note that for ). If the object is composite (i.e. consists of basepairs extended symmetrically on both sides by to take the nonzero linker lengths into account: ), we may be interested in the partial occupancy by basepairs at the center of the object. Equation (34) then becomes:
| (35) |
Recursively,
| (36) |
Here we assume that all quantities on the right-hand side are set to zero if their indices are outside their definition domains (such as ).
Finally, we need to take into account the fact that the objects can bind DNA in both directions, and thus there are two binding energies for each position: (object starts at and extends in the 5’ to 3’ direction) and (object starts at and extends in the 3’ to 5’ direction). It is easy to show that the formalism developed above applies without change if the binding energies are replaced by the free energies which take both binding orientations into account:
| (37) |
In the case of a single type of DNA-binding object (such as the nucleosome energies predicted with DNABEND) there are two free parameters: the mean energy of nucleosomes over a chromosome or a given genomic region which affects overall nucleosome occupancy, and the standard deviation which plays the role of inverse temperature. Note that DNABEND nucleosomes are 157 bp long because a 147 bp histone binding site is flanked on both sides by 5 bp long linkers which do not contribute to the energy. Because the background energy is set to zero, making more negative results in fewer bases being devoid of nucleosomes (this corresponds to increasing free concentration of histone octamers in the histone-DNA solution), and vice versa. The inverse temperature is related to the nucleosome stability: making smaller results in fewer stable nucleosomes (e.g. those present in half or more of all the configurations in Equation (25)), while allowing for a bigger difference between favorable and unfavorable nucleosomal energies results in more configurations with ’frozen’, stable nucleosomes. For all calculations in this paper we have chosen to set , for every chromosome. The nucleosome energies with zero mean result in the average nucleosome occupancy of 0.797 over all chromosomes, and 12538 stable, non-overlapping nucleosomes (with ) covering 16.3% of the yeast genome. In addition, this value of is close to the scale of DNABEND elastic energies. The free parameters described here are also present in the alignment model (albeit in a more implicit manner, see section 5.8), and are required in general for each type of DNA-binding object.
5.5 TF and TBP binding energies
All TF binding energies were computed using position-specific weight matrices (PWMs) from Morozov et al. [16] and MacIsaac et al.: [17]
| (38) |
where is the length of the binding site, is the nucleotide at position , is the frequency of base at position in the PWM, and is the background frequency of base : (the same background frequencies as used in the alignment-based nucleosome model, see section 5.8). is an energy scale, set to 1 for all TFs. The distribution of energies is bounded from below by the energy of the consensus sequence which is a free parameter of the model since it depends on the TF concentration in solution. Thus the energy of a TF bound to site is given by: , where is typically set to -6.0 (relative to the 0.0 average energy of DNABEND nucleosomes), but can be also varied through a range of energies (cf. Fig. 4d). Finally, the two energies of binding the same site in both directions are combined using:
| (39) |
where is the strand bias. A set of TF binding energies computed in this way (together with the nucleosome binding energy profile) is used as input to the recursive algorithm from Section 5.4. In practice, we restrict a set of sites to which TFs are allowed to bind by assigning a highly unfavorable energy to all TF positions that are not listed as predicted sites by MacIsaac et al. [17]
TBP binding energies were obtained in the same way, except that the TBP PWM was derived using an alignment of TATA box sites from Basehoar et al. [18] TBPs were only allowed to bind the sites listed in Basehoar et al. as TATA boxes.
5.6 Nucleosome positions from tiled microarray analysis
Yuan et al. have developed a hidden Markov model-based approach for inferring nucleosome positions from high resolution tiled microarray data. [19] The data was collected for most of S.cerevisiae chromosome III, plus additional regulatory regions. We have used Yuan et al. “HMM calls” listed in the Supplementary Data to identify probes occupied by either a well-positioned or a fuzzy nucleosome (manually added “hand calls” were not considered). We then extended nucleosomal regions from the mid-point of the first occupied probe to the mid-point of the last occupied probe, plus additional 10 bp on each side (making it consistent with the definition of nucleosome coverage of TF binding sites employed in Fig. 3 of Yuan et al.). [19] Thus the nucleosomal length is given by , where is the number of contiguous probes occupied by a single nucleosome. We find that most nucleosomes occupy 6 contiguous probes and thus cover 120 bp, somewhat less than 147 bp expected from the structural point of view. The total number of nucleosomes placed on chromosome III is 1045; every basepair covered by either well-positioned or fuzzy nucleosome was assigned an occupancy of 1.0, resulting in the overall average occupancy of 0.488 (that is, almost half of the genome is covered by the non-overlapping nucleosomes). The resulting occupancy profile and the corresponding nucleosome positions were used to compile all Yuan et al. results in this work.
5.7 H2A.Z nucleosome positions from DNA sequencing
Albert et al. have used high throughput DNA sequencing to identify genomic positions of H2A.Z nucleosomes in S.cerevisiae with a median 4 bp resolution. [20] We converted their nucleosome positioning data into the occupancy profile by using the “fine-grain” nucleosome center coordinates (reported for both strands in Albert et al. Supplementary Materials) to place 147 bp nucleosomes on the genome. Since many “fine-grain” nucleosomes overlap, we end up with longer nucleosome-occupied regions containing multiple hits and surrounded by regions with zero nucleosome coverage. To each base pair in these occupied regions we then assign an integer equal to the number of nucleosomes that cover this particular base pair, thus producing an unnormalized nucleosome occupancy profile. Finally, the occupancy profile is normalized by rescaling the integer counts separately in each occupied region so that the highest occupancy is assigned a value of 1.0. The total number of overlapping H2A.Z nucleosome reads is 34796; with the conventions described above the average occupancy is 0.118 over all chromosomes. The resulting occupancy profile and the corresponding nucleosome positions were used to produce Albert et al. results for Supplementary Figs. 22 and 27b.
5.8 Alignment-based model of nucleosome energies and occupancies
Segal et al. have recently developed a nucleosome positioning model based on the alignment of 199 sequences occupied by nucleosomes in vivo in the yeast genome. [15] The main assumption of the model is that it is possible to infer nucleosome formation energies using dinucleotide distributions observed in aligned nucleosomal sequences. To this end, experimentally determined mononucleosome sequences of length bp and their reverse complements were aligned around their centers as described in Segal et al. [15] The rules for choosing the center of the alignment should be clear from the following example:
x
AAGCGTTAAACGC seq1
GCGTTTAACGCTT seq1_rc
ATGCGACG seq2
CGTCGCAT seq2_rc
Here ’x’ labels the center of the alignment, which is chosen in an obvious way for sequences with an odd number of nucleotides (seq1), and by making the number of nucleotides to the left of the central nucleotide one less than the number of nucleotides to the right of the central nucleotide for sequences with an even number of nucleotides (seq2).
A local average over neighboring dinucleotide positions was carried out by shifting the original alignment of by 1 bp to the right as well as 1 bp to the left, and adding the shifted sequences to the original alignment. Thus the final alignment has sequences. Next, the conditional probability of a nucleotide of type at position () given a nucleotide of type at position () is computed at every position within 67 bp of the center of the alignment:
| (40) |
where , is the number of times the dinucleotide occurs in the augmented alignment, and marks the alignment center. Keeping conditional probabilities only for 135 central positions disregards dinucleotide counts from the outer edges of the alignment to which fewer sequences contribute. The final model is 157 bp long because 135 conditional probabilities are flanked on each side by 11 background nucleotide frequencies, to approximate steric replusion between nucleosomes:
| (41) |
where are the background frequencies from the yeast genome. Finally, the model assigns a negative log score (interpreted as the energy of nucleosome formation) to a 157 bp long nucleotide sequence :
| (42) |
where denotes the nucleotide type at position in the sequence , and are either the genomic background frequencies defined above or uniform background frequencies: (i.e. ). Note that by construction the flanking nucleotides do not contribute to Equation (42) (apart from a possible difference in background frequencies), and thus play the role of embedding linker regions. Finally, to reproduce results from Segal et al. [15] the energies of both strands are combined using an empirical formula which implicitly sets the temperature, resulting in 13978 stable, non-overlapping nucleosomes (with probability ) that cover 18.2% of the yeast genome, and the average occupancy of 0.844 over all chromosomes:
| (43) |
where is a 157 bp sequence starting at position in the genome, and is its reverse complement. Note that genomic background frequencies are used for one strand while uniform background frequencies are used for the other. We refer to the log scores computed in this way, and the corresponding nucleosome probabilities and occupancies as alignment model I. Alternatively, in alignment model II we use genomic background frequencies for both DNA strands and rescale the temperature explicitly to match DNABEND and alignment model I:
| (44) |
where and signifies an average over the chromosome. Note that while the log scores are rescaled in Equation (44), their mean stays the same (and close to zero because the background scores have been subtracted, cf. Equation (42)). We treat the log scores from Equations (43) and (44) as nucleosome energies, and use them to compute nucleosome probabilities and occupancies as described in section 5.4. We find that alignment model II predictions do not strongly depend on the exact value of the scaling coefficient. Alignment model II results in the average nucleosome occupancy of 0.810 over all chromosomes; 26670 stable, non-overlapping nucleosomes (with ) are placed, covering 34.7% of the yeast genome. The overall correlation between alignment models I and II is 0.66 for log scores and 0.60 for occupancies.
5.9 Histone-DNA binding affinity measurements
We used a standard competitive nucleosome reconstitution procedure to measure the relative affinity of different DNA sequences for binding to histones in nucleosomes. [21] In this method, differing tracer DNA molecules compete with an excess of unlabeled competitor DNA for binding to a limiting pool of histone octamer. The competition is established in elevated [NaCl], such that histone-DNA interaction affinities are suppressed and the system equilibrates freely. The [NaCl] is then slowly reduced by dialysis, allowing nucleosomes to form; further reduction in [NaCl] to physiological concentrations or below then ”freezes-in” the resulting equilibrium, allowing subsequent analysis, by native gel electrophoresis, of the partitioning of each tracer between free DNA and nucleosomes. The distribution of a given tracer between free DNA and nucleosomes defines an equilibrium constant and a corresponding free energy, valid for that competitive environment. Comparison of the results for a given pair of tracer DNAs (in the identical competitive environment) eliminates the dependence on the details of the competitive environment, yielding the free energy difference () of histone-interaction between the two tracer DNAs. To allow for comparison with other work, we include additional tracer DNAs as reference molecules: a derivative of the 5S rDNA natural nucleosome positioning sequence [21] and the 147 bp nucleosome-wrapped region of the selected high affinity non-natural DNA sequence 601. [22]
The 5S and 601 reference sequences were prepared by PCR using plasmid clones as template. 146 and 147 bp long DNAs analyzed in X-ray crystallographic studies of nucleosomes (PDB entries 1aoi and 1kx5, respectively) were prepared as described [23] using clones supplied by Professors K. Luger and T.J. Richmond, respectively. New 147 bp long DNA sequences designed in the present study were prepared in a two-step PCR-based procedure using chemically synthesized oligonucleotide primers. All synthetic oligonucleotides were gel purified prior to use. The central 71 bp were prepared by annealing the two strands. The resulting duplex was gel purified and used as template in a second stage PCR reaction to extend the length on each end creating the final desired 147 bp long DNA. The resulting DNA was again purified by gel electrophoresis.
DNA sequences to be analyzed were 5’ end-labeled with 32P, and added in tracer quantities to competitive nucleosome reconstitution reactions. Reconstitution reactions were carried out as described [21] except that each reaction included 10 g purified histone octamer and 30 g unlabeled competitor DNA (from chicken erythrocyte nucleosome core particles) in the 50 l microdialysis button.
5.10 Hydroxyl radical footprinting of nucleosomal templates
DNA templates. Plasmids pGEM-3Z/601, pGEM-3Z/603 and pGEM-3Z/605 containing nucleosome positioning sequences 601, 603 and 605, respectively, were described previously. [24] To obtain templates for hydroxyl radical footprinting experiments the desired -bp DNA fragments were PCR-amplified using various pairs of primers and Taq DNA polymerase (New England BioLabs). The sequences of the primers will be provided on request. To selectively label either upper or lower DNA strands one of the primers in each PCR reaction was 5’-end radioactively labeled with polynucleotide kinase and P-ATP. [25] The single-end-labeled DNA templates were gel-purified and single nucleosomes were assembled on the templates by dialysis from 2 M NaCl. [25] Nucleosome positioning was unique on at least 95% of the templates.
Hydroxyl radical footprinting. Hydroxyl radicals introduce non-sequence-specific single-nucleotide gaps in DNA, unless DNA is protected by DNA-bound proteins. [26] Hydroxyl radical footprinting was conducted using single-end-labeled histone-free DNA or nucleosomal templates as previously described. [26] In short, 20-100 ng of single-end-labeled DNA or nucleosomal templates were incubated in 10 mM HEPES buffer (pH 8.0) in the presence of hydroxyl radical-generating reagents present at the following final concentrations (2 mM Fe(II)-EDTA, 0.6% H2O2, 20 mM Na-ascorbate) for 2 min at C. Reaction was stopped by adding thiourea to 10 mM final concentration. DNA was extracted with Phe:Chl (1:1), precipitated with ethanol, dissolved in a loading buffer and analyzed by 8% denaturing PAGE.
Data analysis and sequence alignment. The denaturing gels were dried on Whatman 3MM paper, exposed to a Cyclone screen, scanned using a Cyclone and quantified using OptiQuant software (Perklin Elmer). Positions of nucleotides that are sensitive to or protected from hydroxyl radicals were identified by comparison with the sequence-specific DNA markers (Supplementary Fig. 13). The dyad was localized by comparison of the obtained footprints with the footprints of the nucleosome assembled on human -satellite DNA. The latter footprints were modeled based on the available 2.8 Å resolution X-ray nucleosome structure. [27]
6 Supplementary Tables
Table 1. Predicted () and measured () free energies of computationally designed sequences. Experimental free energies are shown relative to the reference sequence from the L.variegatus 5S rRNA gene. Histone binding is dominated by the contribution from the tetramer with the 71 bp binding site. [22] The best binder is created by using simulated annealing to introduce mutations and thus minimize the energy of a 71 bp DNA molecule. B71S1 and B71S2 have different sequences flanking the 71 bp designed site (whose contribution dominates the total free energy). 601S1 and 601S2 consist of the 71 bp site from the center of the 601 sequence [24] and flanking sequences from B71S1 and B71S2, respectively. W147S is a 147 bp sequence whose free energy (with contributions from multiple binding sites) was maximized by simulated annealing. X146 and X147 are 146 bp and 147 bp DNA sequences from nucleosome crystal structures 1aoi [27] and 1kx5.[6]
| (arb.units) | (kcal/mol) | |
|---|---|---|
| B71S1 | -20.09 | -1.57 0.41 |
| B71S2 | -20.10 | -1.51 0.27 |
| 601S1 | -0.49 | -2.99 0.55 |
| 601S2 | -1.74 | -2.46 0.18 |
| W147S | 15.26 | 0.09 0.23 |
| X147 | 5.92 | 0.75 0.29 |
| X146 | 6.86 | 0.45 0.91 |
Table 2. Average values of DNA geometric parameters for each dinucleotide type. Dinucleotides are counted in both 5’ and 3’ directions of strand I (which is chosen arbitrarily). Note that by construction only tilt and shift switch signs when the dinucleotide direction is changed. [4, 5] N - total number of dinucleotides of a given type found in the non-redundant database of protein-DNA structures (see Supplementary Methods). Angles (twist, roll, tilt) are measured in degrees (∘), displacements (shift, slide, rise) are measured in Angstroms (Å).
| Dinucleotide | N | Twist | Roll | Tilt | Shift | Slide | Rise |
|---|---|---|---|---|---|---|---|
| AA/TT | 163 | 35.31 | 0.76 | 1.84 | 0.05 | -0.21 | 3.27 |
| AC/GT | 154 | 31.52 | 0.91 | 0.64 | 0.21 | -0.54 | 3.39 |
| AG/CT | 128 | 33.05 | 3.15 | 1.48 | 0.12 | -0.27 | 3.38 |
| CA/TG | 146 | 35.02 | 5.95 | 0.05 | 0.16 | 0.18 | 3.38 |
| CC/GG | 133 | 33.17 | 3.86 | 0.40 | 0.02 | -0.47 | 3.28 |
| GA/TC | 138 | 34.80 | 3.87 | 1.52 | 0.27 | -0.03 | 3.35 |
| CG | 124 | 35.30 | 4.29 | 0.00 | 0.00 | 0.57 | 3.49 |
| GC | 102 | 34.38 | 0.67 | 0.00 | 0.00 | -0.07 | 3.38 |
| AT | 174 | 31.21 | -1.39 | 0.00 | 0.00 | -0.56 | 3.39 |
| TA | 156 | 36.20 | 5.25 | 0.00 | 0.00 | 0.03 | 3.34 |
Table 3. Standard deviations of DNA geometric parameters for each dinucleotide type. Dinucleotides are counted in both 5’ and 3’ directions of strand I (which is chosen arbitrarily). N - total number of dinucleotides of a given type found in the non-redundant database of protein-DNA structures (see Supplementary Methods).
| Dinucleotide | N | Twist | Roll | Tilt | Shift | Slide | Rise |
|---|---|---|---|---|---|---|---|
| AA/TT | 163/163 | 3.61 | 4.55 | 1.69 | 0.32 | 0.39 | 0.19 |
| AC/GT | 154/154 | 3.10 | 3.91 | 1.85 | 0.48 | 0.32 | 0.20 |
| AG/CT | 128/128 | 4.06 | 4.07 | 2.27 | 0.51 | 0.51 | 0.24 |
| CA/TG | 146/146 | 4.17 | 4.67 | 2.15 | 0.56 | 0.77 | 0.26 |
| CC/GG | 133/133 | 4.76 | 4.37 | 2.86 | 0.67 | 0.73 | 0.27 |
| GA/TC | 138/138 | 4.03 | 3.78 | 2.06 | 0.48 | 0.61 | 0.20 |
| CG | 124 | 4.49 | 5.54 | 2.42 | 0.69 | 0.56 | 0.28 |
| GC | 102 | 4.94 | 4.37 | 2.42 | 0.65 | 0.60 | 0.20 |
| AT | 174 | 3.04 | 3.64 | 1.25 | 0.39 | 0.27 | 0.18 |
| TA | 156 | 7.07 | 6.17 | 2.35 | 0.48 | 0.91 | 0.21 |
Table 4. Force constant matrices for each dinucleotide type. Dinucleotides are counted in both 5’ and 3’ directions of strand I (which is chosen arbitrarily). By construction, tilt and shift switch signs when the dinucleotide direction is changed, [4, 5] inducing a corresponding sign change in the force constants involving these degrees of freedom.
| Twist | Roll | Tilt | Shift | Slide | Rise | |
| AA/TT | ||||||
| Twist | 0.130 | 0.041 | 0.046 | 0.159 | -0.305 | 0.739 |
| Roll | 0.041 | 0.069 | 0.026 | 0.053 | -0.213 | -0.135 |
| Tilt | 0.046 | 0.026 | 0.406 | -0.408 | 0.073 | 0.403 |
| Shift | 0.159 | 0.053 | -0.408 | 11.948 | 2.162 | 2.511 |
| Slide | -0.305 | -0.213 | 0.073 | 2.162 | 8.241 | -5.353 |
| Rise | 0.739 | -0.135 | 0.403 | 2.511 | -5.353 | 35.715 |
| AC/GT | ||||||
| Twist | 0.179 | 0.053 | 0.015 | 0.083 | -0.118 | 1.244 |
| Roll | 0.053 | 0.085 | 0.003 | 0.048 | 0.049 | 0.089 |
| Tilt | 0.015 | 0.003 | 0.323 | -0.312 | 0.298 | 0.219 |
| Shift | 0.083 | 0.048 | -0.312 | 4.912 | 1.672 | 0.872 |
| Slide | -0.118 | 0.049 | 0.298 | 1.672 | 10.089 | -3.277 |
| Rise | 1.244 | 0.089 | 0.219 | 0.872 | -3.277 | 35.709 |
| AG/CT | ||||||
| Twist | 0.113 | 0.038 | 0.001 | 0.168 | 0.040 | 0.850 |
| Roll | 0.038 | 0.077 | 0.022 | 0.006 | -0.023 | 0.067 |
| Tilt | 0.001 | 0.022 | 0.280 | -0.365 | 0.252 | 0.995 |
| Shift | 0.168 | 0.006 | -0.365 | 4.954 | 0.527 | 0.093 |
| Slide | 0.040 | -0.023 | 0.252 | 0.527 | 4.516 | -2.966 |
| Rise | 0.850 | 0.067 | 0.995 | 0.093 | -2.966 | 29.330 |
| CA/TG | ||||||
| Twist | 0.098 | 0.027 | 0.034 | 0.061 | -0.254 | 0.799 |
| Roll | 0.027 | 0.059 | 0.046 | 0.165 | -0.016 | 0.202 |
| Tilt | 0.034 | 0.046 | 0.393 | -0.965 | 0.174 | 0.593 |
| Shift | 0.061 | 0.165 | -0.965 | 5.740 | 0.117 | 1.963 |
| Slide | -0.254 | -0.016 | 0.174 | 0.117 | 2.772 | -4.449 |
| Rise | 0.799 | 0.202 | 0.593 | 1.963 | -4.449 | 23.870 |
Table 4 (continued).
| Twist | Roll | Tilt | Shift | Slide | Rise | |
| CC/GG | ||||||
| Twist | 0.114 | 0.045 | 0.008 | 0.139 | -0.328 | 1.587 |
| Roll | 0.045 | 0.075 | 0.014 | 0.005 | -0.083 | 0.797 |
| Tilt | 0.008 | 0.014 | 0.218 | -0.537 | 0.215 | 0.066 |
| Shift | 0.139 | 0.005 | -0.537 | 3.917 | 0.085 | 0.401 |
| Slide | -0.328 | -0.083 | 0.215 | 0.085 | 3.795 | -7.972 |
| Rise | 1.587 | 0.797 | 0.066 | 0.401 | -7.972 | 41.678 |
| GA/TC | ||||||
| Twist | 0.133 | 0.055 | 0.027 | 0.073 | -0.350 | 1.301 |
| Roll | 0.055 | 0.097 | 0.042 | 0.099 | -0.158 | 0.336 |
| Tilt | 0.027 | 0.042 | 0.408 | -1.012 | 0.016 | 0.139 |
| Shift | 0.073 | 0.099 | -1.012 | 10.434 | 3.814 | 1.105 |
| Slide | -0.350 | -0.158 | 0.016 | 3.814 | 6.278 | -7.676 |
| Rise | 1.301 | 0.336 | 0.139 | 1.105 | -7.676 | 41.988 |
| CG | ||||||
| Twist | 0.101 | 0.020 | 0.000 | 0.000 | -0.278 | 0.806 |
| Roll | 0.020 | 0.040 | 0.000 | 0.000 | 0.001 | -0.046 |
| Tilt | 0.000 | 0.000 | 0.255 | -0.510 | 0.000 | 0.000 |
| Shift | 0.000 | 0.000 | -0.510 | 3.104 | 0.000 | 0.000 |
| Slide | -0.278 | 0.001 | 0.000 | 0.000 | 3.991 | -2.936 |
| Rise | 0.806 | -0.046 | 0.000 | 0.000 | -2.936 | 20.174 |
| GC | ||||||
| Twist | 0.069 | 0.006 | 0.000 | 0.000 | -0.217 | 0.646 |
| Roll | 0.006 | 0.057 | 0.000 | 0.000 | 0.094 | 0.168 |
| Tilt | 0.000 | 0.000 | 0.256 | -0.542 | 0.000 | 0.000 |
| Shift | 0.000 | 0.000 | -0.542 | 3.473 | 0.000 | 0.000 |
| Slide | -0.217 | 0.094 | 0.000 | 0.000 | 4.030 | 1.322 |
| Rise | 0.646 | 0.168 | 0.000 | 0.000 | 1.322 | 34.392 |
| AT | ||||||
| Twist | 0.189 | 0.068 | 0.000 | 0.000 | 0.111 | 1.195 |
| Roll | 0.068 | 0.124 | 0.000 | 0.000 | 0.438 | -0.397 |
| Tilt | 0.000 | 0.000 | 0.641 | -0.043 | 0.000 | 0.000 |
| Shift | 0.000 | 0.000 | -0.043 | 6.670 | 0.000 | 0.000 |
| Slide | 0.111 | 0.438 | 0.000 | 0.000 | 15.942 | -2.611 |
| Rise | 1.195 | -0.397 | 0.000 | 0.000 | -2.611 | 47.789 |
Table 4 (continued).
| Twist | Roll | Tilt | Shift | Slide | Rise | |
|---|---|---|---|---|---|---|
| TA | ||||||
| Twist | 0.112 | 0.056 | 0.000 | 0.000 | -0.572 | 1.466 |
| Roll | 0.056 | 0.064 | 0.000 | 0.000 | -0.146 | 0.318 |
| Tilt | 0.000 | 0.000 | 0.365 | -1.271 | 0.000 | 0.000 |
| Shift | 0.000 | 0.000 | -1.271 | 8.767 | 0.000 | 0.000 |
| Slide | -0.572 | -0.146 | 0.000 | 0.000 | 4.961 | -12.092 |
| Rise | 1.466 | 0.318 | 0.000 | 0.000 | -12.092 | 54.957 |
![[Uncaptioned image]](/html/0805.4017/assets/Figures/SI_Figure2.png)
![[Uncaptioned image]](/html/0805.4017/assets/Figures/SI_Figure6_Dec2007.png)

![[Uncaptioned image]](/html/0805.4017/assets/Figures/SI_replyFig1a_April2008.png)
![[Uncaptioned image]](/html/0805.4017/assets/Figures/SI_Figure15.png)
References
- [1] Goldstein, H. (1980) Classical Mechanics (2nd edition). Addison-Wesley Publishing Company, Reading, Massachusetts.
- [2] Lu, X. and Olson, W.K. (2003) 3DNA: a software package for the analysis, rebuilding and visualization of three-dimensional nucleic acid structure. Nucl.Acids Res., 31, 5108–5121.
- [3] El Hassan, M.A. and Calladine, C.R. (1995) The assessment of the geometry of dinucleotide steps in double-helical DNA; a new local calculation scheme. J.Mol.Biol., 251, 648–664.
- [4] Lu, X., El Hassan, M.A. and Hunter, C.A. (1997) Structure and conformation of helical nucleic acids: Analysis program (SCHNAaP). J.Mol.Biol., 273, 668–680.
- [5] Lu, X., El Hassan, M.A. and Hunter, C.A. (1997) Structure and conformation of helical nucleic acids: Rebuilding program (SCHNArP). J.Mol.Biol., 273, 681–691.
- [6] Richmond, T.J. and Davey, C.A. (2003) The structure of DNA in the nucleosome core. Nature, 423, 145–150.
- [7] Olson, W.K., Gorin, A.A., Lu, X., Hock, L.M. and Zhurkin, V.B. (1998) DNA sequence-dependent deformability deduced from protein-DNA crystal complexes. Proc.Nat.Acad.Sci., 95, 11163–11168.
- [8] Morozov, A.V., Havranek, J.J., Baker, D. and Siggia, E.D. (2005) Protein-DNA binding specificity predictions with structural models. Nucl.Acids Res. 33, 5781–5798.
- [9] Bouchiat, C., Wang, M.D., Allemand, J.-F., Strick, T., Block, S.M. and Croquette, V. (1999) Estimating the persistence length of a worm-like chain molecule from force-extension measurements. Biophys.J., 76, 409–413.
- [10] Khorasanizadeh, S. (2004) The nucleosome: from genomic organization to genomic regulation. Cell, 116, 259–272.
- [11] Boeger, H., Griesenbeck, J., Strattan, J.S. and Kornberg, R.D. (2003) Nucleosomes unfold completely at a transcriptionally active promoter. Mol.Cell, 11, 1587–1598.
- [12] Wallrath, L.L., Lu, Q., Granok, H. and Elgin, S.C.R. (1994) Architectural variations of inducible eukaryotic promoters: preset and remodeling chromatin structures. Bioessays, 16, 165–170.
- [13] Jenuwein, T. and Allis, C.D. (2001) Translating the histone code. Science, 293, 1074–1080.
- [14] Durbin, R., Eddy, S.R., Krogh, A. and Mitchison, G. (1998) Biological sequence analysis: probabilistic models of proteins and nucleic acids. (Cambridge University Press, Cambridge, MA).
- [15] Segal, E., Fondufe-Mittendorf, Y., Chen, L., Thastrom, A., Field, Y., Moore, I.K., Wang, J.Z. and Widom, J. (2006) A genomic code for nucleosome positioning. Nature, 442, 772–778.
- [16] Morozov, A.V. and Siggia, E.D. (2007) Connecting protein structure with predictions of regulatory sites. Proc.Nat.Acad.Sci. 104, 7068–7073.
- [17] MacIsaac, K.D., Wang, T., Gordon, D.B., Gifford, D.K., Stormo, G.D. and Fraenkel, E. (2006) An improved map of conserved regulatory sites for Saccharomyces cerevisiae. BMC Bioinformatics, 7, 113.
- [18] Basehoar, A.D., Zanton, S.J. and Pugh, B.F. (2004) Identification and distinct regulation of yeast TATA box-containing genes. Cell, 116, 699–709.
- [19] Yuan, G., Liu, Y., Dion, M.F., Slack, M.D., Wu, L.F., Altschuler, S.J. and Rando, O.J. (2005) Genome-scale identification of nucleosome positions in S.cerevisiae. Science, 309, 626–630.
- [20] Albert, I., Mavrich, T.N., Tomsho, L.P., Qi, J., Zanton, S.J., Schuster, S.C. and Pugh, B.F. (2007) Translational and rotational settings of H2A.Z nucleosomes across the Saccharomyces cerevisiae genome. Nature, 446, 572–576.
- [21] Thastrom, A., Lowary, P.T. and Widom, J. (2004) Measurement of Histone-DNA Interaction Free Energy in Nucleosomes. Methods, 33, 33-44.
- [22] Thastrom, A., Bingham, L.M. and Widom, J. (2004) Nucleosomal locations of dominant DNA sequence motifs for histone-DNA interactions and nucleosome positioning. J.Mol.Biol., 338, 695–709.
- [23] Dyer, P.N., Edayathumangalam, R.S., White, C.L., Bao, Y., Chakravarthy, S., Muthurajan, U.M. and Luger, K. (2004) Reconstitution of nucleosome core particles from recombinant histones and DNA. Methods Enzymol., 375, 23-44.
- [24] Lowary, P.T. and Widom, J. (1998) New DNA sequence rules for high affinity binding to histone octamer and sequence-directed nucleosome positioning. J.Mol.Biol., 276, 19–42.
- [25] Walter, W. and Studitsky, V.M. (2004) Construction, analysis, and transcription of model nucleosomal templates. Methods, 33, 18–24.
- [26] Tullius, T.D., Dombroski, B.A., Churchill, M.E. and Kam, L. (1987) Hydroxyl radical footprinting: a high-resolution method for mapping protein-DNA contacts. Methods Enzymol., 155, 537–558.
- [27] Luger, K., Mäder, A.W., Richmond, R.K., Sargent, D.F. and Richmond, T.J. (1997) Crystal structure of the nucleosome core particle at 2.8 Å resolution. Nature, 389, 251–260.
- [28] Thastrom, A., Lowary, P.T., Widlund, H.R., Cao, H., Kubista, M. and Widom, J. (1999) Sequence motifs and free energies of selected natural and non-natural nucleosome positioning DNA sequences. J.Mol.Biol., 288, 213–229.
- [29] Shrader, T.E. and Crothers, D.M. (1989) Artificial nucleosome positioning sequences. Proc.Nat.Acad.Sci., 86, 7418–7422.
- [30] Shrader, T.E. and Crothers, D.M. (1990) Effects of DNA sequence and histone-histone interactions on nucleosome placement. J.Mol.Biol., 216, 69–84.
- [31] Widlund, H.R., Cao, H., Simonsson, S., Magnusson, E., Simonsson, T., Nielsen, P.E., Kahn, J.D., Crothers, D.M. and Kubista, M. (1998) Identification and characterization of genomic nucleosome-positioning sequences. J.Mol.Biol., 267, 807–817.
- [32] Cao, H., Widlund, H.R., Simonsson, T. and Kubista, M. (1998) TGGA repeats impair nucleosome formation. J.Mol.Biol., 281, 253–260.
- [33] Flaus, A., Luger, K., Tan, S. and Richmond, T.J. (1996) Mapping nucleosome position at single base-pair resolution by using site-directed hydroxyl radicals. Proc.Nat.Acad.Sci. 93, 1370–1375.
- [34] Kassabov, S.R., Henry, N.M., Zofall, M., Tsukiyama, T. and Bartholomew, B. (2002) High-resolution mapping of changes in histone-DNA contacts of nucleosomes remodeled by ISW2. Mol.Cell.Biol., 22, 7524–7534.
- [35] Davey, C.S., Pennings, S., Reilly, C., Meehan, R.R. and Allan, J. (2004) A determining influence for CpG dinucleotides on nucleosome positioning in vitro. Nucl.Acids Res. 32, 4322–4331.
- [36] Li, S. and Smerdon, M.J. (2002) Nucleosome structure and repair of N-methylpurines in the GAL1-10 genes of Saccharomyces cerevisiae. J.Biol.Chem., 277, 44651–44659.
- [37] Moreira, J.M. and Holmberg, S. (1998) Nucleosome structure of the yeast CHA1 promoter: analysis of activation-dependent chromatin remodeling of an RNA-polymerase-II-transcribed gene in TBP and RNA pol II mutants defective in vivo in response to acidic activators. EMBO J., 17, 6028–6038.
- [38] Almer, A., Rudolph, H., Hinnen, A. and Hörz, W. (1986) Removal of positioned nucleosomes from the yeast PHO5 promoter upon PHO5 induction releases additional upstream activating DNA elements. EMBO J., 5, 2689–2696.
- [39] Venter, U., Svaren, J., Schmitz, J., Schmid, A. and Hörz, W. (1994) A nucleosome precludes binding of the transcription factor Pho4 in vivo to a critical target site in the PHO5 promoter. EMBO J., 13, 4848–4852.
- [40] Svaren, J. and Hörz, W. (1997) Transcription factors vs nucleosomes: regulation of the PHO5 promoter in yeast. Trends Biochem Sci., 22, 93–97.
- [41] Shimizu, M., Roth, S.Y., Szent-Gyorgyi, C. and Simpson, R.T. (1991) Nucleosomes are positioned with base pair precision adjacent to the operator in Saccharomyces cerevisiae. EMBO J., 10, 3033–3041.
- [42] Weiss, K. and Simpson, R.T. (1998) High-resolution structural analysis of chromatin at specific loci: Saccharomyces cerevisiae silent mating type locus . Mol.Cell.Biol., 18, 5392–5403.
- [43] Bolon, Y.-T. and Bielinsky, A.-K. (2006) The spatial arrangement of ORC binding modules determines the functionality of replication origins in budding yeast. Nucl.Acids Res. 34, 5069–5080.
- [44] Ravindra, A., Weiss, K. and Simpson, R.T. (1999) High-resolution structural analysis of chromatin at specific loci: Saccharomyces cerevisiae silent mating-type locus . Mol.Cell.Biol., 19, 7944–7950.
- [45] Weiss, K. and Simpson, R.T. (1997) Cell type-specific chromatin organization of the region that governs directionality of yeast mating type switching. EMBO J., 16, 4352–4360.
- [46] Verdone, L., Camilloni, G., Di Mauro, E. and Caserta, M. (1996) Chromatin remodeling during Saccharomyces cerevisiae ADH2 gene activation. Mol.Cell.Biol., 16, 1978–1988.
- [47] Sekinger, E.A., Moqtaderi, Z. and Struhl, K. (2005) Intrinsic histone-DNA interactions and low nucleosome density are important for preferential accessibility of promoter regions in yeast. Mol.Cell, 18, 735–748.