The Araucaria Project: VLT-spectroscopy of blue massive stars in NGC 55††thanks: Based on observations obtained at the ESO VLT for Large Programme 171.D-0004.
Abstract
Aims. This is the first paper of a series devoted to studying the population of blue massive stars in NGC 55, a galaxy of the Sculptor group at a distance of about 2 Mpc.
Methods. We have obtained optical (), low-resolution spectra of approximately 200 blue massive stars with VLT-FORS2, which we have classified with the aid of Milky Way and Magellanic Cloud standard stars.
Results. We present the first census of massive blue stars in NGC 55. A study of stellar radial velocities shows agreement with existing H I rotational velocity curve work and reveals the presence of one object with peculiar velocity. A qualitative study of the stellar metallicity suggests that its global distribution over NGC 55 is close to that of the LMC, as derived from previous studies.
Conclusions. We present a catalogue with 164 classifications of blue massive stars in NGC 55. This catalogue is a first and necessary step for the subsequent quantitative study of blue massive stars in NGC 55 with state-of-the-art model atmospheres.
Key Words.:
Galaxies: individual: NGC 55 – Galaxies: stellar content – Stars: early-type – Stars: fundamental parameters – Catalogs.1 INTRODUCTION

The exploration of massive stars in nearby galaxies is experiencing a renewed interest since it became possible to study them spectroscopically outside the Milky Way, even beyond the Local Group, with the new generation of 8-10m class telescopes. There are many reasons for our interest in massive stars: they are the main source of ionisation and chemical enrichment of the Universe and their influence on the chemical and dynamical evolution of galaxies is very strong due to their stellar winds and supernova explosions. Additionally, blue massive stars can be used to measure distance by means of the relationship between their luminosity and their wind momentum (Kudritzki et al. 1995) or their flux-weighted gravity (Kudritzki et al. 2003, 2008). Once calibrated, these techniques can provide distance estimates to the Virgo and Fornax clusters as an alternative distance diagnostic to Cepheids, and with comparable accuracy (see Kudritzki et al. 1999 and references above). However, our knowledge of massive stars is incomplete and the physics involved in their formation and evolution is not totally understood (Kudritzki & Puls 2000; Massey 2003).
Modelling the atmospheres of these stars is a complex task involving non-local thermodynamical equilibrium processes, and strong stellar winds in a spherically extended atmosphere. Each atmospheric model is computed with several free parameters, all of which have different effects on the emerging spectrum. The stellar metal content is crucial, since the stellar wind is driven by the moment transfer between photons escaping from the photosphere and metallic ions (Kudritzki & Puls 2000). Beyond the Milky Way we can study the impact of metallicity on stellar properties, evolution and feedback. Consequently, there is growing interest in studies of massive stars in galaxies with different metal content. In our Galaxy there are numerous studies of clusters and associations (Herrero et al. 1999; Rolleston et al. 2000; Smartt et al. 2001; Herrero et al. 2002; Daflon & Cunha 2004; Dufton et al. 2006), but the Magellanic Clouds are the most targeted due to their proximity and their different metallicity from the Milky Way (Lennon et al. 2003; Rolleston et al. 2003; Trundle et al. 2004; Korn et al. 2005; Lennon et al. 2005; Trundle & Lennon 2005; Hunter et al. 2007; Mokiem et al. 2007; Trundle et al. 2007). Additional work on other galaxies of the Local Group include: M 31 (Venn et al. 2000; Trundle et al. 2002), M 33 (Monteverde & Herrero 1998; Monteverde et al. 2000; Urbaneja et al. 2005b), NGC 6822 (Muschielok et al. 1999; Venn et al. 2001), NGC 3109 (Evans et al. 2007), WLM (Venn et al. 2003; Bresolin et al. 2006) or IC 1613 (Bresolin et al. 2007). Detailed quantitative analyses of extragalactic massive stars reach as far as NGC 300 in the Sculptor group (Bresolin et al. 2002a; Urbaneja et al. 2005a) where iron-group elements have been studied for the first time outside the Local Group by Kudritzki et al. (2008). Beyond that, Bresolin et al. (2001) managed to determine global metallicities for A-type supergiants in NGC 3621 at a distance of 6.7 Mpc.
We now extend the study of massive extragalactic stars to NGC 55. This galaxy is located in the Sculptor group at 1.94 Mpc (Pietrzyński et al. 2006; Gieren et al. 2008), close enough to allow quantitative spectroscopic analyses of bright blue stars. Its large inclination angle (80, Hummel et al. 1986) makes its morphological classification difficult. Some authors argue that NGC 55 is a Magellanic irregular (see for instance Davidge 2005), however we adopt de Vaucouleurs (1961)’s SB(s)m classification for this work. It is one of the largest galaxies of the Sculptor group, together with NGC 300 and NGC 247, and its chemical composition is similar to that of the Large Magellanic Cloud (LMC) ([Fe /H ], Davidge 2005). Photometric studies hint an important population of blue stars (Gieren et al. 2005) mainly in the central region, where intense stellar activity is revealed by bubbles and filaments produced by strong stellar winds and supernova explosions (Tüllmann et al. 2003).
In this paper the first study and census of massive blue stars in NGC 55 is presented. In section 2 we describe briefly the target selection process, the observations and the data reduction. In section 3 we discuss the spectral classification criteria for our catalogue of blue stars in NGC 55. We provide rough estimates for the distribution of stellar radial velocities and metallicities in sections 4 and 5. Finally, a summary and our conclusions are presented in section 6.
2 OBSERVATIONS AND DATA REDUCTION
| Field | RA (J2000) | DEC (J2000) | Total Texp (s) | Date |
|---|---|---|---|---|
| A | 00:15:55.0 | -39:16:13.0 | 10800 | 2004-11-07 |
| B | 00:15:22.9 | -39:13:54.6 | 13500 | 2004-11-10 |
| C1 | 00:14:57.6 | -39:12:28.5 | 10800 | 2004-11-06 |
| C2 | 00:14:57.6 | -39:12:28.5 | 10800 | 2004-11-06 |
| D | 00:14:25.5 | -39:10:21.4 | 16200 | 2004-11-07/2004-11-10 |
Targets were selected from existing V- and I-band photometry obtained as part of the ongoing ARAUCARIA Cepheid search project111http://ezzelino.ifa.hawaii.edu/bresolin/Araucaria/index.html whose results have been reported in Pietrzyński et al. (2006). These data were taken with the Warsaw 1.3 m telescope at Las Campanas Observatory. The telescope is equipped with a mosaic CCD with a field of view of and a scale of about ”/pix. The galaxy’s distance modulus is (Gieren et al. 2008). Accordingly, O and early-B supergiants with have an apparent magnitude , sufficient for low-resolution spectroscopy. Magnitude and colour were the main criteria for candidate selection. NGC 55 has a high galactic latitude () and the foreground reddening is low (, Schlegel et al. 1998). Nonetheless, the internal reddening of the galaxy may not be negligible since NGC 55 is almost ”edge-on”. In fact, the internal reddening affecting the Cepheids in NGC 55 has been estimated from a multiwavelength analysis in Gieren et al. (2008) to be . Figure 1 shows the colour-magnitude diagram from which targets were selected, along with a plot identifying their positions in the galaxy.
The final list of candidates was built by careful examination of the images to reject objects with nearby companions (real or projected) and to avoid overlap with H II regions, a hard task given the inclination of the galaxy. We cannot eliminate the possibility that the targets are unresolved binaries, since at the distance of NGC 55 one arc-second corresponds to pc. In fact, the occurrence of binarity in blue massive stars is quite high. According to Mason et al. (1998) in their study 72.2% of O-type stars in clusters are in binary systems, while the rate is 19.4% for field stars. In addition, the low spectral resolution of our data makes the detection of binaries from their spectra a difficult task.
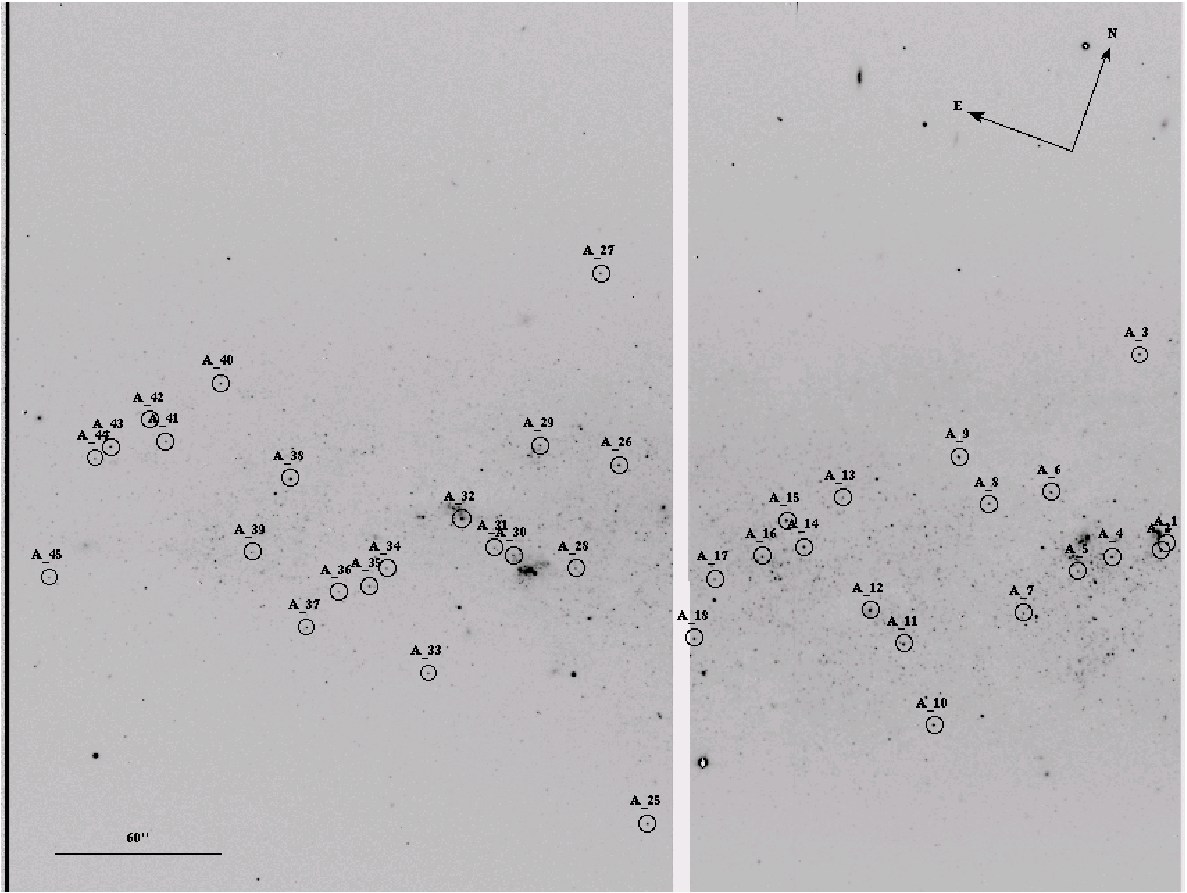
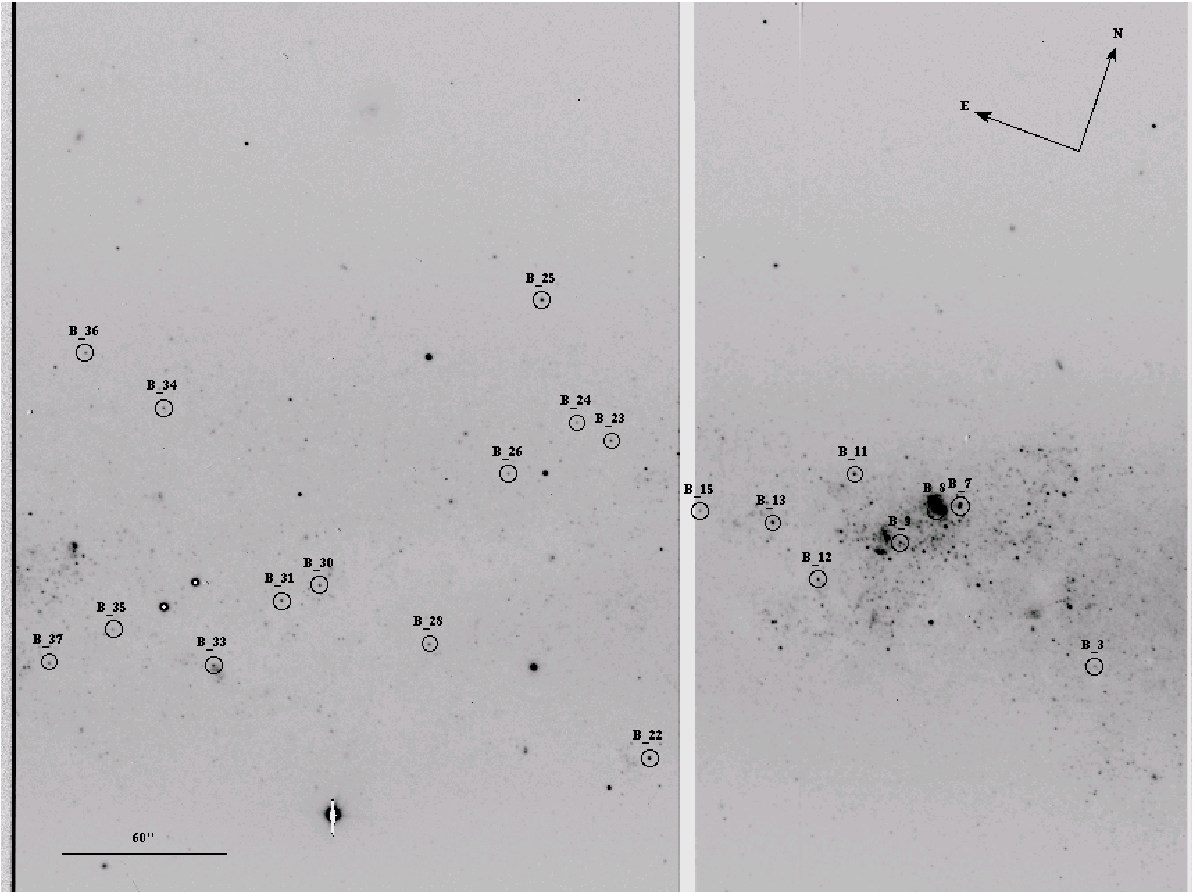
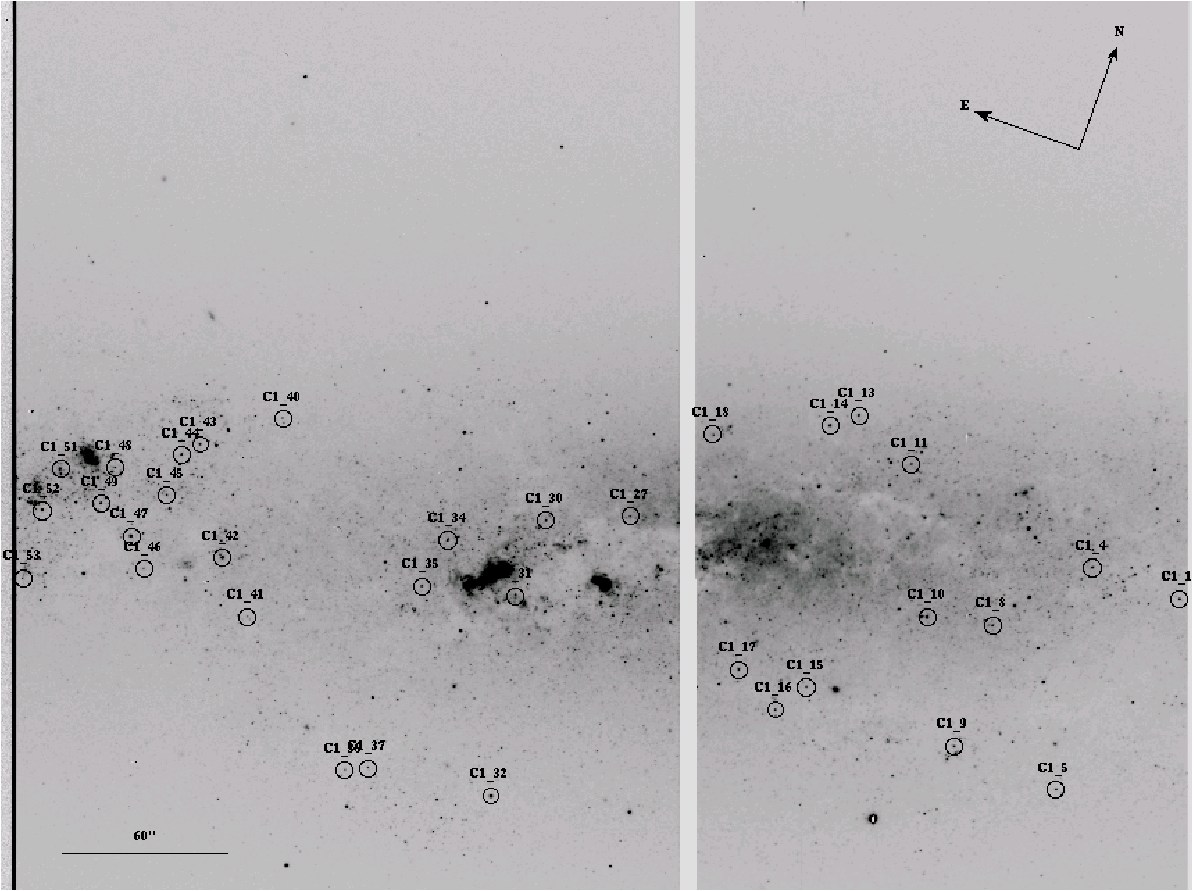
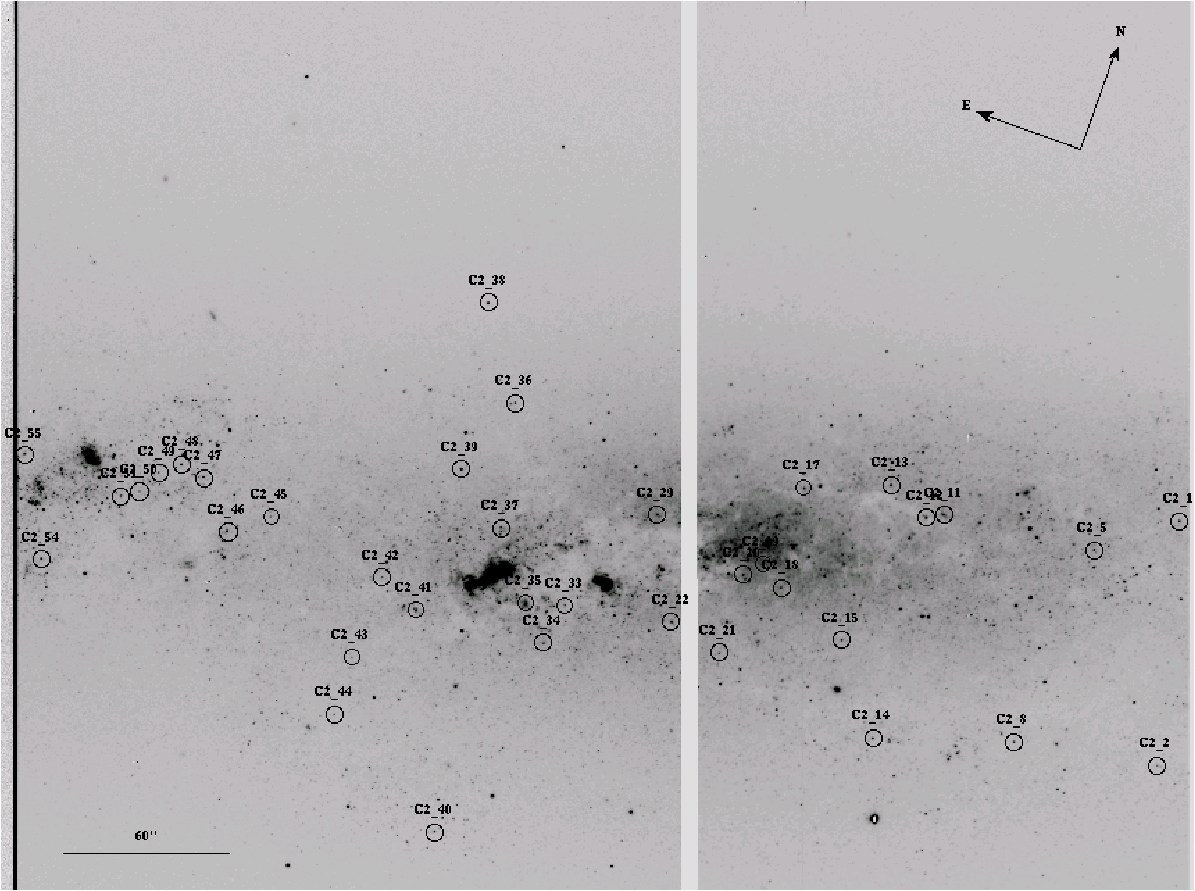
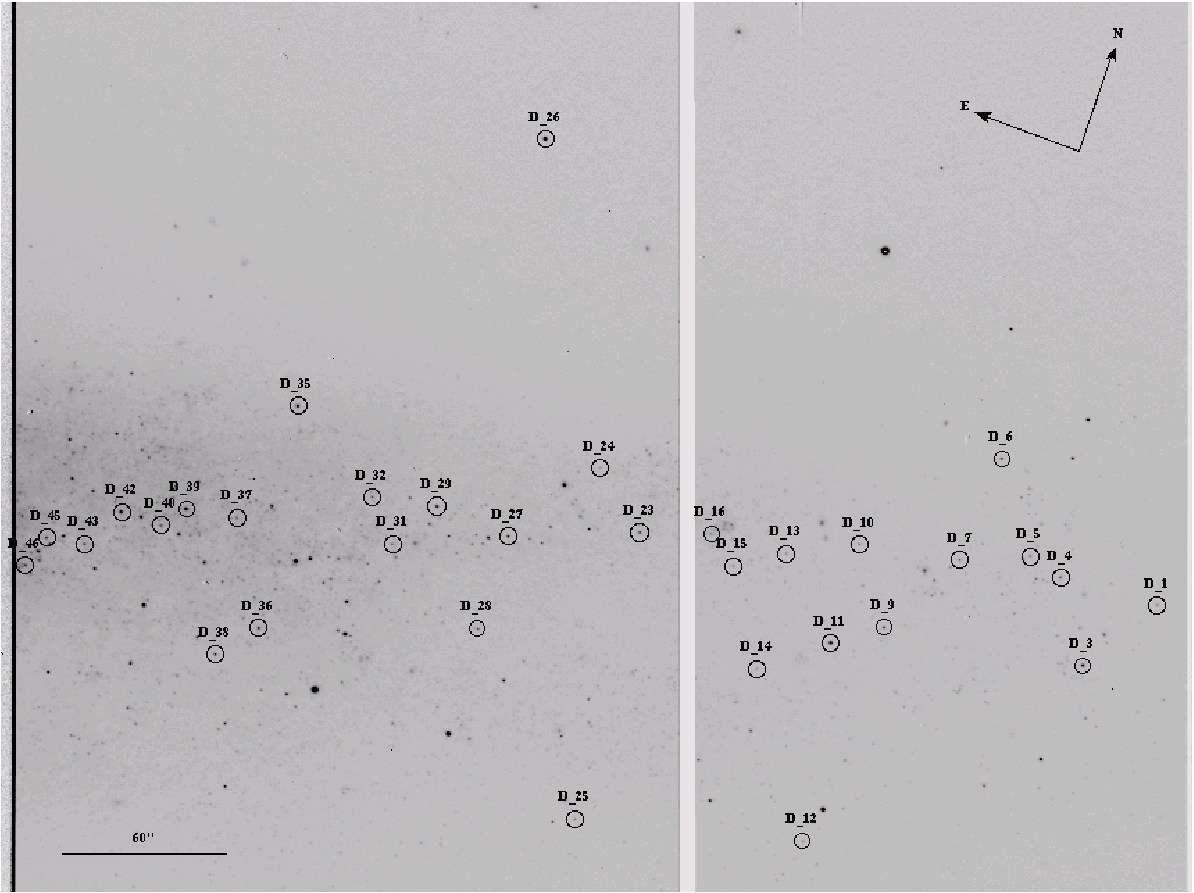
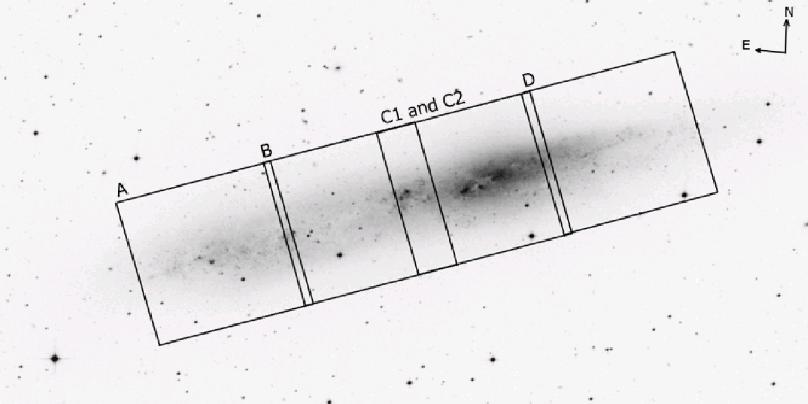
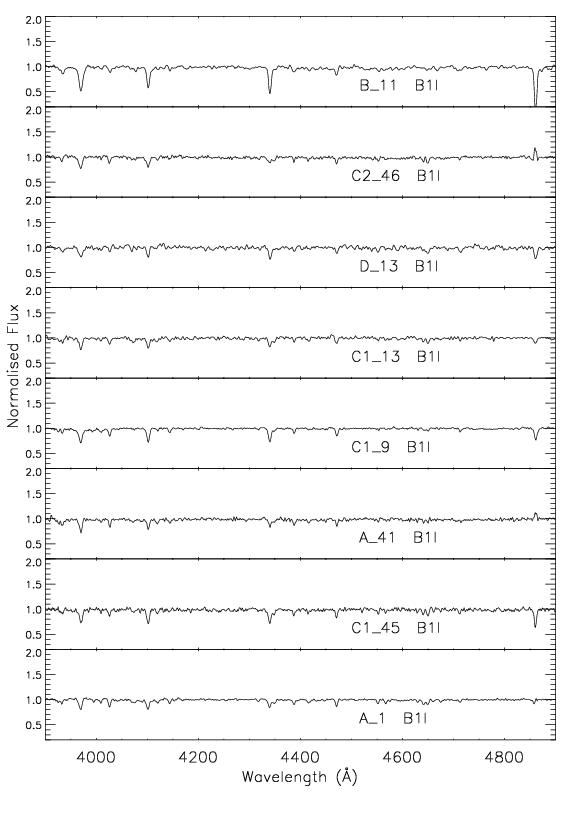
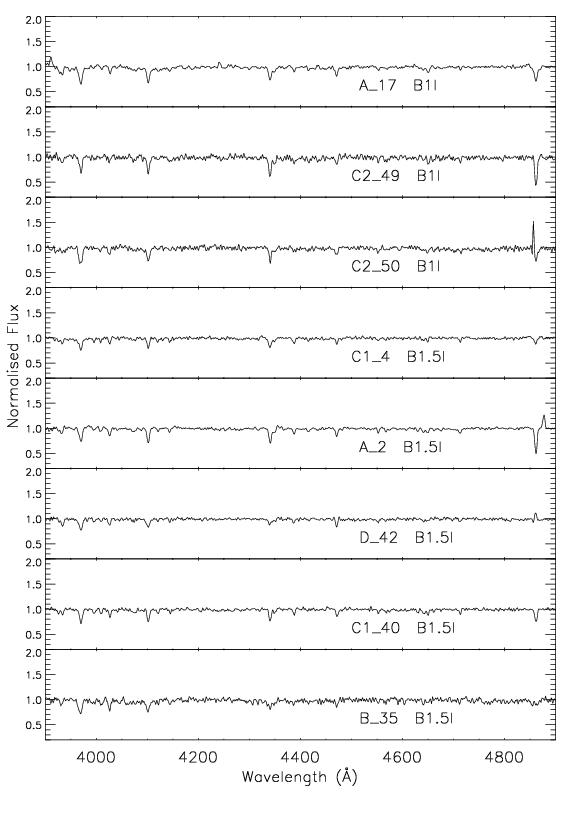
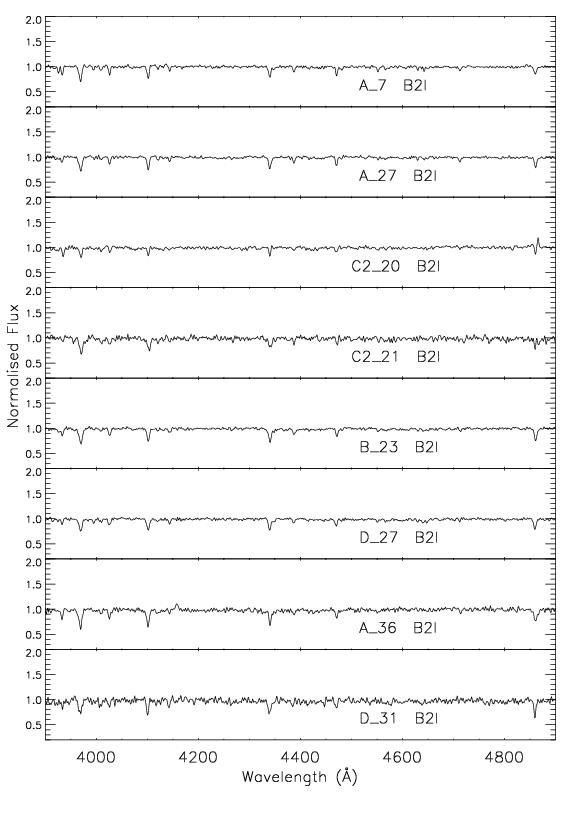
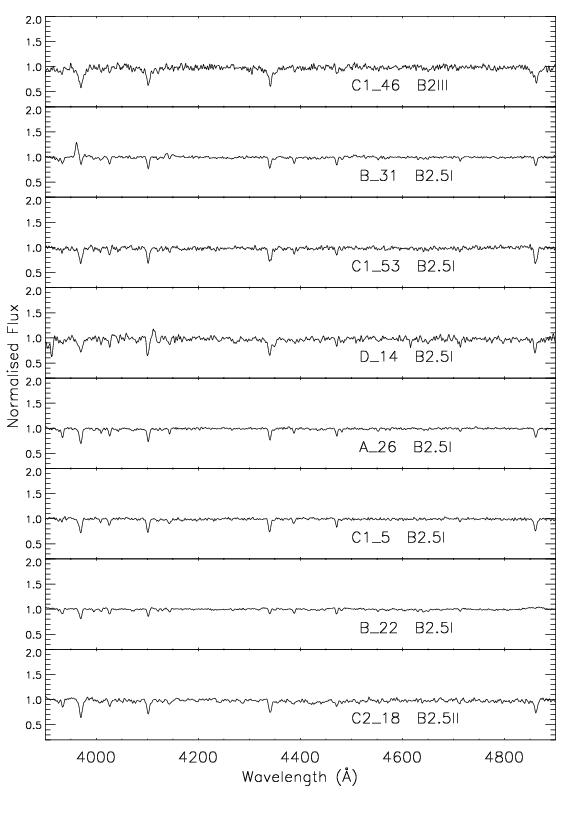
We obtained spectra for 200 objects with FORS2 (FOcal Reducer and low dispersion Spectrograph, Appenzeller et al. (1998)) at the Very Large Telescope (VLT-UT2), in the Mask eXchange Unit (MXU) mode. The observations, performed in November 2004, are summarised in Table 1. The detector is a mosaic of two MIT CCDs with a gap of . The total field of view is . Four pointings were necessary to cover the whole galaxy, as shown in Fig. 2. One mask per field was built with FIMS (FORS Instrumental Mask Simulator), except for the central pointing where the population of blue massive stars is expected to be dense and two masks were needed. The spectra were taken with the 600B grism which provided the highest resolving power for this study () in the wavelength range of interest (Å). Each slit was carved with a width of 1 arc-second. The position of the target stars studied in this paper marked on the FORS2 V-band preimaging is shown in Figs. 34 to 38.
The spectra were reduced with the pipeline developed by Demarco et al. (2005) optimised for FORS2 data and upgraded for this work with the implementation of two new modules: van Dokkum (2001)’s algorithm for cosmic ray rejection, based on the laplacian edge detection; and a routine to normalise flat field images prior to performing the flat-field correction. The pipeline extracts all slits and works with them separately, taking into account the deformation of the slits on the CCD. The code then follows the standard steps for long slit spectrum reduction, using IRAF222IRAF is distributed by the National Optical Astronomy Observatory, which is operated by the Association of Universities for Research in Astronomy, Inc., under cooperative agreement with the National Science Foundation. tasks: bias, flat-field correction and background subtraction. The latter was the most challenging one, since in some instances we were unable to completely correct for nebular contamination. This was particularly problematic in the case of some of the Balmer lines which were filled with nebular emission (see below). The pipeline produces one-dimensional spectra with an optimised wavelength calibration. Finally, the individual exposures were combined (weighted by their count number) and rectified to the local continuum (normalised).
Sky subtraction was a laborious task due to nebular emission, which is particularly strong in the central regions of the galaxy. This contamination is more severe in young stars, which are still embedded in the dense regions where they were born. Interstellar absorption lines (Ca II) can also contaminate the spectrum (Hartmann 1904). Moreover, given the high inclination of the galaxy, photons from a large number of H II regions (with different radial velocities) are integrated along the line of sight. One last problem in the sky subtraction is the low spectral resolution of the data. In spite of all our efforts, the spectra of several stars are strongly contaminated by the background. Nevertheless, in the vast majority of our targets the nebular lines do not compromise the spectral classification.
The reduced spectra have a signal-to-noise ratio (S/N) of on average, sufficient for spectral classification. The spectra of the brightest objects with S/N can be analysed quantitatively, which will be done in a future paper. A few objects are underexposed with S/N smaller than 50.
3 SPECTRAL CLASSIFICATION
| Field | O-Type | B-Type | A-Type | WR-LBVc | Total |
|---|---|---|---|---|---|
| A | 5 | 20 | 13 | 1 | 39 |
| B | 4 | 7 | 7 | 3 | 21 |
| C | 4 | 34 | 30 | 3 | 71 |
| D | 1 | 14 | 18 | 0 | 33 |
| Total | 14 | 75 | 68 | 7 | 164 |
| ID | RA(J2000) | DEC(J2000) | V | V-I | Spectral Type | Rg | S/N | Metallicity | Comments | |
|---|---|---|---|---|---|---|---|---|---|---|
| (1) | (2) | (3) | (4) | (5) | (6) | (7) | (8) | (9) | (10) | (11) |
| D_36 | 0:14:35.07 | -39:11:20.04 | 19.189 | -0.689 | B9I | -278.26 | 78 | 70 | LMC | |
| C2_8 | 0:14:43.87 | -39:12:29.51 | 19.294 | -0.652 | A0I | -147.56 | 95 | 69 | SMC | |
| C1_18 | 0:14:55.94 | -39:11:21.84 | 19.316 | -0.707 | WN8 | -37.95 | 124 | 30 | - | neb. |
| C1_30 | 0:14:59.91 | -39:12:11.88 | 18.921 | -0.425 | LBVc | 95.62 | 158 | 28 | - | |
| C1_37 | 0:15:02.50 | -39:13:58.44 | 19.642 | -0.588 | A7II | 153.43 | 146 | 55 | - | |
| C1_51 | 0:15:14.70 | -39:12:54.36 | 18.306 | -0.098 | Ofpe/WN9 | 319.21 | 187 | 57 | - | neb. |
| B_12 | 0:15:16.68 | -39:13:26.40 | 19.108 | -0.666 | Of/WN | 351.60 | 176 | 90 | - | neb. |
| B_13 | 0:15:18.63 | -39:13:12.72 | 18.543 | -0.435 | LBVc/WN11 | 379.26 | 274 | 103 | - | |
| B_34 | 0:15:37.73 | -39:13:49.08 | 19.533 | -0.242 | LBVc/WN11 | 667.26 | 216 | 35 | - | |
| B_36 | 0:15:40.62 | -39:13:40.07 | 19.782 | -0.389 | O8I | 709.64 | 171 | 55 | - | |
| A_5 | 0:15:40.83 | -39:15:09.72 | 20.071 | -0.495 | A3I | 722.43 | 260 | 58 | - | |
| A_8 | 0:15:44.18 | -39:14:58.20 | 19.792 | -0.188 | O9.7I | 770.70 | 304 | 62 | - | |
| A_11 | 0:15:45.17 | -39:15:56.15 | 18.706 | -0.245 | B5I | 793.59 | 209 | 130 | LMC | |
| A_29 | 0:15:57.97 | -39:15:33.84 | 19.575 | -0.595 | O5If+ | 980.35 | 210 | 62 | - | neb. |
| A_34 | 0:16:01.17 | -39:16:34.67 | 20.247 | -0.875 | B0I | 1036.66 | 215 | 68 | LMC | |
| A_42 | 0:16:09.69 | -39:16:13.44 | 19.453 | -0.189 | LBVc | 1160.17 | 175 | 75 | - |
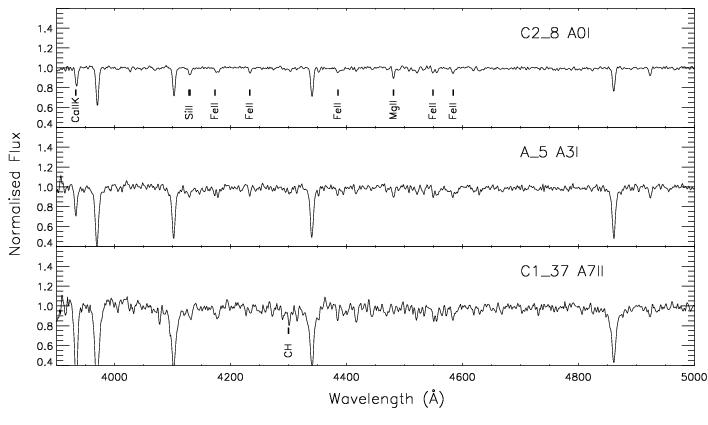
The morphological analysis of stellar spectra is a crucial first step in studying the population of massive stars in a galaxy and provides clues about the stellar parameters of the stars. The main advantage of a classification system is that it preserves its independence from theoretical models or other external information (Walborn 1979).
The system developed by Morgan et al. (1943), together with subsequent refinements by Walborn & Fitzpatrick (1990) (hereafter WF) and Lennon et al. (1992), is the basis for the classification of Galactic stars. However, metallicity alters the strength of the metallic diagnostic lines and therefore the stellar classification criteria are dependent on the star’s metallicity. In newly explored galaxies where the metallicity is not accurately known, we have to be cautious and use the appropriate standards, since the chemical composition of the studied stars may differ from all existing templates. In light of this, we also used as standards those of Fitzpatrick (1991) from the LMC and Lennon (1997) and Evans & Howarth (2003) from the Small Magellanic Cloud (SMC).
NGC 55 seems to have a metallicity similar to the LMC (Tüllmann et al. 2003; Davidge 2005). Following the idea of Fitzpatrick (1991), we have performed the spectral classification of our sample by visual comparison with templates from LMC stars. Even though the metallicities of both galaxies are similar, we have been careful with criteria involving both helium or hydrogen lines and metallic transitions. Criteria based only on metallic transitions, for instance Si III/Si IV, were preferred when available. The luminosity class was determined following WF for O-type stars and using the width of Balmer lines for B- and A-stars (Azzopardi 1987). We also took into account that luminosity and spectral type are not independent. The resolution and quality of the spectra prevented us from doing a luminosity classification finer than I, II, III and V. Besides, the lack of H spectra and the nebular contamination further impairs this distinction. Additional diagnostic metallic lines for luminosity class of B- and A-types exist (see for instance WF), but the variations are smaller given the low metallicity of NGC 55 and cannot be detected at the quality and resolution of the spectra.
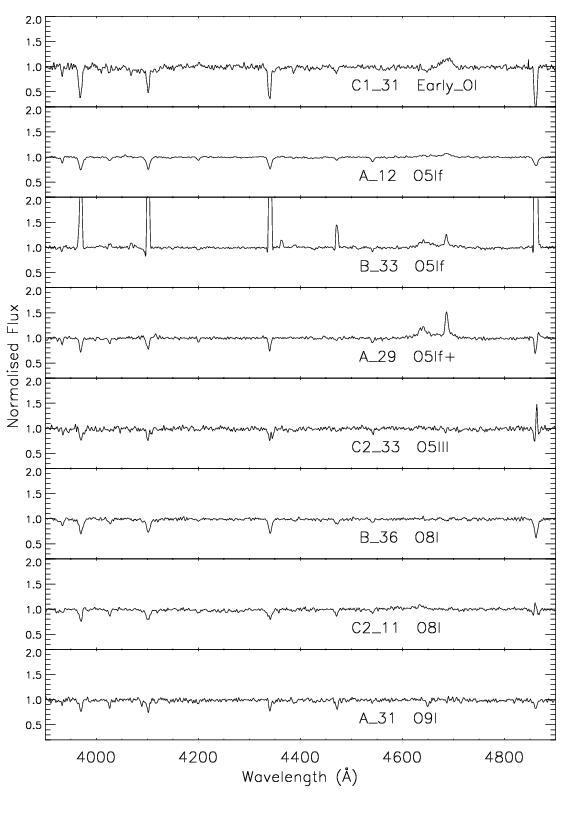
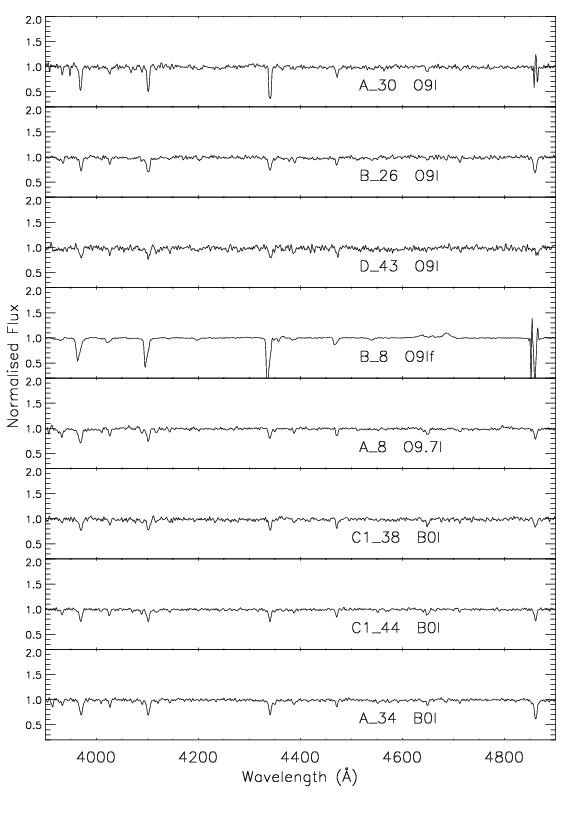
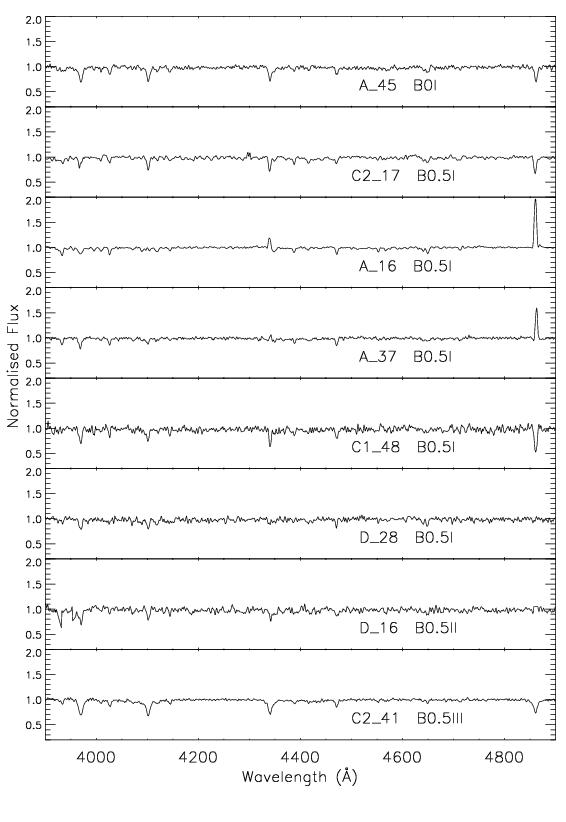
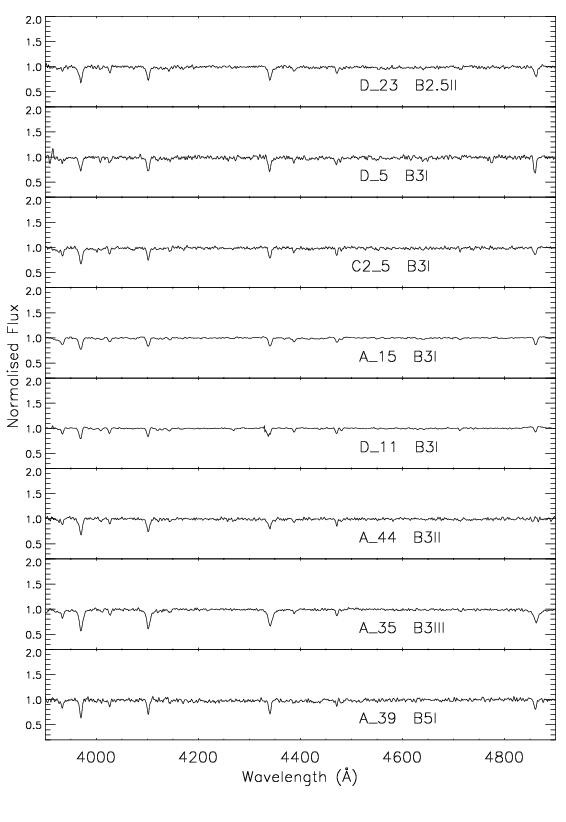
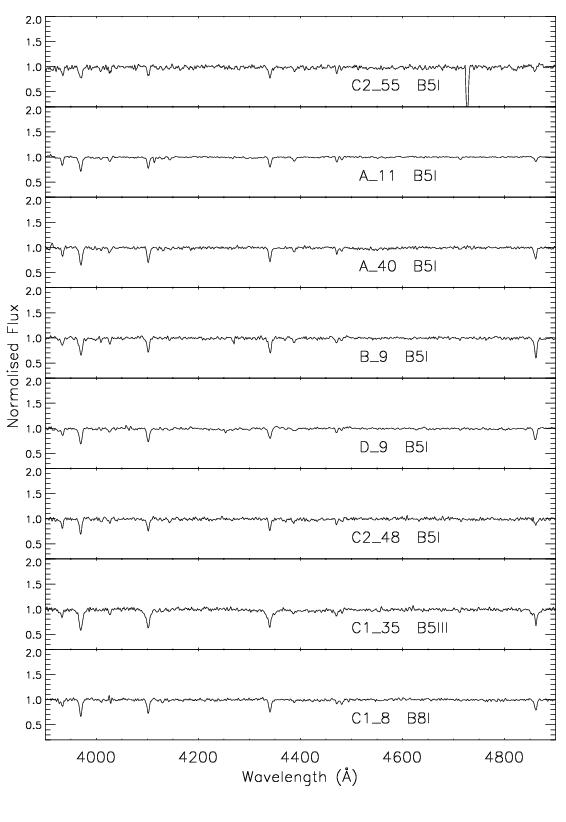
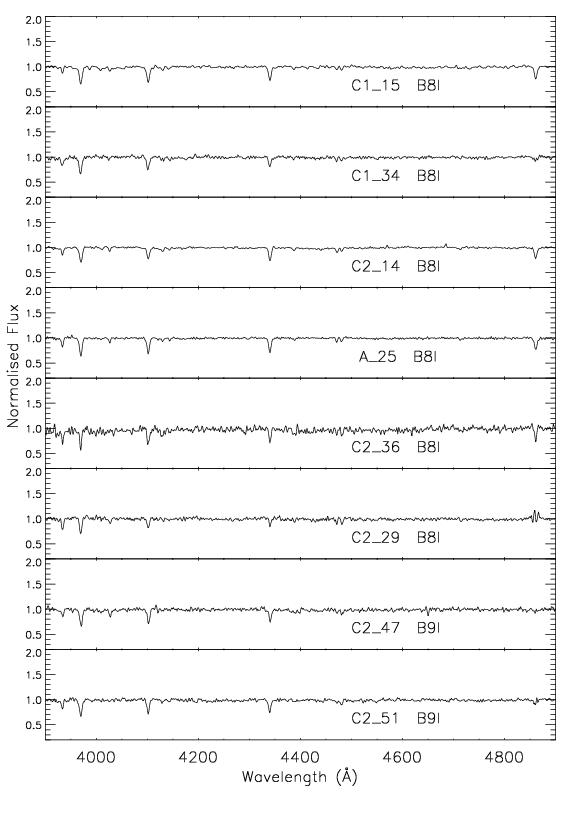
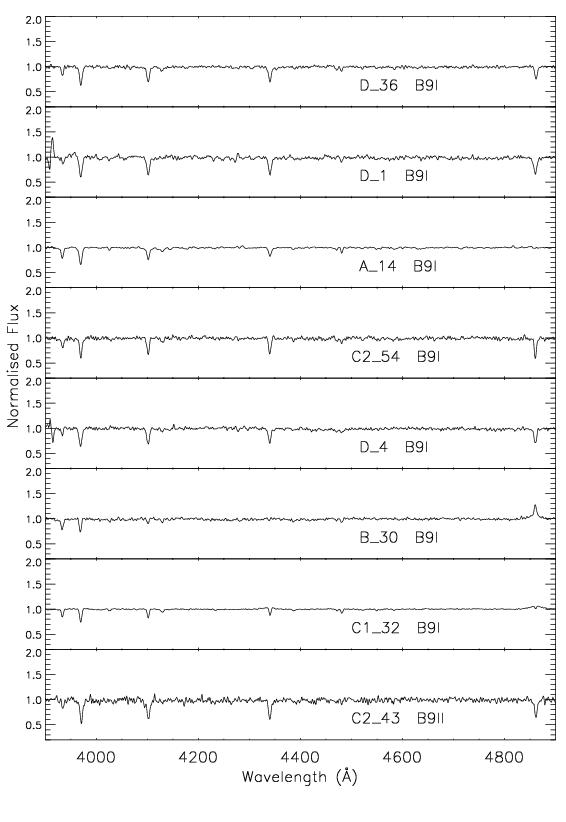
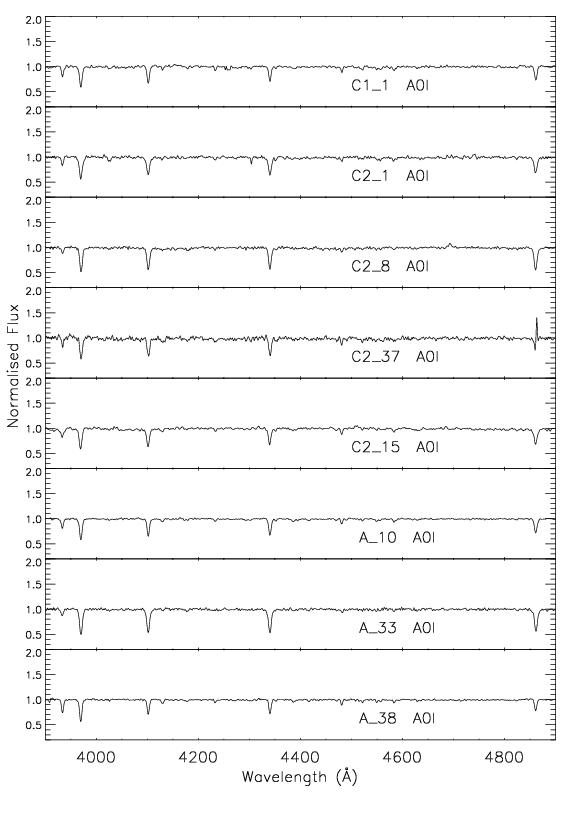
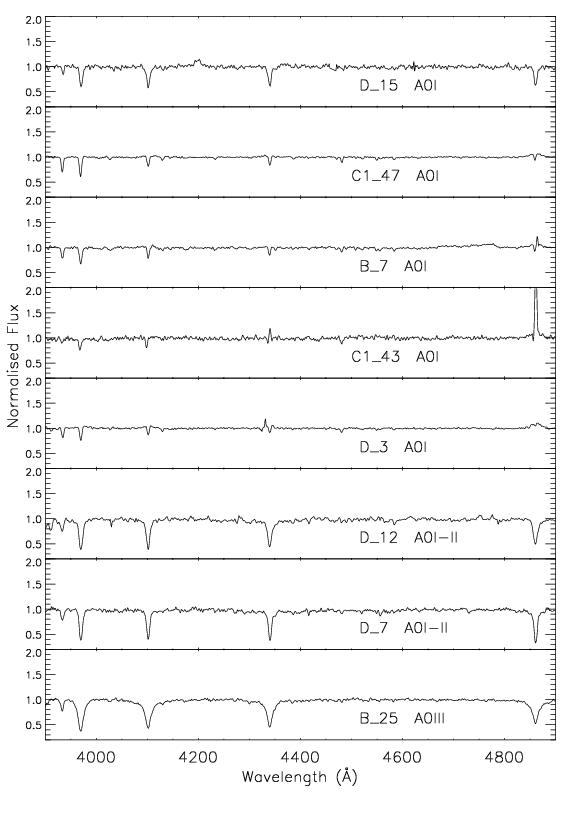
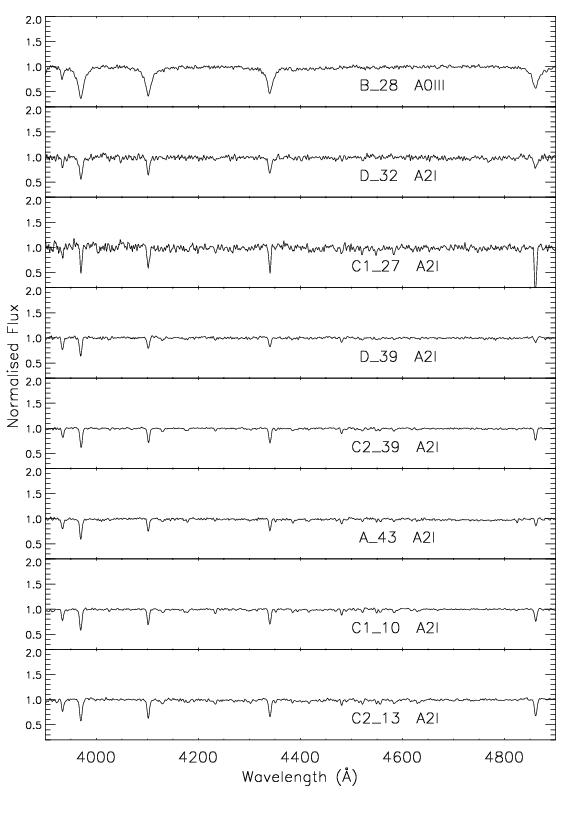
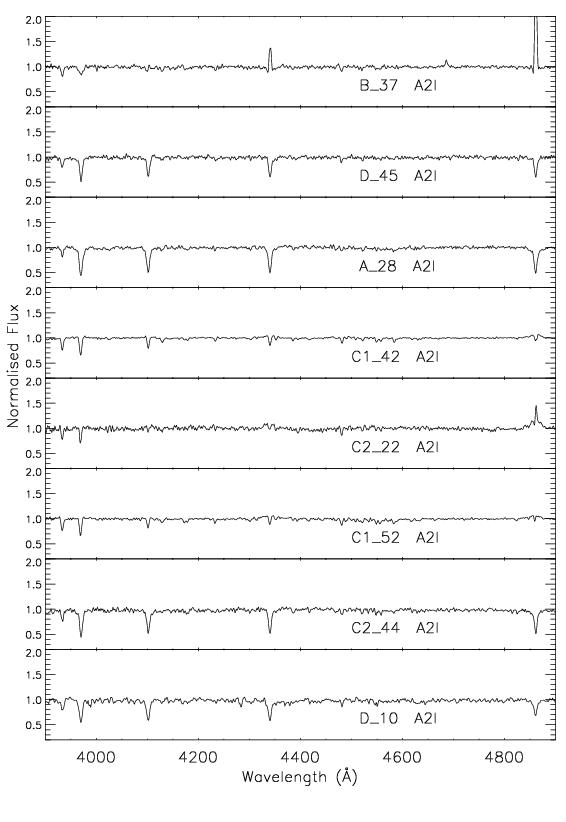
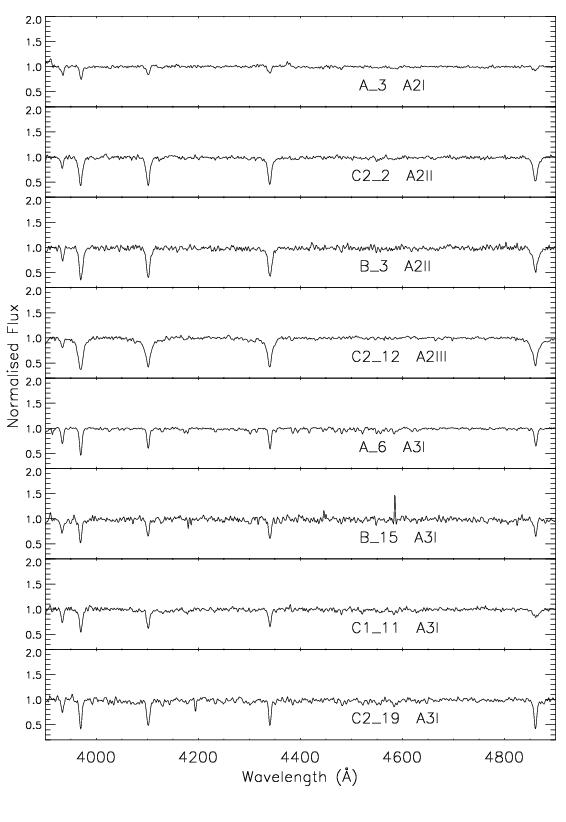
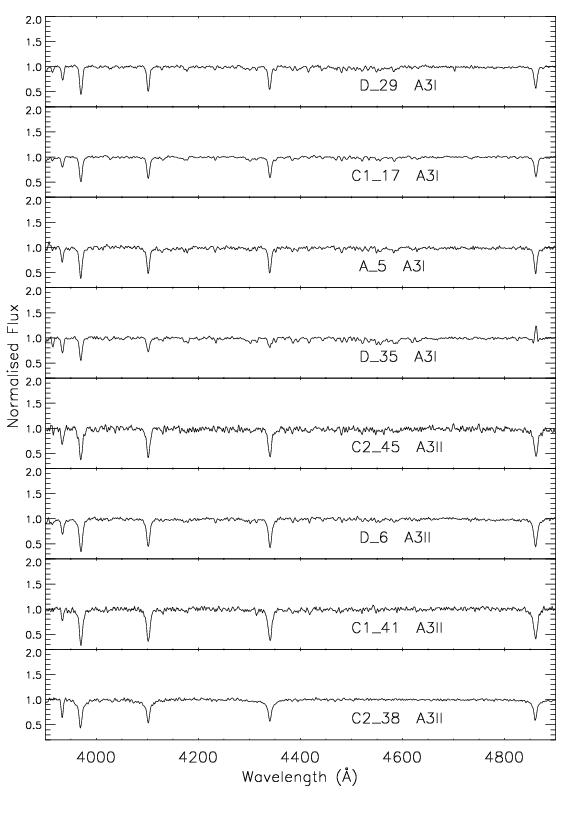
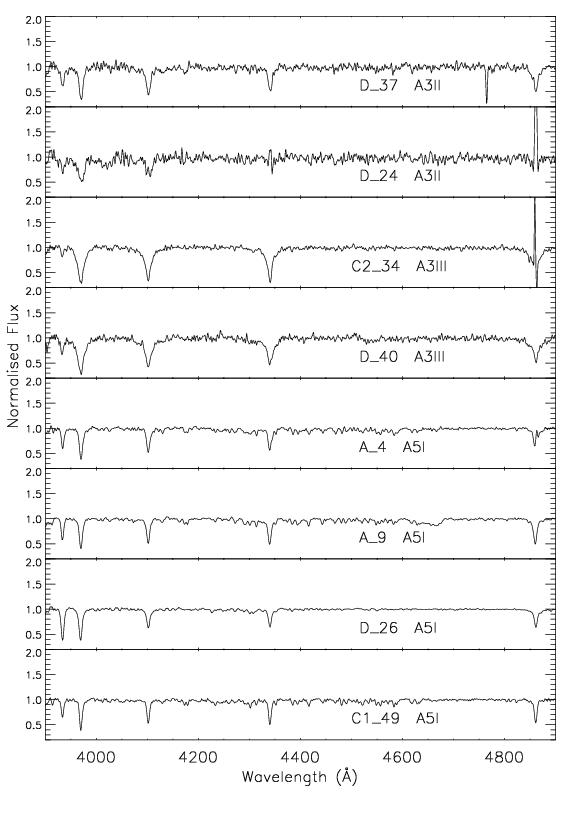
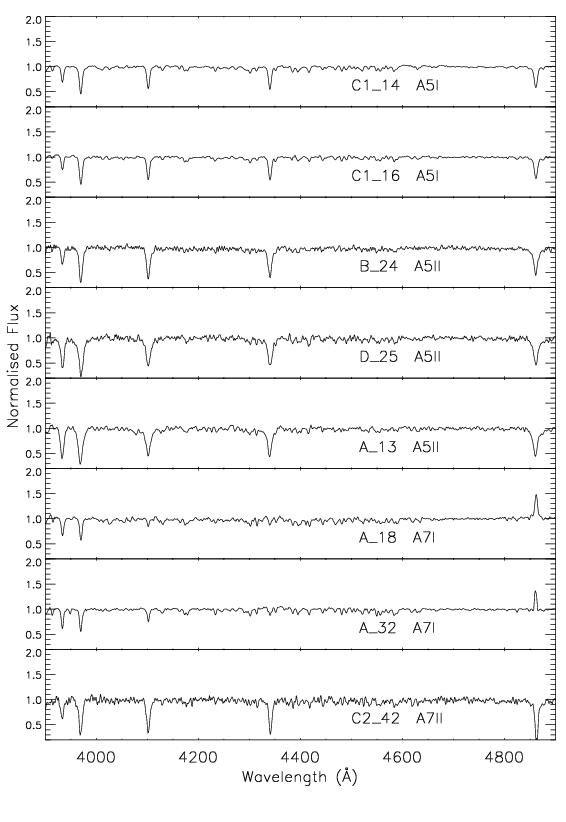
We have provided detailed classifications for 204 spectra, out of which 164 stars seem to belong to NGC 55 and have spectral types earlier than F0. The rest of the objects include F- and G-supergiants (23 stars), H II regions (4 spectra) and a sample of B-, A-, F-, and G-dwarfs (13 stars) plus a white dwarf. The number of different types of blue massive stars found in NGC 55 is provided in Table 2. The complete catalogue is available in the appendices. Table LABEL:t_catalog lists the set of early-type stars (earlier than F0) found in NGC 55 (in Table \thetheorem we show a fragment of the total database as an illustration, including some objects presented in following figures). The catalogue columns are: (1) star identification, consisting of field number followed by slit number; (2) right ascension (hh:mm:ss); (3) declination (dd:mm:ss); (4) V-magnitude; (5) V-I colour; (6) spectral type; (7) projected galactocentric distance (arc-seconds); (8) radial velocity (km s-1); (9) signal-to-noise ratio of the spectrum; (10) metallicity estimate; (11) comments. The corresponding digital spectral atlas is displayed in Figs. 13 – 33. F- and G-stars (classified using Jaschek & Jaschek 1990 and templates from Le Borgne et al. 2003) are compiled in Table LABEL:t_catalogF, for completeness. Finally, Table LABEL:t_catalogMW lists dwarf stars together with a Galactic white dwarf found in the sample.
The accuracy of the classification depends on several factors. It is essential to have spectra of sufficiently high S/N. Faint stars have been assigned only a very rough classification. A good subtraction of cosmic rays and a complete sky subtraction are key points. The latter was not always possible, leaving the Balmer lines (main luminosity class indicators) contaminated by nebular emission at their cores. However, the impact on the luminosity classification was negligible in most cases since we could use the Balmer line wings and the relevant metallic lines were not affected. We have marked the spectra with remaining nebular contamination in the Balmer lines or in the [O III] lines (about 46% of the sample) with comment ’neb.’ in Tables \thetheorem, LABEL:t_catalog, LABEL:t_catalogF and LABEL:t_catalogMW.
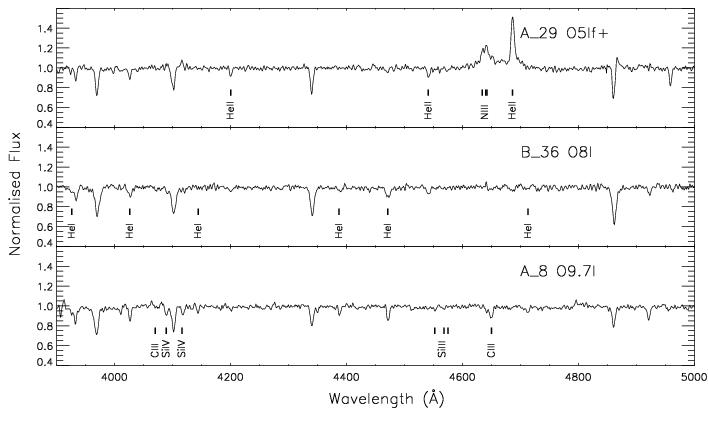
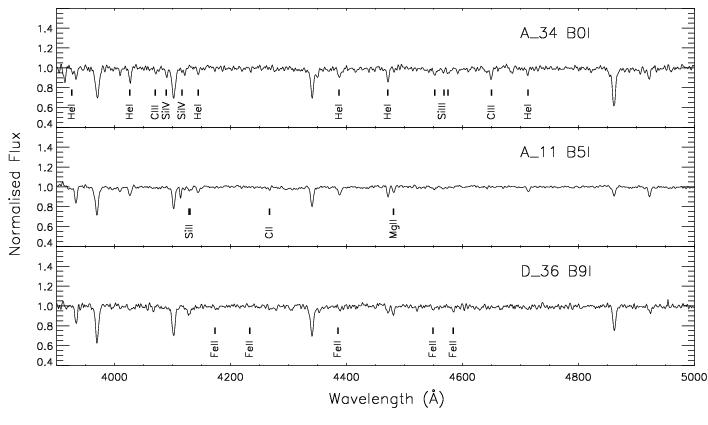
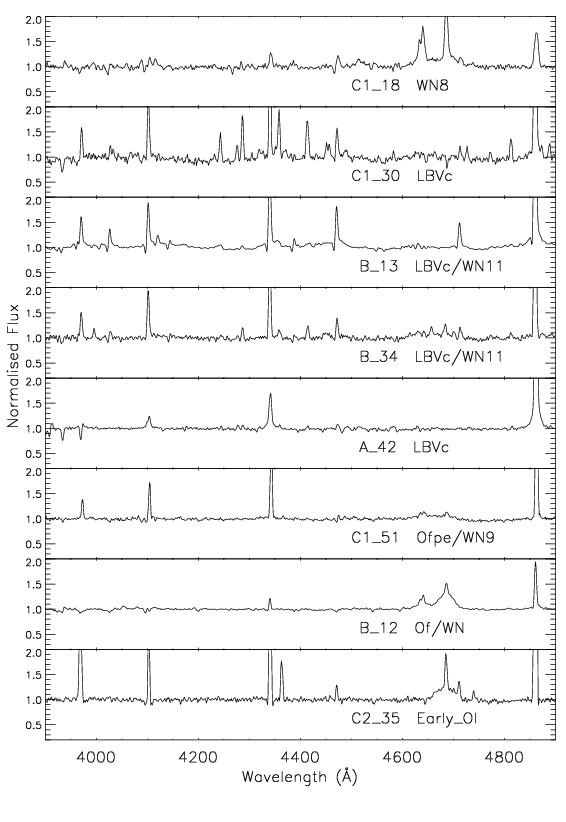
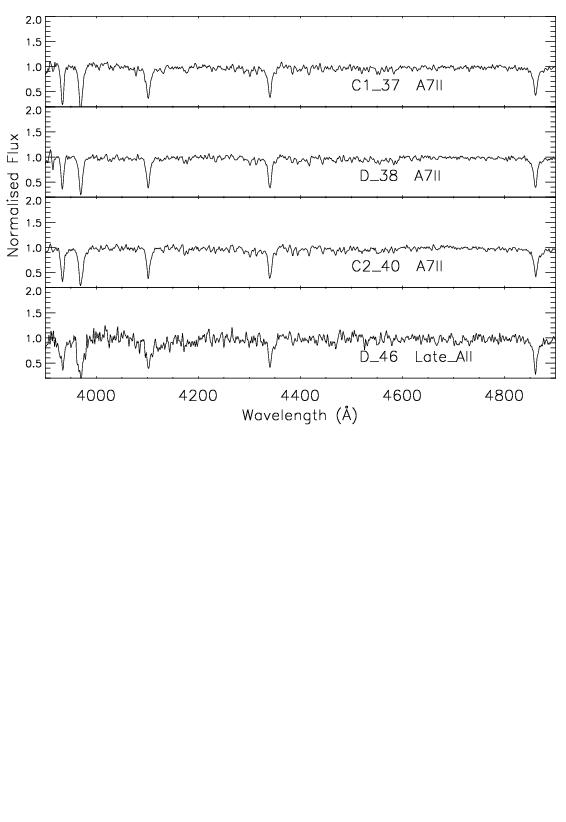
We have found a total of 14 O-type stars in our sample. Fig. 3 shows a subset of these objects. Most of the observed stars (75 of them) are B-type, some examples are presented in Fig. 4. We have classified 68 stars as A-type and some representative examples can be seen in Fig. 5. In these figures we have marked the most important lines used in the spectral classification, following the criteria cited above.
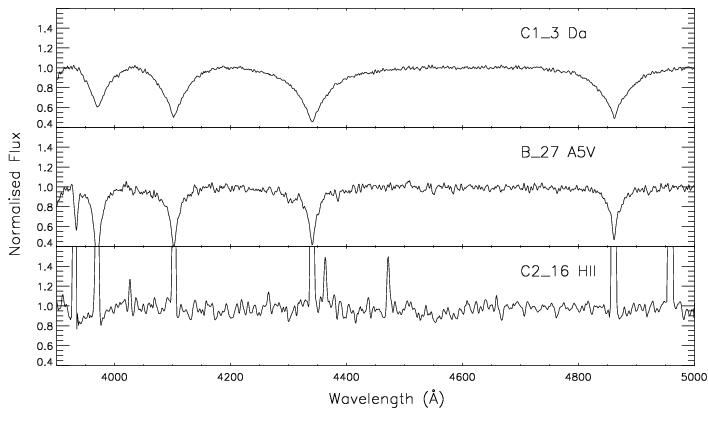
We have also studied a few spectra that display only strong emission lines and have poor S/N, which have been classified as H II regions (although the emission could actually be the result of the contribution from several H II regions). Figure 6 illustrates this case, and also includes an A-type star with low luminosity class and the white dwarf star. Stars with luminosity class V were discarded as members of NGC 55 and very likely belong to the Milky Way, since at the distance of NGC 55 a V-class star would be too faint to be observed. Although their radial velocities (see section 4) concur with the projected position on NGC 55, they are also consistent with the velocity of stars from the halo (Brown et al. 2006).
Twelve stars of the BA sample display the typical absorption lines of B- or A-type stars but broad emission in the wings of the Balmer lines. These might have a nebular origin, however the width of the wings suggests that they are dominated by stellar emission. A possible explanation for these features is a strong wind, but we might be witnessing a Be star, electron scattering or even an outburst stage of LBV where other distinctive features (like emission in Fe II lines) are masked by the low spectral resolution or are too weak (see Walborn & Fitzpatrick 2000, hereafter WF20). A_42 (see Fig. 7) might be an extreme case, where the Balmer lines are completely in emission (see below). We have marked these objects with ’Str. winds?’ in Table LABEL:t_catalog.
3.1 WRs & LBV candidates
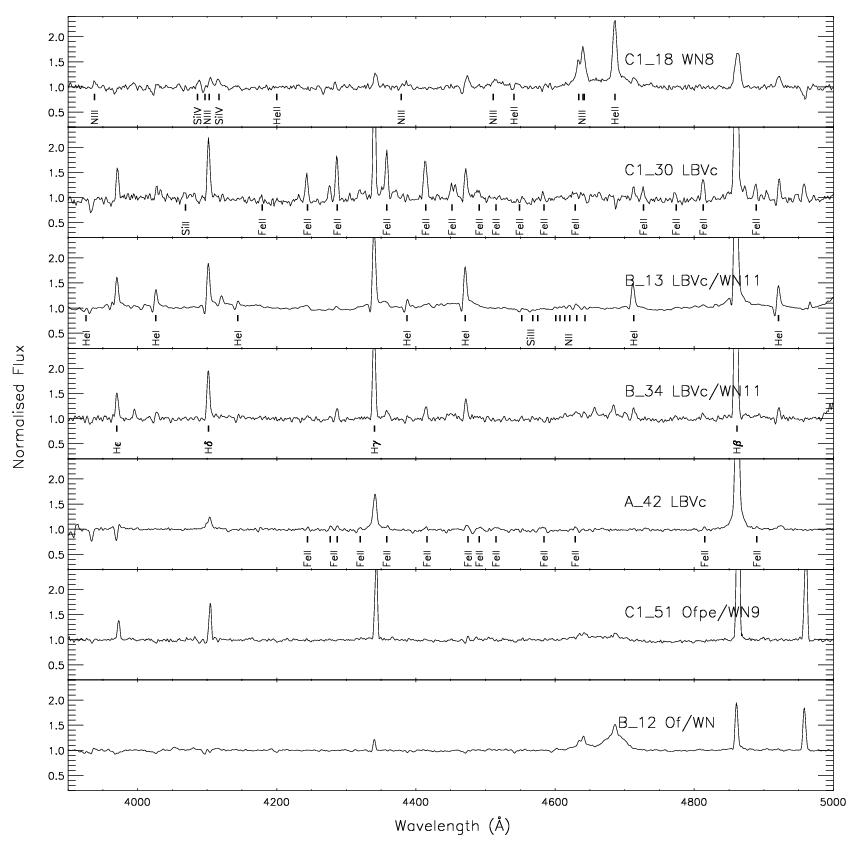
There are 7 NGC 55 blue stars in the sample that do not belong to the normal O, B or A spectral bins. Most of these objects are candidate WR or LBV stars. We referred to ”The OB Zoo” of WF20 and references therein for their classification. The nitrogen WRs (WN) were also classified following the criteria of Smith et al. (1996) based on nitrogen and helium lines. The classification of LBVs is particularly difficult, since they undergo different stages during their evolution (Massey et al. 2007). We looked for similarities with the spectra of known LBVs or LBV candidates (these objects are marked as LBVc in Table \thetheorem and LABEL:t_catalog). The Fe II emission lines were a decisive factor in our identification of these objects.
Figure 7 presents the spectra of these peculiar emission line stars found in the sample. C1_18 shows the typical features of a WN8 star, namely intense emission lines of He II and N III. The templates from WF20 render C1_30 as an iron star and an LBV candidate. Its spectrum is rich in emission lines of hydrogen, helium and iron. Its overall morphology is very similar to that of the LBV “ Carinae”, considered by WF20 as “the mother of all iron stars”. B_13 displays H and P Cygni profiles with strong emission of the hydrogen lines, resembling the morphology of “He3-519”, a possible LBV candidate or WN11 according to WF20. B_34 falls into the same category, although the P Cygni profiles are weaker. These stars present several similar features with a star studied by Bresolin et al. (2002b) in NGC 300, classified as Ofpe/WN9. C1_51 is classified as an Ofpe/WN9 due to its similarity with the objects presented in this group by WF20 and the digital atlas of Ofpe/WN9 of Bohannan & Walborn (1989). B_12 has typical features of Of stars, however we have classified this star as Of/WN due to the broad emission of He II. The spectrum of A_42 presents strong broad emission of Balmer lines that might be due to strong stellar winds. This is an A-star according to its Mg II, Si II and Ca II lines, but in this case the spectrum shows transitions of Fe II in emission. We conclude that this object is an LBV candidate. Finally, C1_43 (not included in Fig. 7) shows features that might be interpreted as Fe II in emission, but its S/N is too poor to be conclusive.
4 RADIAL VELOCITY
Radial velocities were determined from the Doppler wavelength shift of strong absorption lines (Balmer lines, He I, He II and metallic transitions of Mg II, Si III, depending on the spectral type). Alternative radial velocities were also evaluated from the emission lines of the surrounding nebula ([O III]) when available. Radial velocities were calculated in the heliocentric system. For the dates of the observations the correction was km s-1.
From the scatter in the individual determinations of the radial velocity of different lines we have obtained an average uncertainty of km s-1 (note that in the case of nebular emission we have only used one line therefore the accuracy is smaller but enough to compare with the stellar data). Additional error sources apply, such as the wavelength calibration, but are of second order by comparison.
The resulting radial velocities are plotted in Fig. 8 as a function of the projected galactocentric distance, which is calculated with respect to the optical centre of NGC 55 (= = [J2000], Two Micron All Sky Survey team 2003). The results from nebular and stellar lines agree. We have also plotted the rotation curve derived from H I observations by Puche et al. (1991). The track was shifted 1.5’ to match the H I calculated rotation centre and the optical centre. Figure 8 shows how the stellar population traces the rotation of the galaxy, even in its outer parts. We obtain a systematic velocity (i. e. the radial velocity of NGC 55) of 120 km s-1, very similar to the 129 km s-1 obtained by Koribalski et al. (2004). The fact that the young stellar population tracks the H I rotation curve has also been found in NGC 3109 by Evans et al. (2007).
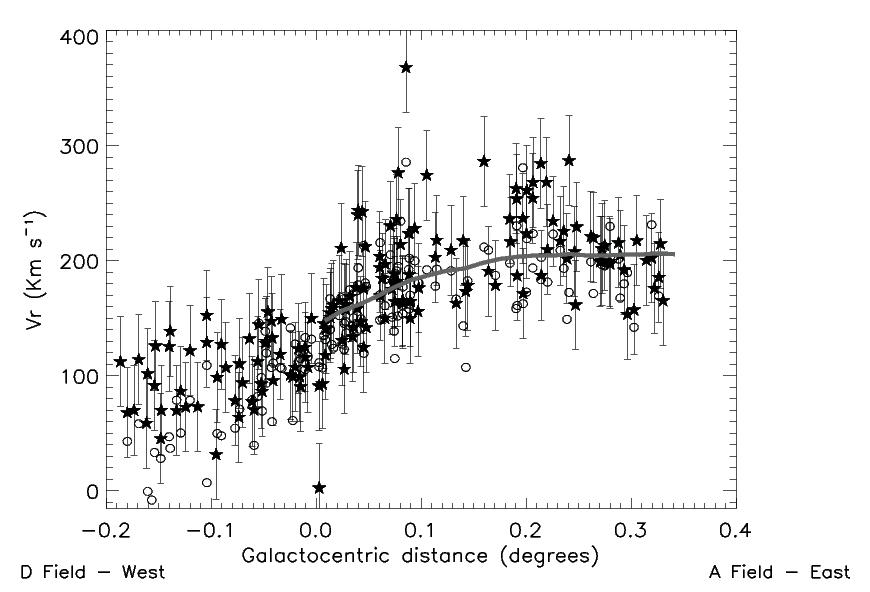
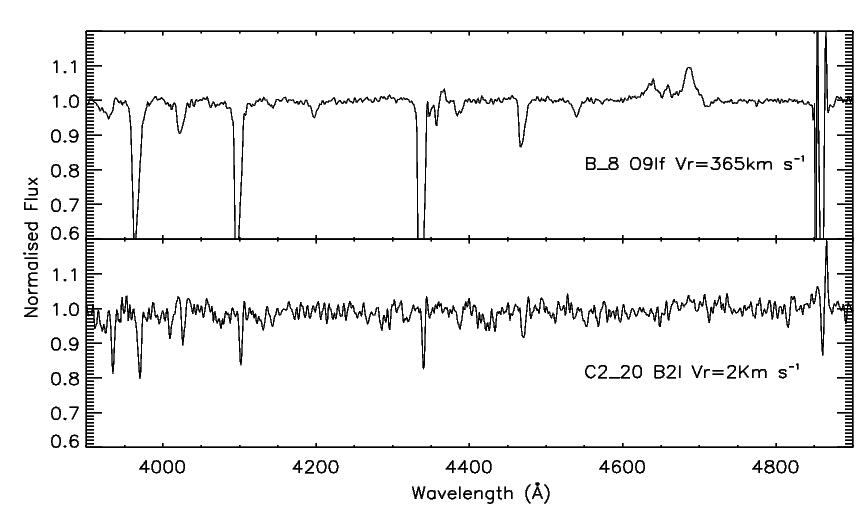
The error bars of the results and the high inclination angle of NGC 55 prevent us from studying substructures in the galaxy, even though a few objects exhibit a radial velocity far from the normal behaviour of the stars. C2_20 (B2I) has a very small radial velocity while B_8 (O9If) presents a high radial velocity for its position in the galaxy. Figure 9 shows the spectra of these stars.
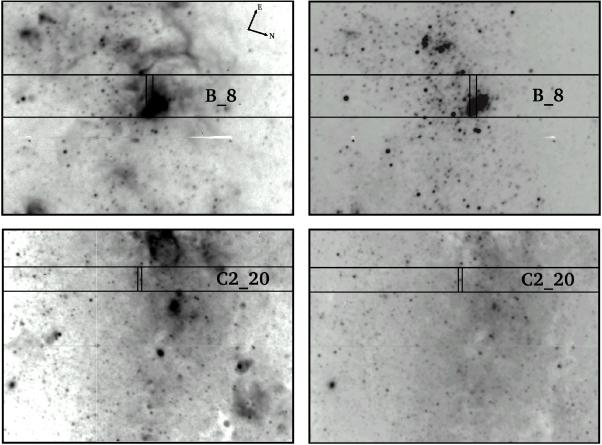
B_8 is located in the middle of a cluster with H II regions seen in emission in the H image (see Fig. 10). Although this object presents absorption lines typical of an O-star, we are probably observing a group of stars. Its bright magnitude compared to other O-stars and the shape of the line profiles agree with this hypothesis. In addition, the spectrum is clearly affected by the nebular emission around the object.
The spectrum of C2_20 exhibits no hint as to the reason for its small radial velocity. We have estimated a lower metallicity for C2_20 (see section 5) and given its high galactic latitude, it might be a Galactic star of the halo with low metal content. However, this would be completely inconsistent with its classification as a supergiant since it would be brighter. Moreover, it is in the centre of NGC 55 and close to different clusters which show evidence of intense stellar activity. Therefore, we cannot exclude the possibilities that either a supernova explosion or binarity can be the cause of its peculiar radial velocity, although we must be cautious with this object due to the moderate S/N of its spectrum.
5 METALLICITY: A ROUGH ESTIMATE
Studies based on different methods (Tüllmann et al. (2003), H II regions; Davidge (2005), stellar content) show that the chemical composition in the plane of NGC 55 is close to that of the LMC. We present here a qualitative estimate of the metal content of NGC 55. A subset of spectral lines of our stars are compared with objects of similar spectral type from the Milky Way (MW) (Lennon et al. 1992), LMC (Evans et al. 2006)333These spectra were obtained in the VLT-FLAMES survey of massive stars in the Milky Way and the Magellanic Clouds (http://star.pst.qub.ac.uk/sjs/flames/). and SMC (Lennon 1997). This method has several caveats; the quality of our data, the use of different atlases for contrast and possible variations of the chemical composition of the comparison objects. While we have corrected for the diverse resolution of the standard spectra, we cannot account for other factors such as data reduction methods or slight differences in the spectral classification outcome. Nonetheless, the results will give us a flavour of the mean metallicity of the young stellar population and the possible presence of a chemical gradient. In a forthcoming paper we will perform a quantitative abundance analysis of a subset of blue massive stars in NGC 55.
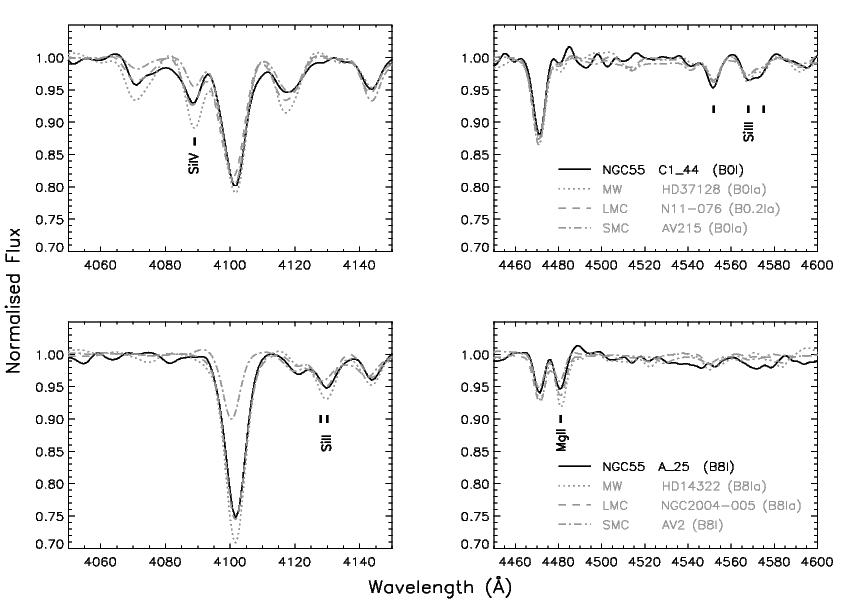
The metallicity is estimated by comparing the strength of the lines of silicon (Si IV, Si III, Si II) and magnesium (Mg II) found in NGC 55 stars to those observed in MW, SMC and LMC objects. Because the strength of these metallic lines depends on the stellar effective temperature and gravity, we have always used stars of the same spectral type and luminosity class (or as close as possible) for the comparison. Strong photospheric lines of carbon, oxygen and nitrogen exist in this wavelength range, but they can be contaminated by processed material from deeper layers due to mixing and evolution (Maeder & Meynet 2000; Hunter et al. 2008). Additional studies report a non-negligible underabundance of nitrogen in NGC 55 (possibly due to the galaxy being either young or deficient in lower mass stars relative to the LMC, Webster & Smith 1983; Aguero & Carranza 1985).
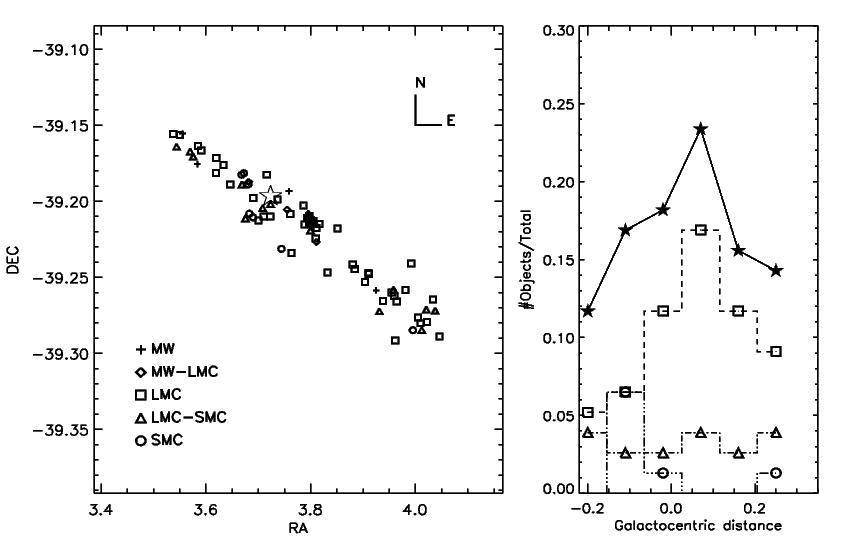
To illustrate the method two sample stars are compared to MW and Magellanic Clouds stars of similar spectral type in Fig. 11. The strength of silicon and magnesium transitions in the NGC 55 stars of the example resemble that of their LMC counterparts. The same analysis was performed on a set of supergiant stars between B0 and A0 (77 objects). We have distributed the stars into five metallicity bins (MW, MW–LMC, LMC, LMC–SMC, SMC) as we indicate in Tables \thetheorem and LABEL:t_catalog.
We find that the average metal content of the NGC 55 supergiants is similar to those of the LMC. At first glance the spatial distribution (see Fig. 12, left) does not show any systematic variation across the galaxy, in agreement with Webster & Smith (1983) who determined oxygen abundances from a small sample of bright H II regions in NGC 55. Nevertheless, if we plot the number of objects normalised by the total number of stars as a function of the projected galactocentric distance (see Fig. 12, right), some variation can be observed. At a projected galactocentric distance of 0.15 degrees and greater the population of stars with lower metallicity increases compared to the central population, where the majority of stars have LMC metallicity.
Once again, the high inclination angle of NGC 55 complicates our study. We cannot ensure that stars apparently close to the centre are indeed in the disk of the galaxy and not in an outer layer but in the line of sight towards the centre. While the indirect evidence of a radial gradient found here cannot be considered significant until we perform a quantitative analysis, our exercise excludes a peculiar behaviour in our sample.
6 SUMMARY AND CONCLUSIONS
The long-term goal of our project is to obtain the physical parameters and abundances of blue massive stars in NGC 55. Results will be useful to study the evolution of massive stars and its dependence with metallicity. The abundance measurements, representative of the clouds where the stars were born, are valuable input parameters to study the chemical evolution of the host galaxy. Another priority goal is to apply and test the Flux-Weighted Gravity-Luminosity Relation (Kudritzki et al. 2008) to the blue supergiant stars in NGC 55 to measure an independent spectroscopic distance to the galaxy. NGC 55 will be an excellent target for this given its abundant blue supergiant population.
As a first step, we have presented in this paper the first census of blue massive stars in NGC 55. The stars were identified from a qualitative analysis of their low-resolution optical spectra that yielded spectral classification for 204 objects with blue colours, out of which 164 have types earlier than F0.
We have also determined radial velocities from the observed spectra. In spite of the low wavelength accuracy and spectral resolution, we see a good agreement with the published rotation curve measured from H I (Puche et al. 1991). This study allowed us to detect one object with peculiar velocity that deserves a more detailed study.
A preliminary estimate of stellar metallicity, from the comparison of spectra with stars in the Milky Way, LMC and SMC, shows that the mean metal content of the stars is close to that of the LMC with some indication of a variation along the projected galactocentric distance. This requires confirmation by quantitative studies.
In a forthcoming paper, we plan to analyse the spectra of those blue massive stars with the highest S/N spectra with FASTWIND (Fast Analysis of STellar atmospheres with WINDs, Santolaya-Rey et al. 1997; Puls et al. 2005).
Acknowledgements.
The authors would like to thank D. J. Lennon, M. A. Urbaneja and C. Evans for their help with the spectral classification and useful comments. D. J. Lennon is also acknowledged for his careful reading of the manuscript. We thank the FLAMES Survey of Massive Stars project (P.I. S. Smartt) for the LMC spectra. Finally, we are thankful to the referee for his/hers comments. WG and GP gratefully acknowledge financial support for this work from the Chilean Center for Astrophysics FONDAP 15010003. This project has been supported by Spanish grants AYA2004-08271-CO2-O1 and AYA2007-67456-C02-01.References
- Aguero & Carranza (1985) Aguero, E. L. & Carranza, G. J. 1985, Ap&SS, 117, 271
- Appenzeller et al. (1998) Appenzeller, I., Fricke, K., Fürtig, W., et al. 1998, The Messenger, 94, 1
- Azzopardi (1987) Azzopardi, M. 1987, A&AS, 69, 421
- Bohannan & Walborn (1989) Bohannan, B. & Walborn, N. R. 1989, PASP, 101, 520
- Bresolin et al. (2002a) Bresolin, F., Gieren, W., Kudritzki, R.-P., Pietrzyński, G., & Przybilla, N. 2002a, ApJ, 567, 277
- Bresolin et al. (2001) Bresolin, F., Kudritzki, R.-P., Mendez, R. H., & Przybilla, N. 2001, ApJ, 548, L159
- Bresolin et al. (2002b) Bresolin, F., Kudritzki, R.-P., Najarro, F., Gieren, W., & Pietrzyński, G. 2002b, ApJ, 577, L107
- Bresolin et al. (2006) Bresolin, F., Pietrzyński, G., Urbaneja, M. A., et al. 2006, ApJ, 648, 1007
- Bresolin et al. (2007) Bresolin, F., Urbaneja, M. A., Gieren, W., Pietrzyński, G., & Kudritzki, R.-P. 2007, ApJ, 671, 2028
- Brown et al. (2006) Brown, W. R., Geller, M. J., Kenyon, S. J., & Kurtz, M. J. 2006, ApJ, 647, 303
- Daflon & Cunha (2004) Daflon, S. & Cunha, K. 2004, ApJ, 617, 1115
- Davidge (2005) Davidge, T. J. 2005, ApJ, 622, 279
- de Vaucouleurs (1961) de Vaucouleurs, G. 1961, ApJ, 133, 405
- Demarco et al. (2005) Demarco, R., Rosati, P., Lidman, C., et al. 2005, A&A, 432, 381
- Dufton et al. (2006) Dufton, P. L., Smartt, S. J., Lee, J. K., et al. 2006, A&A, 457, 265
- Evans et al. (2007) Evans, C. J., Bresolin, F., Urbaneja, M. A., et al. 2007, ApJ, 659, 1198
- Evans & Howarth (2003) Evans, C. J. & Howarth, I. D. 2003, MNRAS, 345, 1223
- Evans et al. (2006) Evans, C. J., Lennon, D. J., Smartt, S. J., & Trundle, C. 2006, A&A, 456, 623
- Fitzpatrick (1991) Fitzpatrick, E. L. 1991, PASP, 103, 1123
- Gieren et al. (2005) Gieren, W., Pietrzynski, G., Bresolin, F., et al. 2005, The Messenger, 121, 23
- Gieren et al. (2008) Gieren, W., Pietrzynski, G., Soszynski, I., et al. 2008, ApJ, 672, 266
- Hartmann (1904) Hartmann, J. 1904, ApJ, 19, 268
- Herrero et al. (1999) Herrero, A., Corral, L. J., Villamariz, M. R., & Martín, E. L. 1999, A&A, 348, 542
- Herrero et al. (2002) Herrero, A., Puls, J., & Najarro, F. 2002, A&A, 396, 949
- Hummel et al. (1986) Hummel, E., Dettmar, R.-J., & Wielebinski, R. 1986, A&A, 166, 97
- Hunter et al. (2008) Hunter, I., Brott, I., Lennon, D. J., et al. 2008, ApJ, 676, L29
- Hunter et al. (2007) Hunter, I., Dufton, P. L., Smartt, S. J., et al. 2007, A&A, 466, 277
- Jaschek & Jaschek (1990) Jaschek, C. & Jaschek, M. 1990, The Classification of Stars. Cambridge Univ. Press, Cambridge.
- Koribalski et al. (2004) Koribalski, B. S., Staveley-Smith, L., Kilborn, V. A., et al. 2004, AJ, 128, 16
- Korn et al. (2005) Korn, A. J., Nieva, M. F., Daflon, S., & Cunha, K. 2005, ApJ, 633, 899
- Kudritzki et al. (2003) Kudritzki, R. P., Bresolin, F., & Przybilla, N. 2003, ApJ, 582, L83
- Kudritzki et al. (1995) Kudritzki, R.-P., Lennon, D. J., & Puls, J. 1995, in Science with the VLT, ed. J. R. Walsh & I. J. Danziger, 246–+
- Kudritzki & Puls (2000) Kudritzki, R.-P. & Puls, J. 2000, ARA&A, 38, 613
- Kudritzki et al. (1999) Kudritzki, R. P., Puls, J., Lennon, D. J., et al. 1999, A&A, 350, 970
- Kudritzki et al. (2008) Kudritzki, R. P., Urbaneja, M. A., Bresolin, F., et al. 2008, ApJ, 999, 000
- Le Borgne et al. (2003) Le Borgne, J.-F., Bruzual, G., Pelló, R., et al. 2003, A&A, 402, 433
- Lennon (1997) Lennon, D. J. 1997, A&A, 317, 871
- Lennon et al. (2003) Lennon, D. J., Dufton, P. L., & Crowley, C. 2003, A&A, 398, 455
- Lennon et al. (1992) Lennon, D. J., Dufton, P. L., & Fitzsimmons, A. 1992, A&AS, 94, 569
- Lennon et al. (2005) Lennon, D. J., Lee, J.-K., Dufton, P. L., & Ryans, R. S. I. 2005, A&A, 438, 265
- Maeder & Meynet (2000) Maeder, A. & Meynet, G. 2000, ARA&A, 38, 143
- Mason et al. (1998) Mason, B. D., Gies, D. R., Hartkopf, W. I., et al. 1998, AJ, 115, 821
- Massey (2003) Massey, P. 2003, ARA&A, 41, 15
- Massey et al. (2007) Massey, P., McNeill, R. T., Olsen, K. A. G., et al. 2007, AJ, 134, 2474
- Mokiem et al. (2007) Mokiem, M. R., de Koter, A., Evans, C. J., et al. 2007, A&A, 465, 1003
- Monteverde & Herrero (1998) Monteverde, M. I. & Herrero, A. 1998, Ap&SS, 263, 171
- Monteverde et al. (2000) Monteverde, M. I., Herrero, A., & Lennon, D. J. 2000, ApJ, 545, 813
- Morgan et al. (1943) Morgan, W. W., Keenan, P. C., & Kellman, E. 1943, An atlas of stellar spectra. Chicago Univ. Press, Chicago
- Muschielok et al. (1999) Muschielok, B., Kudritzki, R. P., Appenzeller, I., et al. 1999, A&A, 352, L40
- Pietrzyński et al. (2006) Pietrzyński, G., Gieren, W., Soszyński, I., et al. 2006, AJ, 132, 2556
- Puche et al. (1991) Puche, D., Carignan, C., & Wainscoat, R. J. 1991, AJ, 101, 447
- Puls et al. (2005) Puls, J., Urbaneja, M. A., Venero, R., et al. 2005, A&A, 435, 669
- Rolleston et al. (2000) Rolleston, W. R. J., Smartt, S. J., Dufton, P. L., & Ryans, R. S. I. 2000, A&A, 363, 537
- Rolleston et al. (2003) Rolleston, W. R. J., Venn, K., Tolstoy, E., & Dufton, P. L. 2003, A&A, 400, 21
- Santolaya-Rey et al. (1997) Santolaya-Rey, A. E., Puls, J., & Herrero, A. 1997, A&A, 323, 488
- Schlegel et al. (1998) Schlegel, D. J., Finkbeiner, D. P., & Davis, M. 1998, ApJ, 500, 525
- Smartt et al. (2001) Smartt, S. J., Venn, K. A., Dufton, P. L., et al. 2001, A&A, 367, 86
- Smith et al. (1996) Smith, L. F., Shara, M. M., & Moffat, A. F. J. 1996, MNRAS, 281, 163
- Trundle et al. (2007) Trundle, C., Dufton, P. L., Hunter, I., et al. 2007, A&A, 471, 625
- Trundle et al. (2002) Trundle, C., Dufton, P. L., Lennon, D. J., Smartt, S. J., & Urbaneja, M. A. 2002, A&A, 395, 519
- Trundle & Lennon (2005) Trundle, C. & Lennon, D. J. 2005, A&A, 434, 677
- Trundle et al. (2004) Trundle, C., Lennon, D. J., Puls, J., & Dufton, P. L. 2004, A&A, 417, 217
- Tüllmann et al. (2003) Tüllmann, R., Rosa, M. R., Elwert, T., et al. 2003, A&A, 412, 69
- Two Micron All Sky Survey team (2003) Two Micron All Sky Survey team. 2003, Extended objects. Final release.
- Urbaneja et al. (2005a) Urbaneja, M. A., Herrero, A., Bresolin, F., et al. 2005a, ApJ, 622, 862
- Urbaneja et al. (2005b) Urbaneja, M. A., Herrero, A., Kudritzki, R.-P., et al. 2005b, ApJ, 635, 311
- van Dokkum (2001) van Dokkum, P. G. 2001, PASP, 113, 1420
- Venn et al. (2001) Venn, K. A., Lennon, D. J., Kaufer, A., et al. 2001, ApJ, 547, 765
- Venn et al. (2000) Venn, K. A., McCarthy, J. K., Lennon, D. J., et al. 2000, ApJ, 541, 610
- Venn et al. (2003) Venn, K. A., Tolstoy, E., Kaufer, A., et al. 2003, AJ, 126, 1326
- Walborn (1979) Walborn, N. R. 1979, in IAU Colloq. 47: Spectral Classification of the Future, ed. M. F. McCarthy, A. G. D. Philip, & G. V. Coyne, 337
- Walborn & Fitzpatrick (1990) Walborn, N. R. & Fitzpatrick, E. L. 1990, PASP, 102, 379 (WF)
- Walborn & Fitzpatrick (2000) Walborn, N. R. & Fitzpatrick, E. L. 2000, PASP, 112, 50 (WF20)
- Webster & Smith (1983) Webster, B. L. & Smith, M. G. 1983, MNRAS, 204, 743
Appendix A Catalogue
| ID | RA(J2000) | DEC(J2000) | V | V-I | Spectral Type | Rg | S/N | Metallicity | Comments | |
| (1) | (2) | (3) | (4) | (5) | (6) | (7) | (8) | (9) | (10) | (11) |
| D_1 | 0:14:08.97 | -39:09:20.88 | 20.212 | -0.557 | B9I | -671.79 | 112 | 43 | LMC | |
| D_3 | 0:14:10.51 | -39:09:50.76 | 18.581 | -0.407 | A0I | -647.94 | 67 | 117 | LMC-SMC | Str. winds? |
| D_4 | 0:14:12.11 | -39:09:23.41 | 19.724 | -0.524 | B9I | -625.02 | 69 | 60 | LMC | |
| D_5 | 0:14:13.22 | -39:09:19.79 | 19.963 | -0.813 | B3I | -608.56 | 113 | 44 | MW | |
| D_6 | 0:14:15.09 | -39:08:50.28 | 19.367 | -0.404 | A3II | -582.18 | 58 | 62 | - | |
| D_7 | 0:14:15.24 | -39:09:29.87 | 19.928 | -0.375 | A0I-II | -578.13 | 101 | 52 | - | |
| D_9 | 0:14:16.74 | -39:10:02.28 | 19.355 | -0.563 | B5I | -554.71 | 91 | 93 | LMC-SMC | |
| D_12 | 0:14:16.84 | -39:11:25.08 | 20.096 | -0.466 | A0I-II | -551.43 | 125 | 45 | - | |
| D_11 | 0:14:18.14 | -39:10:14.16 | 18.447 | -0.595 | B3I | -533.37 | 45 | 199 | LMC-SMC | neb. Str. winds? |
| D_10 | 0:14:18.35 | -39:09:37.08 | 20.026 | -0.516 | A2I | -531.61 | 69 | 44 | - | neb. |
| D_14 | 0:14:20.02 | -39:10:32.15 | 20.582 | -0.728 | B2.5I | -504.73 | 125 | 30 | MW | neb. |
| D_13 | 0:14:20.39 | -39:09:49.32 | 20.375 | -0.787 | B1I | -500.77 | 138 | 42 | LMC | |
| D_15 | 0:14:21.82 | -39:10:00.11 | 20.258 | -0.359 | A0I | -479.02 | 69 | 43 | LMC | |
| D_16 | 0:14:22.80 | -39:09:51.83 | 20.199 | -0.868 | B0.5II | -464.75 | 86 | 30 | - | neb. |
| D_25 | 0:14:23.76 | -39:11:45.95 | 20.162 | -0.449 | A5II | -447.53 | 72 | 38 | - | |
| D_23 | 0:14:24.92 | -39:10:00.11 | 19.330 | -0.743 | B2.5II | -432.89 | 121 | 58 | - | |
| D_24 | 0:14:26.77 | -39:09:43.20 | 20.593 | -0.455 | A3II | -406.43 | 72 | 16 | - | neb. |
| D_28 | 0:14:28.63 | -39:10:53.04 | 19.613 | -0.784 | B0.5I | -375.37 | 128 | 32 | LMC | neb. |
| D_27 | 0:14:28.73 | -39:10:17.76 | 19.191 | -0.642 | B2I | -375.34 | 152 | 76 | LMC | |
| D_29 | 0:14:31.14 | -39:10:16.32 | 18.972 | -0.456 | A3I | -339.62 | 98 | 84 | - | |
| D_26 | 0:14:31.87 | -39:07:57.73 | 17.669 | -0.073 | A5I | -343.49 | 22 | 174 | - | |
| D_31 | 0:14:32.04 | -39:10:34.68 | 19.951 | -0.767 | B2I | -325.28 | 127 | 29 | LMC | |
| D_32 | 0:14:33.14 | -39:10:21.36 | 19.733 | -0.567 | A2I | -309.70 | 107 | 40 | - | |
| D_36 | 0:14:35.07 | -39:11:20.04 | 19.189 | -0.689 | B9I | -278.26 | 78 | 70 | LMC | |
| D_38 | 0:14:36.07 | -39:11:34.45 | 19.184 | -0.427 | A7II | -263.07 | 110 | 49 | - | |
| D_35 | 0:14:36.29 | -39:09:59.40 | 18.506 | -0.462 | A3I | -264.98 | 63 | 94 | - | neb. |
| D_37 | 0:14:36.88 | -39:10:45.12 | 19.926 | -0.392 | A3II | -252.70 | 93 | 25 | - | |
| D_39 | 0:14:38.46 | -39:10:48.36 | 18.313 | -0.453 | A2I | -228.94 | 132 | 100 | - | |
| D_40 | 0:14:39.02 | -39:10:57.00 | 19.903 | 0.165 | A3III | -220.17 | 77 | 27 | - | |
| C2_2 | 0:14:39.42 | -39:12:19.81 | 19.704 | -0.463 | A2II | -213.33 | 70 | 55 | - | |
| D_42 | 0:14:40.33 | -39:10:57.35 | 18.700 | -0.801 | B1.5I | -200.63 | 112 | 53 | SMC | neb. |
| C1_1 | 0:14:40.51 | -39:11:20.04 | 18.893 | -0.732 | A0I | -196.85 | 144 | 100 | LMC-SMC | |
| D_43 | 0:14:41.08 | -39:11:12.84 | 19.454 | -0.017 | O9I | -188.62 | 92 | 27 | - | |
| C2_1 | 0:14:41.38 | -39:10:53.76 | 19.249 | -0.641 | A0I | -185.32 | 86 | 68 | SMC | |
| C1_5 | 0:14:42.10 | -39:12:40.32 | 19.249 | -0.794 | B2.5I | -174.61 | 128 | 82 | LMC-SMC | |
| D_45 | 0:14:42.25 | -39:11:15.36 | 19.737 | -0.493 | A2I | -171.10 | 129 | 45 | - | neb. |
| D_46 | 0:14:42.58 | -39:11:27.61 | 19.141 | 0.006 | Late_AII | -165.57 | 155 | 19 | - | |
| C1_4 | 0:14:43.39 | -39:11:20.04 | 18.863 | -0.606 | B1.5I | -153.82 | 147 | 71 | SMC | |
| C2_5 | 0:14:43.57 | -39:11:14.29 | 19.215 | -0.832 | B3I | -151.41 | 132 | 55 | MW-LMC | |
| C2_8 | 0:14:43.87 | -39:12:29.51 | 19.294 | -0.652 | A0I | -147.56 | 95 | 69 | SMC | |
| C1_9 | 0:14:45.54 | -39:12:38.17 | 18.939 | -0.817 | B1I | -123.77 | 118 | 86 | SMC | |
| C1_8 | 0:14:45.70 | -39:11:52.08 | 18.920 | -0.791 | B8I | -118.58 | 149 | 72 | LMC | |
| C1_10 | 0:14:47.70 | -39:11:57.48 | 17.982 | -0.495 | A2I | -88.64 | 100 | 138 | - | |
| C2_14 | 0:14:48.05 | -39:12:45.72 | 19.044 | -0.944 | B8I | 88.67 | 130 | 112 | LMC | |
| C2_11 | 0:14:48.33 | -39:11:20.75 | 18.545 | -1.800 | O8I | -80.41 | 98 | 67 | - | neb. |
| C2_12 | 0:14:48.84 | -39:11:24.00 | 19.006 | -0.064 | A2III | -72.60 | 107 | 73 | - | neb. |
| C1_11 | 0:14:49.80 | -39:11:07.43 | 19.444 | -0.761 | A3I | -60.99 | 123 | 46 | - | neb. |
| C2_15 | 0:14:50.00 | -39:12:16.19 | 19.424 | -0.542 | A0I | -56.07 | 98 | 83 | LMC-SMC | |
| C2_13 | 0:14:50.21 | -39:11:17.16 | 18.822 | -0.710 | A2I | -53.43 | 90 | 89 | - | |
| C1_15 | 0:14:50.50 | -39:12:36.35 | 19.642 | -0.765 | B8I | 53.31 | 158 | 69 | LMC | neb. |
| C1_16 | 0:14:51.16 | -39:12:47.88 | 18.917 | -0.588 | A5I | 48.87 | 154 | 98 | - | |
| C1_13 | 0:14:51.86 | -39:10:57.35 | 18.948 | -0.706 | B1I | -37.92 | 115 | 60 | LMC | neb. |
| C2_16 | 0:14:52.28 | -39:11:26.52 | 18.419 | -0.451 | HII | -22.95 | 109 | 24 | - | |
| C2_18 | 0:14:52.32 | -39:12:05.76 | 19.453 | -0.591 | B2.5II | 21.52 | 92 | 42 | - | |
| C1_14 | 0:14:52.59 | -39:11:04.21 | 18.503 | -0.662 | A5I | -28.25 | 107 | 125 | - | |
| C1_17 | 0:14:52.67 | -39:12:38.88 | 18.830 | -0.416 | A3I | 31.14 | 117 | 107 | - | |
| C2_17 | 0:14:52.76 | -39:11:29.04 | 18.748 | -0.902 | B0.5I | -16.32 | 149 | 51 | - | |
| C2_19 | 0:14:53.13 | -39:12:00.00 | 19.070 | -0.371 | A3I | 9.71 | 91 | 46 | - | neb. |
| C2_21 | 0:14:53.46 | -39:12:35.64 | 19.719 | -0.662 | B2I | 26.30 | 145 | 30 | LMC | neb. |
| C2_20 | 0:14:53.58 | -39:12:06.11 | 18.745 | -0.262 | B2I | 10.01 | 2 | 65 | LMC-SMC | neb. |
| C2_22 | 0:14:55.19 | -39:12:30.96 | 18.764 | -0.418 | A2I | 33.71 | 140 | 48 | - | neb. Str. winds? |
| C1_18 | 0:14:55.94 | -39:11:21.84 | 19.316 | -0.707 | WN8 | -37.95 | 124 | 30 | - | neb. |
| C2_29 | 0:14:56.75 | -39:11:56.40 | 18.335 | -0.638 | B8I | 47.50 | 150 | 63 | LMC | neb. |
| C1_27 | 0:14:57.48 | -39:12:00.00 | 19.274 | -0.093 | A2I | 58.56 | 161 | 24 | - | neb. |
| C2_33 | 0:14:58.50 | -39:12:38.88 | 19.645 | -2.167 | O5III | 79.00 | 165 | 42 | - | neb. |
| C1_32 | 0:14:58.59 | -39:13:52.68 | 17.122 | -0.563 | B9I | 102.93 | 161 | 241 | SMC | Str. winds? |
| C2_32 | 0:14:58.69 | -39:12:15.12 | 18.164 | -0.940 | HII | 77.93 | 139 | 28 | - | |
| C2_34 | 0:14:58.73 | -39:12:54.00 | 19.062 | -0.679 | A3III | 85.57 | 210 | 41 | - | neb. |
| C2_35 | 0:14:59.68 | -39:12:42.84 | 18.193 | -1.404 | Early_OI | 96.38 | 105 | 34 | - | neb. |
| C2_40 | 0:14:59.90 | -39:14:12.11 | 19.428 | -0.758 | A7II | 125.41 | 133 | 39 | - | |
| C1_30 | 0:14:59.91 | -39:12:11.88 | 18.921 | -0.425 | LBV | 95.62 | 158 | 28 | - | LBV-Candidate |
| C1_31 | 0:15:00.01 | -39:12:41.39 | 18.523 | -0.716 | Early_OI | 100.92 | 157 | 40 | - | neb. |
| C2_37 | 0:15:01.19 | -39:12:20.16 | 18.909 | -0.752 | A0I | 115.33 | 168 | 51 | MW-LMC | neb. |
| C2_36 | 0:15:02.11 | -39:11:35.87 | 19.325 | -0.787 | B8I | 127.83 | 142 | 28 | MW | |
| C1_36 | 0:15:02.36 | -39:13:31.44 | 19.287 | -1.950 | HII | 144.48 | 162 | 22 | - | |
| C1_37 | 0:15:02.50 | -39:13:58.44 | 19.642 | -0.588 | A7II | 153.43 | 146 | 55 | - | |
| C1_34 | 0:15:02.58 | -39:12:30.60 | 18.962 | -0.789 | B8I | 137.00 | 176 | 69 | LMC | neb. |
| C2_41 | 0:15:02.82 | -39:12:58.68 | 18.475 | -0.739 | B0.5III | 144.22 | 243 | 82 | - | neb. |
| C1_35 | 0:15:02.85 | -39:12:49.67 | 19.336 | -0.534 | B5III | 143.30 | 239 | 52 | - | neb. |
| C2_39 | 0:15:02.98 | -39:12:05.04 | 18.180 | -0.719 | A2I | 140.99 | 158 | 112 | - | |
| C1_38 | 0:15:03.16 | -39:14:02.03 | 19.603 | -0.849 | B0I | 163.24 | 175 | 38 | LMC | neb. |
| C2_38 | 0:15:03.96 | -39:11:04.92 | 18.586 | -0.397 | A3II | 157.46 | 242 | 97 | - | |
| C2_44 | 0:15:04.10 | -39:13:44.40 | 19.902 | -0.725 | A2I | 171.66 | 141 | 51 | - | neb. |
| C2_42 | 0:15:04.15 | -39:12:51.84 | 20.382 | -0.320 | A7II | 162.62 | 124 | 30 | - | neb. |
| C2_43 | 0:15:04.19 | -39:13:22.80 | 19.985 | -0.687 | B9II | 168.27 | 212 | 30 | - | |
| C1_39 | 0:15:04.72 | -39:13:52.32 | 18.514 | -1.517 | HII | 182.16 | 132 | 22 | - | |
| B_3 | 0:15:07.65 | -39:13:21.71 | 20.556 | -0.165 | A2II | 218.02 | 193 | 33 | - | |
| C1_41 | 0:15:07.65 | -39:13:21.71 | 20.556 | -0.165 | A3II | 218.02 | 203 | 41 | - | |
| C2_45 | 0:15:08.05 | -39:12:45.01 | 20.229 | -0.299 | A3II | 219.39 | 169 | 26 | - | |
| C1_40 | 0:15:08.71 | -39:12:09.73 | 20.010 | -0.627 | B1.5I | 227.06 | 184 | 59 | LMC | neb. |
| C1_42 | 0:15:09.00 | -39:13:04.79 | 17.754 | -0.277 | A2I | 235.59 | 149 | 137 | - | Str. winds? |
| C2_46 | 0:15:09.18 | -39:12:55.44 | 18.941 | -0.672 | B1I | 237.18 | 196 | 75 | LMC | neb. |
| C2_47 | 0:15:10.45 | -39:12:39.97 | 19.459 | -0.508 | B9I | 254.68 | 230 | 43 | LMC | neb. |
| C1_43 | 0:15:10.86 | -39:12:28.80 | 19.055 | -0.069 | A0I | 260.17 | 175 | 57 | LMC-SMC | Str. winds? |
| C1_46 | 0:15:11.18 | -39:13:18.12 | 19.887 | -0.439 | B2III | 269.43 | 164 | 27 | - | neb. |
| C2_48 | 0:15:11.24 | -39:12:38.17 | 19.371 | -0.456 | B5I | 266.36 | 188 | 58 | LMC | neb. |
| C1_44 | 0:15:11.29 | -39:12:34.55 | 19.037 | -0.740 | B0I | 266.90 | 181 | 79 | LMC | neb. |
| C1_45 | 0:15:11.31 | -39:12:50.40 | 19.607 | -0.180 | B1I | 268.32 | 179 | 38 | LMC | neb. |
| C2_49 | 0:15:11.82 | -39:12:43.92 | 20.154 | -0.570 | B1I | 275.40 | 235 | 33 | LMC | neb. |
| C1_47 | 0:15:11.92 | -39:13:08.76 | 18.023 | -0.291 | A0I | 279.16 | 182 | 134 | LMC-SMC | Str. winds? |
| C2_50 | 0:15:12.18 | -39:12:52.56 | 20.159 | -0.433 | B1I | 281.50 | 276 | 34 | LMC | neb. |
| C2_51 | 0:15:12.68 | -39:12:56.51 | 19.719 | -0.764 | B9I | 289.24 | 213 | 61 | MW-LMC | neb. |
| C1_48 | 0:15:13.11 | -39:12:47.16 | 19.519 | -0.715 | B0.5I | 294.93 | 164 | 30 | LMC | neb. |
| C1_49 | 0:15:13.14 | -39:13:01.20 | 19.127 | -0.262 | A5I | 296.62 | 165 | 92 | - | |
| B_7 | 0:15:13.31 | -39:12:43.56 | 17.595 | -0.556 | A0I | 297.60 | 162 | 125 | LMC-SMC | neb. Str. winds? |
| B_8 | 0:15:13.98 | -39:12:48.25 | 15.874 | -1.606 | O9If | 308.04 | 367 | 185 | - | Cluster. neb. |
| C2_54 | 0:15:14.34 | -39:13:27.84 | 19.435 | -0.497 | B9I | 317.20 | 223 | 51 | LMC | neb. |
| C1_53 | 0:15:14.64 | -39:13:36.12 | 19.816 | -0.485 | B2.5I | 322.60 | 164 | 45 | MW-LMC | neb. |
| B_9 | 0:15:14.66 | -39:13:03.72 | 19.416 | -0.524 | B5I | 319.34 | 223 | 57 | LMC | neb. |
| C1_51 | 0:15:14.70 | -39:12:54.36 | 18.306 | -0.098 | Ofpe/WN9 | 319.21 | 187 | 57 | - | neb. |
| C1_52 | 0:15:14.79 | -39:13:10.92 | 18.542 | -0.147 | A2I | 322.06 | 149 | 107 | - | neb. Str. winds? |
| C2_55 | 0:15:15.95 | -39:12:54.36 | 19.185 | -0.277 | B5I | 337.85 | 228 | 39 | LMC | neb. |
| B_12 | 0:15:16.68 | -39:13:26.40 | 19.108 | -0.666 | Of/WN | 351.60 | 176 | 90 | - | neb. |
| B_11 | 0:15:16.74 | -39:12:46.08 | 19.001 | 0.206 | B1I | 349.09 | 155 | 61 | - | neb. |
| B_13 | 0:15:18.63 | -39:13:12.72 | 18.543 | -0.435 | LBV/WN11 | 379.26 | 274 | 103 | - | LBV-Candidate |
| B_22 | 0:15:19.73 | -39:14:48.12 | 18.274 | -0.268 | B2.5I | 408.46 | 202 | 143 | LMC | Str. winds? |
| B_15 | 0:15:20.89 | -39:13:17.76 | 20.308 | -0.161 | A3I | 413.34 | 217 | 29 | - | neb. |
| B_23 | 0:15:24.24 | -39:13:04.79 | 19.531 | -0.586 | B2I | 462.36 | 209 | 77 | LMC | |
| B_24 | 0:15:25.44 | -39:13:03.00 | 20.318 | -0.300 | A5II | 480.06 | 162 | 43 | - | |
| B_26 | 0:15:26.91 | -39:13:28.92 | 20.116 | -0.891 | O9I | 504.13 | 217 | 52 | - | |
| B_28 | 0:15:27.41 | -39:14:36.60 | 19.591 | -0.079 | A0III | 519.32 | 178 | 56 | - | |
| B_25 | 0:15:27.78 | -39:12:25.56 | 18.712 | -0.261 | A0III | 513.24 | 173 | 74 | - | |
| B_30 | 0:15:31.27 | -39:14:30.12 | 19.591 | -0.012 | B9I | 575.47 | 291 | 74 | LMC | neb. Str. winds? |
| B_31 | 0:15:32.22 | -39:14:40.20 | 19.429 | -0.478 | B2.5I | 590.90 | 190 | 95 | LMC | |
| B_33 | 0:15:33.53 | -39:15:10.44 | 19.125 | -0.467 | O5If | 614.56 | 178 | 94 | - | neb. |
| B_35 | 0:15:36.86 | -39:15:10.79 | 20.291 | -0.513 | B1.5I | 663.87 | 236 | 30 | LMC | neb. |
| B_34 | 0:15:37.73 | -39:13:49.08 | 19.533 | -0.242 | LBV/WN11 | 667.26 | 216 | 35 | - | LBV-Candidate |
| B_37 | 0:15:38.38 | -39:15:29.88 | 19.651 | -0.201 | A2I | 689.16 | 186 | 53 | - | neb. |
| A_1 | 0:15:38.52 | -39:14:49.21 | 19.099 | -0.777 | B1I | 685.46 | 262 | 110 | LMC | neb. |
| A_2 | 0:15:38.64 | -39:14:52.43 | 19.227 | -0.632 | B1.5I | 687.62 | 253 | 77 | LMC | neb. |
| A_4 | 0:15:39.99 | -39:15:00.71 | 19.604 | -0.167 | A5I | 708.86 | 236 | 71 | - | neb. |
| B_36 | 0:15:40.62 | -39:13:40.07 | 19.782 | -0.389 | O8I | 709.64 | 171 | 55 | - | |
| A_5 | 0:15:40.83 | -39:15:09.72 | 20.071 | -0.495 | A3I | 722.43 | 260 | 58 | - | |
| A_3 | 0:15:41.35 | -39:13:48.73 | 19.623 | -0.184 | A2I | 721.24 | 223 | 86 | - | neb. |
| A_7 | 0:15:41.99 | -39:15:30.95 | 19.901 | -0.650 | B2I | 742.73 | 254 | 73 | MW | |
| A_6 | 0:15:42.47 | -39:14:46.32 | 19.039 | -0.199 | A3I | 743.83 | 268 | 86 | - | |
| A_10 | 0:15:43.43 | -39:16:20.28 | 18.836 | -0.329 | A0I | 772.06 | 187 | 134 | LMC-SMC | |
| A_8 | 0:15:44.18 | -39:14:58.20 | 19.792 | -0.188 | O9.7I | 770.70 | 304 | 62 | - | |
| A_11 | 0:15:45.17 | -39:15:56.15 | 18.706 | -0.245 | B5I | 793.59 | 209 | 130 | LMC | |
| A_9 | 0:15:45.56 | -39:14:45.59 | 18.824 | -0.175 | A5I | 789.71 | 268 | 84 | - | |
| A_12 | 0:15:46.52 | -39:15:48.96 | 18.594 | -0.722 | O5If | 812.49 | 234 | 129 | - | neb. |
| A_13 | 0:15:48.53 | -39:15:14.04 | 20.310 | -0.195 | A5II | 837.32 | 216 | 44 | - | |
| A_14 | 0:15:49.14 | -39:15:35.64 | 19.139 | -0.279 | B9I | 849.33 | 225 | 115 | LMC | neb. |
| A_15 | 0:15:49.93 | -39:15:28.80 | 18.794 | -0.475 | B3I | 860.21 | 201 | 154 | LMC-SMC | neb. Str. winds? |
| A_16 | 0:15:50.25 | -39:15:43.92 | 19.590 | -0.518 | B0.5I | 867.08 | 286 | 121 | LMC | neb. |
| A_25 | 0:15:50.78 | -39:17:29.40 | 19.687 | -0.504 | B8I | 893.29 | 229 | 86 | LMC | |
| A_18 | 0:15:51.38 | -39:16:20.28 | 19.555 | -0.019 | A7I | 889.45 | 161 | 100 | - | neb. |
| A_17 | 0:15:51.42 | -39:15:57.60 | 20.336 | -0.321 | B1I | 886.44 | 207 | 79 | LMC | |
| A_26 | 0:15:55.45 | -39:15:30.60 | 19.236 | -0.262 | B2.5I | 942.47 | 220 | 96 | LMC | |
| A_28 | 0:15:55.62 | -39:16:11.27 | 20.047 | -0.336 | A2I | 950.75 | 219 | 62 | - | |
| A_30 | 0:15:57.58 | -39:16:14.51 | 19.468 | -0.795 | O9I | 980.26 | 199 | 44 | - | neb. |
| A_29 | 0:15:57.97 | -39:15:33.84 | 19.575 | -0.595 | O5If+ | 980.35 | 210 | 62 | - | neb. |
| A_27 | 0:15:58.03 | -39:14:27.60 | 19.928 | -0.477 | B2I | 973.83 | 199 | 66 | LMC | |
| A_31 | 0:15:58.22 | -39:16:14.16 | 20.288 | -0.592 | O9I | 989.71 | 213 | 46 | - | neb. |
| A_33 | 0:15:58.83 | -39:17:05.29 | 19.996 | -0.429 | A0I | 1007.21 | 199 | 75 | SMC | |
| A_32 | 0:15:59.49 | -39:16:08.40 | 17.813 | -0.335 | A7I | 1007.73 | 197 | 141 | - | neb. |
| A_34 | 0:16:01.17 | -39:16:34.67 | 20.247 | -0.875 | B0I | 1036.66 | 215 | 68 | LMC | |
| A_35 | 0:16:01.49 | -39:16:42.96 | 19.744 | -0.490 | B3III | 1042.77 | 204 | 80 | - | |
| A_36 | 0:16:02.33 | -39:16:48.72 | 20.758 | -0.418 | B2I | 1056.24 | 191 | 39 | LMC | neb. |
| A_37 | 0:16:02.90 | -39:17:04.91 | 20.024 | -0.603 | B0.5I | 1067.34 | 153 | 71 | LMC-SMC | neb. |
| A_38 | 0:16:04.95 | -39:16:15.96 | 18.706 | -0.197 | A0I | 1089.96 | 157 | 146 | LMC-SMC | |
| A_39 | 0:16:05.30 | -39:16:45.84 | 20.451 | -0.021 | B5I | 1099.75 | 217 | 51 | LMC | |
| A_40 | 0:16:08.02 | -39:15:52.20 | 19.938 | -0.484 | B5I | 1132.32 | 200 | 67 | LMC | |
| A_41 | 0:16:09.00 | -39:16:18.84 | 20.114 | -0.445 | B1I | 1150.65 | 202 | 52 | LMC-SMC | neb. |
| A_42 | 0:16:09.69 | -39:16:13.44 | 19.453 | -0.189 | LBV | 1160.17 | 175 | 75 | - | LBV-Candidate |
| A_43 | 0:16:10.57 | -39:16:27.48 | 19.358 | -0.215 | A2I | 1175.18 | 185 | 94 | - | neb. |
| A_44 | 0:16:10.91 | -39:16:33.25 | 20.103 | -0.443 | B3II | 1181.10 | 214 | 49 | - | neb. |
| A_45 | 0:16:10.98 | -39:17:19.68 | 20.710 | -0.726 | B0I | 1189.70 | 165 | 44 | LMC |
| ID | RA(J2000) | DEC(J2000) | V | V-I | Spectral Type | Rg | S/N | Metallicity | Comments | |
| (1) | (2) | (3) | (4) | (5) | (6) | (7) | (8) | (9) | (10) | (11) |
| D_2 | 0:14:11.65 | -39:08:19.69 | 20.461 | -0.213 | F0-2I | -634.56 | 17 | 36 | - | |
| D_33 | 0:14:32.48 | -39:11:11.40 | 17.808 | -0.223 | F5I | -317.28 | 56 | 166 | - | neb. |
| D_34 | 0:14:33.65 | -39:10:56.64 | 19.475 | -0.051 | F5I | -300.21 | 30 | 46 | - | neb. |
| D_41 | 0:14:39.70 | -39:10:56.64 | 18.418 | -0.024 | F5-8I | -210.06 | 55 | 76 | - | |
| C2_6 | 0:14:41.86 | -39:12:40.68 | 19.545 | -0.088 | F2-5I | -178.08 | 69 | 68 | - | |
| C1_2 | 0:14:42.13 | -39:10:51.96 | 18.887 | -0.383 | F0-2I | -174.36 | 126 | 64 | - | |
| D_44 | 0:14:42.61 | -39:10:39.01 | 19.163 | 0.253 | G0-2I | -168.53 | 95 | 25 | - | |
| C2_4 | 0:14:43.18 | -39:11:11.04 | 19.666 | -0.387 | F0-2I | -157.39 | 87 | 39 | - | neb. |
| C1_6 | 0:14:45.67 | -39:11:14.64 | 17.392 | -0.077 | G0I | -120.14 | 69 | 104 | - | |
| C2_9 | 0:14:45.99 | -39:11:51.72 | 19.459 | -0.265 | F2-5I | -114.18 | 126 | 30 | - | |
| C1_12 | 0:14:50.42 | -39:11:09.25 | 18.345 | -0.329 | F5-8I | -52.05 | 133 | 107 | - | neb. |
| C1_25 | 0:14:56.02 | -39:12:14.39 | 17.310 | -0.287 | F8I | 39.24 | 92 | 109 | - | neb. |
| C2_30 | 0:14:56.08 | -39:12:50.40 | 19.480 | -0.517 | F0-2I | 51.00 | 141 | 32 | - | neb. |
| C1_28 | 0:14:57.43 | -39:12:33.13 | 17.611 | -0.410 | F5I | 62.83 | 189 | 158 | - | neb. |
| C2_31 | 0:14:59.10 | -39:11:37.32 | 18.107 | -0.282 | F8I | 82.76 | 123 | 114 | - | |
| C1_29 | 0:14:59.39 | -39:11:49.19 | 18.230 | -0.342 | F8I | 86.90 | 143 | 88 | - | |
| B_4 | 0:15:10.36 | -39:12:27.36 | 17.987 | 0.328 | G0-2I | 252.59 | 177 | 101 | - | neb. |
| B_5 | 0:15:11.07 | -39:12:54.71 | 18.759 | 0.134 | F8I | 265.17 | 164 | 76 | - | neb. |
| B_6 | 0:15:11.58 | -39:13:06.24 | 19.402 | 0.123 | G0I | 273.91 | 176 | 48 | - | neb. |
| C1_50 | 0:15:12.90 | -39:13:27.48 | 17.635 | -0.006 | F5-8I | 295.94 | 138 | 162 | - | |
| C2_52 | 0:15:13.51 | -39:12:52.92 | 18.064 | -0.261 | F5I | 301.29 | 204 | 87 | - | |
| C2_53 | 0:15:13.88 | -39:13:04.08 | 18.737 | -0.102 | F5I | 307.78 | 189 | 81 | - | |
| B_10 | 0:15:13.88 | -39:13:41.87 | 19.274 | 0.180 | F8I | 312.24 | 179 | 57 | - | neb. |
| ID | RA(J2000) | DEC(J2000) | V | V-I | Spectral Type | Rg | S/N | Metallicity | Comments | |
| (1) | (2) | (3) | (4) | (5) | (6) | (7) | (8) | (9) | (10) | (11) |
| D_8 | 0:14:16.16 | -39:09:38.16 | 18.945 | -0.161 | A5V | -564.09 | 75 | 69 | - | neb. |
| D_30 | 0:14:32.02 | -39:10:17.03 | 19.746 | 0.139 | G2-5V | -326.59 | 34 | 36 | - | |
| C1_3 | 0:14:40.77 | -39:12:01.07 | 19.016 | -1.017 | Da | -192.58 | 106 | 111 | - | |
| C2_3 | 0:14:42.07 | -39:11:17.16 | 19.045 | -0.020 | B2V | -173.70 | 107 | 40 | - | |
| C1_7 | 0:14:45.26 | -39:11:42.36 | 18.455 | -0.197 | G0-2V | -125.18 | 136 | 93 | - | neb. |
| C2_7 | 0:14:45.38 | -39:11:17.16 | 18.440 | -0.160 | B3V | -124.34 | 79 | 55 | - | neb. |
| C1_26 | 0:14:55.76 | -39:12:36.72 | 19.046 | -0.388 | B8V | 42.26 | 171 | 40 | - | neb. |
| C1_33 | 0:15:03.24 | -39:11:52.08 | 17.373 | -0.056 | G5V | 144.62 | 74 | 131 | - | |
| B_1 | 0:15:11.68 | -39:10:10.57 | 18.120 | 0.191 | G0-2V | 277.62 | 160 | 117 | - | |
| B_14 | 0:15:21.01 | -39:12:50.05 | 19.677 | 0.006 | B2V | 413.07 | 179 | 75 | - | neb. |
| B_27 | 0:15:28.60 | -39:13:20.64 | 19.278 | -0.014 | A5V | 528.55 | 228 | 43 | - | |
| B_29 | 0:15:32.54 | -39:12:52.56 | 19.572 | 0.326 | F8V | 585.76 | 157 | 55 | - | |
| B_32 | 0:15:38.10 | -39:12:08.64 | 18.438 | 0.212 | G5V | 667.73 | 20 | 67 | - |
Appendix B Atlas
Appendix C Finding Charts
