11email: wilsonr@fisica.ufmg.br
11email: wag@fisica.ufmg.br
Mapping the interface between the Local and Loop I bubbles
using Strömgren photometry
Abstract
Context. The Sun is located inside an extremely low density region of quite irregular shape called the Local Bubble or Local Cavity. The fraction of this cavity filled with extremely hot gas is known as the Local Hot Bubble. Close to the Local Bubble, there is an even larger cavity known as Loop I. A ring-like feature observed in X-ray and HI has been proposed as the contour of the bubbles interaction zone around 70 pc.
Aims. Our goal is to identify the interface between the Local and Loop I Bubbles and discuss the ring’s existence using Strömgren H data.
Methods. We have used the H data of the General Catalogue of Photometric Data, covering the region defined by the Galactic coordinates: and to obtain colour excess and distances. A set of exclusion criteria have been applied to eliminate the values inappropriate to the study of the interstellar reddening distribution. The final sample is composed of 4346 stars located up to 500 pc from the Sun.
Results. The expected transition to , corresponding to the ring’s column density, occurs on the western part of the ring at pc, whereas on the eastern side it is not clearly seen before pc. Near the Galactic plane the presence of the dark clouds is clearly established by in the western side at about 100 – 150 pc and about 120 – 180 pc in the eastern side. Beyond these distance ranges the number of unreddened stars decreases considerably indicating the location of these large dark cloud complexes. In the southernmost part of the ring the reddening remains very low, typically in all its extension, except towards the Mensa constellation where a possible transition is observed at pc. In the northernmost part the colour excess increases with distance in a gradual way, such that becomes predominant only after 15 pc.
Conclusions. If the ring really exists the colour excess distribution indicates that it is very fragmented and distorted. However, the different characteristics of the reddening inside and along the ring do not support the existence of a ring.
Key Words.:
ISM: bubbles – (ISM:) dust, extinction – ISM: individual objects: Local Bubble – ISM: individual objects: Loop I – Stars: distances – Techniques: photometric1 Introduction
The Sun is located inside an extremely low density region ( cm-3) of quite irregular shape called the Local Bubble (LB) or Local Cavity. The fraction of this cavity filled with extremely hot gas ( K) is known as the Local Hot Bubble (LHB) (e.g., Paresce, 1984; Cox & Reynolds, 1987; Snowden et al., 1990; Warwick et al., 1993; Leroy, 1999; Sfeir et al., 1999; Breitschwerdt et al., 2000; Lallement et al., 2003; Welsh & Lallement, 2005).
In the direction of the Scorpio-Centaurus OB association (Sco-Cen), there is an even larger cavity known as Loop I. It is believed that Loop I has been formed by the action of the stellar wind and supernova explosions of the stars located in the Sco-Cen, that acting on the interstellar material, left after the star formation, created a bubble of gas and dust concentrical to this association. (e.g., Weaver, 1979; Iwan, 1980; de Geus, 1989).
Historically, the concept of the formation of the LB is a dispute among three views: (I) the view that one or more supernova explosions, near the Sun, formed the cavity and the soft X-ray emitting region (e.g., Cox & Smith, 1974; Cox & Anderson, 1982; Cox & Reynolds, 1987; Smith & Cox, 2001; Maíz-Apellániz, 2001; Berghöfer & Breitschwerdt, 2002; Fuchs et al., 2006); (II) the view that the Loop I superbubble has been formed by successive epochs of star formation in the Sco-Cen, having expanded asymmetrically into the low density inter-arm region surrounding the Sun (e.g., Frisch, 1981; Frisch & York, 1983; Bochkarev, 1987; Frisch, 1995; Wolleben, 2007). (III) some alternative views where the notion of the low density region around the Sun as a bubble is dismissed (e.g., Bruhweiler, 1996; Mebold et al., 1998; Lépine & Sartori, 2003)
Under class “I” models, Cox & Smith, (1974) have shown that the number of supernova in the Galaxy has been high enough for supernova remnants (SNRs) to occupy a significant fraction of the interstellar medium.
A more detailed model for the Local Bubble was developed by Cox & Anderson, (1982), in which they considered that only one supernova occurring in the vicinity of the Sun in an environment of low density ( cm-3) would have been sufficient to create what we observe today. However, if the surrounding interstellar density is about 0.1 cm-3, a sequence of supernova explosions in the same region would be necessary to construct the cavity of low density of the observed size and to reheat its interior. Models with this line of thought have been developed by Cox & Snowden, (1986); Cox & Reynolds, (1987); Edgar & Cox, (1993) and Smith & Cox, (1998).
Smith & Cox, (2001) have shown that two or three supernova explosions in a diffuse interstellar medium would be able to generate a hot bubble like the LB. In this model the supernovae explosions would be random. Following the same line of reasoning, Maíz-Apellániz, (2001) suggested that the LB and Loop I could have started as a single entity, originating from supernova explosions in the Upper-Centaurus-Lupus (UCL) sub-group of the Sco-Cen. Later, three supernovae explosions in the Lower-Centaurus-Crux (LCC) subgroup of the Sco-Cen would have been responsible for the expansion in the direction of the LB.
Breitschwerdt et al., (2000) show a schematical representation of the interaction between the LB and the neighboring Bubble Loop I (see Breitschwerdt et al., 2000, Fig. 1). Using Hipparcos stellar distances and the results of the kinematical analysis suggested by Asiain et al., (1999), Berghöfer & Breitschwerdt, (2002) suggested that thirteen million years ago, the center of mass of the Pleiades B1 subgroup was located inside the volume of the LB, and 10 - 20 supernovae explosions in this subgroup would have been responsible for the LB creation.
Assuming a background medium pre-structured by previous generations of supernova explosions, Breitschwerdt & Avillez, (2006) have suggested an age of Myr for the LB, which would have been reheated by 19 supernovae explosions to date. Fuchs et al., (2006), instead, suggested that 14 - 20 supernovae explosions originating in LCC and UCL would have been responsible for the LB origin.
Under the notion of class “II” models, Frisch, (1981); Frisch & York, (1983, 1986); Frisch, (1995) proposed that the LB is part of a superbubble, created by the stellar activity in the Sco-Cen, that expanded through the low density region among the Galaxy spiral arms. Frisch, (1998) shows a schematical representation of the three shells from the star formation in the Sco-Cen (see Frisch, 1998, Fig. 2).
Bochkarev, (1987) suggested that the solar system is near the limit of a low density region cm filled with hot gas K) called the Local Cavern. The center of the Local Cavern would be located in the Sco-Cen region and would be involved by a gas envelope that would be observed as HI filaments with a mass of the order of , the distance between the center and the envelope being approximately 150-200 pc.
Wolleben, (2007) proposed a model consisting of two synchroton-emitting shells, namely S1 (LCC bubble) and S2 (Loop I bubble), expanding with different velocities. In this picture S1 is about 6 Myr old and S2 is 1-2 Myr old. The Sun would reside within S1, but near its border. The shock front of S2 would have hit S1 just recently ( yr ago or less), giving rise to the X-ray emission observed as the North Polar Spur.
Under the alternative class “III” models Bruhweiler, (1996) and Mebold et al., (1998) argue that a Bubble may not even exist, the LB being only the intersecting contour of the neighbouring bubbles. Another idea has been proposed by Lépine & Sartori, (2003) where the presence of sheet-like structures of gas and dust near the Sun would be created by the shock of a spiral arm with the interstellar medium.
Due to the proximity of the LB and Loop I, it is believed that they may be interacting. Indications of the existence of a ring-like structure of dense neutral matter that would be the contour of the interaction zone between the two bubbles has been identified in X-ray and neutral hydrogen data by Egger & Aschenbach, (1995). Such an interface would be located in the region defined by the Galactic coordinates: . It has been also suggested by Frisch, (2007) that the interstellar large scale structures, identified in her mean extinction map in this direction, would make up the ring (see her Fig. 1).
Different authors present different values for the distance of this interaction zone between the LB and Loop I: Centurion & Vladilo (1991) analyzing UV spectra of eight stars in the region defined by the Galactic coordinates suggested that the gas wall is located at a distance of 40 25 pc from the Sun; Egger & Aschenbach, (1995) using data compiled by Fruscione, (1994) suggested that the distance would be approximately 70 pc. Corradi et al., (2004) using Strömgren photometry and high-resolution spectroscopy suggested the existence of two sheet-like structures, one at pc and another around 120 - 150 pc that is supposedly the interaction zone between the bubbles.
To determine the distance of the interaction zone between the LB and Loop I we investigated the interstellar reddening in the region defined by the Galactic coordinates and . The Strömgren H data was taken from the “General Catalogue of Photometric Data” (GCPD), compiled by Hauck & Mermilliod, (1998). The initial sample is composed of 8430 stars.
The determination of the intrinsic stellar parameters, colour excesses and distances are described in Sect. 2. The data, error analysis and the application of the exclusion criteria are described in Sect. 3. Limiting magnitude effects on and distances are described in Sect. 4, and colour excess diagrams are used in Sect. 5 to investigate the reddening distribution. The ring-like feature is investigated in Sect. 6. A discussion of the results is given in Sect. 7 and the conclusions are summarized in Sect. 8.
2 Intrinsic stellar parameters, colour excess and distance
The determination of the distances and colour excesses was done using the calibrations of Crawford, (1975) and Olsen, (1988) for the F-type stars, and Crawford, (1978, 1979) for the B-type and A-type stars, respectively.
The standard values of the physical parameters were obtained through interpolation in the standard relations of each spectral type. The error determination of the intrinsic stellar parameters, colour excesses and distances have been obtained for each star individually following the method suggested by Knude, (1978) complemented with the interpolation error, for greater reliability.
In a generic way for the colour excess we have:
where the intrinsic colour is calculated according to the spectral type and is the measured colour index. In the following subsections we present how the intrinsic stellar parameters, colour excesses and distances are calculated for each spectral type. The error determination steps are also described.
2.1 F-type stars
For the F-type stars intrinsic colour we used the calibration established by Olsen, (1988). The procedure is used iteratively until convergence set by is reached. In the first iteration the measured values are used. The intrinsic colour is calculated as:
| (1) |
| (2) |
where . The reddening free parameters are and . Stars with , which characterize the most extreme population II, were excluded from our analysis. The C factor defined by
has to obey the following boundary conditions:
| boundary condition | C | |||
|---|---|---|---|---|
| if | and | then C= | ||
| if | and | then C= 0.013 | ||
| if | then C= -0.05 | |||
The errors of the intrinsic stellar parameters are obtained as:
| (3) |
where
being the measurement error in and
where and are the measurement errors in and , respectively. The error in the colour excess is calculated as:
| (4) |
where is the measurement error in and is calculated in an interactive way until convergence in .
For the calculation of the absolute magnitude we used the standard relation from Crawford, (1975):
| (5) |
Therefore, the resulting error in the absolute magnitude is calculated as:
| (6) |
where is the calibration error. The interpolation error of is taken into account by the last term on the right side of Eq.(6).
2.2 A-type stars
For the A stars intrinsic colour we used the calibration established by Crawford, (1979). The calibration is used iteratively until convergence in . The intrinsic colour is calculated as:
| (7) |
| (8) |
For the type stars, the indexes have the same meanings as for the F-type stars. To the stars of the intermediate group (), the Balmer jump that is a function of the surface gravity also becomes affected by the temperature; thus the calibrations for this group are not very accurate. Therefore, in this work they have been excluded.
The intrinsic colour error is calculated in an interactive way until convergence in . Since and depend on , the equations are:
| (9) |
| (10) |
The values of and are calculated in the same way as for the F-type stars.
The absolute magnitude is calculated with the following equation:
| (11) |
The error in the absolute magnitude is calculated as:
| (12) |
where and the last term is the interpolation error of .
2.3 B-type stars
In these stars the index is related to the luminosity and to the effective temperature. The , and values are interpolated from through the calibration established by Crawford, (1978). The calibration is used iteratively until convergence in .
The error in the intrinsic colour is calculated by:
| (13) |
where is the derivative of the polynomial generated for as a function of from the standard relation. For we have:
| (14) |
where is the observed error and is calculated as described in sect. 2.1 (Eqs 3 and 4).
The absolute magnitude is calculated by the following equations:
| (15) |
| (16) |
Stars with were excluded from our analysis.
The error is calculated as:
| (17) |
where .
2.4 Distances
The distance does not depend on the spectral type, being calculated as:
| (18) |
assuming the standard extinction law (R.
The distance error is calculated by taking into account the dependences on , and . Thus we have:
| (19) |
where , , .
It could be argued that the distances would be underestimated in those directions where higher Rv values might be found, particularly some directions towards the Galactic center. However, as noted by Fitzpatrick & Massa, (2007), the regions where Rv is greater than 4.3 are very few, small and extremely localized.
To give an idea of how the distances would be affected by the difference in RV we calculated the percentual distance difference d, taken for , as shown in Table 1. The lowest RV values would take into account the higher X-ray and far-UV energy density inside the bubbles while the highest values would be associated with those very dense cores. Our choice for RV is shown to be appropriate when the photometric distances are compared to the Hipparcos distances in Sect. 3.2.
| RV (UBV) | 1.5 | 2.0 | 2.5 | 3.1 | 3.5 | 4.0 | 5.0 |
|---|---|---|---|---|---|---|---|
| RV () | 2.1 | 2.8 | 3.5 | 4.3 | 4.9 | 5.6 | 6.9 |
| d | -10% | -7% | -4% | - | +3% | +6% | +13% |
3 The data
In order to obtain the interstellar reddening towards the interaction zone we used the H data from the “General Catalogue of Photometric Data” (GCPD), compiled by Hauck & Mermilliod, (1998). We selected the stars with a complete set of data (V, , , , ), eliminating the stars classified as doubles, variables and peculiars in the GCPD.
The individual errors of the measured values (, , , , ) were taken from the original papers. Whenever possible the average errors were used.
The initial sample has 8430 stars covering the region defined by the Galactic coordinates: and .
3.1 Error analysis
As can be seen on the left side of Fig. 1 the histogram of the error in , namely , shows greater concentration around , with a dispersion of . To assure the reliability of our results we decided to accept only , that is limited to the average of plus 2 times the dispersion.
Since the error of the distance () is proportional to the distance of the star, we have used the relative error in our analysis. As can be seen in the histogram of on the right side of Fig. 1, the shows higher concentration around 0.15, with a dispersion of . Consistently with , the accepted values were limited to .

3.2 Application of the exclusion criteria
For a colour excess to be useful for interstellar medium studies a set of selection criteria must be met. The exclusion photometric criteria are those proposed by Olsen, (1979), Crawford, (1975, 1978, 1979) and Tobin, (1985).
For the B stars it should be kept in mind that possible Balmer line emission makes the absolute magnitudes and thus the distances less precise. We have chosen the Tobin (1985) exclusion criteria, even at a cost of excluding more than 40% of the B-type stars of the available sample.
We also used the SIMBAD database at CDS to verify the characteristics of the stars in our sample and to eliminate any object classified as double, peculiar or variable.
In each set of the unreddened values are expected to be clustered around zero. As can be seen in the histogram of shown in Fig. 2, the Gaussian curve indicates that there is no zero point effect. The center of the Gaussian is located at and and as can be seen in Fig. 2 the number of stars below n*sigma are within expectation.

Very few higher negative colour excess values (i.e. ) are still present in the final sample after the application of the exclusion criteria. Most of them are within 1.3 the average of . Although they indicate a possible star peculiarity we have kept them in the final sample but with a separate code indicated in the figures.
To verify the precision of the photometric distances () and to ensure the validity of R, we compared our results with the trigonometric distances () determined by the Hipparcos satellite. We considered only stars with , that is, the same error range used for the photometric distances. We eliminated those stars whose did not coincide with within the error range. The stars eliminated by this criterion did not show any trend with spatial location.
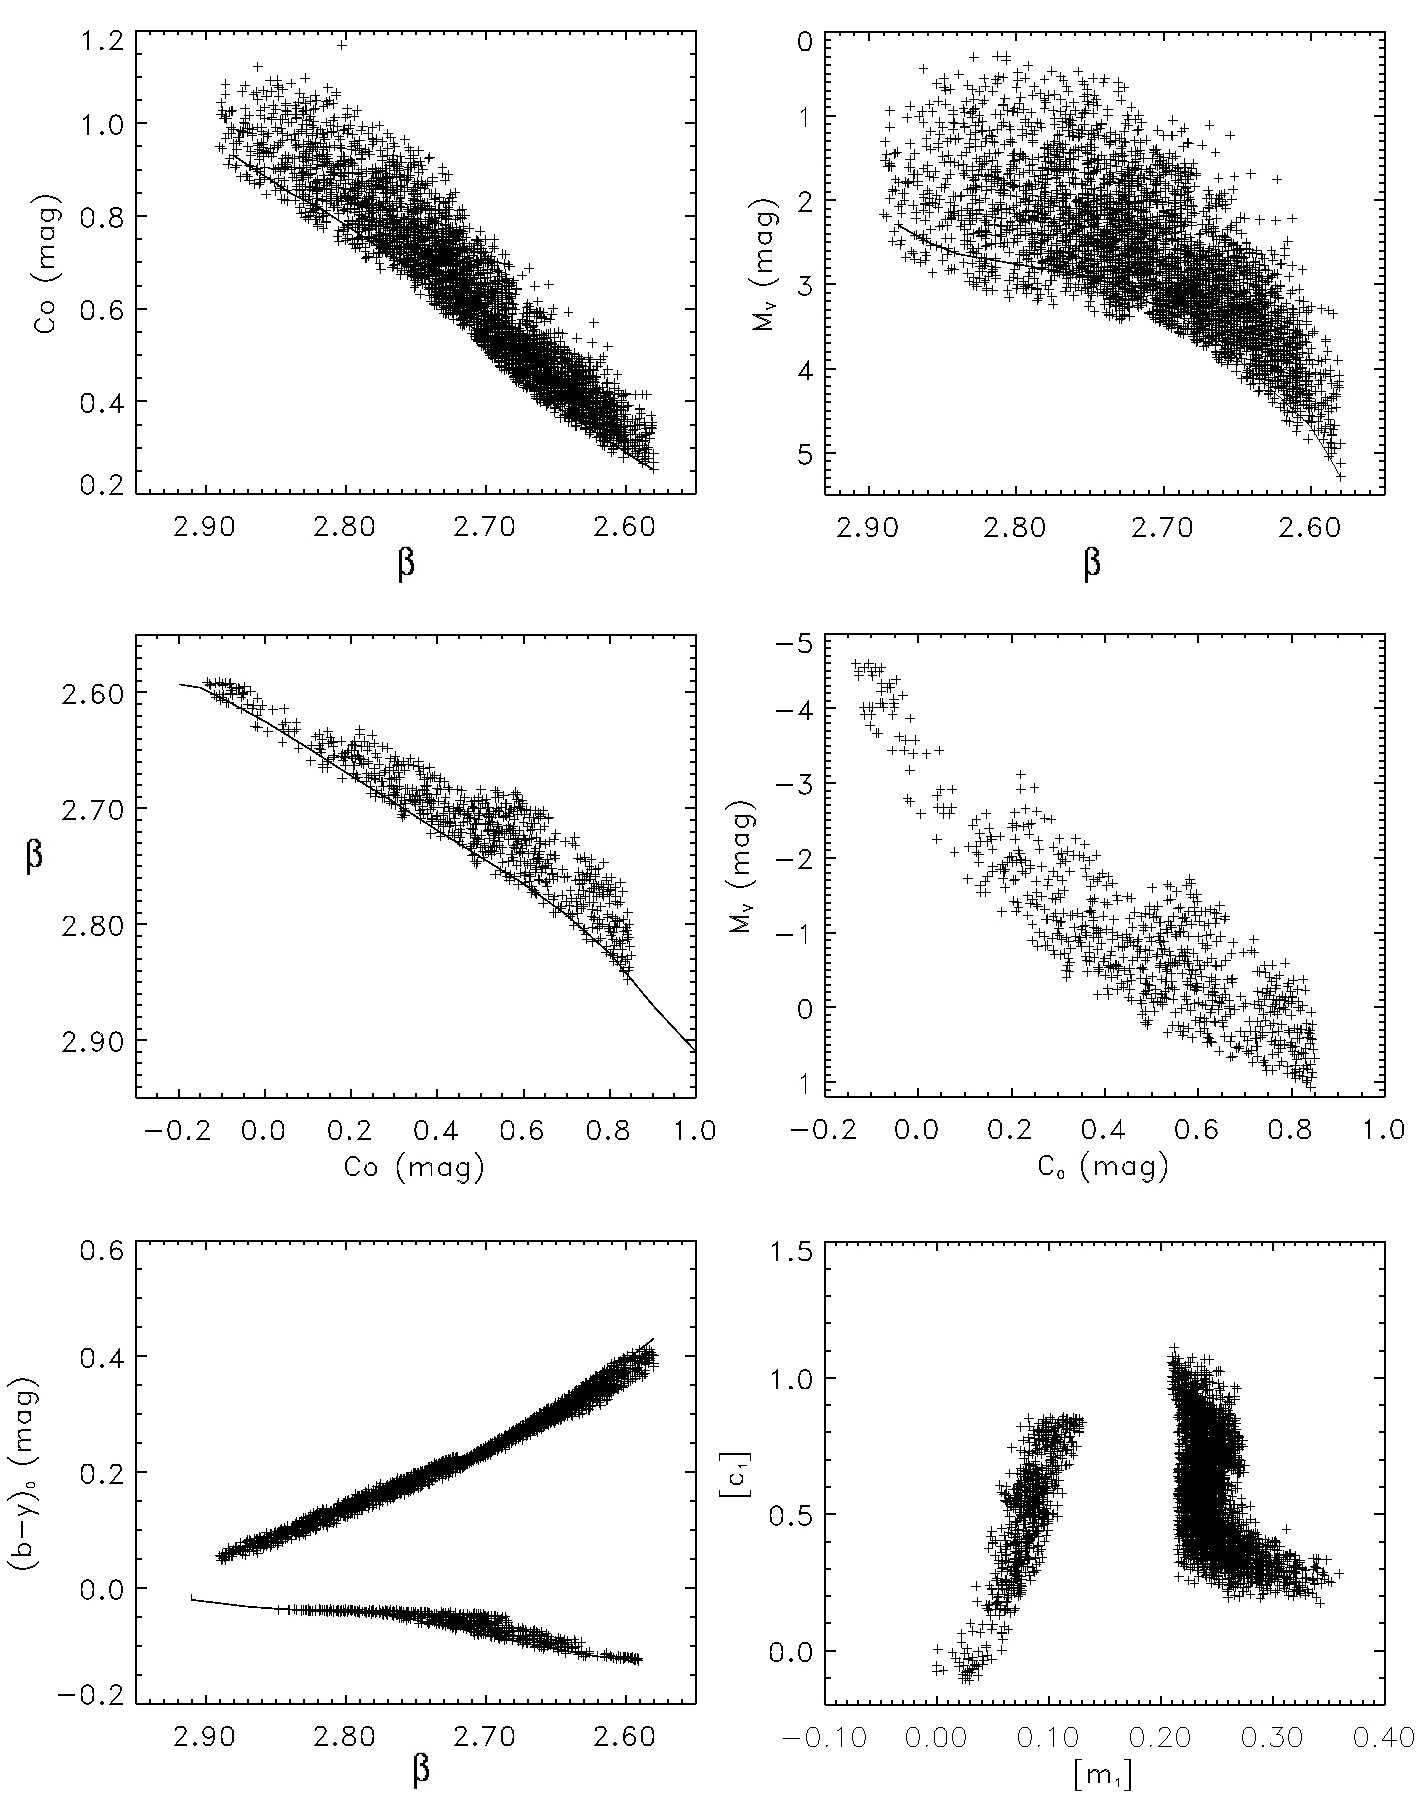
In Fig. 3 we show the physical stellar parameters of the selected stars with the superposition of the standard relation curves. We do not observe any major systematic disagreement with the standard relation. We also give the diagram of the selected stars. The stars of the intermediate group (A1-A2) were eliminated, as were stars brigther than luminosity class III and spectral types G, K and M.
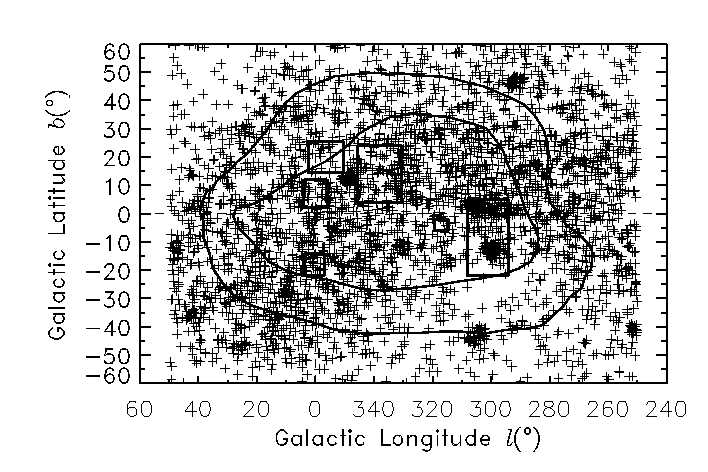
Our final sample has 4346 stars up to 500 pc from the Sun. The distribution of the final sample over the studied area is given in Fig. 4 and the ring-like feature proposed by Egger & Aschenbach, (1995) is also plotted for reference. As can be seen the part of the ring located at and is less densely populated.
4 Limiting magnitude effects on and distances
In a magnitude limited sample, the reddening data are expected to be complete to a maximum observable colour excess given at each distance (Knude, 1987).
The histograms of the magnitudes, shown in Fig. 5, indicate that there is a decrease in the number of stars fainter than for the F-, for the A- and for the B-type stars.

As our sample may be complete only down to these values, it would be important to see if this limit has any effect on the colour excess distribution.
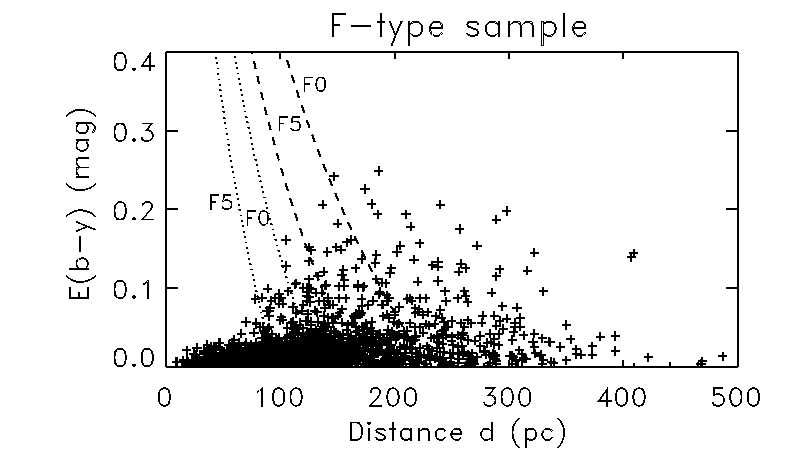
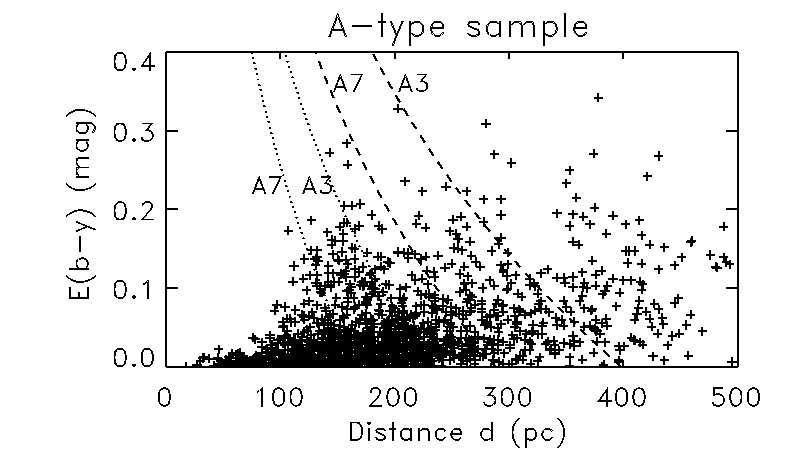
The distance diagrams for the F-, A- and B-type stars of the final sample are shown in Fig. 6. They illustrate that higher values of colour excesses could have been detected, if they exist. In these diagrams the dotted and dashed curves indicate the maximum detectable as a function of the distance for classes F0 V, F5 V, A7 V, A3 V, B8 V and B5 V stars with magnitude V = and V = , respectively.
When the F-type stars are no longer capable of picking up the larger reddenings, the A- and B-type stars, being intrinsically brighter, exist in enough numbers to detect such larger reddenings, if present.
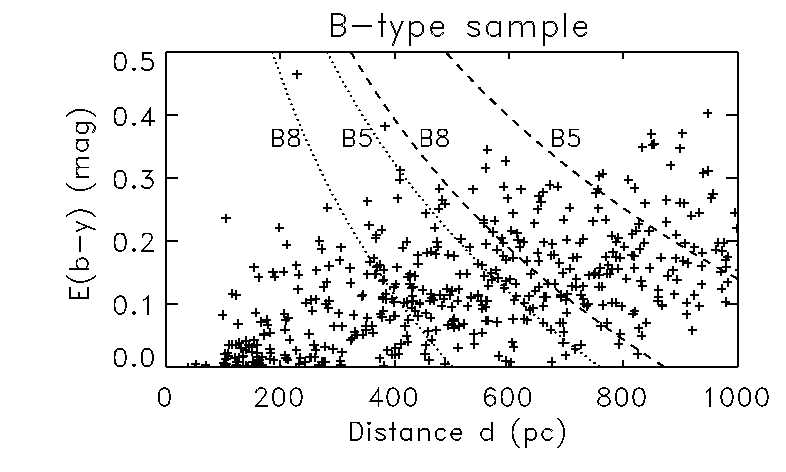
According to Egger & Aschenbach, (1995), the column density of neutral hydrogen in the line of sight of the ring jumps from cm-2 to cm-2 at pc, corresponding to from to , if it is assumed that the standard relation between and (Knude, 1978b ) is valid.
Since the data sample is drawn from a general photometric compilation, and the original data was obtained for different purposes we have also to verify whether the data are pertinent to our analysis. In particular, we need to know if the final sample is adequate for measuring the possible existence of an extinction jump from to around 100 pc, which would correspond to the bubbles’ ring. We refer the reader to Sect. 6.4 where we show separate histograms of the V magnitudes of the index and the absolute magnitude MV for each area used to investigate the existence of the bubbles’ interface.
5 The interstellar reddening towards the interaction zone
To investigate the interstellar reddening distribution towards the interaction zone of the two bubbles we will plot the colour excess as a function of the Galactic coordinates (, ). The colour excesses are divided according to the symbols and colors shown in Table 2.
| (mag) | Symbol | Color | B & W |
|---|---|---|---|
| -0.011 | open triangle | black | black |
| -0.011 - 0.010 | square | yellow | light gray |
| 0.010 - 0.020 | open square | green | light gray |
| 0.020 - 0.040 | light blue | light gray | |
| 0.040 - 0.070 | purple | dark gray | |
| 0.070 - 0.100 | + | red | black |
| 0.100 - 0.200 | circle | black | black |
| 0.200 | square | black | black |
This division is based on the fact that typically stars with can be considered unreddened, consistently with . Stars that present are probably screened by at least one small diffuse interstellar cloud, whose mean colour excess is around according to Knude, (1978). Stars showing are certainly screened by at least one dense interstellar cloud.
Figure 7 shows the stars according to their position in the sky and divided to intervals of 30 pc to 300 pc, and by 50 pc intervals to 500 pc. The ring-like feature proposed by Egger & Aschenbach, (1995) and a schematic contour of the Oph, Lupus, R CrA, G317-4, Southern Coalsack, Chamaeleon and Musca dark clouds are also plotted in this figure for reference. For clarity the cloud’s names are indicated in Fig. 8.
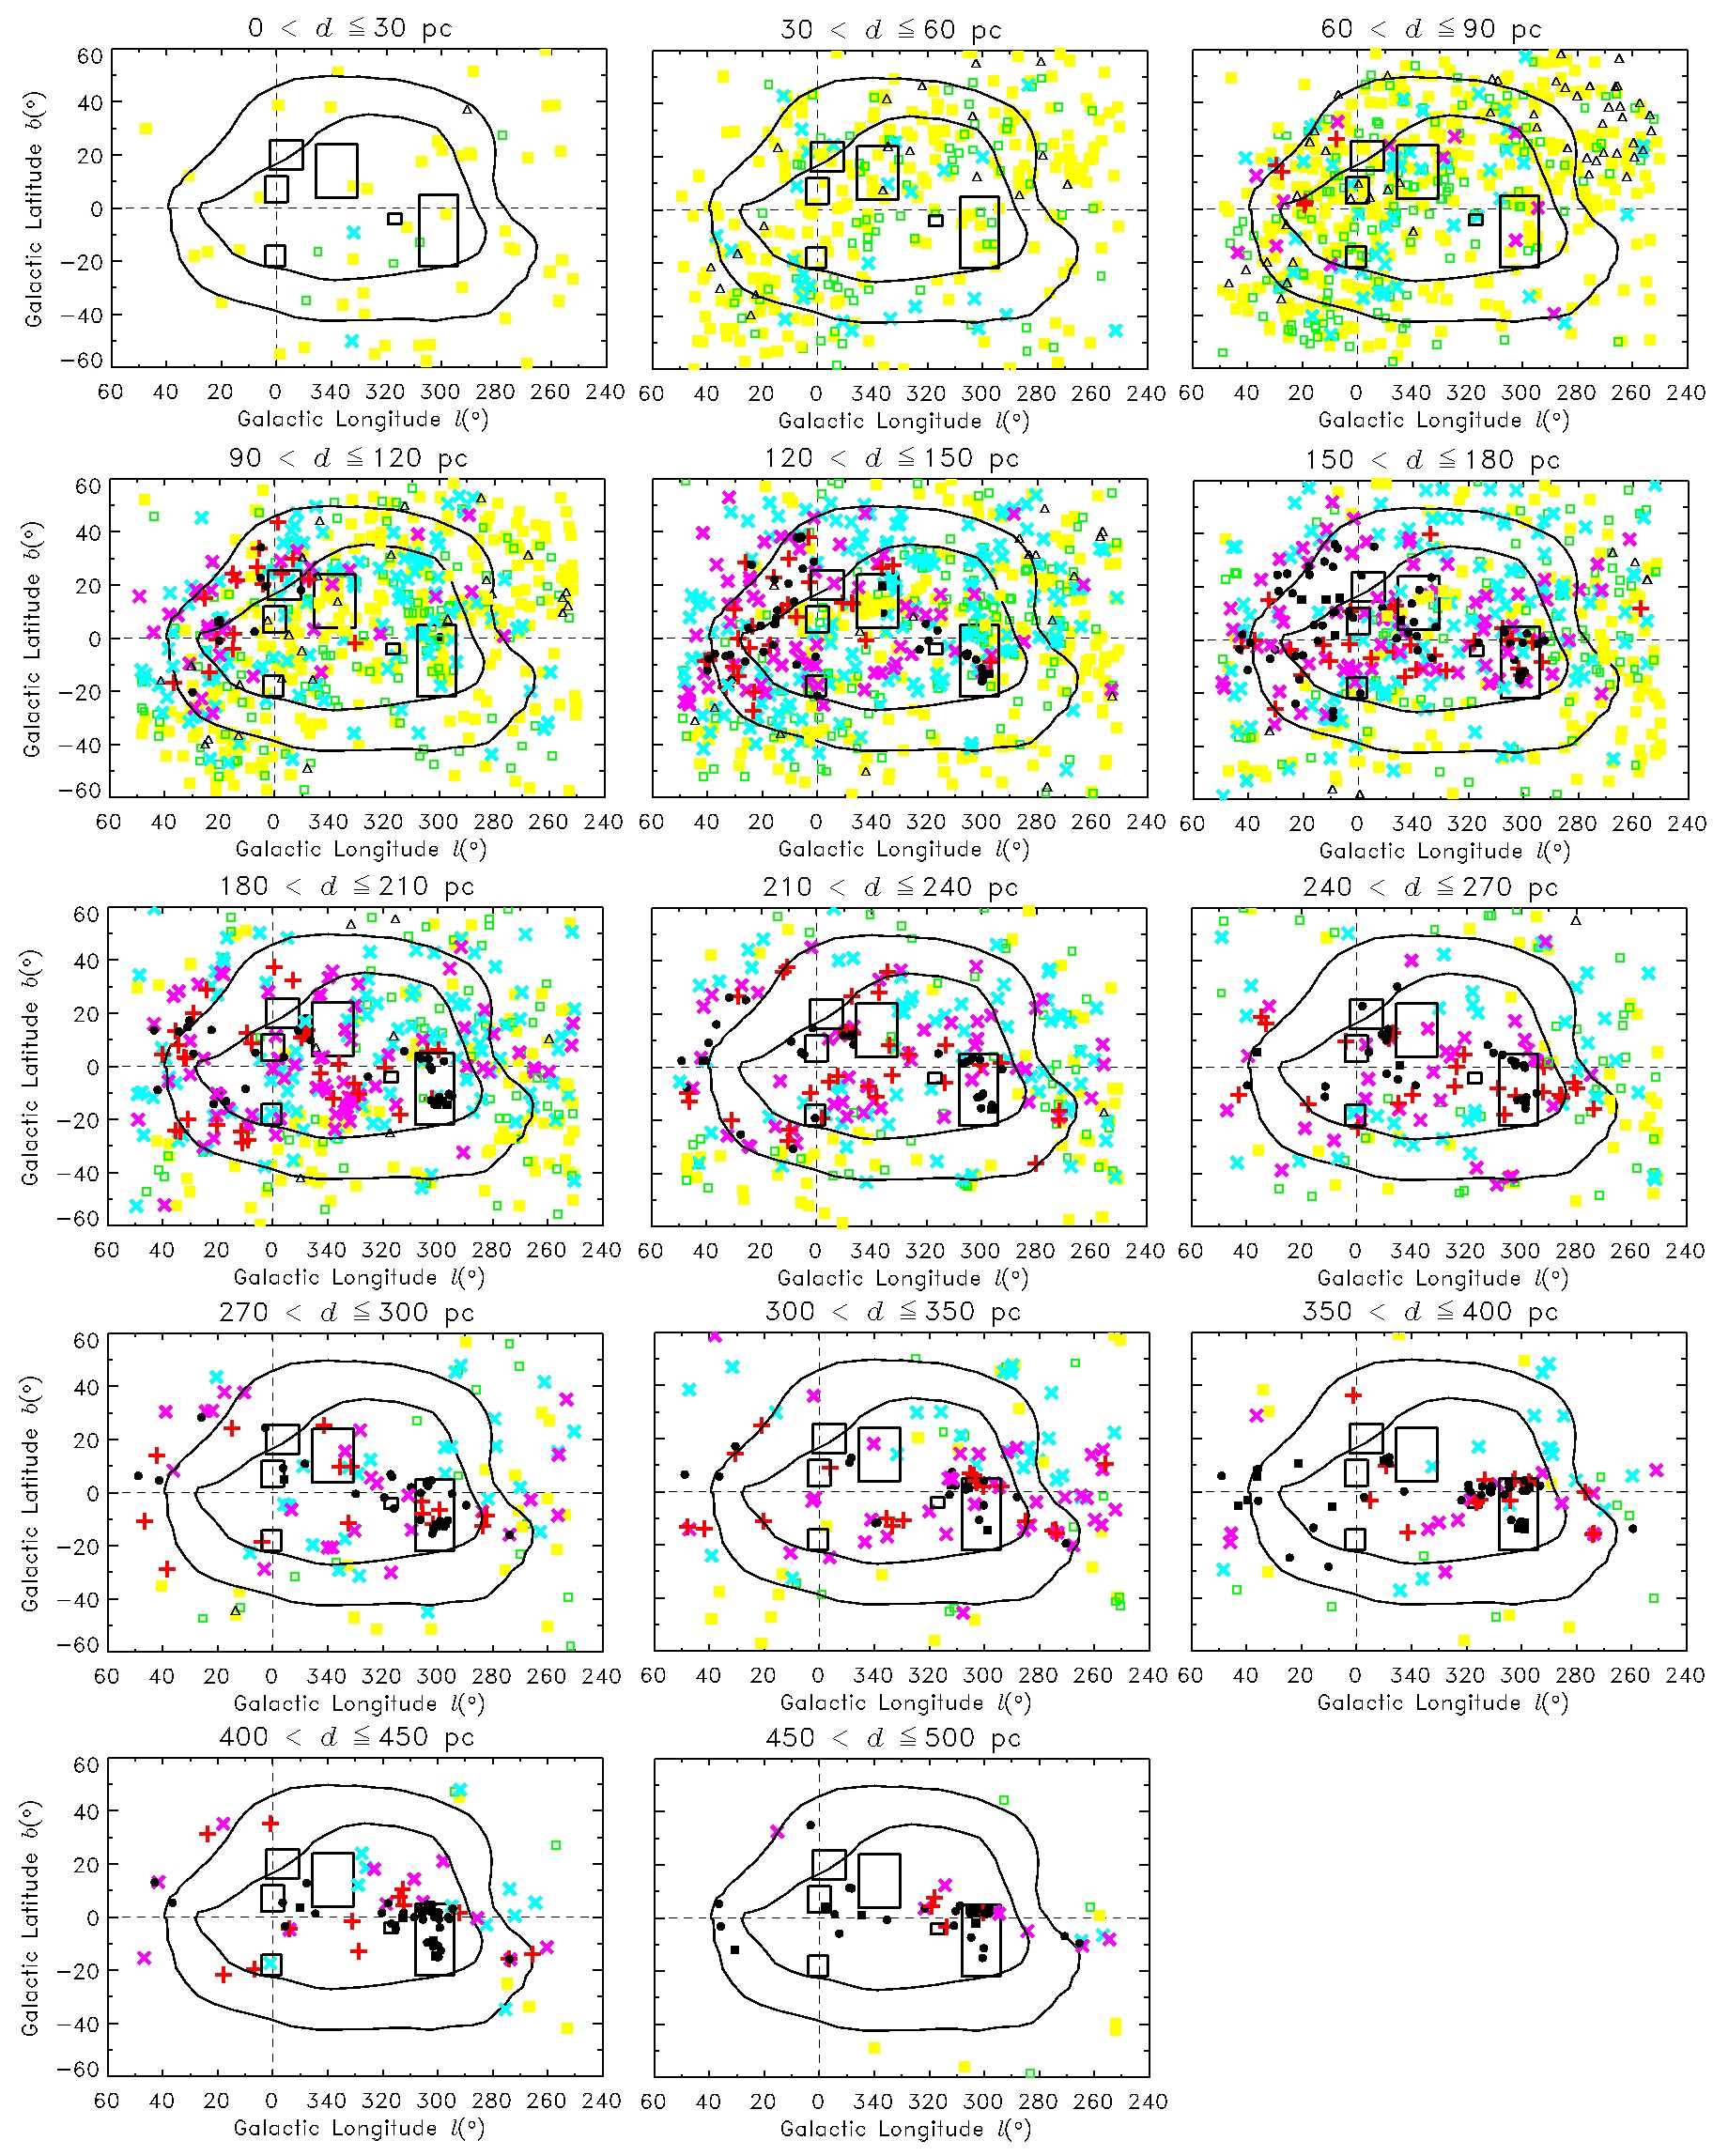
Our data show that up to 60 pc the values are below in all directions, being a typical value. The first stars with reddening corresponding to the ring column density – – appear on the western side between pc, whereas on the eastern side they appear only after d270 pc.
On the western side most of stars beyond 120 pc show a colour excess between , whereas on the eastern side we still have many stars with up to 270 pc, where a definite transition occurs to .
From 100–180 pc we clearly see the presence of the dark clouds, as indicated by the black circles in Fig. 7. A thorough discussion will be given in the next section.
5.1 Analysis of the reddening as function of the distance and the Galactic latitude
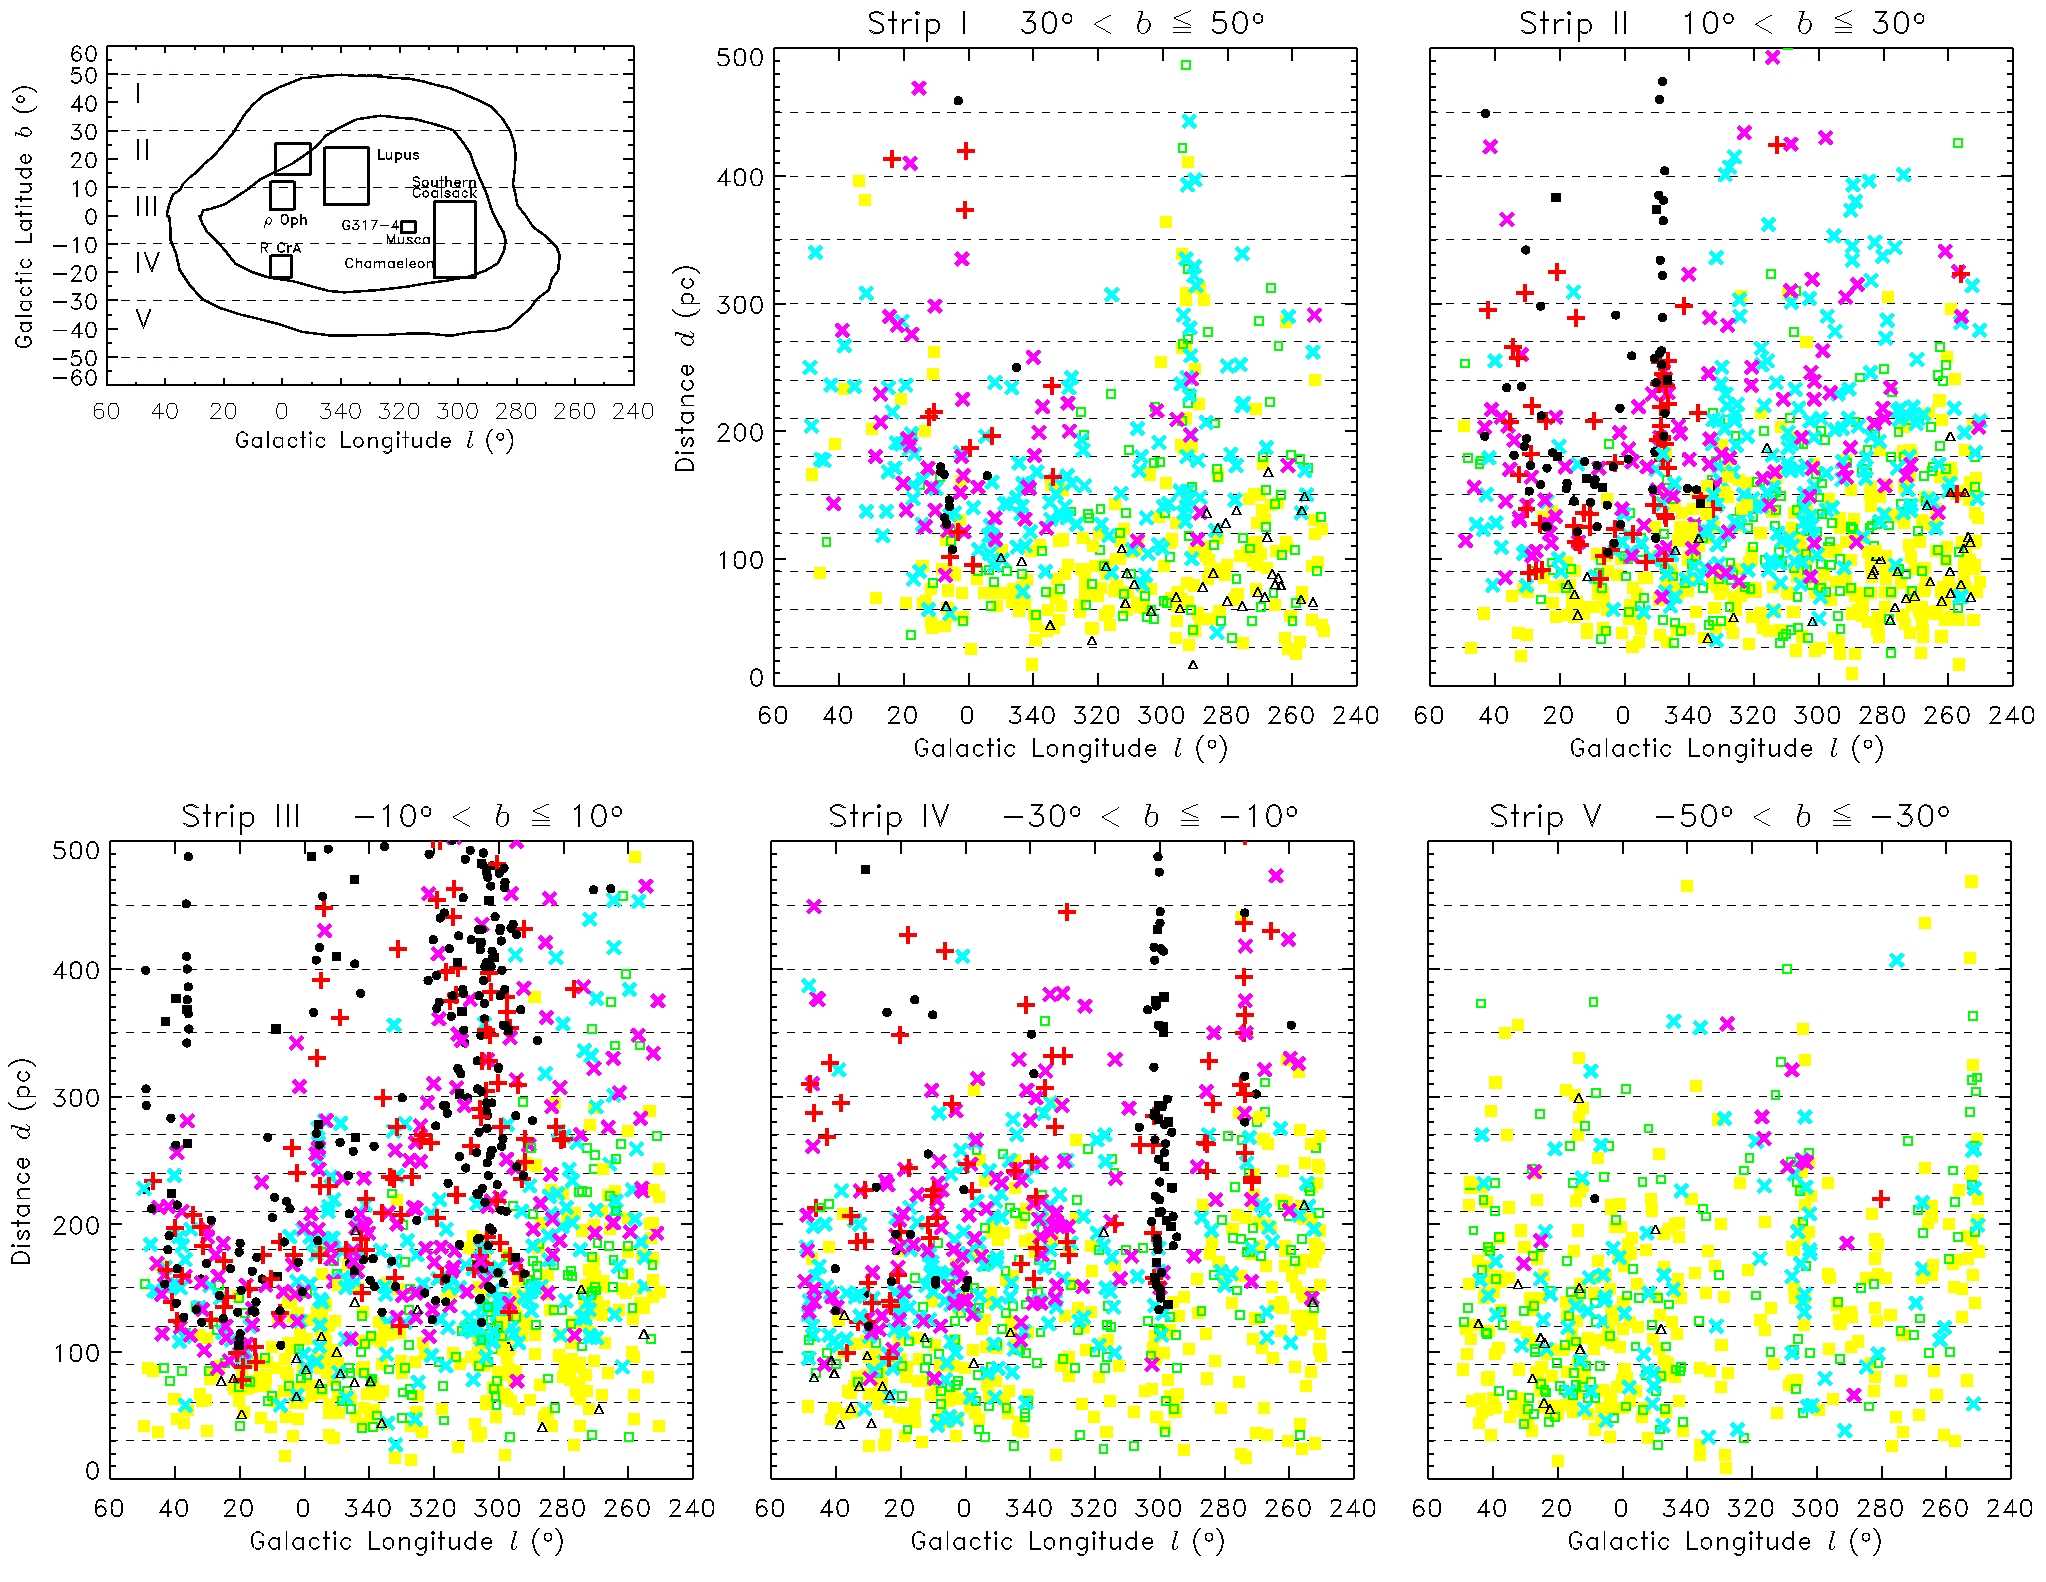
Complementing the previous diagrams we will plot diagrams of d (pc) Galactic longitude for five Galactic latitude strips of width each. These diagrams are presented in Fig. 8 together with the position of each strip and are analysed in the next paragraphs.
-
•
Region I ():
The majority of the stars in this direction show (yellow and green squares) up to 100 pc on the western side () and up to 150 pc on the eastern side (). A transition to (purple crosses) occurs approximately at 120 pc only on the western side. In the direction of the ring, the expected transition to (red plus signs) is not observed, except for a small region around associated with the Oph molecular cloud where (black dots).
-
•
Region II ():
A transition to (red plus signs) appears at about 90 pc between . However, in the eastern side a similar transition is not observed. Even a minimum color excess cannot be clearly assigned, given the large number of stars with (yellow and green squares) up to at least 150 pc. Still on the western side, several stars present (black dots) from 100 - 150 pc indicating that some parts of the Lupus and Oph-Sgr molecular clouds have been crossed.
-
•
Region III ():
A transition to (red plus signs) occurs at about 90 pc on the western side of the ring (), changing to 120 – 150 pc in its central parts (). A similar transition on its eastern side is not clearly observed up to pc (no red plus signs are seen). Between , most stars show very low reddening (yellow and green squares) up to pc, with a hint of a minimum value of (purple crosses) from 180 pc. The directions with (black dots) indicate the presence of the molecular clouds; in the western side they are seen from 100 - 150 pc (Scutum and Lupus) whereas in the eastern side they are seen from 120 - 180 pc (G317-4, Coalsack, Musca).
-
•
Region IV ():
The reddening in this region follows the same trend as the previous strip. Remarkably, between , the values of (black dots) only appear at pc. But, in the area internal to the ring we have the presence of the molecular clouds Sag-South, Aql-South and R CrA at 120 – 150 pc on the western side and Chamaeleon at pc on the eastern side.
-
•
Region V ():
There is no sign of the transition to (no red plus signs). A hint of a transition to (purple crosses) occurs at 200 pc, but is restricted to and . This is about the same position and distance as the bright infrared filament observed by Penprase et al., (1998). The reddening remains very low in the whole area (yellow and green squares and light blue crosses), being a typical value.
Thus, the expected transition to occurs in the western part of the ring at about 90 and 120 pc, whereas on the eastern side it is not clearly seen before 280 pc. Near the Galactic plane the presence of the dark clouds is clearly identified by on the western side at about 100 – 150 pc and a little further on the eastern side, at about 120 – 180 pc. In the southernmost part of the ring the reddening remains very low, typically in all its extension, except towards the Mensa constellation where a possible transition is observed at pc.
6 On the existence of a ring-like feature
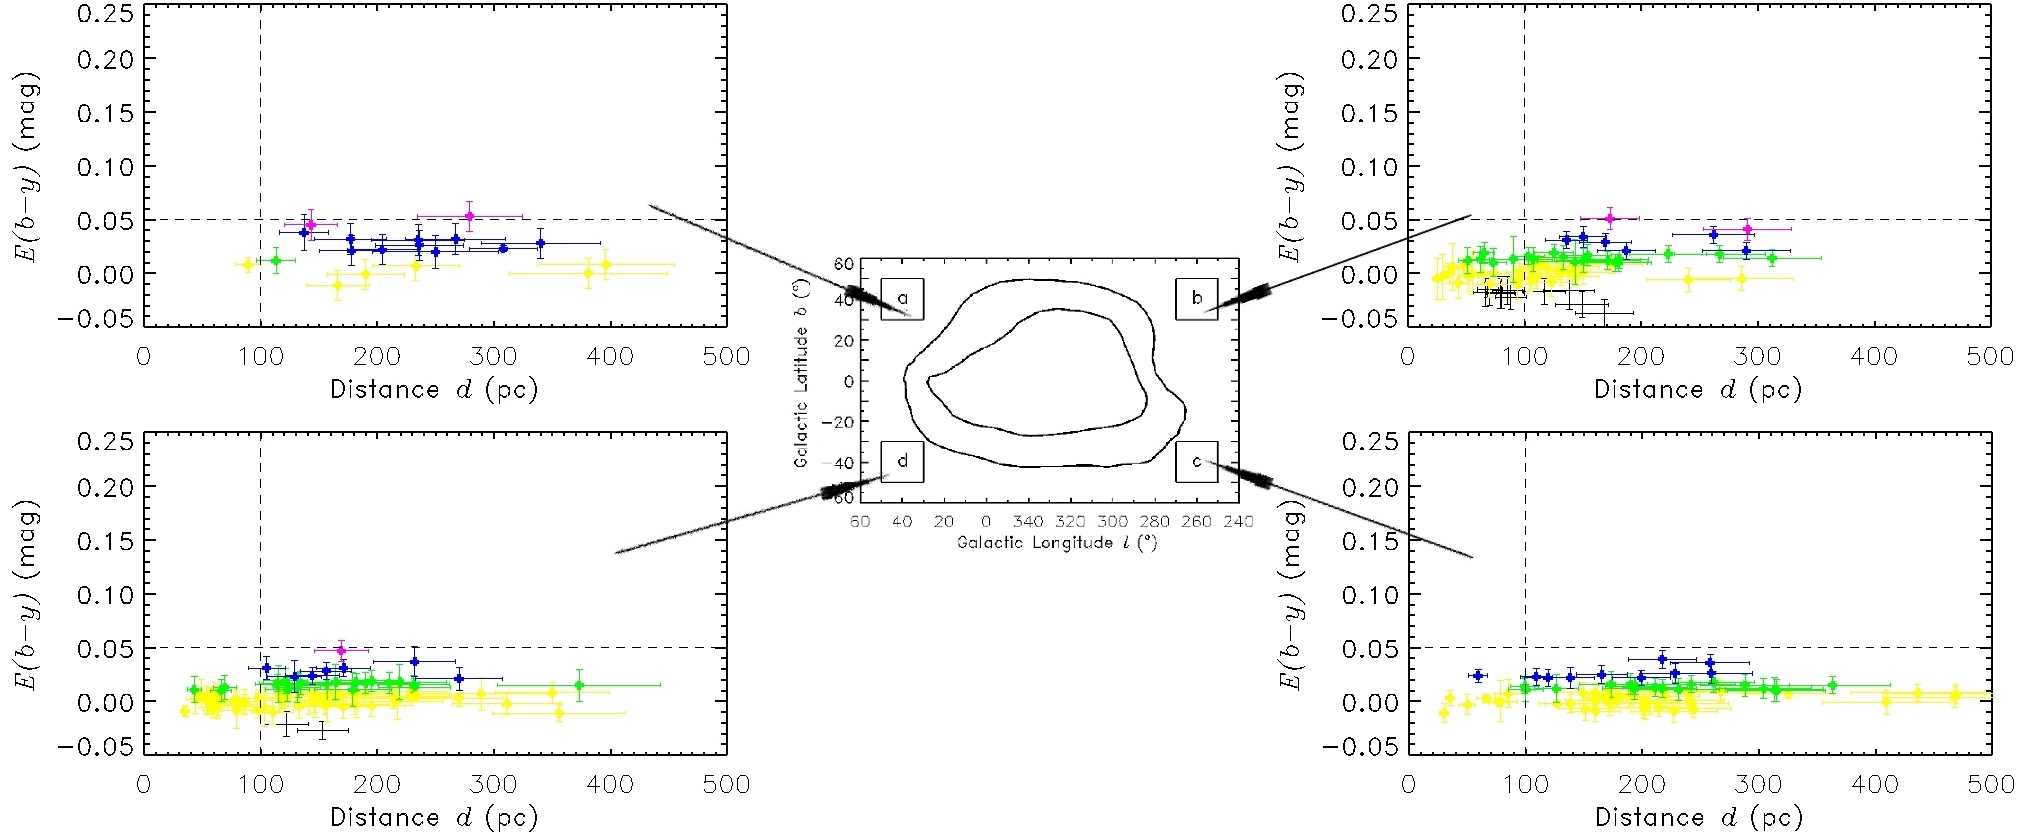
The ring-like feature proposed by Egger & Aschenbach, (1995) would be the most prominent characteristic of the interaction zone. To identify the ring we plot diagrams of (mag) (pc), with the respective errors, for areas outside the ring, along the ring feature contour and inside the ring. In these diagrams the horizontal dashed line indicates and the vertical dashed line pc.
6.1 Analysis of the distance diagrams for areas outside the ring feature
In Fig. 9 (from “a” to “d”) we present the (mag) (pc) diagrams for areas outside the ring. The respective coordinates are given in Table 3.
| area | ||||
|---|---|---|---|---|
| a | 30 | 50 | 30 | 50 |
| b | 250 | 270 | 30 | 50 |
| c | 250 | 270 | -50 | -30 |
| d | 30 | 50 | -50 | -30 |
In the areas outside the ring the colour excess remains low () up to the maximum distance of the stars of our sample, being a typical value.
6.2 Analysis of the distance diagrams for areas along the ring
In Fig. 10 (from “e” to “o”) we present the same diagrams for the areas located along the ring. The respective coordinates are given in Table 4.
| area | ||||
|---|---|---|---|---|
| e | 10 | 20 | 10 | 30 |
| f | 310 | 340 | 35 | 47 |
| g | 282 | 292 | 10 | 30 |
| h | 280 | 285 | -10 | 10 |
| l | 270 | 285 | -30 | -10 |
| m | 300 | 340 | -40 | -27 |
| n | 20 | 30 | -30 | -10 |
| o | 27 | 37 | -10 | 10 |

On the western side of the ring, in areas “e”, “n” and “o”, the first very reddened stars () appear at pc.
Area “e” contains the molecular cloud Oph-Sgr () and area “n” contains the Sag-South and Aql-South (). In both areas there is a transition to at pc, indicating the distance to these two objects.
Near the Galactic plane, in the general direction of the Scutum dark cloud (), area “o” shows a first jump to higher colour excess values at pc and a second jump at pc.
In the northernmost part of the ring, area “f”, the colour excess increases with the distance in a gradual way, such that becomes predominant only after 15 pc. In the eastern side of the ring, areas “g” and “h”, the colour excess remains below up to the maximum observed distance. Only very few stars show a reddening slightly greater than this after 20 pc.
In area “l” the reddened stars () appear only at 50 pc. After this distance the reddening remains constant. Remarkably, this area contains the abovementioned infrared bright filament towards the Mensa constellation that is also located at 230 30 pc and has a HI column density cm-2 (Penprase et al., 1998) and corresponding .
The colour excess in the southern part of the ring, area “m”, remains low (), at least up to pc.
On the western side of the ring the distribution of the colour excess occurs in a very different way than the eastern side (both to northern and southern areas). Such results have led us to think that the annular ring feature may not be a real entity.
6.3 Analysis of the distance diagrams for the areas inside the ring
The same diagrams for areas “p” to “t”, inside the ring are shown in Fig. LABEL:edistin. The respective coordinates are given in Table 5.
| area | ||||
|---|---|---|---|---|
| p | 330 | 350 | 10 | 25 |
| q | 303 | 323 | 15 | 30 |
| r | 290 | 310 | -18 | 2 |
| s | 320 | 340 | -13 | 7 |
| t | 350 | 10 | -18 | 2 |
The presence of the dark clouds, clearly identified by , can be seen on the western side at about 100 – 150 pc and on the eastern side at about 120 – 180 pc in all areas, except for area “q”. Beyond these distance ranges the number of unreddened stars decreases considerably indicating the location of these large dark cloud complexes.
In area “p” we have Lupus IV and Lupus V at 100 pc; in area “r” we have Coalsack at 160 pc and Chamaeleon at 140 pc; in area “t” we have RCrA at 140 pc; and in area “s” we have Lupus I at 150 pc.
In area “t”, near the Scutum dark cloud (), there is also a first jump to higher colour excess values at pc and a hint of a second jump at pc.
6.4 Limiting magnitude effects on and distances of the selected areas
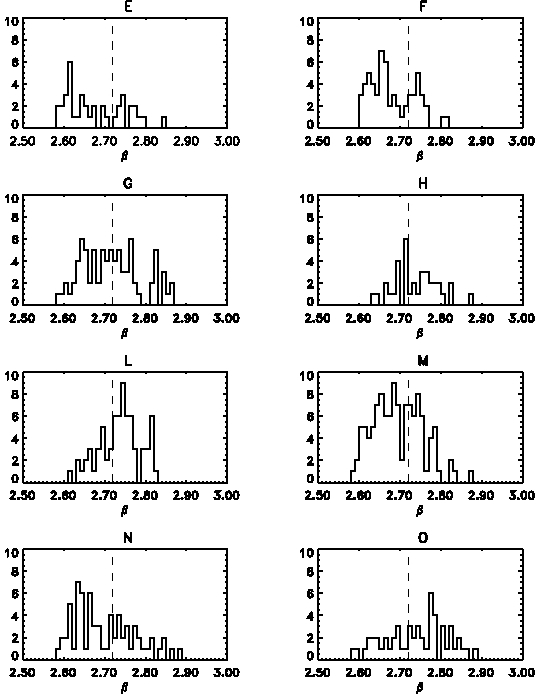
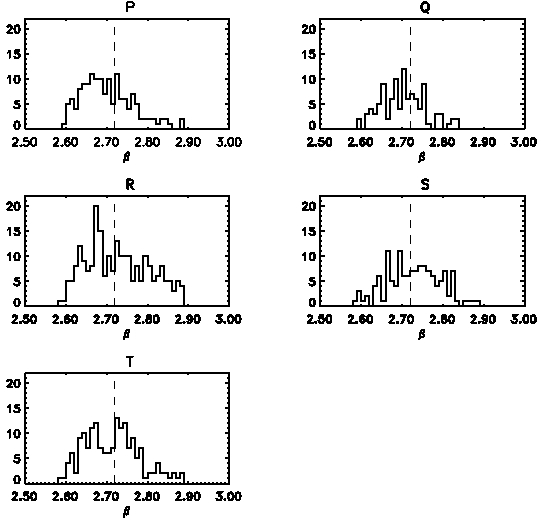
To ensure that the final sample is adequate for measuring the possible existence of an extinction jump from to around 100 pc we have also drawn separate histograms of the V magnitudes, the index and the absolute magnitude MV for each area that has been used to analyse the existence of the bubbles’ interface.
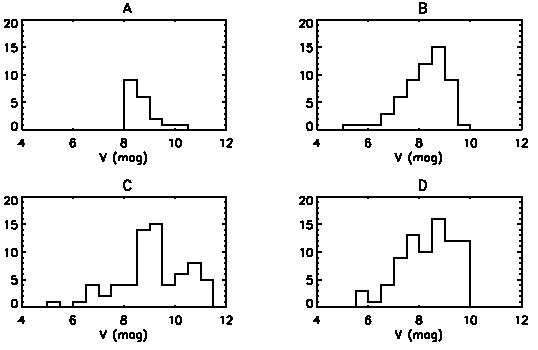
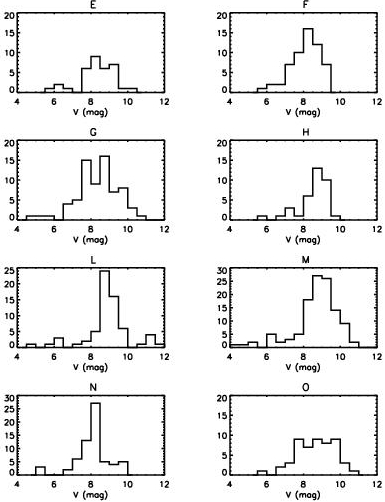
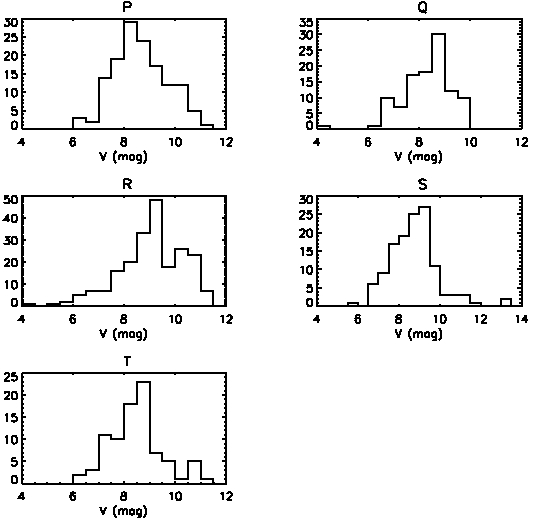
As can be seen in Fig. 12 the histograms of the V magnitudes may be considered complete up to V8.5-9.0 for all areas.
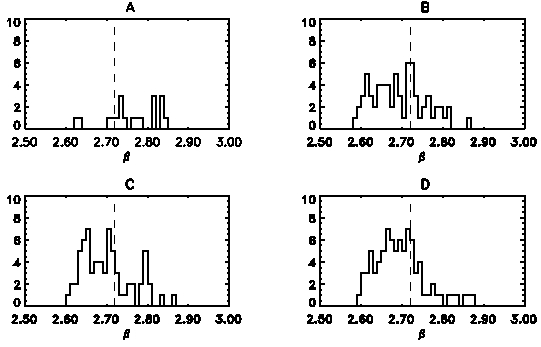
The histograms of the index, Fig. 13, show that the sample has enough A-type stars to detect the higher values of colour excess when the F-type stars are not capable of detecting them any longer.
As can be inferred from Fig. 14 and 15, the typical MV in the selected areas is around and for the F- and A-type stars, respectively.
Taking one of the lowest limiting magnitude cases among the studied areas, V = , the F-type stars of the sample could have detected up to 103 pc and the A-type stars up to a distance of 164 pc. If we consider , the corresponding distances would be 114 pc and 180 pc for the F- and A-type stars, respectively. Thus, our sample is able to detect a jump in colour excess from to around 100 pc.
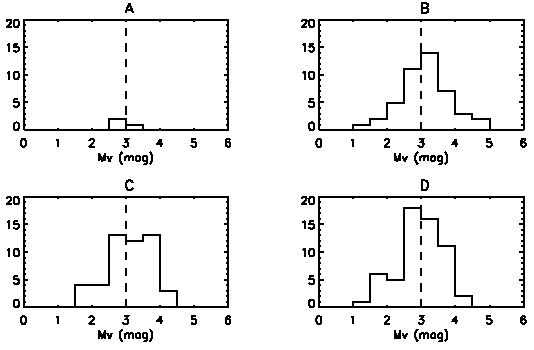
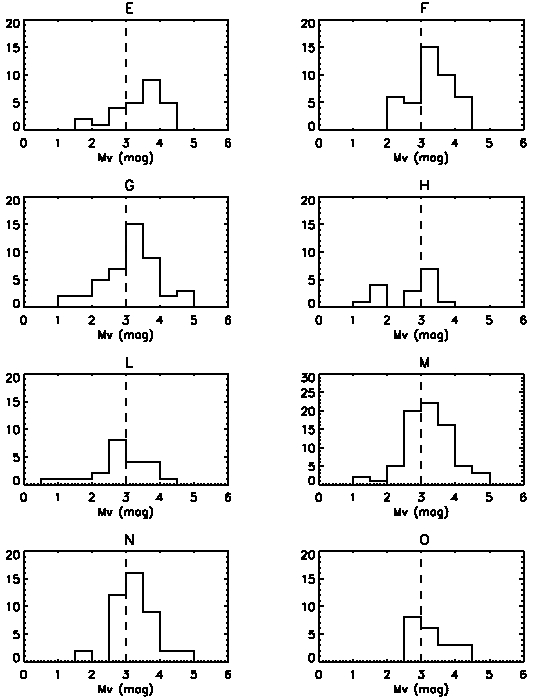
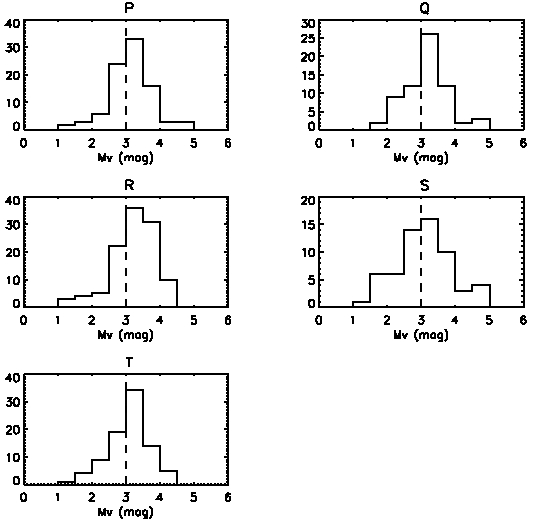
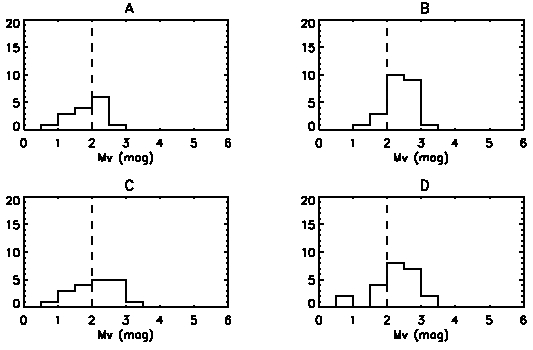
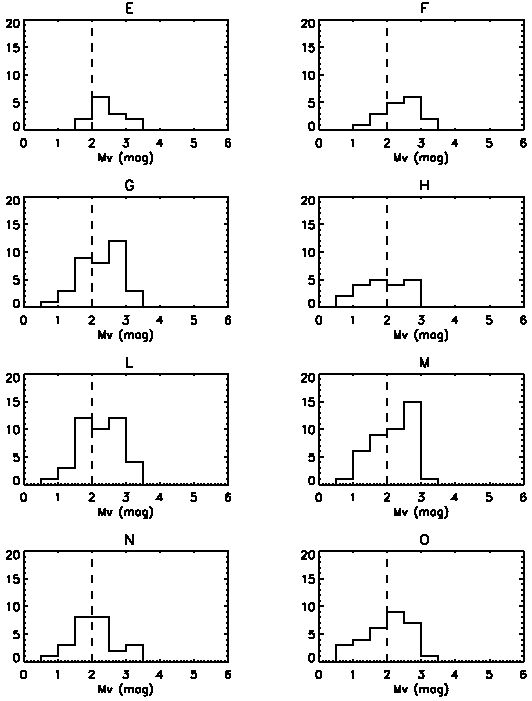
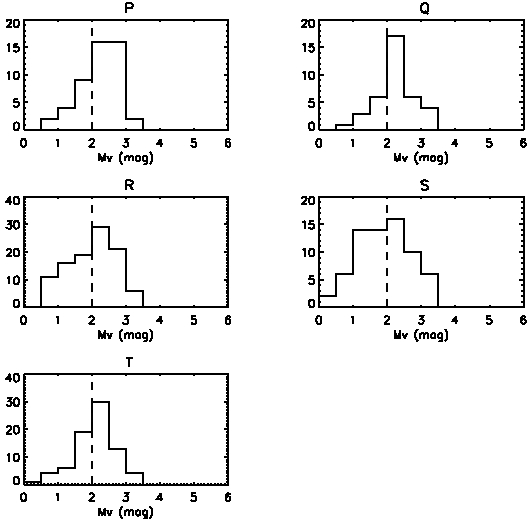
Looking at the histograms of and MV – Figs. 13, 14 and 15 – one might infer that there are no selection effects on the colour excess distance diagrams. There are regions with higher limiting magnitude and better spectral type coverage where greater reddenings are not detected, whereas there are areas with worse spectral coverage and lower limiting magnitude where greater reddenings are detected. Therefore, we conclude that if the reddening were present it could be detected.
7 Discussion
Analyzing these diagrams, we can summarize the results in the following way:
-
•
Until 60 - 80 pc the colour excess remains below in all directions, with a being typical value.
-
•
The expected transition to occurs on the western part of the ring at 20 pc, whereas on the eastern side it is not clearly seen before 280 50 pc.
-
•
In the northernmost area of the ring there seems to be a gradual increase from to around , while in the southernmost area the colour excess remains constant up to the maximum surveyed distance. However, a possible transition is observed at 200 20 pc towards the Mensa constellation in this region.
-
•
In the internal part of the ring the main features are defined by the dark clouds, clearly identified by on the western side at about 100 – 150 pc and on the eastern side at about 120 – 180 pc. Beyond these distance ranges the number of unreddened stars decreases considerably indicating the location of these large dark cloud complexes.
-
•
In the external parts of the ring the colour excess remains below in all directions.
Comparing our results with the literature ones we observe that Sfeir et al., (1999) identify a tunnel in , until pc. The existence of this tunnel is confirmed in our work, since in this direction we find until pc. Perry & Johnston, (1982) suggests that the effects of interstellar reddening may be ignored for stars within 80 pc in agreement with our results.
On the other hand, Centurion & Vladilo, (1991) analyzing UV spectra of eight stars in the region defined by the Galactic coordinates and observe an increase in the column density of the neutral sodium at pc and suggest that this is the distance of the interface between the LB and Loop I. However, in our work, we verify that up to 60 pc in all directions and that in this direction, in particular, we have stars considered without reddening () up to 180 pc (see Fig. 7).
Knude & Hog, (1998) estimated the distance to the star forming clouds in the Lupus IV and Lupus V region as around 100 pc. Franco, (2002) report a somewhat greater distance of 150 pc to Lupus I. We also observe a similar behaviour in the Lupus direction, which suggests that the Lupus region may have two distinct structures.
Our results for the infrared filament towards the Mensa constellation (210 20 pc) supports the distance determination of 230 30 pc by Penprase et al., (1998). This reinforces our findings that the eastern and western parts of the ring are located at different distances.
Frisch, (2007) uses mean extinction maps to study the distribution of the ISM surrounding the LB. is calculated from the photometric data in the Hipparcos catalog and averaged over stars in a sector with a width of and overlapping distance uncertainties. Like us, Frisch, (2007) sees the same large scale features that would compose the ring, and a similar spatial distribution of the colour excess. Since her map samples the whole distance interval up to 500 pc it is difficult to infer the precise location of the material, but the mean extinction values are also very different to both the eastern and western sides of the ring.
The same difference of the gas column density between the eastern and western sides of the ring can be seen in Fig. 3c of Park et al., (2007) that shows a NH map for and . In such map NH changes from on the western side to on the eastern side.
Wolleben, (2007) calls attention to the fact that the sky projection of his two overlapping synchroton shells, although resembling a ring-like structure, are in fact the result of two super-imposed H I shells that are expanding with different velocities.
Taken together these results suggest that either the ring is not a real entity or it is very fragmented and highly distorted.
8 Conclusions
In the reddening distribution analysis we have tried to identify the ring suggested by Egger & Aschenbach, (1995), since it would be the most prominent feature of the interaction region. The results can be summed up as follows:
-
•
Until 60 - 80 pc the colour excess remains below in all directions, being a typical value.
-
•
The expected transition to occurs on the western part of the ring about 110 20 pc, whereas on the eastern side it is not clearly seen before 280 50 pc.
-
•
In the northernmost area of the ring there seems to be a gradual increase from to around , while in the southernmost area the colour excess remains constant up to the maximum surveyed distance. However, a possible transition is observed at 200 20 pc towards the Mensa constellation in this region.
-
•
In the internal part of the ring the main features are defined by the dark clouds, clearly identified by . Our results corroborate their earlier distance determination, that is Lupus IV and Lupus V at pc; Lupus I and Oph-Sgr at pc; Aql-South, Sag-South and RCrA at pc; Coalsack pc; Chamaeleon and G317-4 at pc; Scutum with two main parts at pc and pc, respectively.
If the ring-like feature, as proposed by Egger & Aschenbach, (1995), really exists the colour excess distribution suggests that it is very fragmented and extremely distorted, once its western side reaches at pc and its eastern side at pc. However, the very different characteristics of the reddening inside and along the ring-like feature do not support the hypothesis of a ring.
Acknowledgements.
W. Reis and W.J.B. Corradi acknowledge support from the Brazilian Agencies CAPES and Fapemig (Grants No. EDT 1883/03 and CEX 961/04).References
- Asiain et al., (1999) Asiain R., Figueras F., Torra J., 1999, A&A 350, 434
- Breitschwerdt et al., (2000) Breitschwerdt D., Freyberg M.J., Egger R., 2000, A&A 361, 303
- Berghöfer & Breitschwerdt, (2002) Berghöfer T.W., Breitschwerdt D., 2002, A&A 390, 299
- Bochkarev, (1987) Bochkarev N.G., 1987, Ap&SS 138, 229
- Breitschwerdt & Avillez, (2006) Breitschwerdt D., Avillez M.A., 2006, A&A 452L, 1B
- Bruhweiler, (1996) Bruhweiler F.C., 1996, Bowyer S., Malina R.F. (eds.) Proc. IAU Colloq. 152, Astrophysics in the Extreme Ultraviolet. Kluwer, Dordrecht, p. 261
- Centurion & Vladilo, (1991) Centurion M., Vladilo G., 1991, ApJ 372, 494
- Corradi et al., (2004) Corradi W.J.B., Franco G.A.P., Knude J., 2004, MNRAS 347, 1065
- Cox & Anderson, (1982) Cox D.P., Anderson P.R., 1982, ApJ 253, 268
- Cox & Reynolds, (1987) Cox D.P., Reynolds R.J., 1987, ARA&A 25, 303
- Cox & Smith, (1974) Cox D.P., Smith B.W., 1974, ApJ 189, 109
- Cox & Snowden, (1986) Cox D.P., Snowden S.L., 1986, Advances in Space Research 6, 97
- Crawford, (1975) Crawford D.L., 1975, AJ 80, 955
- Crawford, (1978) Crawford D.L., 1978, AJ 83, 48
- Crawford, (1979) Crawford D.L., 1979, AJ 84, 1858
- de Geus, (1989) de Geus E.J., 1989, A&A 216, 44
- Edgar & Cox, (1993) Edgar R.J., Cox D.P., 1993, ApJ 413, 190
- Egger & Aschenbach, (1995) Egger R.J., Aschenbach B., 1995, A&A 294, L25
- ESA, (1997) ESA, 1997, The Hipparcos and Tycho Catalogues, ESA SP-1200. ESA Publications Division, Noordwijk
- Fitzpatrick & Massa, (2007) Fitzpatrick E.L., Massa D., 2007, ApJ 663, 320
- Franco, (2002) Franco G.A.P., 2002, MNRAS 331, 474
- Frisch, (1981) Frisch P.C., 1981, Nature 293, 377
- Frisch, (1995) Frisch P.C., 1995, SSRv 72, 499
- Frisch, (1998) Frisch P.C., 1998, LNP 506, 269
- Frisch, (2007) Frisch P.C., 2007, SSRv 130, 355
- Frisch & York, (1983) Frisch P.C., York D.G., 1983, ApJ 271, 59
- Frisch & York, (1986) Frisch P.C., York D.G., 1986, In: Smoluchowski R., Bahcall J.N., Matthews M.S. ( eds.) The Galaxy and the Solar System. University of Arizona Press, Tucson, p. 83
- Fruscione, (1994) Fruscione A., Hawkins I., Jelinsky P., Wiercigroch A., 1994, ApJS 94, 127
- Fuchs et al., (2006) Fuchs B., Breitschwerdt D., Avillez M.A., Dettbarn C., Flynn C., 2006, MNRAS 373, 993
- Hauck & Mermilliod, (1998) Hauck B., Mermilliod M., 1998, A&AS 129, 431
- Iwan, (1980) Iwan D., 1980, ApJ 239, 316
- Kaltcheva & Knude, (1998) Kaltcheva N., Knude J., 1998, A&A 337, 178
- Knude, (1978) Knude J., 1978, A&AS 33, 347
- (34) Knude J., 1978, In: Reiz A., Andersen J. (eds.) Astronomical Papers dedicated to B. Strömgren. Copenhagen Univ. Obs., Copenhagen, p. 273
- Knude, (1987) Knude J., 1987, A&A 171, 289
- Knude & Hog, (1998) Knude J., Hog E., 1998, A&A 338, 897
- Lallement et al., (2003) Lallement R., Welsh B.Y., Vergely J.L., Crifo F., Sfeir D., 2003, A&A 411, 447
- Lépine & Sartori, (2003) Lépine J.R.D., Sartori M.J., 2003, ASSL 299, 63
- Leroy, (1999) Leroy J.L., 1999, A&A 346, 955
- Maíz-Apellániz, (2001) Maíz-Apellániz J., 2001, ApJ 560, 83
- Mebold et al., (1998) Mebold U., Kerp J., Kalberla P.M.W., 1998, LNP 506,199
- Olsen, (1979) Olsen E.H., 1979, A&AS 37, 367
- Olsen, (1988) Olsen E.H., 1988, A&A 189, 173
- Paresce, (1984) Paresce F., 1984, AJ 89, 1022
- Park et al., (2007) Park J.W., Min K.W., Seon K.L., et al., 2007, ApJ 665, L39
- Penprase et al., (1998) Penprase B.E., Lauer J., Aufrecht J. et al., 1998, ApJ 492, 617
- Perry & Johnston, (1982) Perry C.L., Johnston L., 1982, ApJS 50, 451
- Sfeir et al., (1999) Sfeir D.M., Lallement R., Crifo F., et al., 1999, A&A 346, 785
- Smith & Cox, (1998) Smith R.K., Cox D.P., 1998, LNP 506, 133
- Smith & Cox, (2001) Smith R.K., Cox D.P., 2001, ApJS 134, 283
- Snowden et al., (1990) Snowden S.L., Cox D.P., McCammon D., et al., 1990, ApJ 354, 211
- Tobin, (1985) Tobin W., 1985, A&A 142, 189
- Warwick et al., (1993) Warwick R.S., Barber C.R., Hodgkin S.T., Pye J.P., 1993, MNRAS 262, 289
- Weaver, (1979) Weaver H., 1979, In: Burton W.B. (ed.) Proc. IAU Symp. 84, Large-Scale Characteristics of the Galaxy. Reidel, Dordrecht, p. 295
- Welsh & Lallement, (2005) Welsh B.Y., Lallement R., 2005, A&A 436, 615
- Wolleben, (2007) Wolleben M., 2007, ApJ 664, 349