The Path to Buried Treasure: Paving the Way to the FLAMINGOS-2 Galactic Center Survey with IR and X-ray Observations
Abstract
I describe the IR and X-ray campaign we have undertaken to determine the nature of the faint discrete X-ray source population discovered by Chandra in the Galactic Center. These results will provide the input to the FLAMINGOS-2 Galactic Center Survey (F2GCS). With FLAMINGOS-2’s multi-object IR spectrograph we will obtain 1000s of IR spectra of candidate X-ray source counterparts, allowing us to efficiently identify the nature of these sources, and thus dramatically increase the number of known X-ray binaries and CVs in the Milky Way.
Dept. of Astronomy, University of Florida, Gainesville, FL 32611
Dept. of Astrophysics, University of Oxford, Oxford OX1 3RH, UK
California Institute of Technology, Pasadena, CA 91125
1. Introduction
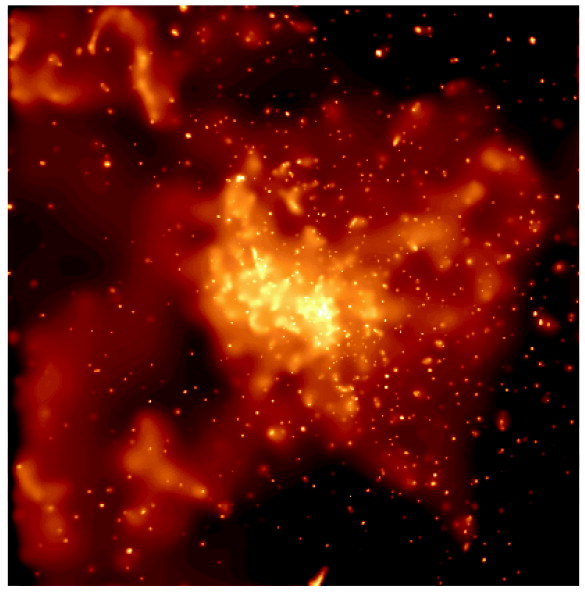
The unprecedented sensitivity and angular resolution of Chandra has been utilized by Wang et al. (2002; hereafter W02) and Muno et al. (2003; hereafter M03) to investigate the X-ray source population of the Galactic Center (GC). The W02 ACIS-I survey of the central 0.82of the GC revealed a large population of previously undiscovered discrete weak sources with X-ray luminosities of erg s-1. M03 imaged the central 40 pc2 (at 8 kpc) around Sgr A* (Fig. 1a), finding an additional 2300 discrete point sources down to a limiting flux of erg/s. Some individual sources have been identified as X-ray transients, high-mass stars, LMXBs, and CVs. However, the nature of the majority of these newly detected sources is as yet unknown.
We have undertaken an IR and X-ray observational campaign to determine the nature of the faint discrete X-ray source population discovered by Chandra in the GC. Data obtained to date includes a deep Chandra survey of the Nuclear Bulge; deep, high resolution IR imaging from VLT/ISAAC, CTIO/ISPI, and the UKIDSS Galactic Plane Survey; and IR spectroscopy from VLT/ISAAC and IRTF/SpeX. By cross-correlating the X-ray imaging with our IR surveys, we initially identify candidate counterparts to the X-ray sources via astrometry. Using a detailed IR extinction map, we are deriving magnitudes and colours for all the candidates. Having thus established a target list, we will use the multi-object IR spectrograph FLAMINGOS-2 on Gemini South to carry out a spectroscopic survey of the candidates, to search for the emission lines which are a hallmark of accreting binaries. By determining the nature of these sources, this FLAMINGOS-2 Galactic Center Survey will have a dramatic impact on our knowledge of the Galactic accreting binary population.
2. X-ray/IR Cross-Correlation
We have cross-correlated the source catalog derived from the W02 Chandra survey with images of 26 selected 2.5′′2 regions obtained with ISAAC on the VLT to identify candidate IR counterparts to the X-ray sources (Bandyopadhyay et al. 2005). IR spectroscopy to search for accretion signatures will be required for definitive identifications. Using this technique, we were able to conclusively identify the IR counterpart to “Edd-1”, one of these newly discovered low-luminosity X-ray sources (Mikles et al. 2006).
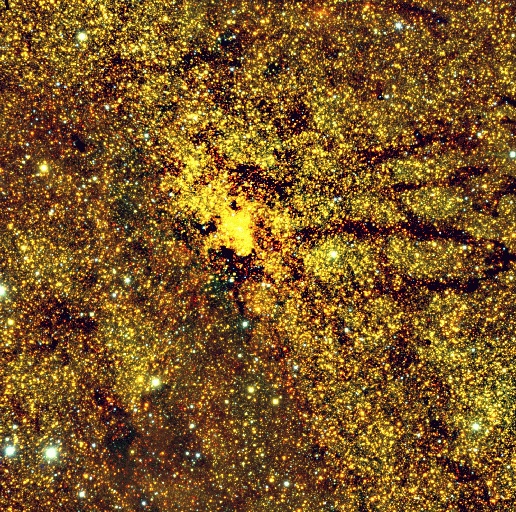
Cross-correlation of our CTIO ISPI image (Fig. 1b) of the central 10 pc2 of the GC with the deep Sgr A* image of M03 is underway; this will produce a large number of IR candidate counterparts to the X-ray sources. Due to the extremely high stellar density in the Nuclear Bulge, many of these astrometric “matches” are likely to be chance superpositions. With thousands of candidate counterparts, traditional long-slit single-target spectroscopy would be a prohibitively inefficient method by which to identify true counterparts. Thus we will need to follow-up with multi-object IR spectroscopy to find the true matches: this is the work which will be performed with the FLAMINGOS-2 Galactic Center Survey (F2GCS).


3. Extinction
We find that the IR extinction in the GC can vary on scales as small as 5′′ (0.2-0.6 pc at 8 kpc; Gosling et al. (2006)). Some areas show little evidence of this “granularity”, while others are highly structured. To obtain reddening-corrected stellar photometry, a local value for the extinction (on scales ) must be measured and applied. The relationship of extinction to wavelength in the IR is a power law with slope (Martin & Whittet 1990). The “canonical” value for is 2 (e.g. Rieke & Lebofsky (1985); Nishiyama et al. (2006)). In contrast, for the GC we find a mean value of ; and furthermore, along any given line of sight to the GC varies substantially, ranging from 1.8–3.6 (Gosling et al. 2008). Thus we find that the “universal” IR extinction law is not universal in the GC!
4. Combining UKIDSS and Chandra


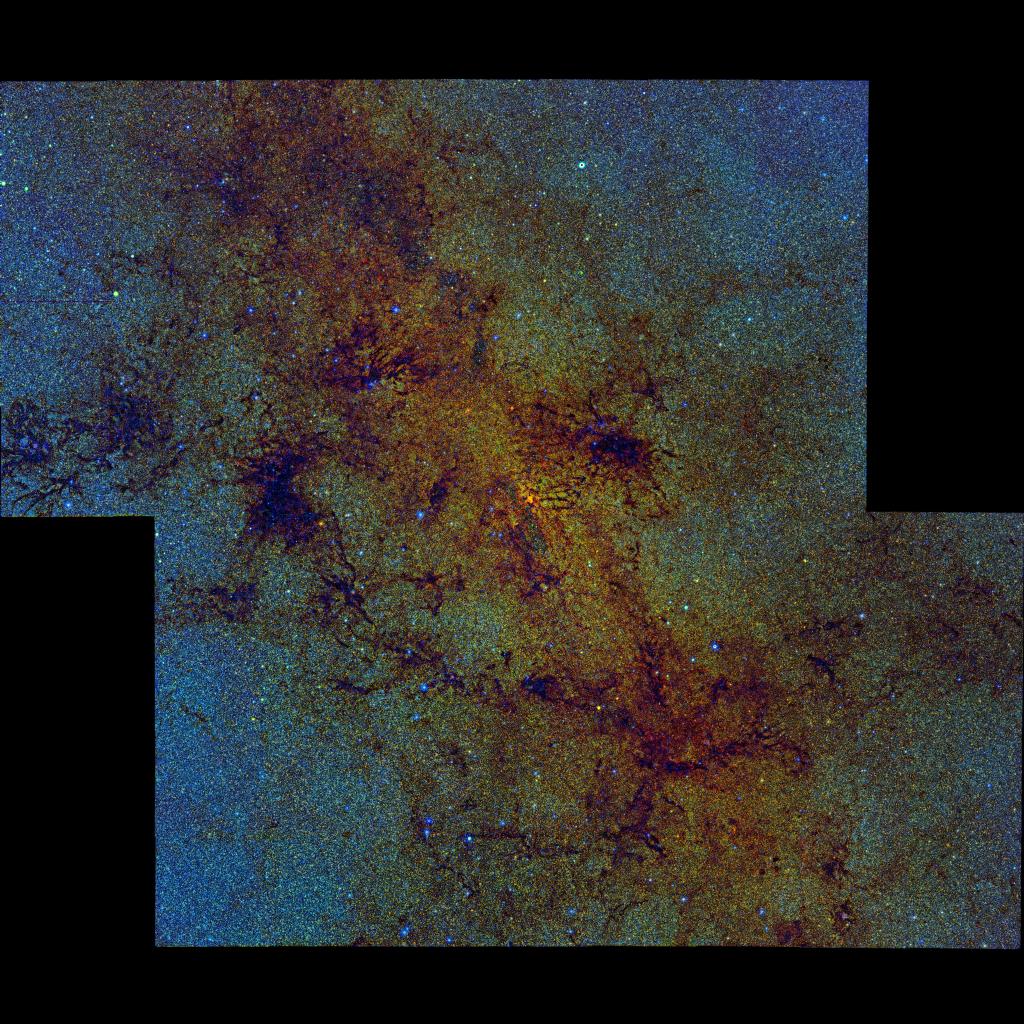
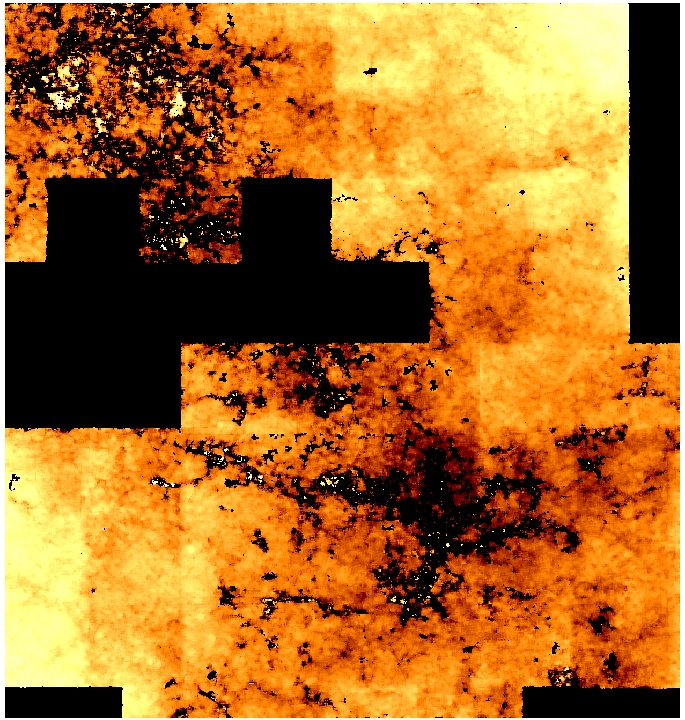
The United Kingdom Infrared Deep Sky Survey (UKIDSS) is an imaging survey covering 75002 of the northern sky using a wide-field IR camera (WFCAM) on UKIRT. The Galactic Plane Survey (GPS) component of UKIDSS covers the Nuclear Bulge (-215, 2) to a depth of 18 with a resolution of 0.8′′ (Lucas et al. 2007). We have obtained an additional 600 ksec of Chandra observations of the central degree of the GC; cross-correlation of the resultant X-ray source catalog, combined with the earlier W02 and M03 datasets, with the UKIDSS GPS imaging of the GC (Fig. 2a) will provide additional targets for the F2GCS. With the UKIDSS GPS data we can also map the 1-2 m “granularity” in the GC (Fig. 2b) and compare it to the Spitzer map of the same region (Stolovy et al. 2006), to search for correlations in the dust and gas structure.
References
- Bandyopadhyay et al. (2005) Bandyopadhyay, R.M., et al., 2005, MNRAS 364, 1195
- Gosling et al. (2006) Gosling, A.J., Blundell, K.M., & Bandyopadhyay, R.M., 2006, ApJ 640L, 171
- Gosling et al. (2008) Gosling, A.J., Bandyopadhyay, R.M., & Blundell, K.M., 2008, MNRAS, in prep
- Lucas et al. (2007) Lucas, P.W., et al., 2007, MNRAS, submitted
- Martin & Whittet (1990) Martin, P.G. & Whittet, D.C.B., 1990, ApJ 357, 113
- Mikles et al. (2006) Mikles, V.M., et al., 2006, ApJ 651, 408
- Nishiyama et al. (2006) Nishiyama, S., et al., 2006, ApJ 638, 839
- Muno et al. (2003) Muno, M.P., et al., 2003, ApJ 589, 225
- Rieke & Lebofsky (1985) Rieke, G.H. & Lebofsky, M.J., 1985, ApJ 288, 618
- Stolovy et al. (2006) Stolovy, S., et al., 2006, JPhCS 54, 176
- Wang et al. (2002) Wang, Q.D., Gotthelf, E.V., & Lang, C.C., 2002, Nature 415, 148