Molecular tracers of high mass star-formation in external galaxies
Abstract
Hot core molecules should be detectable in external active galaxies out to high redshift. We present here a detailed study of the chemistry of star-forming regions under physical conditions that differ significantly from those likely to be appropriate in the Milky Way Galaxy. We examine, in particular, the trends in molecular abundances as a function of time with respect to changes in the relevant physical parameters. These parameters include metallicity, dust:gas mass ratio, the H2 formation rate, relative initial elemental abundances, the cosmic ray ionization rate, and the temperature of hot cores. These trends indicate how different tracers provide information on the physical conditions and on evolutionary age. We identify hot core tracers for several observed galaxies that are considered to represent spirals, active galaxies, low-metallicity galaxies, and high-redshift galaxies. Even in low-metallicity examples, many potential molecular tracers should be present at levels high enough to allow unresolved detection of active galaxies at high redshift containing large numbers of hot cores.
1 Introduction
Hot cores are commonly observed in regions of massive star formation in the Galaxy, through their molecular line emissions. These hot cores correspond to a relatively small, dense, warm zone of gas surrounding a newly-formed star. They show a characteristic chemistry, distinct from that of molecular clouds in more quiescent regions of the interstellar medium (Walmsley & Schilke, 1993). Hot cores are rich in relatively large organic molecules, some are products of surface chemistry. This characteristic chemistry is generally attributed to a prolonged evolution of the gas and dust at very low temperatures, high densities, and large visual extinctions, and it is therefore inferred that the hot cores represent a sample of material from the pre-stellar gas that was not incorporated into the newly-formed star (Walmsley & Schilke, 1993).
While stellar spectra give information on local elemental abundances after star formation has occurred, molecular line intensities from hot cores can - with the use of an appropriate hot core model - give information on the local elemental abundances before star formation occurred. Such an opportunity may be particularly useful in external galaxies where the metallicity and other physical parameters may be considerably different from those in the Milky Way Galaxy. Hence, Lintott et al. (2005) suggested that hot cores could be used as probes of high redshift galaxies in which the rate of star formation and the hot core population are much larger than in the Milky way Galaxy. Ideally, one would be able to distinguish between different models of stellar evolution for the yields of metallicity from zero-metallicity stars. Lintott et al. (2005) showed that if hot cores in a high redshift galaxy were sufficiently numerous, then molecular line emission from a large population of unresolved hot cores in high redshift galaxies should be detectable. However, there exist at present no models of the chemistry of hot cores in the physical conditions likely to pertain in high redshift galaxies.
Therefore, our intention in this work is to calculate the expected chemistry arising in hot cores in galaxies which have a wide range of physical conditions that may be substantially different to those found in the Milky Way Galaxy. The physical parameters that significantly affect the chemistry include gas density and temperature, metallicity, dust : gas ratio, cosmic ray flux and its ionization rate, interstellar radiation field, etc. Of course, hot cores are only one component giving rise to molecular line emission in external galaxies. Other sources of molecular line emission are photon dominated regions (PDRs) and cool molecular clouds (see, e.g. García-Burillo et al. 2006, 2007). However, hot cores have a characteristic chemistry which should give rise to a particular line emission signature. We shall in future work examine the emission signature from other types of sources.
We use as the basis of our computations the hot core model of Viti & Williams (1999) which was developed for the description of hot cores in the Milky Way. In the present work we are particularly concerned with galaxies at high redshift in which frequent massive star formation and the most intense hot core molecular line emissions occur. The rise time of the stellar temperature from that of the cold gas to the Main Sequence is relatively short (Bernasconi & Maeder, 1996; Hanson, 1998) and, for present purposes, we shall regard this as instantaneous (unlike the treatment of Viti et al. 2004, in which the evolving chemistry of the hot core during the warm-up phase was explored). The model we use describes the physical and chemical evolution of the star-forming region during the long pre-stellar collapse and the consequences of the abrupt warming after the star is formed. This two-phase model is described in detail in Sect. 2.
We select a range of physical parameters intended to cover the range likely to be appropriate for external galaxies. The metallicity and the dust:gas mass ratio may differ substantially from the values of the Milky Way depending on galactic mass and starburst activity. The cosmic ray ionization rate is poorly constrained, though possibly related to the formation rate of massive stars, and so may be large in active galaxies. Therefore, we must choose a wide range for all the relevant parameters; our choice is described in Sect. 3. Hot cores in the Milky Way Galaxy are remarkable for the very high visual extinctions (typically hundreds of visual magnitudes) associated with them. In galaxies in which the dust:gas mass ratio is much smaller than in the Milky Way, the extinction associated with hot cores will be smaller. However, a minimum extinction is required for a hot core to exist, so this provides a constraint on the choices of density distribution and physical size of a model hot core.
Our computations describe the evolution of hot core chemistry, and we use them to explore the sensitivity of the molecular relative (to the total number of hydrogen atoms) abundances to the physical parameters adopted. Our results are presented in Sect. 4. Trends of the variation of hot core chemistry with changing physical parameters are identified in that Section, and these are the main results of this paper. In Sect. 5 we adopt a set of values of physical parameters that may be appropriate for several galaxy types, and we predict hot core tracers for these types. Section 6 gives a brief discussion and conclusion.
2 Model description
Hot core models have been developed by various authors to describe the evolution of chemical abundances of various species within a collapsing cloud during star formation. We use the hot core model developed at University College London (hereafter called the UCL hot core model; see Viti & Williams 1999; Viti et al. 2004). To summarize, this model is divided into two phases; the first describes the modified free-fall cloud collapse during which time-dependent gas phase chemistry occurs and is modified by the gas-grain interaction; it largely follows the formulation of Rawlings et al. (1992). The second phase describes the chemical evolution after the massive star switched on. The UCL hot core model contains a number of free parameters, and our choices are described in detail in Sect. 3. For these massive stars, the switch-over from phase 1 to phase 2 of the UCL hot core model is represented by an abrupt increase of the temperature (for gas and grains) from 10 K (in the collapse phase) to 300 K (in the hot core phase). In phase 2, grains and gas are assumed to be similarly heated and the icy mantles are evaporated. Chemical evolution in the gas phase continues, although the dynamical evolution is assumed to have ceased. In both phases of the UCL hot core model, the chemical network, is based on more than 1700 chemical reactions taken from the UMIST data base (Millar et al., 1997; Le Teuff et al., 2000) involving 176 species of which 42 are surface species. Obviously, all the molecules so far detected in galactic hot cores (e.g. Blake et al. 1987; Millar & Hatchell 1998; Hatchell et al. 1998; Fontani et al. 2007) have been included in this chemistry network together with all the important and familiar molecular species that are known from many other studies to play a significant role in the chemistry of interstellar gas. The relevant surface reactions included in this model are assumed to be only hydrogenation, allowing chemical saturation where this is possible. Note that the hot core chemistry necessarily includes species such as CO (not characteristic of hot cores), and molecules such as H2O and NH3 which are present in hot cores but undetectable. However, these hydrides do become detectable when deuteration to HDO and NH2D has occurred. We have not included deuteration (nor any other isotopologues) in the chemistry, in order to limit the size of the chemical network. Therefore, in the discussion of results we shall exclude water and ammonia, even though it seems clear that these deuterated molecules should be detectable. Deuterated species will be considered in later paper. Hydrogenation of carbon monoxide on surfaces to methanol is also included. The efficiency we have adopted for this reaction is chosen so that, for Milky Way parameters, the observed fraction of CH3OH is obtained. The rate coefficients in current chemical network imply that methanol must be formed in surface reactions.
Note that the results reported here are molecular abundances rather than emission intensities. The radiative transfer calculations to estimate intensities would require more detailed models of hot cores and their populations than is included in our model, and the intensities would be significantly model dependent. We do not feel that such computations are justified in this exploratory study.
3 Parameter choices
The parameter choices to be made in running the hot core model are listed in Table 2 together with the values assigned to these parameters when representing typical hot cores in the Milky Way (see Table 1). We have explored the response of hot chemistry mainly to changes in metallicity (with and without consequent changes in the dust:gas mass ratio and H2 formation rate coefficient), in cosmic ray ionization rate, in hot core temperature, in elemental relative abundances, and - since sulfur-bearing species can be important tracers in Milky Way hot cores - in independent variations in the sulfur abundances. We have run over 60 hot core models, but present here results from 19 computations; the parameter choices made for these 19 calculations are summarized in Table 2. This table shows that we have explored the consequences of reducing solar metallicity by factors of up to 103, and independently of reducing the gas:dust ratio and the H2 formation rate coefficient by similar factors. We have also explored the effect of replacing the solar metallicity by values predicted by early Universe models, or of reducing the S/H ratio by a factor of 102. We have considered the consequences on hot core chemistry of raising the cosmic ray ionization rate by an order of magnitude, and of increasing the hot core temperature from 300 K to 500 K. We have considered the consequences of some multiple parameters changes. Where not stated, parameters values from Model 0 (representing hot cores in the Milky Way) are used. Note that for all 19 computations, (initial density), (final density), (cloud temperature) and (UV radiation field intensity) adopt the Model 0 values shown in Table 1. There is one proviso to note about these parameter choices. For a hot core to form, the visual extinction associated with it must be sufficiently optically thick at far-UV wavelengths, so that stellar UV is trapped, warms the core and causes the ices formed during the collapse phase to desorb. For Model 13 (which assumes a very low dust:gas mass ratio) it is unclear as to whether this criterion is met. If the physical dimension of the hot core is comparable to those in the Milky Way ( 0.03 pc) then the visual extinction for Model 13 would be about 2.6 mag, equivalent to about 8 mag in the far-UV if the dust grains have similar optical properties to those in the Milky Way.
4 Sensitivity of chemical abundances to variations in the physical and chemical parameters
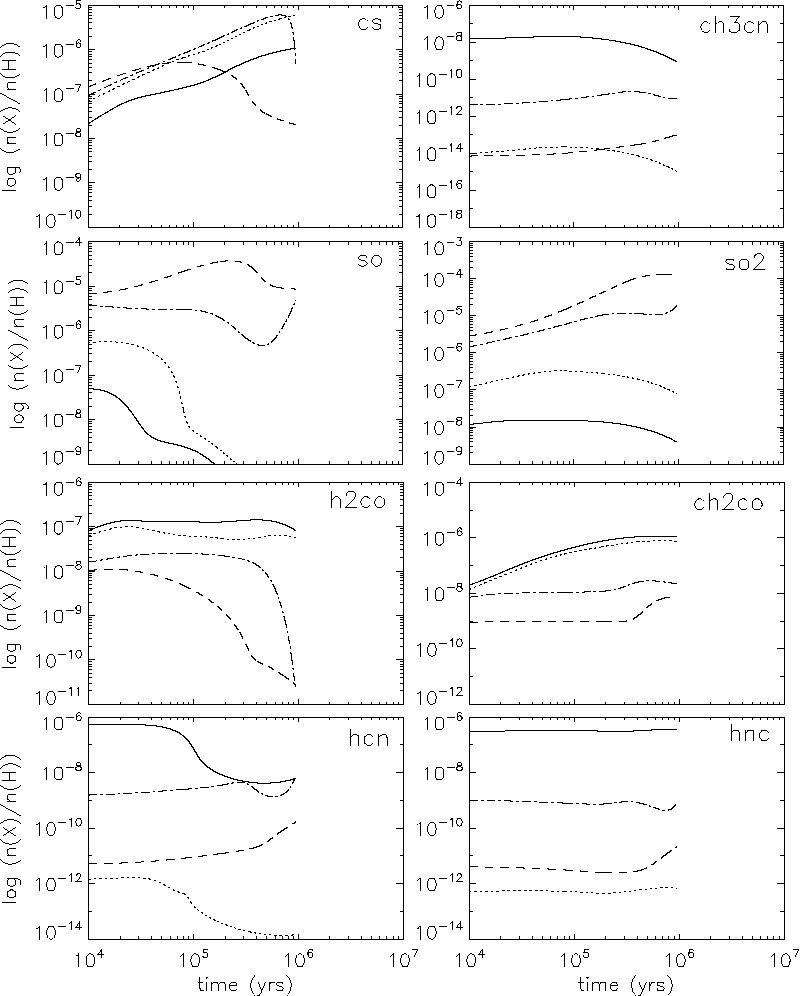
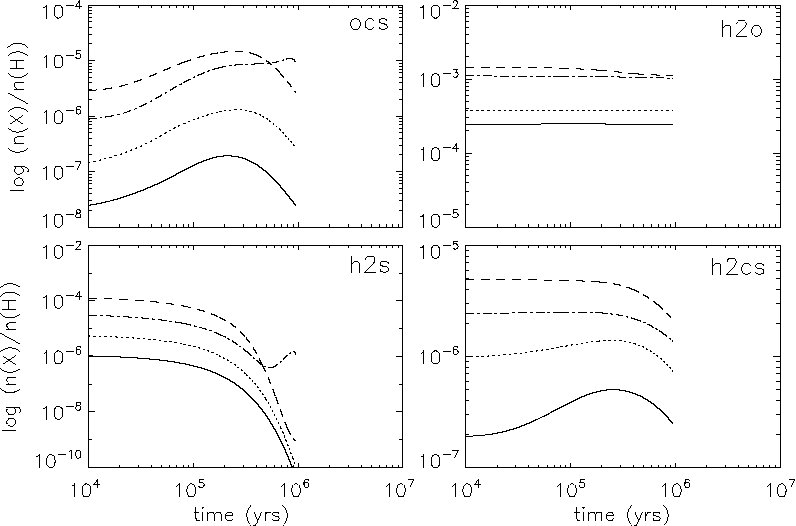
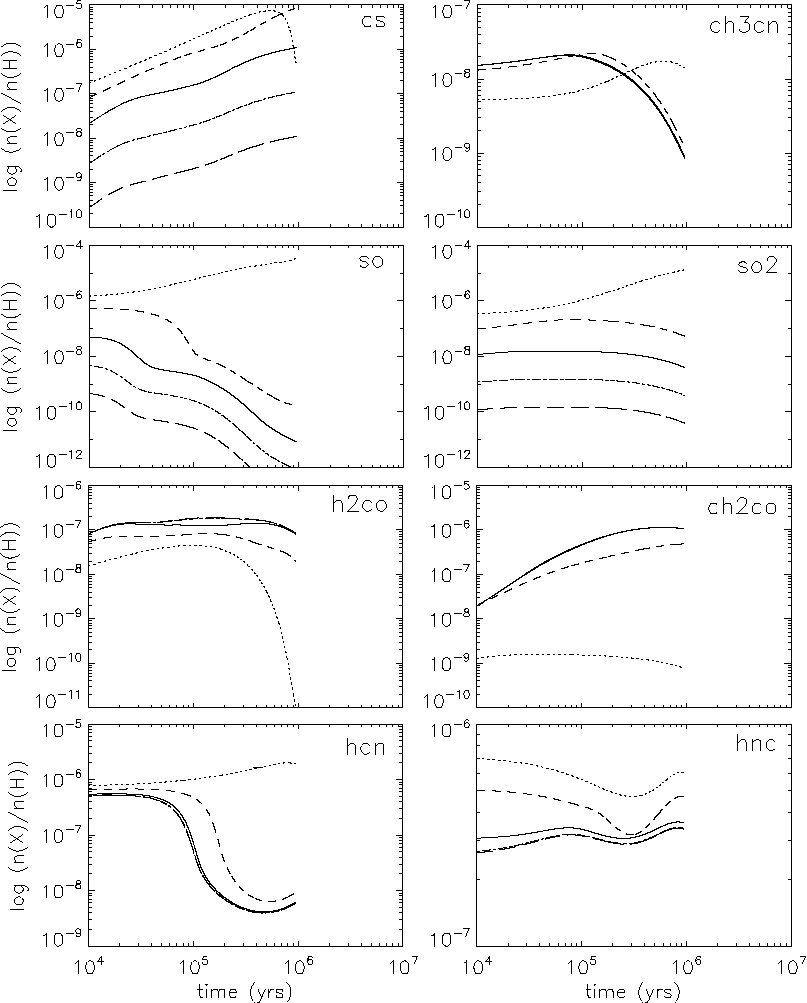
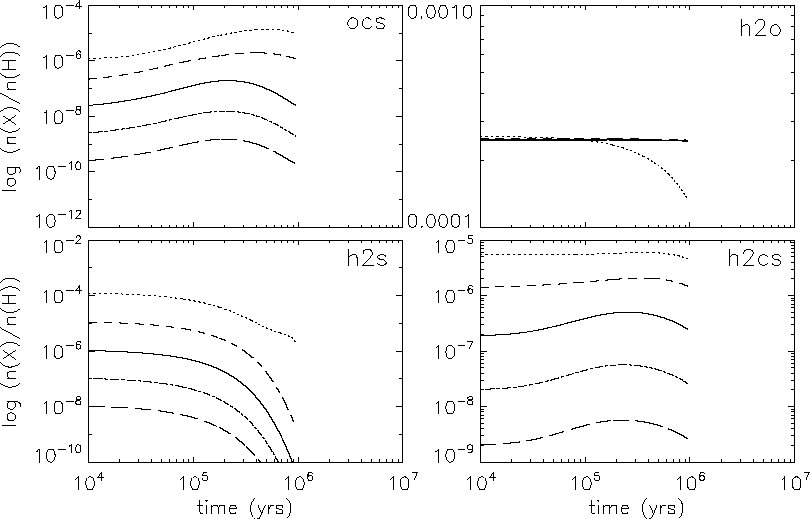
The main aim of this work is to study the sensitivity of chemical abundances in models of massive star formation to variations in physical and chemical parameters which may be characteristic of galaxies at different redshifts. A collection of detectable tracers of extragalactic hot cores will be given in Subsect. 4.5 but first we simply analyze the trends that the chemistry follows as each parameter was varied. Figures 1 to 8 show examples of the most interesting changes while Tables 5, 6, 7 and 8 summarize the temporal trends of fractional abundances with variation in metallicity, in cosmic ray ionization rate, and in initial elemental abundances. In the following discussion, we rather arbitrarily assume that molecules with fractional abundances less than about 10-12 are probably undetectable, a criterion that is roughly satisfied in the Milky Way.
4.1 Sensitivity to variations in metallicity
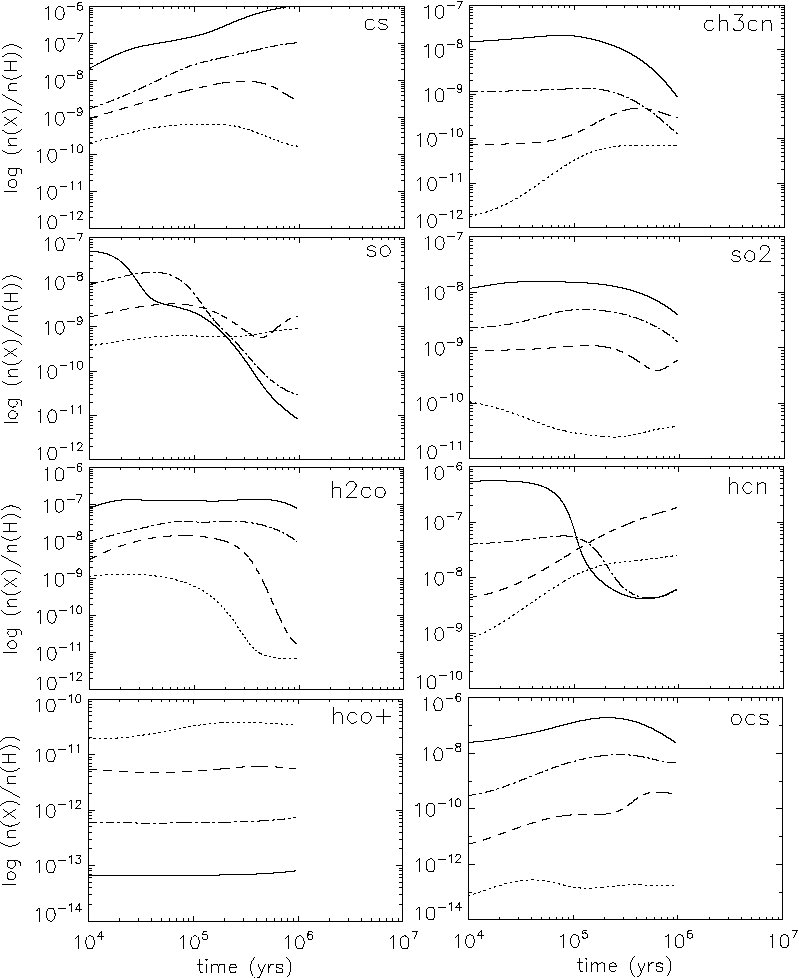
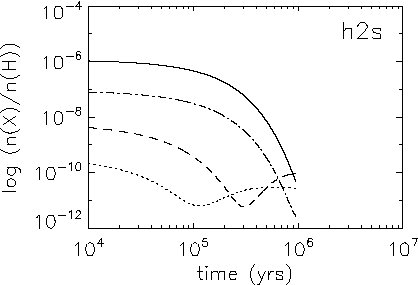
Models where changes in metallicity alone (Models 0 to 3 in Table 2) as well as (more realistically) changes in metallicity coupled with other parameters (Models 11 to 13 in Table 2) have been investigated. The first set of models were run in order to isolate the effects due solely to metallicity changes (see Figs. 1, 2 and Tables 5, 6).
Reducing metallicity leads to no great surprises for most species in that their abundance is simply reduced accordingly; however, one notes that as the metallicity is reduced to 1% of solar the fractional abundances of some species such as CS tend to decrease with time (with the released atomic sulfur going into SO); while for the solar case and 1/10th of the solar it continues to increase with time.
However, some species do not seem as sensitive to metallicity changes: for example, the fractional abundances of CH3CN for different metallicities tend to converge after 105 yrs, making this species rather insensitive to metallicity and therefore (potentially) a good tracer of hot cores at high redshift. This ‘convergence’ is due to a faster destruction (due to cosmic rays) at high metallicities (where more ions are present). SO and H2S also tend to converge. However, SO conversion into SO2 by cosmic ray-induced reactions is inevitably slowed down at low metallicity, so that SO may be more abundant at late times for lower metallicity than solar.
A good discriminator of metallicity is H2CO. Its abundance varies proportionally to metallicity as metallicity is reduced from solar values, and then drops below detectable values for metallicities less than 1/100th of solar. Another interesting species is HCN whose fractional abundance is directly proportional to metallicity up to 105 yrs but then this behavior is reversed, i.e. its abundance becomes larger at lower metallicity. This is probably due to an increase in ionization for lower metallicity, as can be seen from the behavior of HCO+. The latter, not usually a hot core tracer, is in fact probably only detectable at very low ( 0.1% of solar) metallicity.
Perhaps more significant may be the trends among models where the metallicity variations are also applied directly to the dust:gas mass ratio and the H2 formation rate. However, we find that most chemical abundances behave as in the simpler models where only metallicity varies (see Tables 5 and 6). It is worth noting that OCS and SO2 abundances are fairly insensitive to metallicity changes and are good tracers of hot cores provided the metallicity does not drop below about 1% of solar.
4.2 Sensitivity to variations in the cosmic ray ionization rate
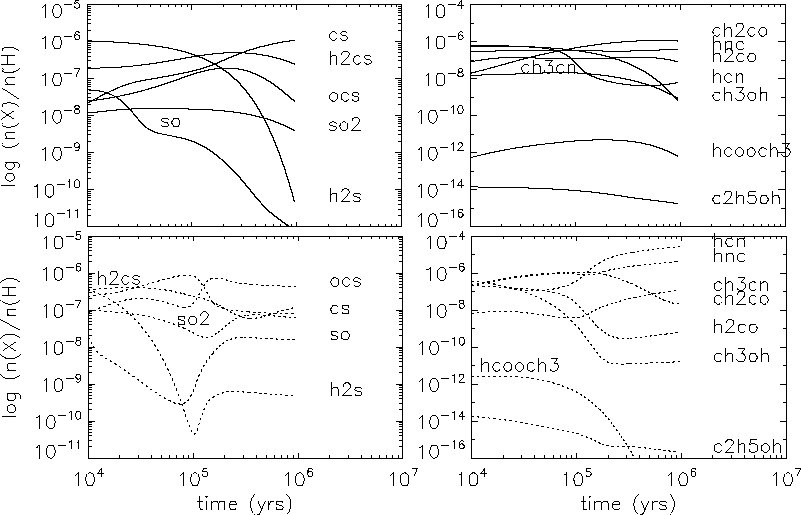
The following results concern Models 0 and 14 (defined in Table 2). Our results are shown in Fig 3 and summarized in Table 7. The effects of increasing the cosmic ray ionization rate are complex and in general lead to a chemistry that approaches steady-state more quickly (see Fig. 3). For the sulfur-bearing species, a higher implies a faster destruction of CS and hence a faster increase in the abundances of its daughters species such as SO, SO2 and OCS. Nitrogen-bearing species such as HCN and CH3CN increase with while oxygen bearing species such as CH3OH, H2CO and CH2CO decrease. Some species, such as water and CO, are not significantly affected by the larger ionization rate, since conversion to these species by both surface and gas-phase chemistries is complete in Phase 1. It is interesting to note how oxygen and nitrogen bearing species are anti-correlated as a function of , probably due to the high abundance of ionized carbon in the case with higher ionization rate, and this reacts quickly with many oxygen-bearing species. The main reservoir of nitrogen is N2 which, when ionized, gives N+, a reactive species that promotes the formation of nitrogen-bearing molecules.
4.3 Sensitivity to variations in temperature
We ran two models in which the hot core temperature, T2, was increased from 300 K to 500 K (Models 15, with solar metallicity, and Model 16 with 1/10th of solar metallicity). In order to isolate the temperature variations effects, we first compare two solar metallicity models where only the temperature is varied (see the top two plots of the Fig. 4). As expected, several species are affected by an increase in hot core temperature: H2S, HCN and CH3CN all survive for much longer making them good tracers of temperature. CH2CO abundance, on the other hand, is 2 orders of magnitude lower in the high temperature case: this is due to its destruction by cosmic ray induced photo-dissociation which has a significant temperature dependence.
At lower metallicity (see the bottom plot of the Fig. 4), it is interesting to note that H2S remains high despite the lower abundance of metals and in fact it is the most abundant sulfur-bearing species up until 106 years when CS becomes comparable: hence, for a higher temperature and low metallicity hot core H2S remains a good tracer.
4.4 Sensitivity to variations in initial elemental abundances
The initial elemental abundances (i.e. before star formation occurs) of galaxies at high redshifts are by no means well-known. We therefore consider briefly the sensitivity of molecular abundances in the hot core phase to variations in the initial abundance of the main elements (see Models 4 to 10 in the Table 2). We consider the consequences of adopting the elemental abundances arising from stellar evolution models in initially zero metallicity gas, as proposed by Chieffi & Limongi (2002); Heger & Woosley (2002); Umeda & Nomoto (2002) (see Table 3). We have also investigated the effect of varying independently the initial sulfur abundance. The results for this section are shown in Figs. 5, 6, 7 and 8 and summarized in Table 8.
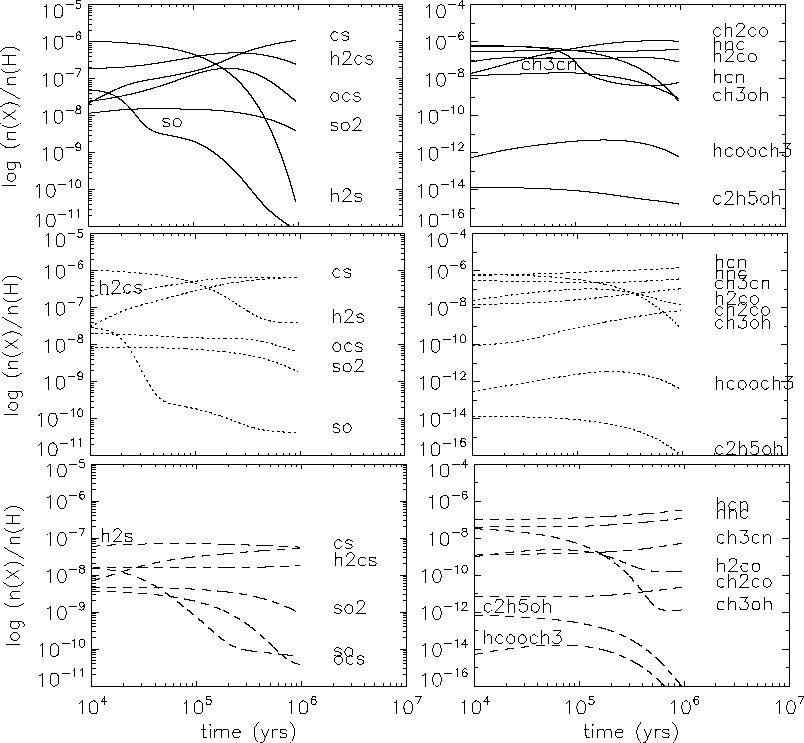
Beside the expected changes in absolute abundances (e.g. H2O abundance increases for oxygen-rich models), the most striking variations are, not surprisingly, shown by sulfur-bearing species, in particular (see Figs. 5 and 6) : while for most models CS remains abundant for the (canonical) lifetime of the core, in the HW02 model it decreases steeply (with atomic sulfur going into SO and SO2) after 104 yrs. This suggests that in an oxygen-rich and sulfur-rich environment CS would not be a good tracer of massive star-forming regions while SO, and in particular, SO2 would be enhanced with respect to galactic hot cores. The chemical evolution of OCS follows the same trend to late times ( 106 yrs) for all initial abundances, but its abundance is directly proportional to the amount of sulfur initially available so it could be a good indicator of the initial cosmic sulfur abundance. The same behavior is found for CH3CN which follows the nitrogen abundance so, if the nitrogen-deficient models of Table 3 are correct, this molecule is unlikely to be detectable in high redshift hot cores. The sulfur bearing species SO and H2S actually increase in abundance after 106 yrs for Model 6. This is an oxygen-rich model where sulfur is close to solar. Finally, although largely insensitive to variations of the initial elemental abundances, H2CS is nevertheless always quite abundant and may therefore be used as a tracer of hot cores regardless of the chemical composition of the galaxy in question.
Of other species, H2CO, HCN and HNC are of particular interest. The H2CO abundance is fairly flat in its time evolution for oxygen-rich models, at least up to 106yrs, unless the oxygen abundance is very high (as in Model 15). In that case, the H2CO abundance falls steadily between 105yrs and 106yrs. HCN decreases with time for oxygen-rich models, while it increases for oxygen-poor models, as HCN is directly destroyed by atomic oxygen.
In galactic star-forming regions, the sulfur initial elemental abundance is a particularly poorly-determined parameter (Ruffle et al., 1999; Wakelam et al., 2004) and yet sulfur-bearing species are often used as ’chemical clocks’. The main conclusion of varying solely the initial sulfur abundance by 4 orders of magnitude below solar (Models 7 to 10 in the Table 2; the results are shown in Figs. 7 and 8, with summary comments in Table 8) is that non sulfur-bearing species are only sensitive to the initial sulfur abundance if the latter is comparable to carbon. So, for example, CH3CN and HCN do not decline as fast when the initial abundances of carbon and sulfur are comparable, remaining abundant enough to be detected even at late times, while the opposite is true for H2CO which declines after 105 yrs and for CH2CO which never achieves high abundances in Model 0. Sulfur-bearing species are of course heavily affected by the initial abundance of sulfur in a fairly predictable way, but it is worth noticing that SO and SO2 increase with time for the solar case (Model 0) while they decrease in every other model. This may imply that, although commonly considered as robust ”chemical clocks”, sulfur-bearing species may only be useful in this respect for star-forming regions closely resembling those in the Milky Way Galaxy.
4.5 Tracers of extragalactic hot cores
Tables 5, 6, 7 and 8 show that most of the molecules familiar from studies of hot cores in the Milky Way Galaxy are also likely to have significant abundances in hot cores in external active galaxies, even though the physical and chemical conditions in those galaxies may be very different from those in the Milky Way. We have identified in those tables molecules that should trace in hot cores in external galaxies the local metallicity, cosmic ray ionization rate, hot core temperature and relative elemental abundances. The molecules are CS, OCS, CH3CN, CH3OH, SO, SO2, H2S, H2CS, H2CO, CH2CO, HCN and HNC. Ethanol and methyl formate are also known as hot core molecules in the Milky Way Galaxy. However, according to our hot core models, they appear to be generally of rather low abundance in external galaxies. It is however possible that our models do not account adequately for the formation (by surface chemistry) of these two species under conditions appropriate for external galaxies.
For galaxies with metallicities lower than or comparable to that of the Milky Way, the molecules with highest abundances (and therefore likely to be useful hot core tracers) include CS, SO2, CH2CO and HNC. For metallicities that are at least 1% of that of the Milky Way, the following molecules are also be likely to be useful hot core tracers : OCS, H2CS and H2CO. The molecule SO can also be abundant, but tends to be an intermediate species in the formation of SO2 during the hot core lifetime. We have already noted the convergence of the abundance of CH3CN to a value that is rather insensitive to the metallicity; this value is rather low ( 10-10) but still significant.
For galaxies with enhanced cosmic ray fluxes but otherwise similar parameters to those of the Milky Way, the most abundant species are likely to be OCS, H2CS, CS and SO2; these molecules between them contain most of the available sulfur. Likewise, HCN, HNC and CH3CN contain large amounts of the available nitrogen. CH2CO and H2CO have large abundances that are enhanced when the cosmic ray flux is raised.
When the temperature of the hot cores is raised, the ratio of the abundances of HCN and HNC approaches unity.
It is interesting to note that even when the initial elemental abundances are those arising from the first generation of stars, hot core molecular abundances can be high. Model 4 shows that both CH2CO and H2CO should be prominent tracers.
5 Selected galaxies and predicted hot core tracers
In this section, we select several fairly well observed galaxies, representative of different morphological types, that may be reasonably compared with some of the model galaxies listed in Table 2. Our aim is to identify the predicted tracers of hot cores in these galaxies.
We identify Model 0 as a potentially good representative normal spiral. The metallicity of IC 342 is estimated to be 1.07 z⊙ (using 12+log(O/H) = 9.30 from Vila-Costas & Edmunds 1992; Garnett 1998) while for NGC 4736 we have 1.04 z⊙ (using 12+log(O/H) = 9.01 from Zaritsky et al. 1994). In addition, these two galaxies do not show any bursts of star formation, suggesting that a radiation field comparable to that of the Milky Way as well as a hot core temperature of 300 K may be appropriate for them. They do not contain any additional source of energy such as, for instance, an AGN which could be responsible to an enhancement of the cosmic ray ionization rate value. All these physical parameter values suggest that Model 0 may be a good representative for these two galaxies.
A second interesting case is Model 15 having solar metallicity, a standard radiation field, hot core temperature of 500 K and normal cosmic ray ionization rate. It could be an appropriate model for starburst galaxies such as M 83 (metallicity of 1.06 z⊙ derived from value in Zaritsky et al. 1994) since starburst environments are expected to show higher gas temperatures without necessarily any additional sources of energy justifying an enhancement of the cosmic ray ionization rate (except in the presence of an AGN which is suggested to be a potential source of high energy cosmic rays). Taking a standard value for the radiation field for this kind of source may not be appropriate but, as the metallicity is solar, the gas to dust mass ratio is 100, the final H2 number density is 1107 cm-3, the visual extinction associated with a hot core is 500-600 mag. Therefore, the radiation field has negligible influence on hot core tracers in such galaxy types.
Galaxies of the type of IC10 are also interesting to study. Garnett (1998) found a value of IC 10 metallicity z⊙. This source is usually considered as one of the closest starburst sources in the Universe even if IC 10 has been recently recognized as only marginally starburst (Hidalgo-Gámez, 2005). Adding the presence of numerous Wolf-Rayet stars in IC 10, we could however suppose a temperature higher than in quiet galaxy. Consequently, a model with a z= z⊙, temperature of hot core of 500 K, = 1 (no AGN) appears appropriate. As in the previous case, the radiation field is largely irrelevant to the hot core chemistry. We suggest IC10 could be represented by Model 17.
It would be interesting to identify a model for high redshift sources such as the Cloverleaf (redshift of z 2.6) or APM 08279 (z 3.9). For these sources, the physical properties are unknown. However, molecular detections already obtained (Gao & Solomon, 2004; Wu et al., 2005; Wagg et al., 2005) suggest that star formation may be active, even if these galaxies are affected by their AGNs. García-Burillo et al. (2006) have suggested that the unusual chemistry they have been observed may be due to a combination of star formation and AGN (PDR/XDR) chemistries. In an attempt to describe such sources, we adopt in Model 18 a high value of the hot core temperature, a high cosmic ray ionization rate, a high value of the radiation field intensity, and a relatively low metallicity (all with respect to the Milky Way).
Table 9 summarizes the typical molecular tracers of extragalactic hot cores which are detectable for these four kinds of sources, where the detectability limit is arbitrarily taken to be equivalent to a fractional abundance of 1. Here our goal was to give to the reader some observational clues derived from this modelling work. The table indicates that these should be some differences in the appropriate tracers to use for each galaxy type. The overall trends (described in Sect. 4) of those tracers with physical parameters should enable a more detailed description of the galaxy to be made.
In the two lowest metallicity cases represented in Table 9 (i.e. Models 17 and 18) some of the relative abundances of potential tracers are surprisingly large. For example, Model 17 predicts that in IC10 CS, H2S, HCN and HNC should all have fractional abundances 10-8, while CH3CN is about one order of magnitude smaller. Model 18 predicts that HCN and HNC should have fractional abundances 10-7, CS 10-8, and H2CS and CH3CN both 10-9. According to the estimates of Lintott et al. (2005) these abundances are sufficiently large that unresolved active galaxies should be detectable in these species even at high redshift. Observational tests of prediction made in Table 9 will be described in a forthcoming paper. Recent observations of Arp220 (Aalto et al., 2002, 2007) find large abundances of some hot core tracers such as HC3N. It is yet not clear whether the chemistry is dominated by UV, X-rays or other physical processes. Model 1 or Model 16 may best represent this galaxy.
Gravitational lensing of star-forming regions in high z galaxies may significantly affect the molecular line intensities observed. However, relative line intensities should be preserved, and the hot core ‘signature’ should still be discernable.
6 Conclusion
We have computed the chemical abundances in hot cores with a wide range of physical parameters. In particular, we have discussed the sensitivity of molecular abundances to changes in metallicity, to the local cosmic ray ionization rate, to hot core temperature, and to the relative elemental abundances that may represent the cosmic composition within galaxies early in the evolution of the Universe. In all cases that we have examined there is a rich hot core chemistry, even when the metallicity is low. The fractional abundances of our predicted tracers are at a level that was shown by Lintott et al. (2005) to provide for an active galaxy (containing many hot cores) - even at high redshift - a detectable signal, though of course unresolved.
The chemical network within a hot core is complex, and not all species respond in the same way to changes in physical parameters. We find, for example, that some species trace linearly any changes in metallicity, while others may respond inversely to such changes. Many species are enhanced in abundance if the flux of cosmic rays is increased but other species are reduced in abundance.
We have created models of hot core chemistry that describe crudely several reasonably well-observed galaxies. We have predicted hot core tracers for these galaxy types. Detection of hot core species should - with the use of models such as those presented here - provide detailed descriptions of the physical conditions within active galaxies.
| Parameter | Symbol | Typical Milky |
| Way values | ||
| Free fall modifier | 0.1 | |
| Initial number density (phase 1) | 300 H cm-3 | |
| Final number density (phase 1 and 2) | 1 H cm-3 | |
| Temperature (phase 1) | 10 K | |
| Temperature (phase 2) | 300 K | |
| External UV radiation intensity | 1 Habing | |
| Cosmic ray ionization rate | 1.3 s-1 | |
| Visual extinction | 600 mag | |
| Gas:dust ratio | 100 | |
| H2 formation rate coefficient | 1.0 cm3s-1 | |
| Metallicity | z⊙ | solar values, see Table 2 |
| Model | Metallicitya | Gas-to-dust | Ini. Elem. | S/H | Temp. | Comb. | |
|---|---|---|---|---|---|---|---|
| (z⊙) | mass ratio | Abund. ratios | () | hot core (K) | parameters | ||
| 0 | 1 | 100 | ST | 1.410-6 | 1 | 300 | ST |
| 1 | 1/10 | 100 | ST/10 | 1.410-7 | 1 | 300 | ST |
| 2 | 1/100 | 100 | ST/100 | 1.410-8 | 1 | 300 | ST |
| 3 | 1/1000 | 100 | ST/1000 | 1.410-9 | 1 | 300 | ST |
| 4 | 1 | 100 | CL02 | 7.5910-6 | 1 | 300 | ST |
| 5 | 1 | 100 | HW02 | 1.5410-4 | 1 | 300 | ST |
| 6 | 1 | 100 | UN02 | 4.0610-5 | 1 | 300 | ST |
| 7 | 1 | 100 | ST | 1.410-4 | 1 | 300 | ST |
| 8 | 1 | 100 | ST | 1.410-5 | 1 | 300 | ST |
| 9 | 1 | 100 | ST | 1.410-7 | 1 | 300 | ST |
| 10 | 1 | 100 | ST | 1.410-8 | 1 | 300 | ST |
| 11 | 1/10 | 1000 | ST/10 | 1.410-7 | 1 | 300 | CB-A |
| 12 | 1/100 | 1104 | ST/100 | 1.410-8 | 1 | 300 | CB-B |
| 13 | 1/1000 | 1105 | ST/1000 | 1.410-9 | 1 | 300 | CB-C |
| 14 | 1 | 100 | ST | 1.410-6 | 10 | 300 | ST |
| 15 | 1 | 100 | ST | 1.410-6 | 1 | 500 | ST |
| 16 | 1/10 | 1000 | ST/10 | 1.410-7 | 1 | 500 | CB-A |
| 17 | 1/5 | 500 | ST/5 | 2.810-7 | 1 | 500 | CB-D |
| 18 | 1/25 | 2500 | ST/25 | 5.610-8 | 10 | 500 | CB-E |
a : z⊙ = 1 corresponds to solar values of the elemental abundances ratios; b : expressed in units of = 1.3 s-1.
| ST | CL02 | HW02 | UN02 | |
|---|---|---|---|---|
| C/H | 1.410-4 | 1.410-4 | 1.410-4 | 1.410-4 |
| O/H | 3.210-4 | 4.5410-4 | 1.5310-3 | 1.1810-3 |
| N/H | 6.510-5 | 5.9910-11 | 1.5810-9 | 3.2410-7 |
| He/H | 7.510-2 | 7.510-2 | 7.510-2 | 7.510-2 |
| Mg/H | 5.110-6 | 1.8310-5 | 1.210-4 | 6.1810-5 |
| ST | CB-A | CB-B | CB-C | CB-D | CB-E | |
| 581.1 | 59.9 | 7.8 | 2.6 | 117.8 | 25.2 | |
| (mag) | ||||||
| ratio of the number | ||||||
| densities of grains | 1.010-12 | 1.010-13 | 1.010-14 | 1.010-15 | 2.010-13 | 4.010-14 |
| to hydrogen nuclei | ||||||
| H2 form.a | 1.7310-16 | 1.7310-17 | 1.7310-18 | 1.7310-19 | 6.3210-18 | 1.2610-18 |
| rate coeff. |
a : The H2 formation rate coefficient is computed at the beginning of the phase 2 of the UCL hot core model and it is expressed in cm3s-1.
| Molecule | Response to metallicity changes |
|---|---|
| CO, H2O | good tracers of metallicity since flat |
| CS | good tracer of metallicity since grows strongly during phase 2 |
| OCS | undetectable at lowest metallicity, otherwise, a good metallicity tracer |
| CH3CN | tends to converge at late times in hot core epoch; |
| roughly independent of the metallicity | |
| CH3OH | good tracer of metallicity, but lost at late times |
| SO | converted at late time to SO2, most rapidly for high metallicity cases. |
| An inverse tracer of metallicity at late hot core epoch | |
| SO2 | detectable at all metallicities; a linear metallicity tracer |
| H2S | at early times a linear metallicity tracer; lost at late times |
| by chemical conversion | |
| H2CS | a strong indicator of metallicity, (metallicity)2 |
| H2CO | a linear indicator of metallicity |
| CH2CO | a linear indicator of metallicity |
| C2H5OH | undetectable |
| HCOOCH3 | undetectable |
| HNC | abundant, but poor metallicity tracer |
| HCN | abundant, but poor metallicity tracer; chemical conversion |
| at late times | |
| HCO+ | good inverse tracer of metallicity, highest for lowest metallicity; |
| undetectable for solar metallicity |
| Molecule | Response to changes in metallicity, dust:gas mass ratio, |
|---|---|
| and H2 formation rate coefficient | |
| CO, H2O | trends as in Table 5 |
| CS | trends as in Table 5 |
| OCS | undetectable at lowest metallicity, otherwise, less sensitive |
| to metallicity than in Table 5 | |
| CH3CN | fairly independent of metallicity |
| CH3OH | traces metallicity; declines steeply after 105yrs |
| SO | trends as in Table 5 |
| SO2 | independent of metallicity for higher metallicity values |
| H2S | trends as in Table 5 |
| H2CS | a strong metallicity indicator |
| H2CO | trends as in Table 5 |
| CH2CO | follows metallicity |
| C2H5OH | undetectable |
| HCOOCH3 | undetectable |
| HNC | trends as in Table 5 |
| HCN | trends as in Table 5 |
| HCO+ | trends as in Table 5 |
| Molecule | Response to higher cosmic ray ionization rate |
|---|---|
| CO, H2O | unchanged between = 1 and = 10, insensitive tracer of |
| CS | reduced for = 10 case by 10, good inverse tracer of |
| OCS | increased for = 10 by 10, linear tracer of |
| CH3CN | early time ( 1 yrs) reduced for = 10, but much increased |
| at late time ( 1 yrs), tracer strongly increasing with | |
| CH3OH | initially high in both cases, but removed by chemistry |
| earlier ( 1 yrs) for = 10, good inverse tracer of | |
| SO | increased significantly for = 10, good tracer for |
| SO2 | increased (by 10) for = 10, linear tracer of |
| H2S | increased significantly for = 10, good tracer for |
| H2CS | no significant change, insensitive tracer for |
| H2CO | reduced for = 10 after 1 yrs, good inverse tracer of |
| CH2CO | large in both case, unchanged, insensitive tracer for |
| C2H5OH | undetectable in both cases |
| HCOOCH3 | barely detectable for = 1, reduced for = 10, but inverse tracer of |
| HNC | increased for = 10 by 10, linear tracer of |
| HCN | increased significantly for = 10, good tracer for |
| HCO+ | not detectable for = 1, but increased 10 for = 10 |
| Molecule | Response to changes in initial elemental abundances |
|---|---|
| CO, H2Oa | unchanged between models (follows total carbon abundance) |
| CS | always abundant but removed after 1 yrs from hot cores |
| in cases with highest total oxygen abundance to form SO | |
| OCSc | follows total sulfur abundance |
| CH3CNb | follows total nitrogen abundance, a good discriminant between |
| solar and early Universe types | |
| CH3OH | almost unchanged between models, since the abundance |
| mainly follows unchanged carbon | |
| SOc | follows total sulfur abundance |
| SO2c | follows total sulfur abundance |
| H2Sc | not very sensitive to the total sulfur abundance, removed at late times ( 1 yrs) |
| H2CSc | not very sensitive to the total sulfur abundance, removed at late times ( 1 yrs) |
| H2CO | inversely sensitive to total oxygen abundance |
| CH2COa | high abundances anti-correlated with total oxygen abundance |
| C2H5OH | negligible but anti-correlated with total oxygen abundance |
| HCOOCH3a | low abundances and anti-correlated with total oxygen abundance |
| HNCb | follows total nitrogen abundance |
| HCNb | follows total nitrogen abundance |
| HCO+ | negligible but anti-correlated with total oxygen abundance |
a : Hot cores tracers CO, H2O follow the total oxygen abundance while CH2CO (and HCOOCH3) are anti-correlated with total oxygen abundance; b : HCN, HNC and CH3CN are all potential discriminants between solar and early Universe elemental abundances through the nitrogen content; c : typical hot core molecules as SO, SO2 and OCS are correlated with total sulfur abundance while H2S and H2CS are rather insensitive.
| Model 0 | Model 15 | Model 17 | Model 18 | |
| Type of | Spiral Normal | Starburst | low-metallicity | high redshift |
| Galaxy | IC 342, NGC 4736 | M 83 | IC 10 | Cloverleaf QSO, APM 08279 |
| CS | ||||
| OCS | ||||
| CH3CN | ||||
| CH3OH | ||||
| SO | ||||
| SO2 | ||||
| H2S | ||||
| H2CS | ||||
| H2CO | ||||
| CH2CO | ||||
| C2H5OH | ||||
| HCOOCH3 | ||||
| HNC | ||||
| HCN | ||||
| HCO+ |
References
- Aalto et al. (2002) Aalto, S., Polatidis, A. G., Hüttemeister, S., & Curran, S. J. 2002, A&A, 381, 783
- Aalto et al. (2007) Aalto, S., Spaans, M., Wiedner, M. C., & Hüttemeister, S. 2007, A&A, 464, 193
- Bernasconi & Maeder (1996) Bernasconi, P. A. & Maeder, A. 1996, A&A, 307, 829
- Blake et al. (1987) Blake, G. A., Sutton, E. C., Masson, C. R., & Phillips, T. G. 1987, ApJ, 315, 621
- Chieffi & Limongi (2002) Chieffi, A. & Limongi, M. 2002, ApJ, 577, 281
- Fontani et al. (2007) Fontani, F., Pascucci, I., Caselli, P., et al. 2007, A&A, 470, 639
- Gao & Solomon (2004) Gao, Y. & Solomon, P. M. 2004, ApJS, 152, 63
- García-Burillo et al. (2007) García-Burillo, S., Combes, F., Usero, A., & Graciá-Carpio, J. 2007, New Astronomy Review, 51, 160
- García-Burillo et al. (2006) García-Burillo, S., Graciá-Carpio, J., Guélin, M., et al. 2006, ApJ, 645, L17
- Garnett (1998) Garnett, D. R. 1998, in ASP Conf. Ser. 147: Abundance Profiles: Diagnostic Tools for Galaxy History, 78
- Hanson (1998) Hanson, M. M. 1998, in Astronomical Society of the Pacific Conference Series, Vol. 131, Properties of Hot Luminous Stars, ed. I. Howarth, 1
- Hatchell et al. (1998) Hatchell, J., Thompson, M. A., Millar, T. J., & MacDonald, G. H. 1998, A&AS, 133, 29
- Heger & Woosley (2002) Heger, A. & Woosley, S. E. 2002, ApJ, 567, 532
- Hidalgo-Gámez (2005) Hidalgo-Gámez, A. M. 2005, A&A, 442, 443
- Knauth et al. (2003) Knauth, D. C., Andersson, B.-G., McCandliss, S. R., & Moos, H. W. 2003, ApJ, 596, L51
- Le Teuff et al. (2000) Le Teuff, Y. H., Millar, T. J., & Markwick, A. J. 2000, A&AS, 146, 157
- Lintott et al. (2005) Lintott, C. J., Viti, S., Williams, D. A., Rawlings, J. M. C., & Ferreras, I. 2005, MNRAS, 360, 1527
- Meyer et al. (1998) Meyer, D. M., Jura, M., & Cardelli, J. A. 1998, ApJ, 493, 222
- Millar & Hatchell (1998) Millar, T. J. & Hatchell, J. 1998, in Chemistry and Physics of Molecules and Grains in Space. Faraday Discussions No. 109, 15
- Millar et al. (1997) Millar, T. J., MacDonald, G. H., & Gibb, A. G. 1997, A&A, 325, 1163
- Rawlings et al. (1992) Rawlings, J. M. C., Hartquist, T. W., Menten, K. M., & Williams, D. A. 1992, MNRAS, 255, 471
- Ruffle et al. (1999) Ruffle, D. P., Hartquist, T. W., Caselli, P., & Williams, D. A. 1999, MNRAS, 306, 691
- Sembach & Savage (1996) Sembach, K. R. & Savage, B. D. 1996, ApJ, 457, 211
- Snow et al. (2002) Snow, T. P., Rachford, B. L., & Figoski, L. 2002, ApJ, 573, 662
- Sofia et al. (1997) Sofia, U. J., Cardelli, J. A., Guerin, K. P., & Meyer, D. M. 1997, ApJ, 482, L105+
- Umeda & Nomoto (2002) Umeda, H. & Nomoto, K. 2002, ApJ, 565, 385
- Vila-Costas & Edmunds (1992) Vila-Costas, M. B. & Edmunds, M. G. 1992, MNRAS, 259, 121
- Viti et al. (2004) Viti, S., Collings, M. P., Dever, J. W., McCoustra, M. R. S., & Williams, D. A. 2004, MNRAS, 354, 1141
- Viti & Williams (1999) Viti, S. & Williams, D. A. 1999, MNRAS, 305, 755
- Wagg et al. (2005) Wagg, J., Wilner, D. J., Neri, R., Downes, D., & Wiklind, T. 2005, ApJ, 634, L13
- Wakelam et al. (2004) Wakelam, V., Caselli, P., Ceccarelli, C., Herbst, E., & Castets, A. 2004, A&A, 422, 159
- Walmsley & Schilke (1993) Walmsley, C. M. & Schilke, P. 1993, Observations of Hot Molecular Cores in Dust and Chemistry in Astronomy (Eds. T.J. Millar and D.A. Williams - Institute of Physics Publishing Bristol), 37
- Wu et al. (2005) Wu, J., Evans, II, N. J., Gao, Y., et al. 2005, ApJ, 635, L173
- Zaritsky et al. (1994) Zaritsky, D., Kennicutt, R. C., & Huchra, J. P. 1994, ApJ, 420, 87