–
Boxy/Peanut bulges, vertical buckling and galactic bars
Abstract
Boxy/peanut bulges in disk galaxies have been associated to stellar bars. In this talk, we discuss the different properties of such bulges and their relation with the corresponding bar, using a very large sample of a few hundred numerical N-body simulations. We present and inter-compare various methods of measuring the boxy/peanut bulge properties, namely its strength, shape and possible asymmetry. Some of these methods can be applied to both simulations and observations. Our final goal is to get correlations that will allow us to obtain information on the boxy/peanut bulge for a galaxy viewed face-on as well as information on the bars of galaxies viewed edge-on.
1 Introduction
Simulations have shown that bars are not vertically thin morphological features, but have a considerable vertical extent and a vertical structure, known as the Boxy/Peanut bulges (hereafter B/P; Combes & Sanders 1981, Combes et al. 1990). Comparisons between observations and -body simulations have established this direct connection firmer (Athanassoula 2005 and references therein). Furthermore, observations have shown that both bars and B/P bulges are quite predominant in disc galaxies and that the corresponding frequencies are in good agreement with the link between the two structures (Lütticke, Dettmar & Pohlen 2000).
We measure the peanut properties in a large sample of several hundred -body simulations ran by one of us (EA) for different purposes. More information on these simulations and on their properties can be found in Athanassoula & Misiriotis (2002) and Athanassoula (2003, 2007). In particular, we seek correlations between the properties of the bar and the properties of the B/P bulge.
2 Methods for measuring bar and peanut strength and correlations
In order to measure the bar strength, we use standard Fourier decomposition and take the amplitude of the second ( = 2) component.
| (1) |
where and are the mass and azimuthal angle of particle . This can be done either globally or as a function of radius. In the former case, the summation is carried out over all particles in the disc, while in the latter is the number of particles in a given cylindrical shell of radius and .
The vertical asymmetry and the strength of the B/P can be measured in a similar way, by
| (2) |
where can be either the number of particles in the disc component, or the number of particles per vertical column or cut (in which case ) and is the scale height of the initial exponential disc. In Fig. 1 we apply these two definitions to two simulation snapshots, one with a boxy bulge and the other with a peanut, or X-shaped bulge.
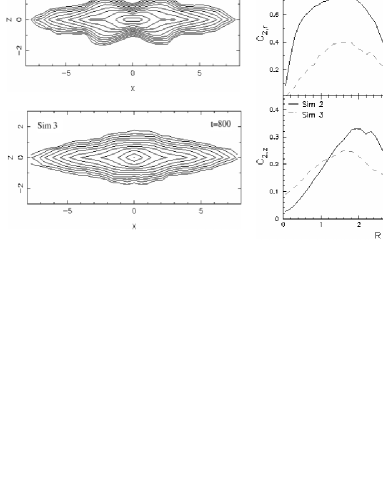
We have also applied statistical methods, based on the distribution of the coordinates of the particles in a given vertical cut (perpendicular to the equatorial plane) of a snapshot seen edge-on, with the bar viewed side-on. We use the median of the absolute values and the standard deviation () to measure the strength of the peanut, the kurtosis to measure its shape and the skewness and the mean to measure the strength of the buckling event, i.e. the asymmetry during the vertical instability.
We inter-compared the different methods of measuring the B/P strength and found very strong correlations, allowing us to use these methods indiscriminately. This is important, particularly in view of their application to real, highly inclined galaxies.
3 Detecting the buckling events in simulations
We use three different methods to determine the strength of the buckling event and the time at which it occurs. We again use the Fourier decomposition, but now the snapshot is viewed edge-on and we use the amplitude of the first coefficient in the Fourier decomposition. This first coefficient gives a measure of the asymmetry:
| (3) |
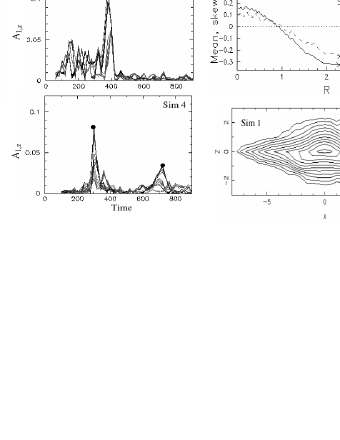
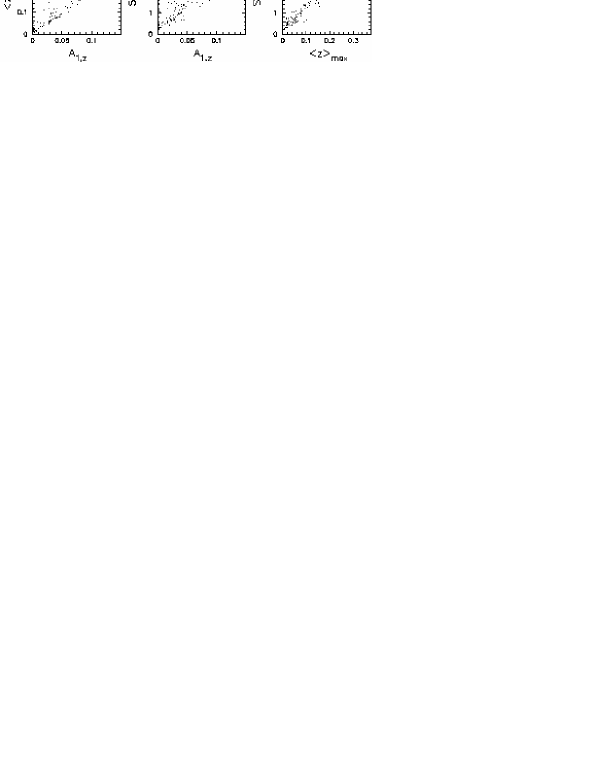
where is the angle of particle measured in the () plane, with the major axis of the bar, positioned in principle, in the -axis. To make this coefficient more sensitive to a buckling, we usually exclude from the summation disk particles that are not in the bar, as discussed in Martinez-Valpuesta et al. (2006). The left panels of Fig. 2 show the time evolution of for four different simulations. The over plotted lines correspond to different position angles of the bar (from to ) and to different inclinations of the galaxy (from to ). Notice that the peaks in are visible in all these orientations. We would like to point out the panel showing Sim 4, where two peaks are seen. These peaks correspond to the two buckling events that many of our simulations undergo (also seen in Martinez-Valpuesta et al. 2006). As mentioned above, we can also measure the strength of the buckling using statistics on the distribution of the coordinates of the simulation particles, i.e. measure the mean () and the skewness (). The value of these statistical moments vs. radius for a given snapshot, i.e. simulation and time, is shown in Fig. 2, right bottom panel. The absolute values of these parameters will be maximal at the time when the buckling event is happening. Fig. 3 compares the results of our three methods for measuring the buckling strength and shows that they correlate with each other.
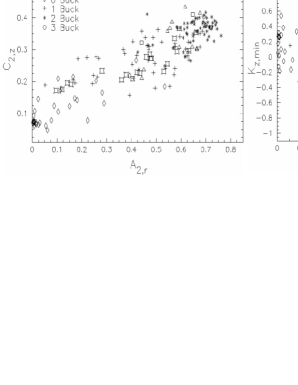
More important, we find correlations between both the strength and the shape of the B/P bulge with the strength of the bar (Fig. 4). The shape of the B/P bulge is given by the minimum kurtosis. In this figure we show that strong bars have buckled more times, and achieved a stronger B/P bulge.
4 Conclusions
We presented several methods to calculate the strength of the bar and the strength, shape and asymmetry of the B/P bulge and found strong correlations between their results. The most important correlation relates the strength of the bar with the strength of the B/P bulge, the strongest bars having the strongest peanuts. We also find that the strength of the peanut depends on the number of buckling episodes it underwent, the strongest bars having undergone more buckling episodes (Fig. 4). Finally, we find a very interesting result about , i.e. about the shape of the radial density profiles along cuts perpendicular to the equatorial plane. For strong bars, having a strong peanut or X-shaped bulge, this profile is more flat-topped, while for weaker bars, with more boxy-like bulges, it is more peaked. All the results summarised here are discussed in length by Athanassoula & Martinez-Valpuesta (2007, in preparation).
Acknowledgements.
This work has been partially supported by the Peter and Patricia Gruber Foundation Fellowship.References
- Athanassoula (2003) Athanassoula, E., 2003, MNRAS, 341, 1179
- Athanassoula (2005) Athanassoula, E., 2005, MNRAS, 358, 1477
- Athanassoula (2007) Athanassoula, E., 2007, MNRAS, 377, 1569
- Athanassoula & Misiriotis (2002) Athanassoula, E., Misiriotis, A. 2002, MNRAS, 330, 35
- Combes & Sanders (1981) Combes, F., Sanders, R. H. 1981, A&A, 96, 164
- Combes et al. (1990) Combes, F., Debbasch, F., Friedli, D., Pfenniger, D. 1990, A&A, 233, 82
- Lütticke et al. (2000a) Lütticke, R., Dettmar, R.-J., Pohlen, M. 2000a, A&AS, 145, 405
- (8) Martinez-Valpuesta, I., Shlosman, I., & Heller, C. 2006, ApJ, 637, 214