A SINFONI view of Galaxy Centers: Morphology and Kinematics of five Nuclear Star Formation Rings11affiliation: Based on observations collected at the European Southern Observatory, Chile, for proposals 076.B-0646(A) and 077B-0738(B).
Abstract
We present near-infrared (H- and K-band) integral-field observations of the circumnuclear star formation rings in five nearby spiral galaxies. The data, obtained at the Very Large Telescope with the SINFONI spectrograph, are used to construct maps of various emission lines that reveal the individual star forming regions (”hot spots”) delineating the rings. We derive the morphological parameters of the rings, and construct velocity fields of the stars and the emission line gas. We propose a qualitative, but robust, diagnostic for relative hot spot ages based on the intensity ratios of the emission lines , , and . Application of this diagnostic to the data presented here provides tentative support for a scenario in which star formation in the rings is triggered predominantly at two well-defined regions close to, and downstream from, the intersection of dust lanes along the bar with the inner Lindblad resonance.
1 INTRODUCTION
In many spiral galaxies of early- and intermediate Hubble type (Sa-Sc), active star formation is organized in a ring-like structure. These star formation rings offer a unique opportunity to study massive star formation in external galaxies: they produce up to 2/3 of the bolometric luminosity of their host galaxies (e.g. NGC 7469; Genzel et al., 1995), and often contain a large fraction of the entire star formation activity of the galaxy.
The general picture of why molecular gas assembles in a ring is well understood as a natural consequence of a non-axisymmetric gravitational potential, nearly always due to the presence of a stellar bar or oval distortion (e.g. Combes & Gerin, 1985; Knapen et al., 1995; Heller & Shlosman, 1996; Buta & Combes, 1996). Because of its dissipative nature, molecular gas accumulates around the radii at which the stellar orbits experience dynamical resonances with the rotating bar potential. Depending on the pattern speed of the bar and the rotation curve of the galaxy, there can be one or multiple such resonances. The high gas densities found in the rings, combined with a variety of excitation mechanisms such as ultra-violet radiation from young stars and mechanical shocks due to energetic outflows from massive stars and/or an active galactic nucleus (AGN) help reveal the physical state of the interstellar matter (ISM), be it molecular, atomic, or ionized gas.
Besides being fascinating laboratories in their own right, star formation rings are important also for the secular evolution of disk galaxies (Kormendy & Kennicutt, 2004). This is particularly true for the innermost of the dynamical resonances which is called either the ”inner Lindblad resonance” (ILR) or - in cases where a compact massive object leads to an additional dynamical resonance - the “nuclear Lindblad resonance” (NLR; Fukuda, Wada, & Habe, 1998). Either of these resonances can produce gas rings with radii of a few hundred pc or less, depending on the enclosed mass, and the rotation speed of the galaxy disk. On these spatial scales, a number of processes can cause the gas to lose angular momentum and to subsequently flow towards the nucleus. Examples for such processes include torques due to the stellar potential (García-Burillo et al., 2005), dynamical friction between giant molecular clouds that form within the ring due to self-gravity of the gas (Fukuda, Habe, & Wada, 2000), the formation of spiral density waves (Englmaier & Shlosman, 2000), or mechanical energy released by star formation in the ring via stellar winds and/or supernova explosions.
Understanding the gas dynamics and star formation processes of nuclear111Throughout this paper, the term “nuclear ring” is used to imply that it is the innermost (star forming) gas ring that can be resolved with the resolution of our data, typically a few hundred pc in diameter. rings in disk galaxies is therefore crucial for developing models of gas accumulation at the very nucleus of a galaxy and the evolution of any compact massive object (CMO) which can exist in the form of a nuclear star cluster (NC, Böker et al., 2002) and/or a supermassive black hole (SMBH). While some theoretical models exist on the gas behavior around a CMO (e.g. Fukuda et al., 2000), observational data to constrain these models are rare, mostly because of the limited spatial resolution of mm-observations. Only recently has it become possible to study the molecular gas flows within a few tens of pc from the nucleus in a small number of nearby galaxies (e.g. Schinnerer et al., 2003, 2006, 2007).
In order to increase the number of well-studied nuclear rings, we have begun a project to study the near-infrared (NIR) properties of five such objects, using the SINFONI integral-field spectrograph on the Very Large Telescope (VLT). This paper discusses the morphologies, star formation rates, and kinematic properties of the rings. In a subsequent paper, we will make use of the spectroscopic information contained in the SINFONI data to investigate in more detail the star formation process, stellar populations, and gas excitation mechanism(s) in individual galaxies, both in the rings and the galaxy nuclei.
This paper is structured as follows. In §2, we describe the sample selection, observational details, and data reduction techniques common to all galaxies. The continuum and emission line morphology of the rings as well as the velocity fields of stars and gas for the individual galaxies are presented in §3. We discuss the results in the context of competing models for the propagation of star formation in the rings in §4, and summarize our analysis in §5.
2 OBSERVATIONS AND DATA REDUCTION
2.1 Galaxy Sample
The general properties of the five galaxies discussed in this paper are summarized in Table 1. The objects were selected from the imaging survey of Knapen et al. (2006) because they show evidence for small-scale circumnuclear star formation rings within the SINFONI field of view, i.e. the central . All five galaxies are classified as barred (SB) or weakly barred (SAB).
2.2 SINFONI observations
SINFONI is an adaptive optics assisted, cryogenic NIR integral-field spectrograph, commissioned at the VLT. It provides imaging spectroscopy of a contiguous, two-dimensional field of spatial pixels in the wavelength range from at a resolving power of . Details about the instrument design can be found in Eisenhauer et al. (2003) and Bonnet et al. (2004)
The bulk of the data described in this paper were obtained in service mode during various nights between October 2005 and January 2006. One object (NGC 5248) was observed a semester later, in May/June 2006. The SINFONI instrument was used without the adaptive optics module, and with its lowest magnification, resulting in slice widths of , a pixel scale of , and a field-of-view of . This field size is well-matched to the diameters of the circumnuclear starburst rings under study, hence no mosaicing was necessary. We used the SINFONI configuration for simultaneous H+K spectra which yields a spectral resolution of R.
Because in all cases, the host galaxy is much more extended than the SINFONI field of view, we obtained identical exposures of the empty sky background by “nodding” the telescope to point a few arcminutes away from the galaxy nucleus. During pipeline processing, these “sky frames” are subtracted from the “object frames”, so that, at least in theory, the final data cubes are free of sky emission and dark current.
For each galaxy, we had requested an on-source integration time of 2.5 hr, divided into five observation blocks (OBs). Each OB consists of five long on-source exposures, paired with corresponding observations of the empty sky in an ABBA nodding sequence. However, due to scheduling constraints, not all OBs were actually executed. In some cases (e.g. NGC 1079 and NGC 1300), only one or two OBs were executed. Although this clearly reduced the signal-to-noise ratio of the resulting data cubes, the emission line maps nevertheless yield interesting insight into the structure of the rings. In Table 2 we list the observation dates, OB identifiers, and the resulting total integration times for all galaxies discussed in this paper.
2.3 Data reduction
The reduced science products delivered by ESO for these datasets could not be used directly for our analysis. We identified two main reasons for this:
a) First, the default settings of the ESO pipeline uses the flag objnod.scale_sky = true in the si_rec_objnod recipe to allow for scaling of the sky background before subtraction. This causes unphysical (often negative) flux levels in the resulting data cubes, especially in regions where the sky flux level is significant compared to the science object. It is thus important that this option is switched off when running the SINFONI pipeline on this type of raw data.
b) Second, in the raw, two-dimensional detector frames, the sky emission lines show a small, but noticable shift in their position. This misalignment between sky and object frames causes imperfect removal of the sky lines in the resulting spectra, and is probably due to flexure in the optical train.
While the first issue could be easily solved, the proper removal of the sky residuals required a more elaborate data reduction process. We used the ESO pipeline for SINFONI (version 1.3) to perform the basic data reduction (bias subtraction, flatfielding, wavelength calibration and extraction) of the individual frame pairs in each OB. For each pair, we improved on the sky subtraction by means of an IDL222http://www.ittvis.com/ software package described in Davies (2007) and kindly provided to us by R. Davies. The algorithm allows to separately scale different transition groups of telluric OH lines before subtraction which minimizes the residuals in the final spectra. We aligned all OBs to be centered on the galaxy nucleus (i.e. the peak of the continuum emission), thus accounting for telescope dithers between OBs. Moreover, we shifted all individual channel maps within an OB to correct the atmospheric refraction which causes small shifts with wavelength of the continuum peak within an exposure. Finally, we median-combined the aligned and sky-subtracted OB cubes of a given galaxy.
The resulting “final” data cube of each OB contains about 2100 channel maps of the () field of view with a spatial sampling of /pixel and a spectral resolution of R. The OB cubes are wavelength-calibrated and sky-subtracted, but at this stage neither flux-calibrated nor corrected for the absorption features introduced by the Earth’s atmosphere. In order to correct for telluric absorption, we divided each data cube by an atmospheric transmission model generated with the ATRAN package (Lord, 1992). We created model atmospheres for the altitude of the Paranal observatory and for a number of zenith angles spanning the range of our observations ().
For flux calibration of the cubes, we used observations of early-type (around B5V) standard stars which are part of the routine nightly SINFONI calibration. For each night, we extracted the observed stellar spectrum (in counts/s) in a aperture and - after correcting for telluric absorption as described below - divided it into the “true” intrinsic spectrum of the respective spectral type. This, in principle, yields the correction “spectrum” that must be multiplied into the data cubes obtained during the same night in order to obtain the correct SED of the galaxy. The “true” stellar spectrum was obtained from the library of Pickles (1998) after scaling to the near-infrared magnitudes listed in the Hipparcos catalog333using the zero points of the UKIRT photometric system of for H-band (K-band).. For some stars, the exact spectral type was not available in the Pickles library, in which case we used the nearest available type (the difference was never more than one subclass).
Performing this flux calibration on a night-by-night basis produced a set of galaxy SEDs that showed a relatively large scatter of about 15% rms. This scatter is larger than that achieved by using a single calibration spectrum for all OBs, regardless of when they were taken. This demonstrates that the accuracy of the flux calibration is limited by the systematic uncertainty of the “true” spectra of the standard stars (and possibly by the accuracy of the telluric correction). We therefore decided to apply the same average calibration spectrum to all individual OBs. This average calibration spectrum was obtained by fitting a fourth-order polynomial to the average inferred correction spectra of all standard stars.
The systematic uncertainty of this approach should not be larger than the night-to-night variations of the flux calibration. We therefore estimate that our flux calibration is accurate to 15%. As a consistency check, we compared the continuum flux levels of the calibrated spectra in H- and K-band to those derived by the 2MASS survey. The agreement was better than 10%, thus confirming our error estimate.
As a last step in the data reduction, and after the telluric correction and flux calibration was applied to the individual OBs, they were merged to produce a fully reduced datacube for each galaxy.
3 Near-Infrared Diagnostics: Stars, Gas, and Kinematics
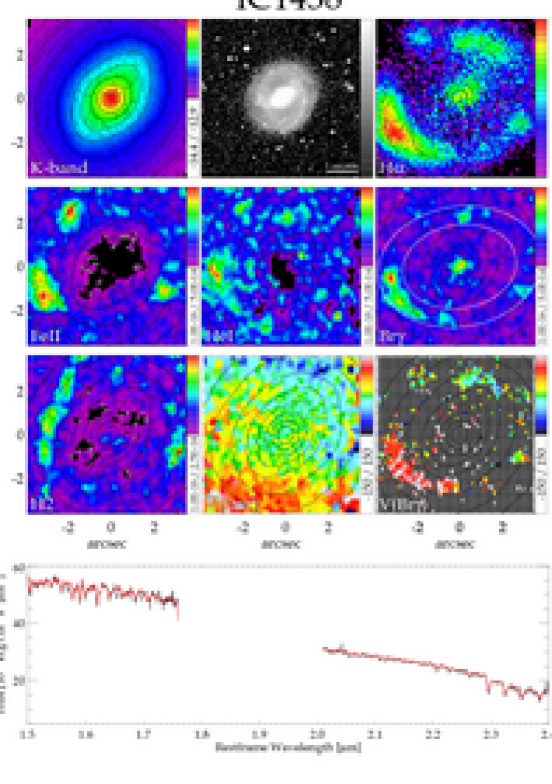
In this section, we present - for each of the five galaxies - a number of maps extracted from the SINFONI data cubes following the data reduction process just described. These maps contain a large amount of morphological and kinematic information on the stars and various components of the ISM (molecular and ionized gas, dust, etc.). The various emission lines, in particular, trace different components of the inter-stellar medium (ISM) and different excitation mechanisms so that even a qualitative comparison provides insight into the current physical conditions inside the starburst rings.
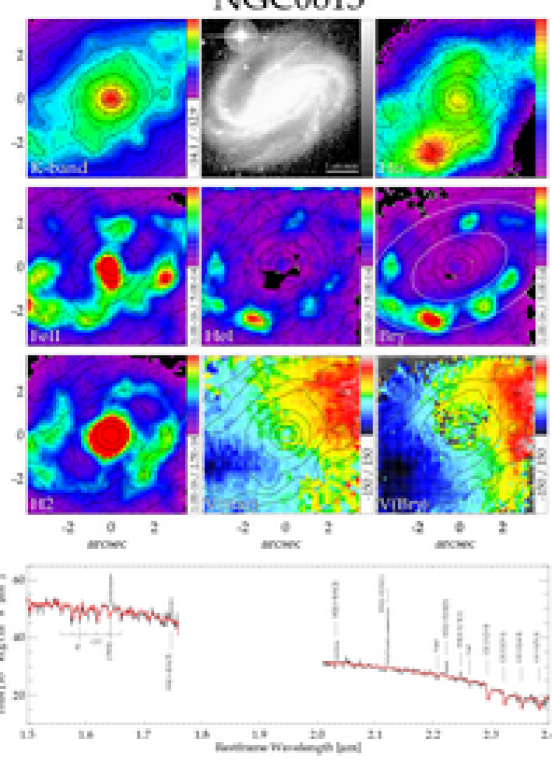
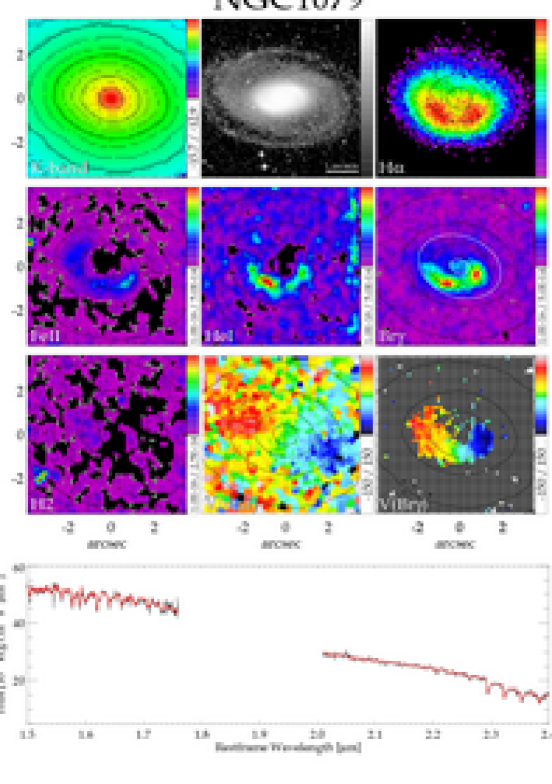
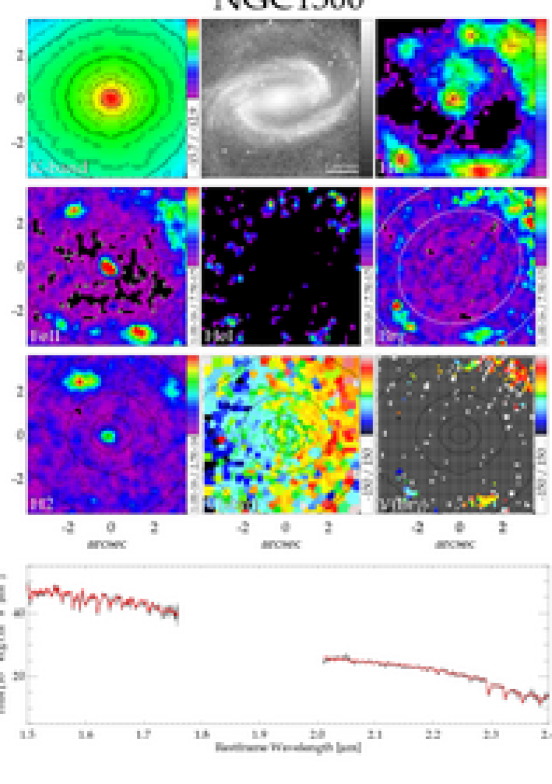
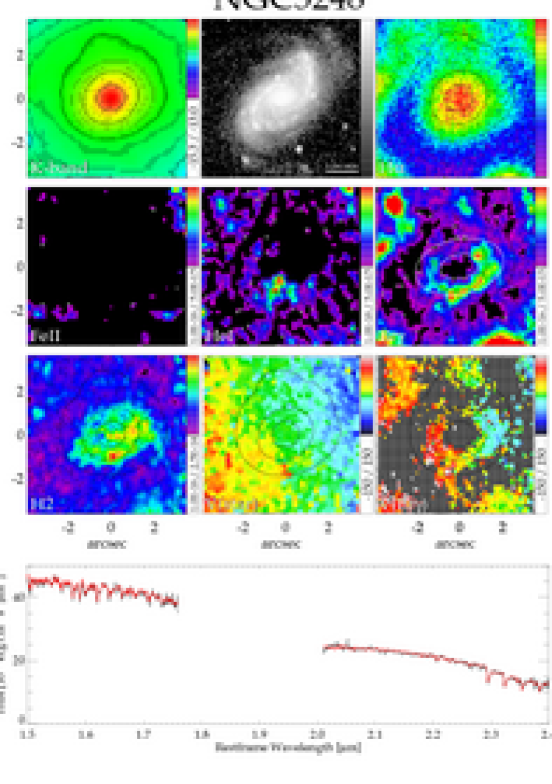
Before we discuss each galaxy in more detail, we briefly summarize how each of the maps presented in Figures 1 to 5 (from left to right and top to bottom) was constructed, what they signify, and how they can be interpreted:
-
1.
A map of the K-band continuum emission. In the NIR wavelength range, the continuum emission is predominantly produced in red giants and supergiants, and the mass-to-light ratio of evolved stellar populations is nearly independent of stellar type. Therefore, the K-band morphology is an accurate tracer of the gravitational potential. Our K-band maps maps are constructed by simply adding up all channel maps in the wavelength range , excluding those expected to contain strong line emission, e.g. from or . The result should be a “clean” map of the stellar mass distribution.
-
2.
A arcmin large-scale -band image of the galaxy from the Digital Sky Survey.
-
3.
A map of emission in the central taken from Knapen et al. (2006). We include these maps here to allow a visual comparison to the SINFONI line maps, in particular . However, the comparison should be made keeping in mind some complications. First, the images in Knapen et al. (2006) were constructed by subtracting a scaled I-band image, used as a substitute for narrow-band continuum images. As discussed in Böker et al. (1999), this method can cause imperfect continuum subtraction in regions with large color deviations, in particular the galaxy nucleus. As can be seen by comparison to the SINFONI maps (which have a more robust continuum subtraction, see below), this is indeed the case for most of our sample. Secondly, is potentially more affected by dust extinction than . Finally, the spatial resolution of the maps is somewhat lower than that of the SINFONI data. Nevertheless, these maps provide a valuable consistency check of our NIR line maps. Here, and in each of the following maps, we overplotted the K-band continuum contours from panel 1 for comparison.
-
4.
A line map. The strongest emission line of in the H- and K-bands is the transition at . The most likely excitation mechanism is collisions with free electrons in hot gas with temperatures in the range . However, the ionization potential of is only 16.2 eV. This means that in regions of fully ionized hydrogen, most of the Fe atoms are in higher ionization states. Therefore, the emission is not expected to be strong in normal HII regions (Mouri, Kawara, & Taniguchi, 2000). Instead, it will be strong in regions that i) have a high abundance of Fe in the gas phase, and ii) are only partially ionized. The two most likely mechanisms to create extended partially ionized zones are power-law photoionization by X-rays (e.g. from an AGN) and fast shocks produced in supernova remnants (Labrie & Pritchet, 2006).
-
5.
A line map, more specifically a map of the transition at which is the strongest line in the H- and K-bands. The ionization energy of atomic helium is and thus markedly higher than that of hydrogen (). Line emission from is therefore expected to arise predominantly in the vicinity of the most massive (and hence youngest) stars. Interpretation of the emission requires detailed photo-ionization models, and quantitative analysis of the temperature of the hottest stars in an H II region is subject to large uncertainties (Doherty et al., 1995; Lumsden et al., 2001). At least qualitatively, however, comparing the line strength to that of provides a handle on the relative ages of the youngest stellar clusters because the hottest stars will vanish fastest. We will use this simple diagnostic in the discussion of age gradients along the rings in §4.2.
-
6.
A map of the line at . The recombination line of the hydrogen atom is predominantly produced by photo-ionization in the Strömgren-spheres around O- or B-type stars. Although fast shock-fronts due to supernovae and/or strong stellar winds can also ionize hydrogen atoms, these mechanisms are related to the same population of OB stars, and thus they occur in the same locations444It is, in principle, possible to distinguish between ultra-violet photons and fast shocks as the cause of hydrogen ionization: the former produces low HII densities with a large filling factor (i.e. high column densities), while the latter produces high densities with a low filling factor.. A third potential ionization mechanism is strong non-thermal emission from an active galactic nucleus (AGN). Outside the galaxy nucleus, however, we consider as a primary tracer of young stellar populations.
The map, as well as the other emission line maps presented in Figures 1 to 5 was constructed by summing up all channel maps containing line emission, and subtracting from each a continuum map created by averaging five channel maps on either side of the line. This is equivalent to the standard method of taking narrow-band images through filters that are centered on the line and the red and blue continuum, respectively.
-
7.
A line map. The (1-0) S1 transition of the molecule at is a tracer of warm molecular gas with temperatures around . There are three plausible mechanisms that can heat molecular gas to these temperatures: i) UV-fluorescence in photo-dissociation regions (PDRs), typically the surface layers of dense molecular clouds in the vicinity of UV-bright star forming regions (e.g. Black & van Dishoeck, 1987), ii) collisional excitation of the molecules in fast shock fronts (e.g. Hollenbach & McKee, 1989), and iii) X-ray illumination (Maloney, Hollenbach & Tielens, 1996). Using the relative strengths of the numerous other rotational and vibrational transitions of the molecule present in the NIR spectral range, one can, in principle, distinguish between these excitation modes. In the case of NGC 613, we will present this analysis in a forthcoming paper (Falcón-Barroso et al., 2008, hereafter paper II). However, for the purpose of this paper, the line maps merely serve to indicate the distribution of warm molecular gas.
-
8.
A map of the stellar velocity field, derived using the penalized pixel-fitting (pPXF) method of Cappellari & Emsellem (2004). We made use of a subset of the library of theoretical spectra from Lançon et al. (2007) adapted to our spectral resolution. This subset comprises stellar models with solar abundances for a range of effective temparature (T=2900-5900 K) and gravity (log(g)=0-2). In order to ensure reliable measurements of stellar kinematics, we spatially binned our datacubes using the Voronoi 2D binning algorithm of Cappellari & Copin (2003), creating compact bins with a minimum signal-to-noise ratio () of per spectral resolution element.
We fitted a non-negative linear combination of these models, convolved with a Gaussian line-of-sight velocity distribution (LOSVD), to the spectrum of each individual pixel over a wavelength range centered on the CO bands, masking any potential emission lines. The fit also allows for a low-order Legendre polynomial in order to account for small differences in the continuum slope between the pixel spectra and the stellar templates. The best-fitting template mix was then determined by minimization in pixel space.
-
9.
A map of the velocity field, determined using the GANDALF code (Sarzi et al., 2006). This routine fits simultaneously both the stellar continuum and emission lines, treating the emission lines as additional Gaussian templates. In order to subtract the stellar continuum, we used the best template combination from the stellar kinematic fit described above. In general, the high signal-to-noise ratio of allows to reliably measure the gas kinematics in smaller spatial bins, which yields higher spatial resolution than for the stellar kinematics, especially in the outer regions. However, the kinematics can only be derived where the emission line is strong. In the figures, we only display velocities for regions with a S/N above 2, while regions below this S/N are left blank (gray areas).
-
10.
Finally, we present the H- and K-band spectrum of the galaxy nucleus, i.e. a circular aperture with diameter centered on the K-band peak. Overplotted in red is the best stellar template fit from item 8. In the case of NGC 613 (Fig. 1), the emission lines as well as some prominent stellar absorption features are labeled for convenience.
The quantitative analysis of the line fluxes over the entire SINFONI field as well as within an aperture encompassing the ring (as delineated in each of the maps) is summarized in Table 4. In what follows, we comment in more detail on the individual galaxies. In particular, we describe those properties of the circumnuclear starburst rings that can be deduced from the images described above.
3.1 NGC 613
NGC 613 is a large, relatively nearby (), strongly barred Sbc spiral. It is classified as a Seyfert galaxy in the NED database, although without a type designation, and in fact, it is somewhat unclear on what basis this classification was made. The optical emission line spectrum of the NGC 613 nucleus is classified as “composite” by Véron-Cetty & Véron (1986). Furthermore, NGC 613 emits neither detectable X-ray emission in the band, nor any high excitation MIR lines such as [OIV] or [SiII] that are usually found in AGN (Satyapal, Sambruna, & Dudik, 2004). In §3.7, we discuss that the nucleus is also quiescent in the NIR, in the sense that it does not ionize much of the surrounding gas. On the other hand, radio continuum observations show evidence for an energetic outflow which has been interpreted as a jet emanating from an AGN (Hummel et al., 1987; Hummel & Jörsäter, 1992). The same radio observations also clearly reveal the star formation ring.
The excellent signal-to-noise ratio of our SINFONI data for NGC 613 allows a detailed spectroscopic study of the star formation processes and stellar populations in the nucleus and nuclear ring of NGC 613 which we present in paper II. Here, we highlight a few interesting characteristics that are evident from the NIR maps alone.
3.1.1 Continuum emission
There is some dispute in the literature about the shape of the gravitational potential in NGC 613. On the one hand, Jungwiert, Combes, & Axon (1997) and Eskridge et al. (2002) have suggested that NGC 613 has a nuclear bar at the same position angle (PA) as the large-scale bar (; Hummel et al., 1987). However, based on HST imaging, Erwin (2004) raised the possibility that the “nuclear bar” was in fact a spurious feature caused by the presence of an elliptical ring of star clusters. As can be seen from the following discussion, such a ring is indeed present, and the morphology of our K-band map in Figure 1 is clearly affected by the continuum emission from the ring. For this reason, and because of the limited SINFONI field of view we cannot decide whether the galaxy morphology underlying the ring shows a bar-shaped stellar mass distribution.
3.1.2 Emission line morphology - evidence for an AGN outflow
The emission shows a very clearly defined ring structure, composed of seven almost regularly spaced bright clumps that are the sites of current massive star formation. These “hot spots” are brightest along the southern half of the ring, while the northern half shows a well-defined “gap” at PA which is also evident in the emission map. This direction agrees well with that of the radio jet found by Hummel et al. (1987) and studied further by Hummel & Jörsäter (1992). It thus appears that a mechanical outflow from the AGN has disturbed the ring morphology. The outflow thus must intersect the plane of the disk.
Additional evidence for such an outflow comes from the image of Knapen et al. (2006) which shows two faint“streamers” that are closely aligned with the radio jet. Moreover, a map of the velocity dispersion of the ionized gas (as measured by the line width of ) shown in Figure 6 clearly shows abnormally high dispersions along both sides of the outflow. The influence of the radio jet on the nuclear ring in NGC 613 will be addressed in more detail in paper II.
The emission also shows the nuclear ring, but is strongest in the nucleus. The ring is not composed of distinct hot spots like the emission, but is more smoothly distributed. There are two emission peaks, found on opposite sides of the ring, at approximate PA of and . If the emission in the ring of NGC 613 were purely caused by UV radiation, one might expect a spatial correspondence between and the ionized gas traced by and/or . However, many of the hot spots are not bright in . Therefore, the emission probably contains a non-negligible contribution from shock-heated molecular gas.
3.2 NGC 1079
NGC 1079 is an isolated, grand-design spiral in the Eridanus supergroup (Brough et al., 2006) marked by a bright bulge and very faint outer disk. It represents a good example for a galaxy in which nearly the entire star formation activity takes place in the ring, as can be seen by the image of Knapen et al. (2006) which shows an extremely quiescent galaxy disk
The nuclear ring of NGC 1079 has first been identified by Maoz et al. (1996) from HST ultraviolet imaging and ground-based spectroscopy which confirmed that the gas rotation curve is consistent with a rotating ring.
3.2.1 Continuum emission
Within the rather small SINFONI field of view, the K-band map of NGC 1079 appears smooth and featureless, in agreement with the H-band map of Jungwiert et al. (1997). Within the central , the K-band isophotes actually appear to have a somewhat smaller P.A. of , but this is also evident in the Jungwiert et al. (1997) map. These authors find evidence for a secondary bar with P.A. and major axis length of . It is possible that this bar governs the gas dynamics in the inner few hundred pc. Unfortunately, it is not possible to determine the dust structure in NGC 1079 because no high-resolution optical/NIR imagery is available in the HST archive, except for the UV data of Maoz et al. (1996) which are however not suitable to derive extinction variations.
3.2.2 Emission lines
Despite its small angular size (radius ), the star formation ring in NGC 1079 is easily resolved in our SINFONI maps. The line maps of , , and all show strong emission from the southern half of the ring, while the northern half is either quiescent or deeply obscured. The map shows two hot spots of roughly equal flux at P.A. and . Both are also seen in , but in this line the eastern hot spot is substantially stronger. We detect little or no emission from at the sensitivity limit of our data (note that the data set for NGC 1079 only consists of two OBs, i.e. only one hour on-source integration time).
3.3 NGC 1300
The SBbc spiral NGC 1300 is the prototype of a strongly barred disk galaxy, and has been extensively used as a testbed for dynamical modelling (Lindblad & Kristen, 1996; Lindblad et al., 1997; Aguerri et al., 2000). The dust structure in the central kpc as revealed by the V-H color map of Martini et al. (2003) does not resemble a ring, but rather is a good example of a grand design spiral.
NGC 1300 shows no signs of nuclear activity, and Scarlatta et al. (2004) find no evidence for a distinct stellar nucleus. Nevertheless, from an HST/STIS study of the kinematics of the nuclear emission line gas, Atkinson et al. (2005) conclude that NGC 1300 hosts a SMBH of .
3.3.1 Continuum emission
As in the case of NGC 1079, the continuum morphology of NGC 1300 is very smooth, which has also been noted by Pérez-Ramírez et al. (2000). There is no signature of the ring evident, indicating that in terms of stellar mass, the star formation ring is a small perturbation to the overall potential.
3.3.2 Emission lines
Of all galaxies in our sample, NGC 1300 is the one with the least integration time, and the SNR of the line maps, and in particular the velocity fields is therefore rather low. Nevertheless, the ring structure is clearly apparent, especially in and . Both lines show a number of individual hot spots, with the two brightest clumps located at opposite ends of the ring along its major axis (P.A. and ). In contrast, the two strongest clumps are located along the ring minor axis (P.A. and ). The northern clump is also bright in .
3.4 NGC 5248
The grand-design Sbc spiral NGC 5248 is a “posterchild” example for the impact of a stellar bar on the gas dynamics and circumnuclear star formation. Jogee et al. (2002a) have convincingly argued that the spiral structure is being driven by an extended, moderately strong stellar bar that has a deprojected ellipticity of 0.44 and a semimajor axis of (). The inner kiloparsec of NGC 5248 has been well studied with ground-based images in emission lines (Kennicutt et al., 1989; Laine et al., 2001; Knapen et al., 2006) as well as optical (Knapen et al., 2006) and NIR continuum (Elmegreen et al., 1997; Pérez-Ramírez et al., 2000). These images have revealed a diameter star formation ring which, when seen at HST resolution, is clearly resolved into numerous bright HII regions and young star clusters (Maoz et al., 1996, 2001).
Near-infrared color maps have also revealed a nuclear dust spiral (Laine et al., 1999) that spans the radial range between and . This structure likely forms the inward continuation of the grand-design spiral arm system that is apparent in various tracers out to a radius of about (Jogee et al., 2002a). At its inside, the nuclear dust spiral appears to lead into a second -bright ring that has a radius of only (Laine et al., 2001; Maoz et al., 2001) and thus forms one of the smallest such structures known.
As with NGC 613, NGC 5248 is believed to harbor an AGN, and is classified as Sy 2. However, at the sensitivity limits of the SINFONI data, we find no evidence for emission lines in the NIR spectrum of the NGC 5248 nucleus.
3.4.1 Continuum emission
The K-band morphology in the center of NGC 5248 has been discussed in detail by Jogee et al. (2002a). Our SINFONI map agrees well with the one presented in their Figure 8. In particular, both the “very weak oval feature of radius ” and the excess flux north of the nucleus are present in the two maps. As discussed by Jogee et al. (2002a), the weak oval could be due to a disk-like component, a late-type bulge, or an unresolved nuclear bar. Our data cannot further constrain its origin, but we note that the stellar velocity field shows rather regular rotation over the SINFONI field, without any signs for kinematically distinct components.
3.4.2 Emission lines
The two nested star formation rings of NGC 5248 can be seen in the SINFONI map. However, only the inner edge of the larger ring fall within the SINFONI field. The map clearly resolves the inner ring of NGC 5248. The morphology of the inner ring agrees very well with the line maps obtained with HST by Maoz et al. (2001), in the sense that most hot spots can also be identified in and/or .The only region with significant flux is located in the inner ring at PA . The strongest emission is distributed over the inner , with a hot spot just south of the nucleus. We do not detect significant flux in the line within the SINFONI field.
3.5 IC 1438
At a distance of , the poorly studied Sa spiral IC 1438 is the most distant galaxy in our sample, and with a radius of about , the star formation ring is at the limit of what we consider “nuclear”.
3.5.1 Continuum emission
Over the field of view of SINFONI, the K-band contours of IC 1438 are rather elongated outside the very nucleus. This is unlikely to be a projection effect because IC 1438 has a rather low inclination of (Knapen et al., 2006). Indeed, the outer disk appears fairly round in the DSS image. On the other hand, the central of IC 1438 are dominated by a strong stellar bar which is also evident in the I-band image of Knapen et al. (2006). It is therefore likely that the gravitational potential in the center of IC 1438 is bar-shaped as well. It appears that the PA of the bar within the SINFONI field of view is higher than that of the large-scale bar. Whether this is the result of isophote twisting, or whether there is a “nested” secondary bar, requires additional data.
3.5.2 Emission lines
Due to the lower S/N of the SINFONI data, the map does not reveal the nuclear ring as clearly as the map, mostly because the fainter, extended emission is not as obvious. Nevertheless, the two maps agree rather well, especially in the location of the “hot spots”. Star formation is strongest at the south-east corner (PA ) where an extended arc dominates the emission in both maps. This region also shows strong emission. Two smaller clumps at PA and are also apparent in the map. There is also emission in the nucleus, indicating star formation within the central .
As in the other sample galaxies, the emission is distributed much more smoothly, and thus outlines the ring structure more completely. There is some evidence for a connection between the ring and the nuclear region from an “ridge” at PA .
3.6 Kinematics of Stars and Gas
In all five galaxies of our sample, the stellar velocity fields appear rather regular, despite the intense star formation within the nuclear rings. The PA of the kinematic major axes as listed in Table 1 was obtained by minimising the difference between the SINFONI velocity fields and a bi(anti)symmetric model (for details, see Appendix C in Krajnović et al., 2006). Within the uncertainties, the values are in good agreement with the PA of the photometric major axis, at least inside the SINFONI field of view. Unfortunately, the limited S/N of our data does not allow a reliable check for small misalignments and twists in the velocity fields that might be indicative for the presence of a stellar bar.
Because is generally the most prominent emission line in our data, we used it for an estimate of the ionized gas kinematics. Our analysis of the velocity fields yields results similar to those derived from the stellar kinematics. In all cases, velocity gradients within the nuclear rings are smooth and the ionized gas has the same sense of rotation as the stars. Given the limited spatial coverage of the emission, we are unable to determine whether the ionized gas is kinematically misaligned with respect to either the stellar rotation field or the photometric major axis.
In their analysis of NGC 1079, Maoz et al. (1996) noted that the gas inside the ring rotates faster than the stars at the same radius. Our observations confirm this result for all our objects: despite the limited spatial coverage of our velocity field, it is clear from the relevant panels in Figures 1 to 5 that the gas generally reaches higher velocities at both ends of the ring. This can be understood from the dissipative nature of the gas: because the kinetic energy of the gas is conserved, the rotation velocity increases while the dispersion decreases. As a consequence, any random motion in the z-direction is quickly dampened, and the gas settles in a thin disk.
As mentioned in § 3.1.2, the case of NGC 613 warrants special attention, because the ionized gas is clearly disturbed by the radio jet. This is illustrated by the “twisting” of the isovelocity contours at the ends of the jet, and the increased velocity dispersion of the surrounding gas as seen most clearly in the dispersion map of the line presented in Figure 6.
Two of our targets (NGC 613 and NGC 1300) are also present in the sample of Batcheldor et al. (2005) who derived stellar velocity fields for 23 spirals from integral-field observations over a comparable field of view, albeit at optical wavelengths. While their results for NGC 613 agree well with ours, both in shape and amplitude of the stellar kinematics, there are significant differences for NGC 1300. More specifically, the stellar rotation field of Batcheldor et al. (2005) (their Figure 3) appears “flipped” by with respect to ours, i.e. it rotates in the opposite sense. We also note that their optical continuum map seems rotated by . We believe that the maps presented in this study have the correct orientation, based on the comparison with the map of Knapen et al. (2006) which agrees very well with our map.
3.7 Near-Infrared spectra of the nuclei
In general, the nuclei (i.e. the central ) of our sample galaxies appear rather quiescent. Except for NGC 613, which we will discuss in more detail below, the NIR spectra of the nuclei in Figures 1 to 5 show little, if any, evidence for NIR emission lines. There is faint nuclear and emission apparent in the line maps of NGC 1300 (Figure 3), as well as some emission in IC 1438 nucleus (Figure 5). However, since these emission lines are not detected in the respective spectra, the apparent emission is likely a residual due to imperfect continuum subtraction. In Table 4, we therefore list only upper limits for the emission line fluxes from the galaxy nuclei (except for and in NGC 613).
The lack of gaseous emission lines is not unexpected in a scenario in which gas accumulates at the nucleus over time until a critical density is reached. Star formation is then triggered, but can continue only until the gas supply is consumed or the energetic outflow from supernovae explosions disrupts and/or expels the gas, thus “quenching” star formation. This scenario is entirely consistent with observations, at least for late-type spirals: only about 10% of nuclear star clusters currently show emission lines, although most of them harbor a young stellar population less than 100 Myrs old (Walcher et al., 2006; Rossa et al., 2006). This can only be explained if star formation in galactic nuclei is episodic in nature, with a duty cycle of about 10%.
This scenario appears to be supported by the case of NGC 613. The NIR spectrum of its nucleus shows several strong emission lines from the molecule, as well as strong emission from at . However, the recombination line is not detected at our sensitivity limit, implying that star formation does not currently take place. This implies that while molecular gas is present in the nucleus, it has not sufficiently cooled to reach the critical density for star formation. The most likely excitation mechanism for both and in the nucleus of NGC 613 is the mechanical energy delivered by the AGN outflow. In the case of , this is different from the hot spots in the ring, where it is more likely produced by supernova remnants. In paper II, we will conduct a more detailed analysis of the physical state of the emission line gas in the nucleus of NGC 613.
4 Discussion: how does star formation proceed along a ring?
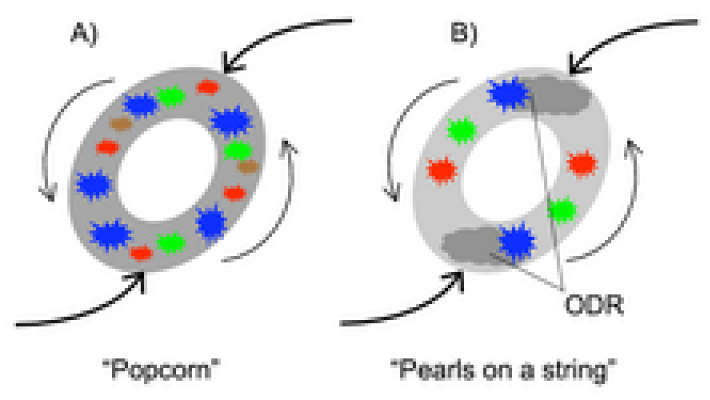
The basic picture of star formation rings being the consequence of gas responding to a bar-shaped potential is generally accepted, and is nicely illustrated e.g. in Athanassoula (1992): dynamical resonances associated with the non-axisymmetric rotating bar potential cause the orbiting gas to lose angular momentum and thus “spiral” towards the nucleus. In the process, the gas is concentrated in two elongated and curved dust lanes along the leading sides of the bar. In optical images, it appears as if the dust lanes connect the end of the bar to the nuclear ring. When observed at high angular resolution, the “ring” actually more closely resembles two tightly wound spiral arms. At the “contact points” between the dust lanes and the ring, the gas becomes less turbulent, and enters the almost circular orbits delineating the ring. While it is clear that there is abundant (molecular) gas throughout the ring, there is some debate about how and where star formation occurs. At least two mechanisms are plausible as illustrated in Figure 7, which we briefly describe in the following.
4.1 “Popcorn” or “Pearls on a String”?
In the first scenario, the gas accumulates along the ring, until a critical density is reached. Presumably driven by turbulence (Elmegreen, 1994), the ring then becomes unstable to gravitational collapse, and star formation is induced. In this model, either the entire ring structure begins to form stars at the same time, or individual hot spots collapse at random times and locations within the ring. Either way, there should be no systematic age sequence of hot spots along the ring. Because of its stochastic nature, we call this the “popcorn model” of star formation.
In the second scenario, a short-lived, quasi-instantaneous “delta burst” of star formation is induced in (and only in) a well-defined region along the ring where the gas density becomes sufficiently high to ignite star formation. The precise location of this “overdensity region” (ODR) depends on the details of the potential, but it is often found close to, and somewhat downstream from where the gas enters the ring, as illustrated e.g. in Figure 15 of Regan & Teuben (2003).
A young cluster that has formed at this location will continue its orbit along the ring, but star formation will cease as soon as the first supernova explosions expel the gas, i.e. after a few million years. Because the gas entering the ring is intrinsically clumpy, a series of short-lived starbursts will be triggered at the ODR. After star formation ends, the cluster will age passively as it follows its orbit. A series of such events will then produce a sequence of star clusters that enter the ring like “pearls on a string”. In this scenario, the star clusters should show a bi-polar age gradient around the ring, with the youngest clusters found close to the ODR, and increasingly older cluster ages in the direction of rotation, up to the opposite ODR. Because the age differences are simply due to the travel time along the ring, they should be consistent with the observed velocities of gas and stars in the ring, a question we briefly discuss in 4.3.
Evidence for such age gradients has been found in a few cases. The most convincing case is the nuclear ring in M 100, for which Ryder et al. (2001) and Allard et al. (2006) used NIR and optical absorption indices and emission lines to determine the stellar ages of the hot spots in the star formation ring. Smith et al. (1999) have claimed evidence for sequential star formation in the nuclear ring of NGC 7771 from the ratio of NIR to radio continuum. Moreover, Davies et al. (1998) have estimated the ages of individual hot spots in the ring of NGC 1068, based on the equivalent width of the emission. Although these authors do not specifically comment on this, their Table 2 shows hints for a bi-polar age gradient also in this star formation ring, although the age differences appear too small to be significant. Finally, Mazzuca et al. (2007) find evidence for such age gradients in 10 star formation rings out of a sample of 21.
4.2 A new method for estimating hot spot ages
In general, measuring the stellar cluster ages along the ring is difficult, even in a relative sense. The studies mentioned above have relied either on stellar absorption indices or equivalent width (EW) measurements of hydrogen recombination lines. The advantage of both diagnostics is that they are insensitive to extinction (but not to continuum emission from hot dust). According to the STARBURST99 models (Leitherer et al., 1999), the equivalent width of hydrogen recombination lines produced in an instantaneous burst is more or less constant until about 3 Myrs after the burst, and then drops steeply with time. It falls below the detection limit (about 1 Å) of typical observations after only 10 Myrs. Using e.g. the EW of is therefore limited to clusters in the age range , and any inferred age differences are small (few Myrs) by definition.
Moreover, there is a fundamental difficulty with this kind of analysis: it requires accurate knowledge of the continuum emission from the hot spot itself, i.e. after subtraction of the underlying bulge and/or disk. In the centers of spiral galaxies, this separation between hot spot and bulge/disk is extremely difficult. The continuum emission from the bulge/disk is at least as bright as that from the hot spot itself and often much brighter, especially at NIR wavelengths where the light from evolved stars dominates. Because of the small field of view of integral field units, it is normally not possible from the data itself to disentangle the various components. Accurate continuum subtraction therefore often has to rely on uncertain assumptions on the galaxy structure. While the intrinsic symmetry of the bulge/disk will reduce the error for relative age measurements, estimating absolute ages of young clusters in circumnuclear star formation rings using absorption indices or emission line EWs is clearly fraught with uncertainty.
Here, we use an alternative approach to obtain at least a qualitative sense for whether or not the young clusters in the ring show systematic relative age gradients. Instead of EWs, we use the flux of three emission lines that are prominent in the NIR spectra of star forming regions: , , and . Because line fluxes are independent of the underlying continuum level, they can be measured accurately555None of the emission lines discussed here is significantly affected by possible stellar absorption features “underneath” the line. In fact, we did subtract the best-fitting mix of stellar templates before measuring the line fluxes listed in Table 4. However, this made little or no difference to obtaining fluxes from the spectra directly (i.e. without prior subtraction of the stellar continuum). without any knowledge of the disk/bulge structure. The assumption here is that the emission lines are produced only in the ring itself, i.e. that the underlying bulge/disk can be considered quiescent. Given that the line maps in Figs. 1 to 5 show very little, if any, emission outside the ring proper, this seems a rather safe assumption for our targets.
As mentioned in § 3, the and lines are both produced by photo-ionization in the Strömgren-spheres around O- or B-type stars. Because the line has a higher ionization energy than , it requires the presence of hotter and more massive stars, and hence its flux falls off more rapidly after an instantaneous burst of star formation than that of . The ratio of to flux can thus be used as a qualitative age indicator for cluster ages, in the sense that younger clusters still harbor hotter stars, and thus show more emission. We emphasize that that this is a qualitative statement only, and that we make no attempt to use the / ratio to derive absolute ages, because the detailed interpretation of this line ratio is complicated (Doherty et al., 1995; Lumsden et al., 2001).
Assuming that all clusters have a similar initial mass function (IMF), and are sufficiently massive for statistical variations in stellar inventory to be insignificant, this diagnostic is useful for cluster ages up to about . Around that time, the supernova rate for an instantaneous burst reaches its maximum (Leitherer et al., 1999). As described in § 3, the fast shock fronts associated with these supernovae are efficient in creating the extended partially ionized zones that produce strong emission. Relative to and (which both have subsided significantly by this time), the line becomes dominant for ages above .
The range of cluster ages probed by this approach is , when the supernova rate drops almost instantaneously (Leitherer et al., 1999). This time scale is significantly larger than that probed by EW measurements, and is well matched to the expected travel time of gas and star clusters around the ring: with a rotation velocity of , it would take about to complete a half orbit for a ring diameter of . As can be seen from Table 3, most of the rings in our sample are even smaller than this. The typical rotation velocities of the gas (which better probes the ring material) are of order (see the velocity maps of or the stars in Figures 1 to 5, and so it is entirely plausible that any age differences probed by these emission lines are indeed reflecting the travel times of clusters on their orbit along the ring.
Finally, we note that for these relatively short orbital timescales, the ring diameter can be regarded as constant. While Regan & Teuben (2003) have shown that nuclear rings become smaller over time due to dissipation of angular momentum, this occurs over timescales of hundreds of Myrs, and thus can be ignored for the the present discussion.
4.3 Application to the data
In order to look for evidence of systematic age gradients as predicted by the “pearls on a string” scenario described in § 4.1, we first need to identify the location of any ODRs, if present. This is not a straightforward task, because maps and velocity fields of the molecular gas are difficult to obtain, especially for sources in the southern hemisphere, and reach the required resolution only in a few nearby galaxies (e.g. Schinnerer et al., 2003, 2006). Lacking molecular gas observations, the best approach is to use high spatial resolution maps of the dust morphology, as demonstrated by Martini et al. (2003). We have therefore searched the HST archive for optical images. Whenever such imagery was available, we identified dust lanes, their intersection with the ring, and any region(s) of high extinction along the ring that could plausibly be identified with an ODR. In cases where only one ODR was obvious, we have assumed that the second is located on the opposite side of the ring.
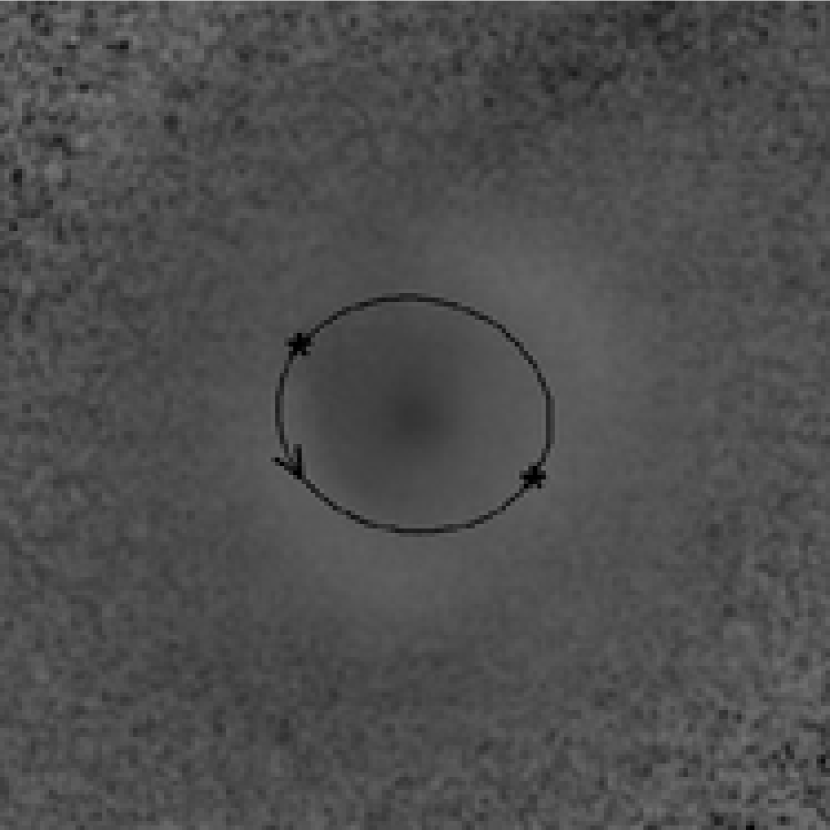
Figure 8 shows the case of NGC 613. The left panel contains the HST/WFPC2 V-band (F606W) image of the central . Two prominent dust lanes are easily identified, and the inferred approximate locations of the ODRs are marked by star symbols. Note that the small size of the symbols certainly does not imply a positional accuracy, but merely indicates a rough estimate. In fact, the ODRs can be quite extended as demonstrated in the simulations of Regan & Teuben (2003).
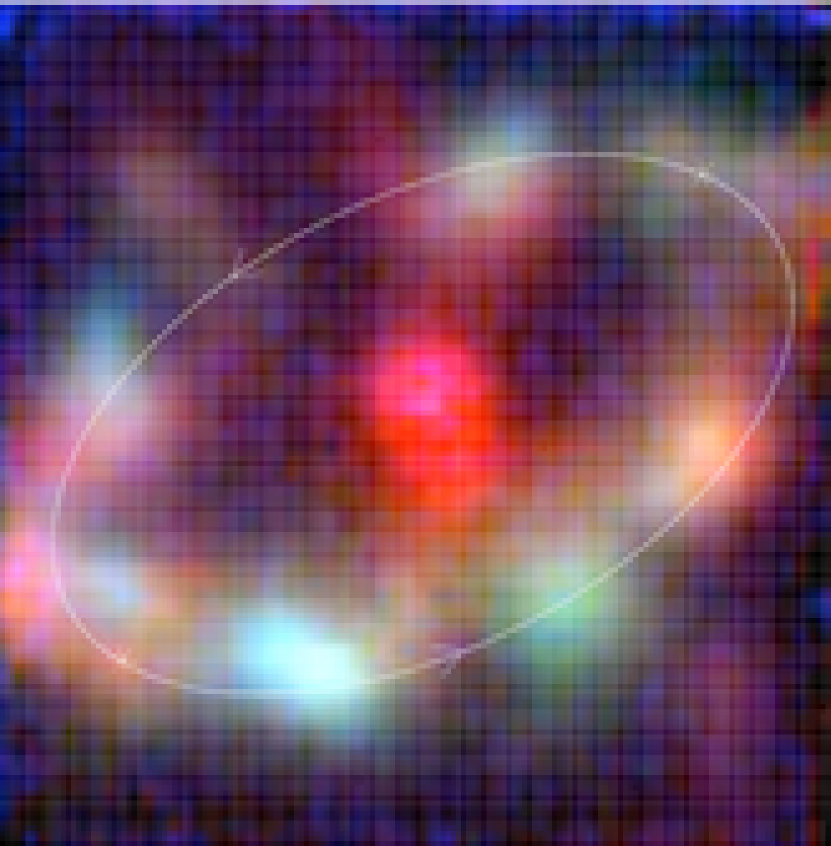
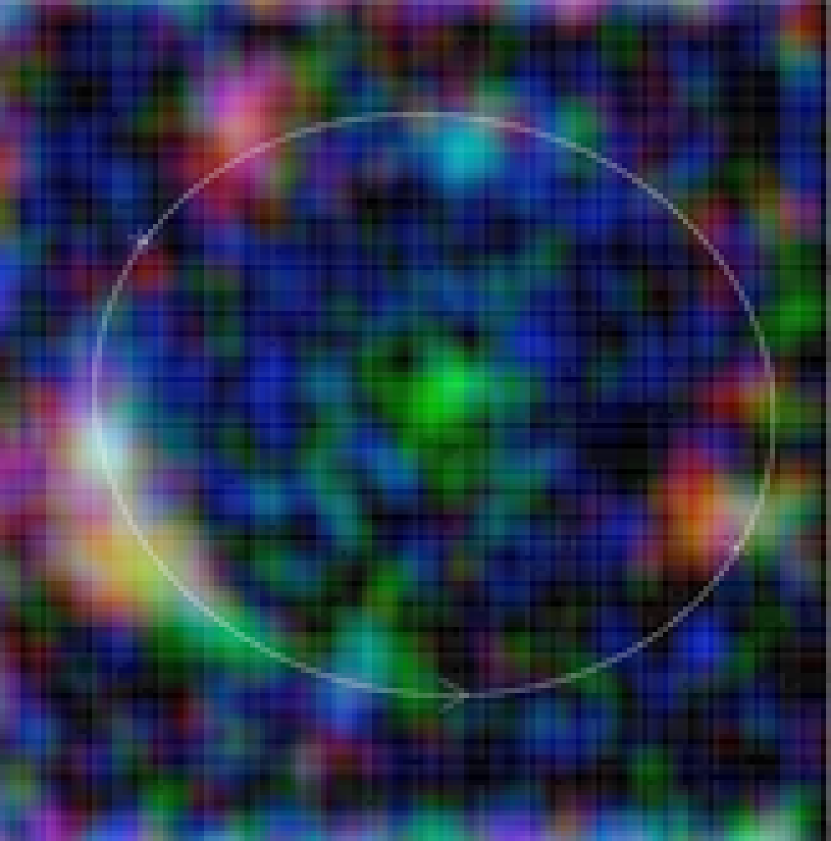
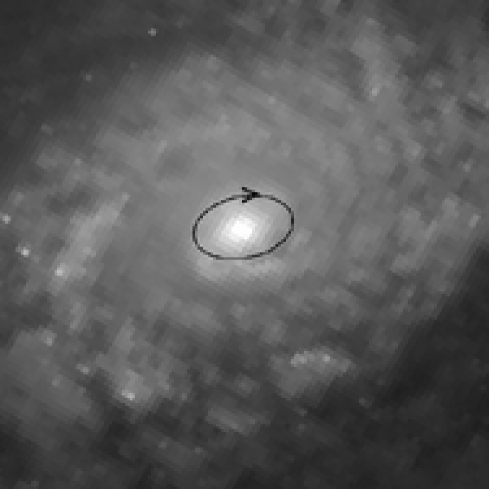
In both panels, the star formation ring is indicated by an ellipse with the ring parameters as listed in Table 3. Here, and for all other galaxies, the sense of rotation was determined by assuming that the outer spiral arms are trailing. In the right panel, we present a false-color (RGB) image constructed from the SINFONI emission line maps of , , and , assigned to the blue, green, and red color channel, respectively.
At least for the southern half of the ring, the color map appears to show the exact trend predicted by the “pearls on a string” scenario: starting at the ODRs, and moving in the direction of the gas flow, the color sequence is blue-green-red. As discussed in § 4.2, this is exactly as expected if the clusters age passively along their orbits. The trend is less pronounced in the northern half of the ring, but here the picture is complicated by the strong mechanical interaction between the jet and the ring. It is possible that any cluster located within the “gap” at P.A. has been stripped of its gas, and thus does not show up in the line maps, even though it might be relatively young.
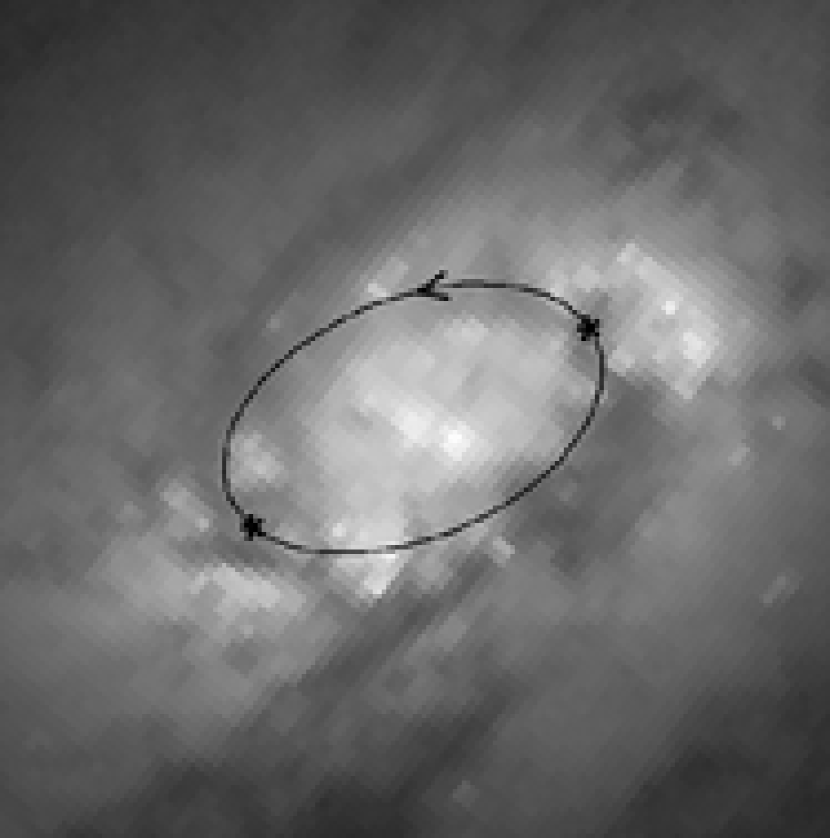
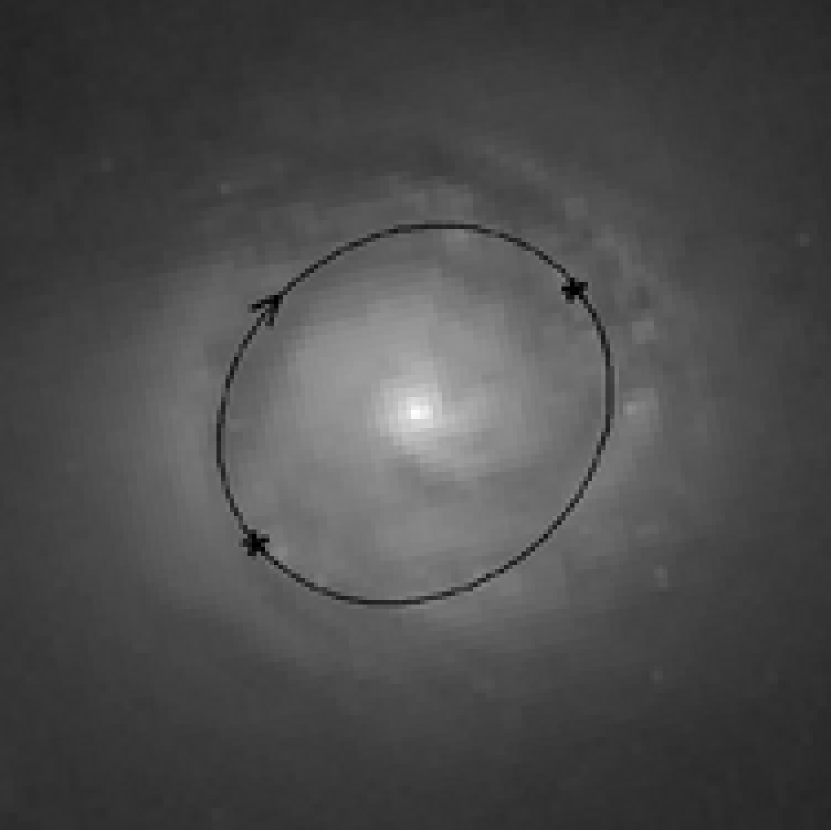
For a variety of reasons, the corresponding analyis for the other sample galaxies yields a somewhat less convincing picture. The case of IC 1438, presented in Figure 9, suffers from the fact that is has never been imaged with HST. In order to gain insight into the dust morphology, we therefore used the B- and I-band ground-based images presented in Knapen et al. (2006) to create a B-I “pseudo” color map666The term “pseudo” is used here because no reliable magnitude scale can be attributed to the color map presented in Figure 9. The reason is that a careful sky subtraction was not possible for the Knapen et al. (2006) images because most galaxies completely filled the field of view of the CCD used. Nevertheless, the map is still valid in a relative sense, and can be used to identify “redder” regions that likely have higher extinction.. While the ring stands out as very blue in B-I (i.e. bright in Figure 9), outside the ring the dust morphology is rather smooth. The only discernible structure is a faint region of higher extinction north of the nucleus which we interpret as the arm of a gas spiral. We also assume that one ODR is located close to the intersection of this spiral and the ring, and that the other lies opposite to it. With these - admittedly rather uncertain - assumptions, however, the picture for IC 1438 is similar to that for NGC 613: peaks close to the eastern ODR, while is strong in clusters that have traveled a good distance around the ring.
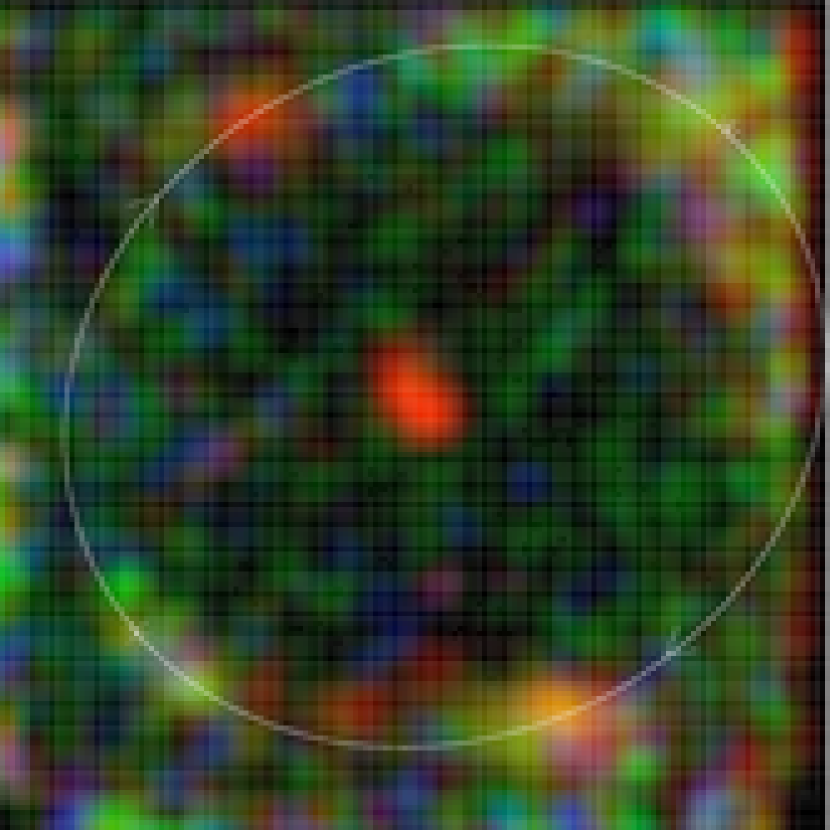
The case of NGC 1300 is presented in Figure 10. Because only one OB was executed for this object, the quality of the SINFONI line maps is less than optimal. This is particularly true for the map which only shows tentative evidence for two emission peaks at P.A. and . Intriguingly, however, this is exactly where one would place the ODRs based on the dust morphology derived from the HST/WFPC2 F606W map. Again, emission peaks are located far from the assumed ODRs.
Figure 11 shows the false color map of the emission line morphology in the ring of NGC 1079. For this galaxy, there is neither HST imagery available, nor was it possible to identify any structure from a “pseudo” color map as described for IC 1438. We therefore are unable to estimate the location of the ODRs, and therefore cannot use this galaxy to test for a systematic age gradient along the ring.
Finally, the case of NGC 5248 does not appear to be a valid test of the proposed scenario because it has two nested rings, the larger one of which falls mostly outside the SINFONI field of view (but can be recognized in the line maps of Figure 4). Because any gas falling onto the inner ring must first pass through the outer ring, and will be disturbed by star formation in the outer ring, the gas dynamics in NGC 5248 are likely very different from those in the other galaxies. This is possibly the reason why the dust morphology as shown in Figure 12 also appears different from that in the cases dicussed above. NGC 5248 harbors a “flocculent” nuclear dust spiral without any clearly defined dust lanes (Laine et al., 2001). Because of the lack of dominant dust features, we were unable to determine the location of any putative ODRs.
In summary, three of the five galaxies in our sample show line ratios that appear consistent with the “pearls on a string” scenario of how star formation progresses in nuclear rings. The data for the remaining two galaxies are incomplete, but not inconsistent with either model.
4.4 Comparison to other studies
Our findings lend some support to a picture in which young stars in nuclear starburst rings predominantly form in two distinct regions close to the “contact points” between the dust lanes and the ring. This is consistent with observations of the molecular gas distribution in the nuclei of barred galaxies which often shows a “twin peaks” geometry (e.g. Kenney et al., 1992). This implies that cold molecular gas (i.e. the star formation fuel) exists only in two locations along the ring. Other studies claiming evidence for an age sequence of hot spots in nuclear rings have been mentioned in § 4.1. On the other hand, Maoz et al. (1996) have found that the starburst rings in NGC 1079 and NGC 5248 experienced star formation over several . This apparent contradiction might be explained by taking into account the dynamical timescales. As discussed in section 4.1, it takes as little as for a stellar cluster in the ring to rotate around half the ring. Therefore, several generations of stellar clusters will mix and overlap after typically . These older clusters are still prominent in broad band images (but not in the emission line maps discussed here). Using color diagnostics therefore might lead to a picture of “random” star formation in the ring, even if the “pearls on a string” scenario is correct. This highlights the importance of using age diagnostics that are well-matched to the orbital time scales.
5 CONCLUSIONS
Based on high-resolution NIR integral-field observations of five nuclear star formation rings, we have presented their emission line morphologies and velocity structure both in gas and stars. We have introduced a new method to derive relative hot spot ages along the rings using the relative strengths of the , , and lines. We employ this method to investigate the plausibilty of two competing scenarios for the way star formation is induced in nuclear rings, namely i) the “popcorn” model in which hot spots appear stochastically around the ring, and ii) the “pearls on a string” scenario in which star formation is triggered predominantly at two overdensity regions on either side of the ring. Only the latter predicts a well-ordered age sequence of hot spots along either half of a ring.
The data presented in this study provide tentative support for the “pearls on a string” scenario, in that three out of five sample galaxies show some evidence for an age gradient of hot spots along the ring, while the remaining two galaxies have incomplete information and thus are consistent with either model.
Of course, it might well be that star formation proceeds differently in some rings than in others. However, given that nuclear rings appear to form via a common mechanism (i.e. the gas response to a bar-shaped potential), it is not unreasonable to expect that they also follow a common path for inducing star formation. The small number of objects described here is clearly insufficient to provide reliable statistics, and similar studies of larger galaxy samples are needed to decide whether a particular mechanism governs the star formation in the majority of nuclear rings. Be that as it may, the proposed method of using NIR line ratios to estimate relative ages of young star clusters has been demonstrated to be a powerful tool for studies along this line.
References
- Aguerri et al. (2000) Aguerri, J. A. L., Muñoz-Tuñón, C., Varela, A. M., & Prieto, M. 2000, A&A, 361, 841
- Allard et al. (2006) Allard, E. L., Knapen, J. H., Peletier, R. F., & Sarzi, M. 2006, MNRAS, 371, 1087
- Athanassoula (1992) Athanassoula, E. 1992, MNRAS, 259, 345
- Atkinson et al. (2005) Atkinson, J. W. et al. 2005, MNRAS, 359, 504
- Batcheldor et al. (2005) Batcheldor, D. et al. 2005, ApJS, 160, 76
- Black & van Dishoeck (1987) Black, J. H., & van Dishoeck, E. F. 1987, ApJ, 322, 412
- Böker et al. (1999) Böker, T., et al. 1999, ApJS, 124, 95
- Böker et al. (2002) Böker, T., Laine, S., van der Marel, R. P., Sarzi, M., Rix, H.-W., Ho, L., & Shields, J. C. 2002, AJ, 123, 1389
- Bonnet et al. (2004) Bonnet, H. et al. 2004, The ESO Messenger, 117, 17
- Brough et al. (2006) Brough, S., Forbes, D. A., Kilborn, V. A., Couch, W., & Colless, M. 2006, MNRAS, 369, 1351
- Buta & Combes (1996) Buta, R. & Combes, F. 1996, Fund. Cosmic Physics, 17, 95
- Cappellari & Emsellem (2004) Cappellari M., & Emsellem E. 2004, PASP, 116, 138
- Cappellari & Copin (2003) Cappellari M., & Copin Y. 2003, MNRAS, 342, 345
- Combes & Gerin (1985) Combes, F., & Gerin, M. 1985, A&A, 150, 327
- de Vaucouleurs et al. (1991) de Vaucouleurs, G., de Vaucouleurs, A., Corwin, H., Buta, R. J., Paturel, G., & Fouque, P. 1991, Third Reference Catalogue of Bright Galaxies (New York:Springer)
- Davies et al. (1998) Davies, R. I., Sugai, H., & Ward, M. J. 1998, MNRAS, 300, 388
- Davies (2007) Davies, R. I. 2007, MNRAS, 375, 1099
- Doherty et al. (1995) Doherty, R. M., Puxley, P. J., Lumsden, S. L., & Doyon, R. 1995, MNRAS, 277, 577
- Doyon et al. (1994) Doyon, R., Joseph, R.D. & Wright, G.S. 1994, ApJ, 421, 101
- Eisenhauer et al. (2003) Eisenhauer, F. et al. 2003, SPIE, 4841, 1548
- Elmegreen et al. (1997) Elmegreen, D. M., Chromey, F. R., Santos, M., & Marshall, D. 1997, AJ, 114, 1850
- Elmegreen (1994) Elmegreen, B. G. 1994, ApJ, 425, L73
- Englmaier & Shlosman (2000) Englmaier, P., & Shlosman, I. 2000, ApJ, 528, 677
- Eskridge et al. (2002) Eskridge, P. B. et al. 2002, ApJS, 143, 73
- Erwin (2004) Erwin, P. 2004, A&A, 415, 941
- Falcón-Barroso et al. (2008) Falcón-Barroso, J. et al. 2008, in prep. (paper II)
- Fukuda et al. (1998) Fukuda, H., Wada, K., & Habe, A. 1998, MNRAS, 295, 463
- Fukuda et al. (2000) Fukuda, H., Habe, A., & Wada, K. 2000, ApJ, 529, 109
- García-Burillo et al. (2005) García-Burillo, S., Combes, F., Schinnerer, E., Boone, F., & Hunt, L. K. 2005, A&A, 441, 1011
- García-Gómez et al. (2002) García-Gómez, C., Athanassoula, E., & Barberà, C. 2002, A&A, 389, 68
- Genzel et al. (1995) Genzel, R., Weitzel, L., Tacconi-Garman, L. E., Blietz, M., Cameron, M., Krabbe, A., Lutz, D., & Sternberg, A. 1995, ApJ, 444, 175
- Heller & Shlosman (1996) Heller, C. H., & Shlosman, I. 1996, ApJ, 471, 143
- Hollenbach & McKee (1989) Hollenbach, D., & McKee, C. F. 1989, ApJ, 342, 306
- Hummel et al. (1987) Hummel, E., Jörsäter, S., Lindblad, P. O., & Sandqvist, A. 1987, A&A, 172, 51
- Hummel & Jörsäter (1992) Hummel, E., & Jörsäter, S. 1992, A&A, 261, 85
- Jogee et al. (2002a) Jogee, S., Shlosman, I., Laine, S., Englmaier, P., Knapen, J. H., Scoville, N., & Wilson, C. D. 2002a, ApJ, 575, 156
- Jogee et al. (2002b) Jogee, S., Knapen, J. H., Laine, S., Shlosman, I., Scoville, N., & Englmaier, P. 2002b, ApJ, 570, L55
- Jungwiert et al. (1997) Jungwiert B., Combes F., & Axon D.J. 1997, A&AS, 125, 479
- Kenney et al. (1992) Kenney, J. D. P., Wilson, C. D., Scoville, N. Z., Devereux, N. A., & Young, J. S. 1992, ApJ, 395, L79
- Kennicutt et al. (1989) Kennicutt, R. C., Jr., Keel, W. C., & Blaha, C. A. 1989, AJ, 97, 1022
- Knapen et al. (1995) Knapen, J. H., Beckman, J. E., Heller, C. H., Shlosman, I., & de Jong, R. S. 1995, ApJ, 454, 623
- Knapen et al. (2002) Knapen, J. H., Pérez-Ramírez, D., & Laine, S. 2002, MNRAS, 337, 808
- Knapen et al. (2006) Knapen, J. H., Mazzuca, L. M., Böker, T., Shlosman, I., Colina, L., Combes, F., & Axon, D. J. 2006, A&A, 448, 489
- Kormendy & Kennicutt (2004) Kormendy, J. & Kennicutt, R. C. 2004, ARA&A, 42, 603
- Krajnović et al. (2006) Krajnović D., Cappellari M., de Zeeuw P. T., & Copin Y. 2006, MNRAS, 366, 787
- Labrie & Pritchet (2006) Labrie, K. & Pritchet, C. J. 2006, ApJS, 166, 188
- Laine et al. (1999) Laine, S., Knapen, J. H., Pérez-Ramírez, D., Doyon, R., & Nadeau, D. 1999, MNRAS, 302, 33
- Laine et al. (2001) Laine, S., Knapen, J. H., Pérez-Ramírez, D., Englmaier, P., & Matthias, M. 2001, MNRAS, 324, 891
- Lançon et al. (2007) Lançon A., Hauschildt P. H., Ladjal D., Mouhcine M. 2007, A&A, 468, 205
- Leitherer et al. (1999) Leitherer, C., et al. 1999, ApJS, 123, 3
- Lindblad & Kristen (1996) Lindblad, P. A. B. & Kristen H. 1996, A&A, 313, 733
- Lindblad et al. (1997) Lindblad, P. A. B., Kristen H., Jörsäter, S., & Högbom, J. 1997, A&A, 317, 36
- Lumsden et al. (2001) Lumsden, S. L., Puxley, P. J., & Hoare, M. G. 2001, MNRAS, 320, 83
- Lord (1992) Lord, S.D. 1992, NASA Technical Memor. 103957
- Maloney et al. (1996) Maloney, P. R., Hollenbach, D. J., & Tielens, A. G. G. M. 1996, ApJ, 466, 561
- Maoz et al. (1996) Maoz, D., Barth, A. J., Sternberg, A., Filippenko, A. V., Ho, L. C., Macchetto, F. D., Rix, H.-W., Schneider, D. P. 1996, AJ, 111, 2248
- Maoz et al. (2001) Maoz, D., Barth, A. J., Ho, L. C., Sternberg, A., & Filippenko, A. V. 2001, AJ, 121, 3048
- Martini et al. (2003) Martini, P., Regan, M. W., Mulchaey, J. S., & Pogge, R. W. 2003, ApJS, 146, 353
- Mazzuca et al. (2007) Mazzuca, L., Knapen, J. H. K., Veilleux, S. & Regan, M. W. 2007, ApJS, submitted
- Mouri et al. (2000) Mouri, H., Kawara, K., & Taniguchi, Y. 2000, ApJ, 528, 186
- Origlia et al. (1999) Origlia, L., Goldader, J. D., Leitherer, C., Schaerer, D., & Oliva, E. 1999, ApJ, 514, 96
- Pérez-Ramírez et al. (2000) Pérez-Ramírez, D., Knapen, J. H., Peletier, R., Laine, S., Doyon, R., & Nadeau, D. 2000, MNRAS, 317, 234
- Pickles (1998) Pickles, A. J. 1998, PASP, 110, 863
- Regan & Teuben (2003) Regan, M. W. & Teuben, P. 2003, ApJ, 582, 723
- Rossa et al. (2006) Rossa, J., van der Marel, R. P., Böker, T., Gerssen, J., Ho, L. C., Rix, H.-W., Shields, J. C., & Walcher, C.-J. 2006, AJ, 132, 1074
- Ryder et al. (2001) Ryder, S. D., Knapen, J. H., & Takamiya, M. 2001, MNRAS, 323, 663
- Sarzi et al. (2006) Sarzi M., et al. 2006, MNRAS, 366, 1151
- Satyapal et al. (2004) Satyapal, S., Sambruna, R. M., & Dudik, R. P. 2004, A&A, 414, 825
- Scarlatta et al. (2004) Scarlatta, C. et al. 2004, AJ, 128, 1124
- Schinnerer et al. (2003) Schinnerer, E., Böker, T., & Meier, D. S. 2003, ApJ, 591, L115
- Schinnerer et al. (2006) Schinnerer, E., Böker, T., Emsellem, E., & Lisenfeld, U. 2006, ApJ, 649, 181
- Schinnerer et al. (2007) Schinnerer, E., Böker, T., Emsellem, E., & Downes, D. 2007, A&A, 462, L27
- Smith et al. (1999) Smith, D. A., Herter, T., Haynes, M. P., & Neff, S. G. 1999, ApJ, 510, 669
- Tully (1988) Tully, R. B. 1988, Nearby Galaxies Catalog (Cambridge and New York: Cambridge University Press)
- Véron-Cetty & Véron (1986) Véron-Cetty, M.-P. & Véron, P. 1986, A&AS, 66, 335
- Walcher et al. (2006) Walcher, C. J., Böker, T., Charlot, S., Ho, L. C., Rix, H.-W., Rossa, J., Shields, J. C., & van der Marel, R. P. 2006, ApJ, 649, 692
| (1) | (2) | (3) | (4) | (5) | (6) | (7) | (8) | (9) | (10) | (11) |
| Galaxy | Type | Activity | scale | PA | PAkin | PAbar | ||||
| (Mpc) | (pc/′′) | (mags) | (∘) | (∘) | (∘) | (∘) | (′′) | |||
| NGC 613 | SB(rs)bc | Sy | 17.5 | 84.8 | -20.53 | 41 | 120 | 120 | 1271 | |
| NGC 1079 | SAB(r’l)a | 16.9 | 81.9 | -18.83 | 52 | 87 | 65 | 1221 | 321 | |
| NGC 1300 | SB(s)bc | 18.8 | 91.1 | -20.42 | 49 | 106 | 116 | 1002 | 942 | |
| NGC 5248 | SB(rs)bc | Sy2 HII | 22.7 | 110.1 | -21.07 | 44 | 110 | 105 | 1053 | 953 |
| IC 1438 | SAB(r)a | 33.8 | 163.9 | -20.08 | 32 | 145 | 158 | n.a. | n.a. |
| Galaxy | OB | Obs. date | SeeingaaThe atmospheric seeing was estimated from the FWHM of the K-band point spread function, measured from standard star observations during during the respective nights. These were normally scheduled within one hour from the galaxy exposures. [′′] | |
|---|---|---|---|---|
| 216155 | 17.11.2005 | 0.6 | ||
| 216157 | 13.11.2005 | 0.5 | ||
| NGC 613 | 125 | 216158 | 23.10.2005 | 0.5 |
| 216159 | 13.11.2005 | 0.5 | ||
| 216180 | 27.11.2005 | 0.6 | ||
| NGC 1079 | 50 | 216161 | 17.11.2005 | 0.6 |
| 216162 | 23.10.2005 | 0.5 | ||
| NGC 1300 | 25 | 216168 | 24.1.2006 | 0.6 |
| 216184 | 10.5.2006 | 0.7 | ||
| 216187 | 15.5.2006 | 0.6 | ||
| NGC 5248 | 125 | 216188 | 31.5.2006 | 0.7 |
| 216189 | 1.6.2006 | 0.5 | ||
| 216190 | 5.7.2006 | 0.5 | ||
| 216147 | 22.10.2005 | 0.7 | ||
| 216169 | 20.10.2005 | 0.6 | ||
| 216170 | 19.10.2005 | 0.5 | ||
| IC 1438 | 150 | 216171 | 19.10.2005 | 0.5 |
| 216176 | 20.10.2005 | 0.6 | ||
| 216278 | 22.10.2005 | 0.7 |
| Galaxy | [pc] | PA[deg] | |
|---|---|---|---|
| NGC 613 | 603 | 113 | 0.40 |
| NGC 1079 | 238 | 72 | 0.29 |
| NGC 1300 | 666 | 117 | 0.13 |
| NGC 5248 | 338 | 102 | 0.39 |
| IC 1438 | 1074 | 81 | 0.15 |
| Galaxy | He I | |||
|---|---|---|---|---|
| NGC 613 | ||||
| - ring | 46.5 | 136.5 | 80.5 | 184.2 |
| - nucleus | 0.5 | 1.1 | 6.1 | 11.8 |
| NGC 1079 | ||||
| - ring | 6.2 | 14.5 | 0.8 | 3.9 |
| - nucleus | 0.2 | 1.5a | 0.2 | 0.2 |
| NGC 1300 | ||||
| - ring | 2.2 | 19.6 | 22.5 | 15.5 |
| - nucleus | 0.2 | 0.2 | 1.1 | 1.1 |
| NGC 5248 | ||||
| - ring | 1.2 | 4.5 | 8.4 | 0.2 |
| - nucleus | 0.2 | 0.2 | 1.0 | 0.2 |
| IC 1438 | ||||
| - ring | 10.2 | 13.8 | 5.2 | 10.6 |
| - nucleus | 0.2 | 1.0 | 0.2 | 0.2 |
Note. — All fluxes are in units of . Typical uncertainties are about 20% .