Gravitational lensing
Abstract:
This is a short and biased review of gravitational lensing with emphasis on the radio and especially VLBI aspects. We briefly explain the basic idea and give a short sketch of the discovery of the first lens before we more systematically discuss the general fields that can be studied with lensing. We intentionally omit the details the average lensing expert would like to see and instead try to give a very general overview addressed to the radio astronomer working in some other field. The lens B0218+357 is presented as an example to show many aspects of lensing in a case that already has led to interesting results but still has additional potential for the future.
1 The idea
The idea that gravity might influence the propagation of light is much older than the EVN or even radio astronomy. Even Newton (1704) mentioned the possibility111“Do not bodies act upon light at a distance, and by their action bend its rays; and is not this action strongest at the least distance?”, but without going into any details. Henry Cavendish was the first to calculate deflections using the simplified model that light consists of classical particles moving with the speed of light, thus being weakly deflected in a gravitational field (see Will, 1988). Without knowing of this unpublished work, Soldner (1801) used a similar concept and wrote the first article about gravitational lensing. He found that the deflection angle (see Fig. 1) between the asymptotic light paths before and after an encounter with a mass at a distance is , where and are the gravitational constant and the speed of light, respectively. Before developing the theory of general relativity, Einstein (1911) used another approach that does not rely on the incorrect classical model of light but, instead, used the principle of equivalence to find the same result as Soldner. A few years later, our still best theory of gravitation was finished and Einstein (1915) could reconsider the deflection of light, finding that it should be twice as large as in non-relativistic theory:
| (1) |
This result was confirmed (with limited accuracy) by Eddington (1919), who determined the deflection of light caused by the Sun by measuring positions of stars close to its limb during a solar eclipse. This served as a first independent test of the new theory.

Almost all aspects of gravitational lensing theory can be derived from Eq. (1), together with the astrophysical background that is required to relate it to observable quantities. It is easy to see that in the presence of sufficiently large and compact masses, situations are possible where light from a background source reaches the observer along different light paths, which are then interpreted as multiple images of this source. Typical lenses show two or four images, which in very symmetrical systems merge to form rings around the lens, the so-called Einstein rings.
2 The first lensed double: 0957+561
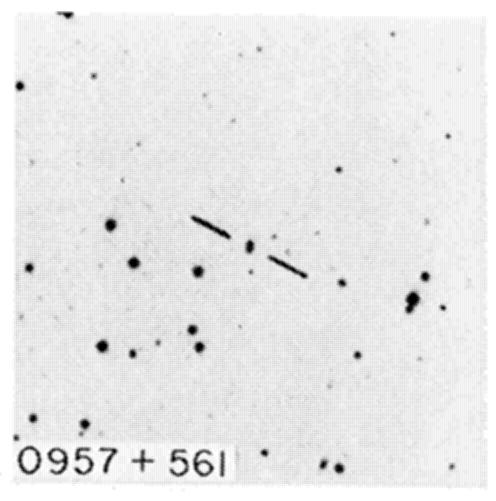
This radio source (without knowing about its lensed nature at that time) was discovered in a 966-MHz survey made with the Jodrell Bank MkIA telescope. One of the sources in that survey, 0958+56, was a blend of the spiral galaxy NGC 3079 with the new source 0957+561. The latter had an optical identification as two point-like images with a separation of about (Porcas et al., 1980, and Fig. 2, left).
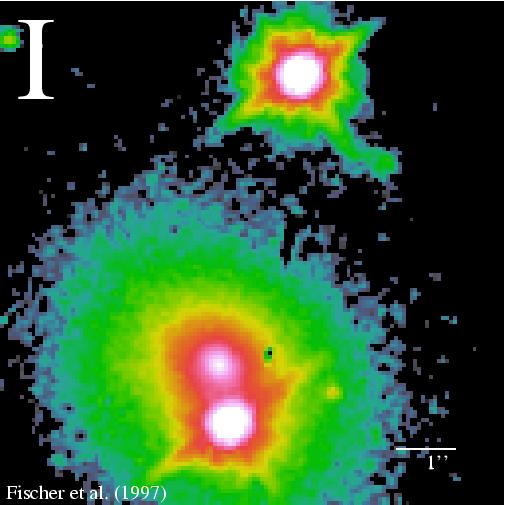
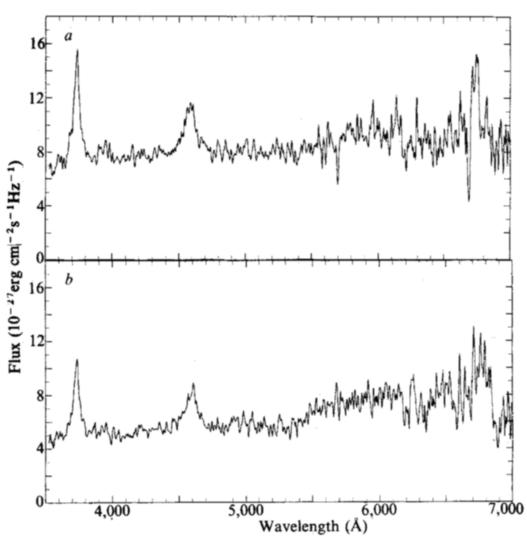
Optical spectra of the two images appeared like almost identical copies of a QSO spectrum with a redshift of . Since a chance alignment of so similar objects with such a close separation is extremely unlikely, the favoured interpretation was (and still is) that we see two gravitationally lensed images of one and the same source (Walsh et al., 1979). Many interesting (and amusing) details of the first discovery, including a description of all coincidences that had to conspire to allow the success, are described by Walsh (1989).
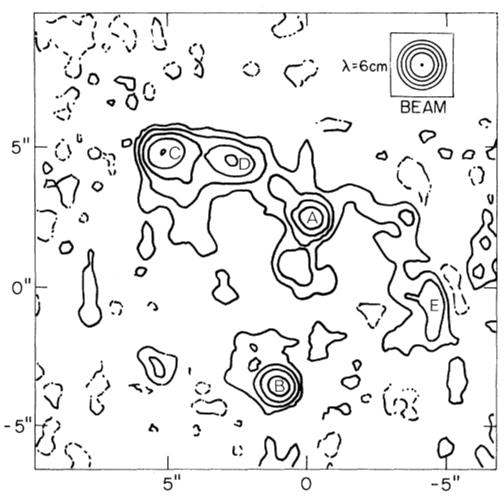
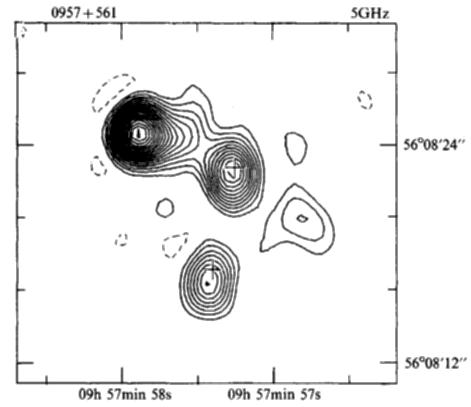
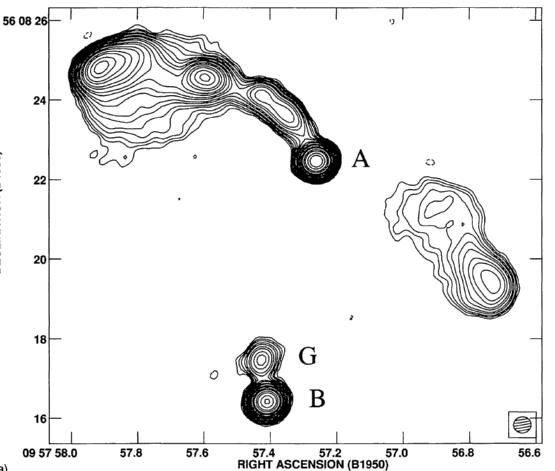
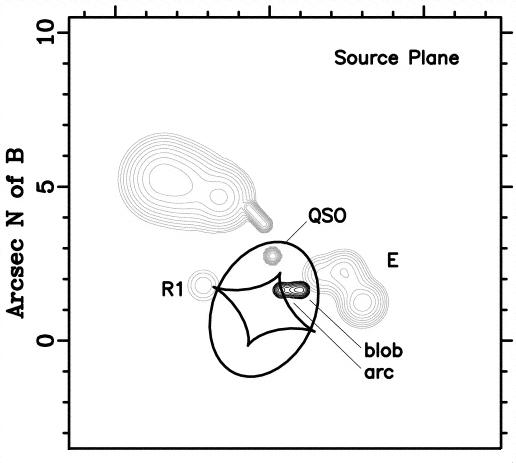
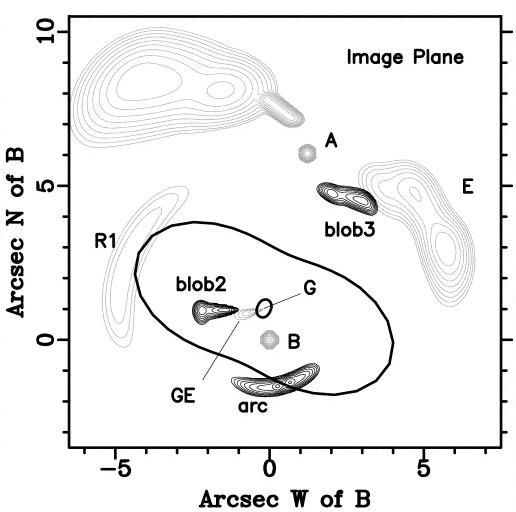
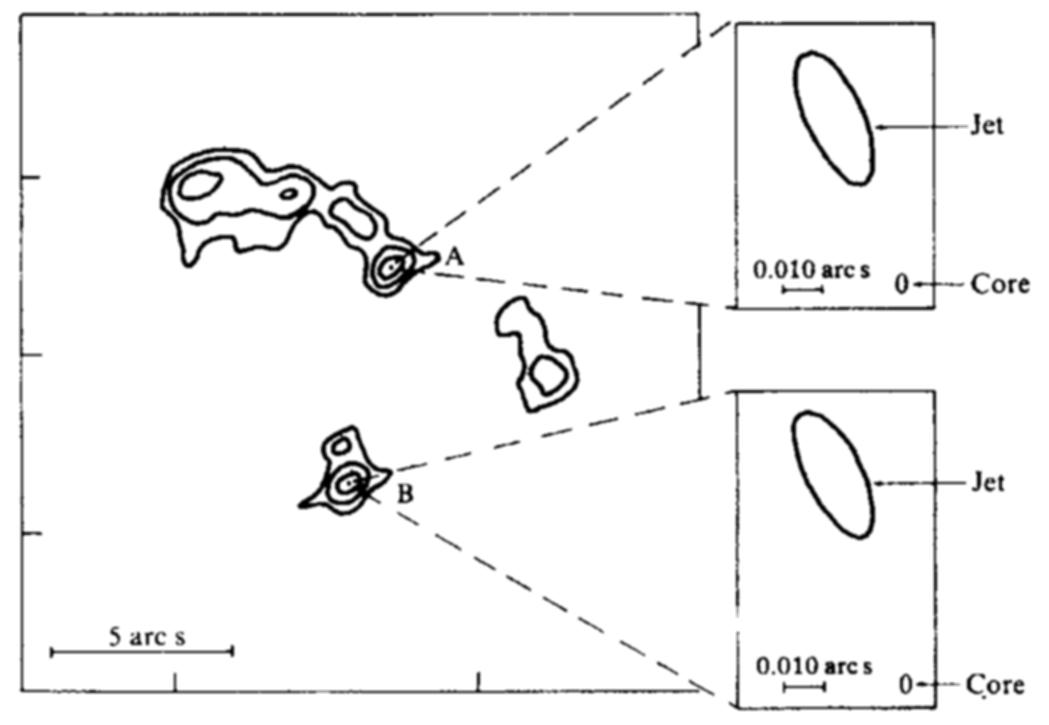
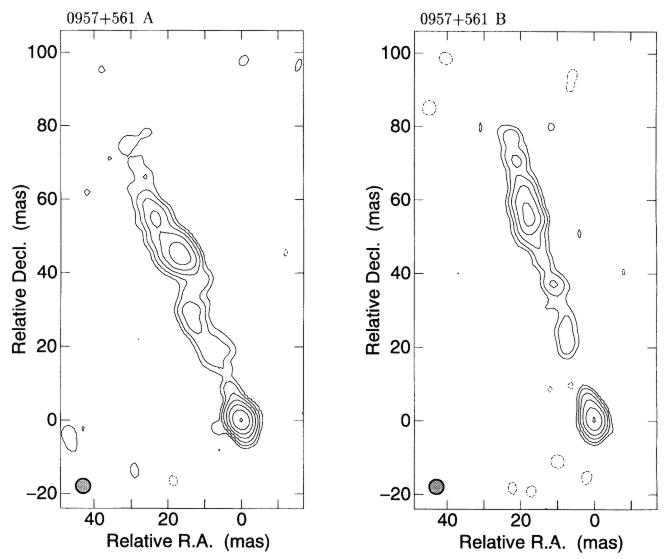
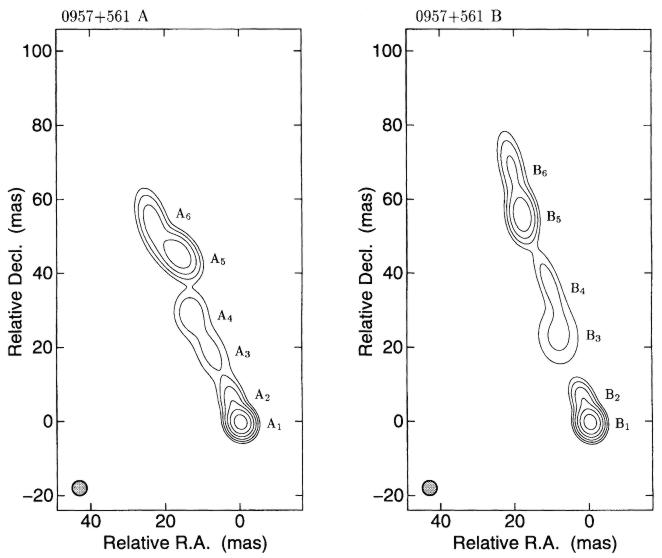
Doubts were expressed by Roberts et al. (1979) when first interferometric observations showed the complicated structure of the double radio source (see Fig. 3). The A image seems to show a jet and radio lobes and one could naively expect that the same should be true for B if both are really lensed images of one source. In the maps, on the other hand, image B looks perfectly point-like. However, Fig. 4 illustrates how different parts of the source may well be lensed with different multiplicity. The specific situation for 0957+561 is shown in Fig. 5.


3 First VLBI observations of lenses
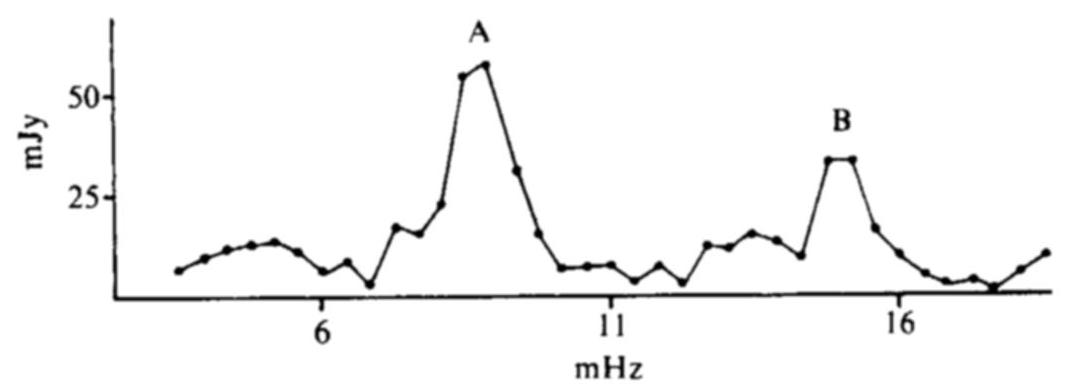
Naturally, the first discovered lens was also the first target for VLBI observations (Fig. 6). In the fringe-rate spectrum, we see two peaks corresponding to the two images A and B, which thus both must have compact structure on scales below 20 mas. The first multi-component model fits show that both images have a very similar structure, consisting of a compact core component and an elongated feature that probably corresponds to a jet. These jets show many details in VLBI maps produced later.
It is impressive to see how far VLBI has evolved from simple fringe-rate spectrum plots to detailed maps of gravitational lenses. The first observations also show that real science can be done with only one VLBI baseline.

4 Fields of study
After this introduction, we come to a more systematic discussion of the several topics that can be studied with gravitational lensing. Fig. 7 schematically shows a typical lensing scenario with multiple images of one source.

4.1 Lenses as natural telescopes
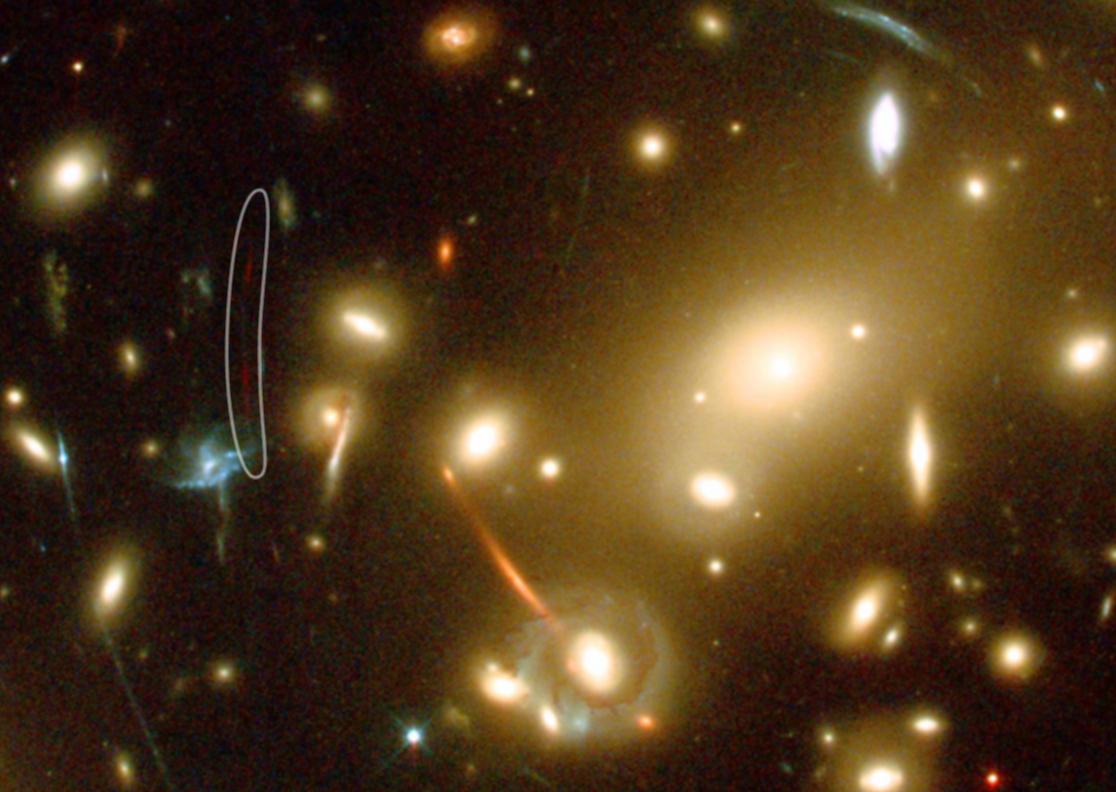
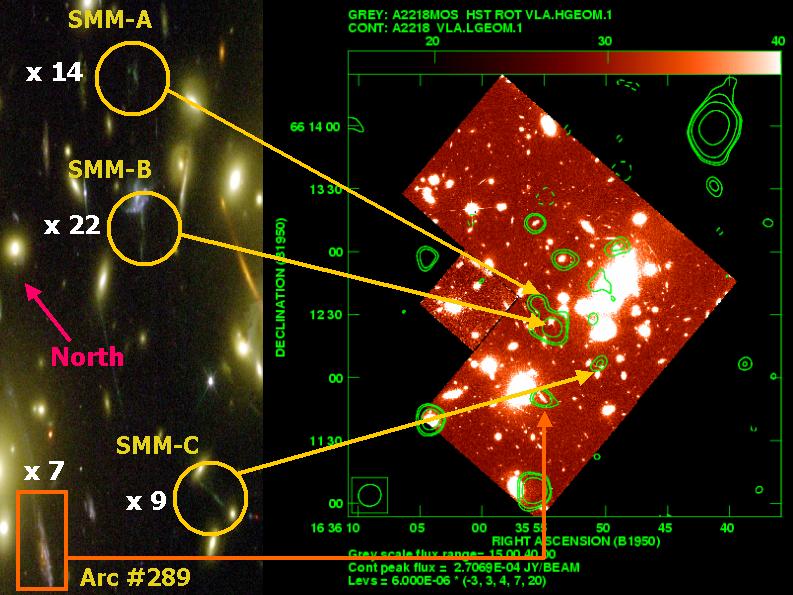
The lens effect can be utilised to extend the capabilities of our instruments because it provides additional magnification and corresponding flux amplification, and in this way boosts the effective resolution and sensitivity of observations. Clusters of galaxies provide the largest lensing cross-sections and are thus the primary of these natural telescopes. Two examples are shown in Figs. 8 and 9. In one case, the amplification made it possible to detect a distant galaxy at and observe its optical spectrum. In the others, the lensing amplification enhances weak, background star-forming galaxies that have first been found at sub-mm wavelength above the radio detection limit. Without the lenses, current radio telescopes would not be sufficiently sensitive to study these objects at all.
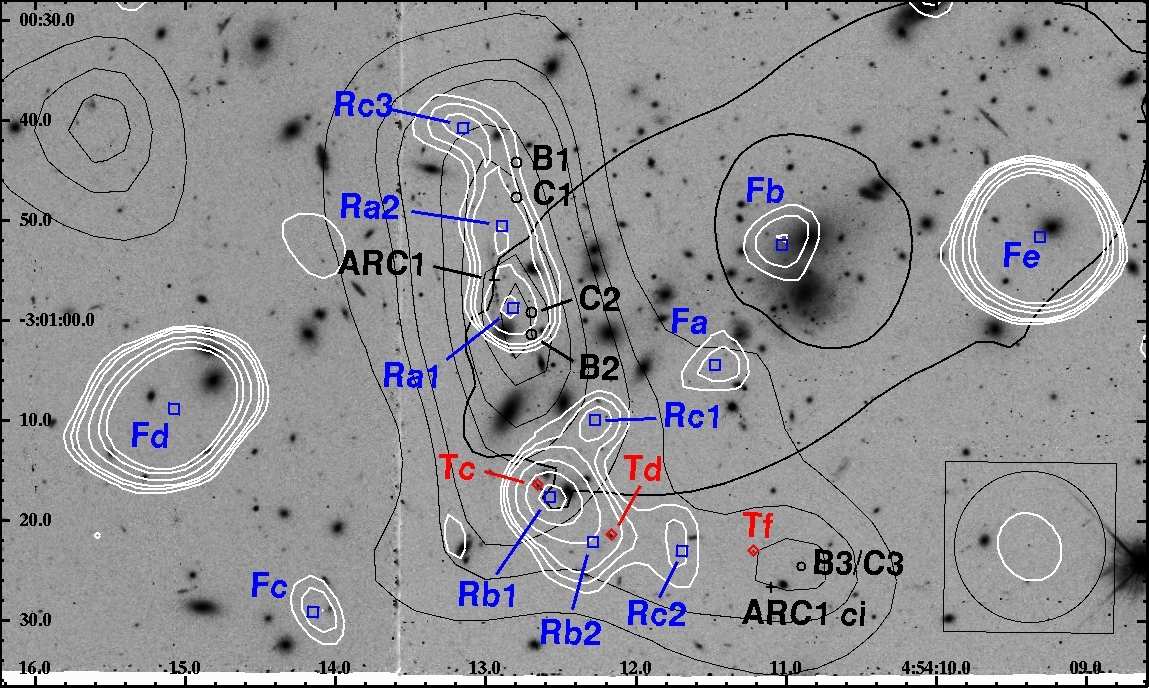
In galaxy-scale lenses, the regions of high amplifications are very small, but in rare occasions it happens that a radio source is located so close to a caustic that it is amplified by factors of a few hundred. B2016+112 is one of those examples. In another talk at this meeting, More & Porcas (2006) present new HSA observations of this system, showing source components almost merging at the critical curve with extreme magnifications. Back-projecting these components into the source plane will in the future provide arcsec-resolution maps of this source.
4.2 Mass distributions of lenses
Studying the mass distributions of lenses is one of the most important fields in lensing research for several reasons. On one hand, the mass distribution governs the light deflection and image configuration, including magnifications. Without a good knowledge of these properties, applications of lenses as natural telescopes (or for other purposes) would become inaccurate and speculative.
However, this argument can be turned around and we can use the image configuration to constrain the mass distribution of the lens. This method provides the most accurate information about the mass distributions of very distant lenses, allowing the study of structure and evolution of galaxies in a systematic way. The standard approach to do this is to assume a simple parametrised mass distribution for the lens and make simple assumptions for the source structure, e.g. assume that it consists of a small number of compact components. The model parameters (of the lens and source) are then varied in a way to fit the predicted image configuration to the observed one. This can include image positions as well as shapes of compact but slightly extended components. Generally, it is advantageous to have many lensed source components, but they have to be of a sufficiently simple structure to make this standard approach viable.
Fig. 10 illustrates this for the case of 0957+561, where the source is complicated enough to make this procedure a non-trivial task. The constraints are quite good, but unfortunately the structure of the lens (which consists of a massive cD galaxy together with its surrounding cluster) is so complicated that even these constraints are not sufficient to provide a good accuracy for the lens mass distribution. One disadvantage is that all the jet components are located very close to each other so that they sample the light deflection only in small regions, basically providing the deflection angle and its derivatives at only two points.
In order to obtain more information about the global properties of the mass distribution, it is necessary to have images at widely separated positions, especially at different distances from the lens centre. B1933+503 is a unique lens system consisting of ten images of several source components (see Fig. 11). Parametrised model fits (Cohn et al., 2001) for this system show that the mass distribution must be very close to isothermal (projected surface mass density ), a property found in most accurately modelled lenses. Later on, we will discuss how to use lensed general extended sources to constrain lens models.

The lensed image configuration not only provides information about the global mass distribution but is also sensitive for small-scale deviations as predicted by CDM structure-formation scenarios. Fig. 12 shows an example where each of the four images consists of three subcomponents. The general four-image geometry can be fitted well with smooth mass distributions, but these models cannot explain the relative positions of all subcomponents in the images. An easy explanation would be the presence of a small-mass clump close to one of the images that distorts the geometry very locally without affecting the global configuration. There are other cases where it is not the image configuration but the flux density ratios that are in conflict with simple models. This is not surprising since small-scale mass substructure influences derivatives of deflection (determining the amplifications) much stronger than the deflections (and image positions) themselves.


Another aspect of the small-scale mass distribution that can be studied with lensing is the mass profile in the very centres of lensing galaxies. For a smooth mass profile with a non-diverging deflection angle, one would always expect an odd number of images, one of which would be located close to the lens centre. However, if the central mass concentration becomes very steep or even singular, this central image will be highly de-magnified or even completely suppressed. Currently, only one such central image is believed to be detected (see Fig. 13, together with a case with no central image). Instead, there is evidence that isothermality of the mass profile typically extends very close to the lens galaxy centres, which would suppress the central images. There is no good explanation for this fact in standard structure-formation theories.


4.3 Propagation effects: scattering, absorption etc.
The study of propagation effects like scatter broadening, free-free absorption or extinction and reddening in the optical domain is usually plagued by the lack of knowledge of the intrinsic structure and spectral energy distribution of a distant source, with which the observed properties could be compared. Gravitational lensing kindly produces two or more copies of the same source component that are identical in their spectra and have only simple (and easy to model) differences in their total flux density and source structure. By comparing properties of these images, one can directly infer the differential propagation effects like differential reddening or differential scatter broadening, without assumptions about the intrinsic properties. This will be shown for one example later.
4.4 Measurement of distances and cosmology
Long before the discovery of the first lens, it was argued by Refsdal (1964, 1966) that the lens effect can be used to test cosmological theories and to measure distances and thus the Hubble constant in particular. The principle behind this idea is very simple. In a typical lens system, we can measure the angular separations between the observed images and the lens. Modelling the mass distribution then gives us all the other angles defining the geometry (like the true source position). Ratios of distances between observer, lens and source can be derived easily from the observed redshifts. We conclude that in such a situation the complete lensing geometry is known, except for the scale. If only one length in the system can be measured, all other lengths, including the distances to the lens and source, can immediately be calculated. It was the idea of Refsdal (1964) that the light travel-times will differ from image to image (because of different geometrical paths and different Shapiro delays) and that this light travel-time difference can be used as the defining length to scale the whole geometry. If the background source is variable, these variations will be seen in all the images, but shifted relative to each other by the corresponding time delays. Once the distances are determined, they can be used together with the redshifts to estimate the Hubble constant. Distances for given redshifts are inversely proportional to the Hubble constant, and the time delay is proportional to the distances, so that the product is a constant that can be derived from the lens mass model, which, in turn, is constrained by the image geometry. This method has been applied to a number of lens systems, leading to more or less consistent results. We will discuss only one example further below.
4.5 Tests of relativity
The most fundamental test of relativity performed with the lens effect consists of measuring the deflection angle in our solar system and comparing it with the theoretical expectations. For this purpose the deflection can be parametrised as
and the resulting can be measured. Two special values would be as expected from Newtonian theory and as expected from general relativity. The work of Eddington (1919) was only a first example, and the accuracy has improved by several orders of magnitude by using VLBI techniques. Shapiro et al. (2004) found from a combination of very many geodetic VLBI data sets, which confirms general relativity with high accuracy.
It has also been claimed that the deflection of light by a moving object (Jupiter in this case) can be used to measure the propagation speed of gravity (Kopeikin, 2001). Such an experiment has actually been carried out (Fomalont & Kopeikin, 2003), and the outcome is consistent with relativity. However, there are serious arguments against this interpretation of the experiment (see e.g. Will, 2003; Carlip, 2004) and the debate has not led to an agreement between the opponents yet.
5 The lens B0218+357
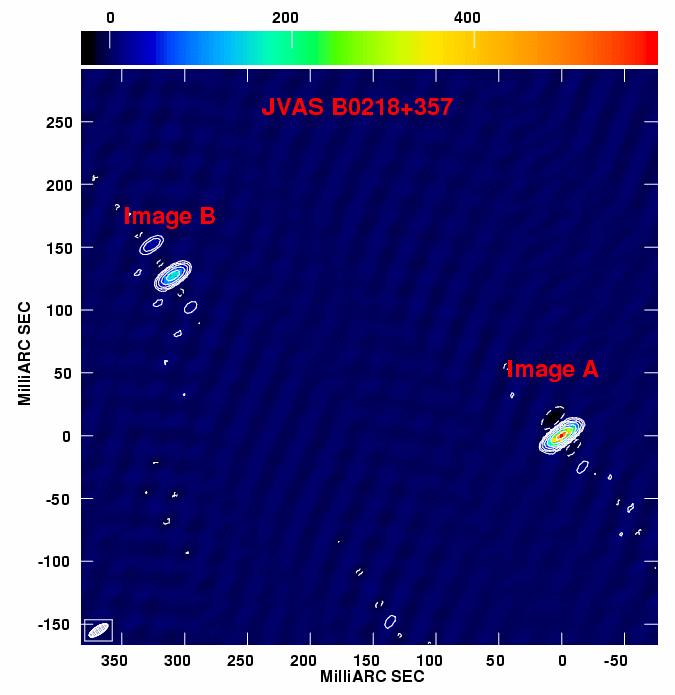
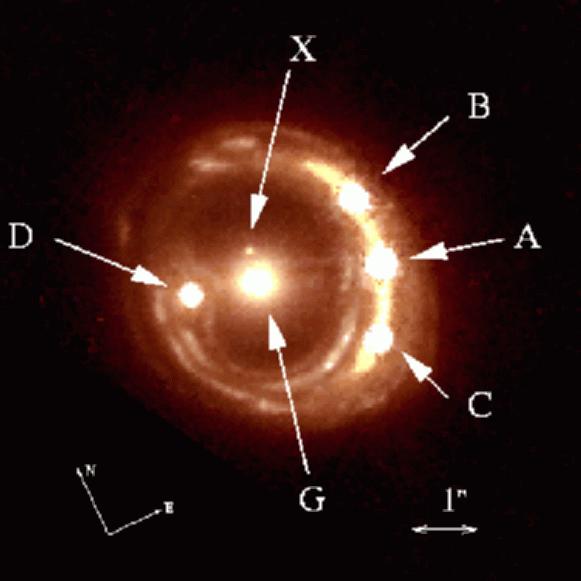
This lens system is one of the best studied cases and is a good example for many of the applications of the lens effect discussed above. It consists of two bright images and an additional Einstein ring with the same diameter as the image separation (Fig. 14). The two images are resolved by VLBI and show the core and inner jet of the lensed background source (e.g. Biggs et al., 2003).


5.1 Lens models and Hubble constant
B0218+357 has some unique properties that make it particularly well suited to determine the Hubble constant using Refsdal’s method. Firstly, the time delay is known with sufficient accuracy. Biggs et al. (1999) find , a result that is consistent with that of Cohen et al. (2000). Secondly, the lens is an isolated spiral galaxy without close neighbours or clusters nearby, which allows the use of simple models with a small number of parameters as a realistic description. Finally, the wealth of structure in the Einstein ring and the VLBI maps of the lensed jets provides a good number of valuable constraints for the modelling. The VLBI substructure is especially sensitive to the radial mass profile, which seems to be very close to isothermal but slightly shallower (Biggs et al., 2003). Unfortunately, the accurate lens position (relative to the images) was not known until recently. The image separation is only , the smallest of all galaxy lenses, which makes direct optical measurements very difficult. However, the structure of the Einstein ring can be used to determine the lens position indirectly. Contrary to the lens modelling methods described before, the source cannot be described as a small number of point-like sources anymore. Instead, more sophisticated methods must be used, in which the true source structure is also fitted for in a non-parametric way.
We used our own improved version of the LensClean algorithm to accomplish this task (Wucknitz, 2004). LensClean iteratively builds a source model similarly to the normal Clean algorithm, but takes into account the effect of the (for the moment fixed) lens model. ‘Clean components’ are allowed only in combinations that are consistent with the effect of the lens. If, for example, a component is to be included at a position that is quadruply imaged, all four lensed images have to be included in the model, scaled with their respective amplifications. Once converged, this inner loop of LensClean has determined a source model that minimises the residuals given a certain lens model. An outer loop then varies the lens model parameters, again in order to minimise the residuals. The final result is a simultaneous fit of lens and source model. The main result in the case of B0218+357 is the lens position, which then directly translates to a value for the Hubble constant (Wucknitz et al., 2004):
The lens position was later confirmed by a direct optical measurement using the HST/ACS (York et al., 2005). The result for is consistent with other methods that use completely independent information. Because it is determined by a direct one-step method, the systematic uncertainties inherent in the complex distance-ladder methods are avoided.
5.2 Propagation effects
It has been known for long that the flux density ratio of the two images shows a strong frequency dependence. At high frequencies, it is close to 4 and decreases for lower frequencies. This is surprising since lensing is achromatic and should not change the spectra of the images. One possible explanation would be source shifts as a function of frequency, which, together with the strong magnification gradient, could explain the observed trend, provided they were of the order or more. Mittal et al. (2006a) investigated this possibility by measuring the image positions with multi-frequency, phase-referencing VLBI observations. They found (see Fig. 15) that any image shifts are of the order of or less, not enough to explain the observed effect. Similarly, changes of the source structure could be ruled out as reason for the changing flux density ratios. The most plausible explanation is a free-free absorption, mainly in the A image.


5.3 More VLBI aspects
It should be noted that B0218+357 was the target of the first real-time EVN observations in 2004. The map from this small data set is shown in Fig. 16 (left). Currently, the author is working on the analysis of a 90-cm VLBI experiment conducted recently. The goal was to map more details in the Einstein ring and to obtain more information about propagation effects that are strongest at lower frequencies. Fig. 16 (right) shows a very preliminary map compared to a VLA+Pie Town map at 2-cm. Two additional correlator passes of the same 90-cm observations are used for a wide-field mapping experiment that constitutes the first wide-field VLBI mini-survey to study the high-resolution radio sky at such low frequencies. First results are presented by Lenc et al. (2006) at this conference. See also Lenc et al. (2007).

6 Outlook
Like many other fields, gravitational lens research takes advantage of the technical progress in radio astronomy and particularly in VLBI. The EVN grows continuously, providing steadily improving coverage, mapping quality and resolution. Higher bandwidths provide the increasing sensitivity that is needed to map more extended source components with high quality. Such future VLBI experiments will lead to more accurate lens mass models than currently available. This development is complemented by the upgraded EVLA and e-MERLIN that will come online soon. All these arrays will allow the mapping of even weaker structures on scales of the image splitting with sufficient resolution to utilise the information such sources provide for mass models and other purposes. It will finally be possible to map even normal star-forming galaxies in great detail. Such lensed sources have such a wealth of smaller structures (Fig. 17) that they allow a detailed mapping of the lensing potential and thus the mass distribution of lensing galaxies.
EVLA, e-MERLIN, and above all LOFAR (with extended baselines) will allow future lens surveys that increase the number of radio lenses by at least an order of magnitude. This development has to be supplemented by the development of new analysis techniques that can extract all information from current and future observations. LensClean can only be one first step in this direction.
7 Summary
We have discussed how the lens effect can be used to study all aspects of the lensing situation. We use the lens as a natural telescope to study the sources in greater detail, we determine the mass distributions of high-redshift lens galaxies, and can even determine the Hubble constant and do cosmology. Additionally, lenses provide us with (almost) identical copies of lensed sources that can then be used to study differential propagation effects like scattering or absorption.
Radio observations are particularly useful for several reasons. Firstly, radio interferometers span the largest range of possible resolutions down to the sub-mas level. Secondly, the effects of microlensing and extinction, that make the interpretation of optical observations very difficult, can mostly be avoided at radio wavelengths. Instead of asking what radio astronomy can do for lensing, we can also ask what lensing can do for radio astronomy. It is our hope that the further development of deconvolution methods for the lensed situation will also provide new and better algorithms for a general use. Such a trigger for new developments should be very welcome.
Finally, we have to add that this review covers only a small subset of relevant topics in gravitational lens research. Other important subjects like microlensing, weak lensing, lensing surveys, measuring time delays, and a number of very interesting lens systems have not been mentioned at all. That does not imply that those fields are less exciting.
Acknowledgments
This work was supported by the European Community’s Sixth Framework Marie Curie Research Training Network Programme, Contract No. MRTN-CT-2004-505183 “ANGLES”.
References
- (1)
- Avruch et al. (1997) Avruch, I. M., Cohen, A. S., Lehar, J., Conner, S. R., Haarsma, D. B. & Burke, B. F.: 1997, Low surface brightness radio structure in the field of gravitational lens 0957+561, ApJ 488, L121.
- Berciano Alba et al. (2007) Berciano Alba, A., Garrett, M. A., Koopmans, L. V. E. & Wucknitz, O.: 2007, Highly-magnified, multiply-imaged radio counterparts of the sub-mm starburst emission in the cluster-lens MS0451.6-0305, A&A 462, 903.
- Biggs et al. (1999) Biggs, A. D., Browne, I. W. A., Helbig, P., Koopmans, L. V. E., Wilkinson, P. N. & Perley, R. A.: 1999, Time delay for the gravitational lens system B0218+357, MNRAS 304, 349.
- Biggs et al. (2004) Biggs, A. D., Browne, I. W. A., Jackson, N. J., York, T., Norbury, M. A., McKean, J. P. & Phillips, P. M.: 2004, Radio, optical and infrared observations of CLASS B0128+437, MNRAS 350, 949.
- Biggs et al. (2003) Biggs, A. D., Wucknitz, O., Porcas, R. W., Browne, I. W. A., Jackson, N. J., Mao, S. & Wilkinson, P. N.: 2003, Global 8.4-GHz VLBI observations of JVAS B0218+357, MNRAS 338, 599.
- Campbell et al. (1995) Campbell, R. M., Lehar, J., Corey, B. E., Shapiro, I. I. & Falco, E. E.: 1995, VLBI observations of the gravitational lens system 0957+561, AJ 110, 2566.
- Carlip (2004) Carlip, S.: 2004, Model-dependence of Shapiro time delay and the `speed of gravity/speed of light' controversy, Classical and Quantum Gravity 21, 3803.
- Claeskens et al. (2006) Claeskens, J.-F., Sluse, D., Riaud, P. & Surdej, J.: 2006, Multi wavelength study of the gravitational lens system RXS J1131-1231. II. Lens model and source reconstruction, A&A 451, 865.
- Cohen et al. (2000) Cohen, A. S., Hewitt, J. N., Moore, C. B. & Haarsma, D. B.: 2000, Further investigation of the time delay, magnification ratios, and variability in the gravitational lens 0218+357, ApJ 545, 578.
- Cohn et al. (2001) Cohn, J. D., Kochanek, C. S., McLeod, B. A. & Keeton, C. R.: 2001, Constraints on galaxy density profiles from strong gravitational lensing: the case of B1933+503, ApJ 554, 1216.
- Eddington (1919) Eddington, A. S.: 1919, The total eclipse of 1919 May 29 and the influence of gravitation on light, The Observatory 42, 119.
- Einstein (1911) Einstein, A.: 1911, Über den Einfluß der Schwerkraft auf die Ausbreitung des Lichtes, Ann. Physik 35, 898.
- Einstein (1915) Einstein, A.: 1915, Erklärung der Perihelbewegung des Merkur aus der allgemeinen Relativitätstheorie, Sitzungsber. Preuß. Akad. Wissensch., erster Halbband, p. 831.
- Fomalont & Kopeikin (2003) Fomalont, E. B. & Kopeikin, S. M.: 2003, The measurement of the light deflection from Jupiter: experimental results, ApJ 598, 704.
- Garrett et al. (1994) Garrett, M. A., Calder, R. J., Porcas, R. W., King, L. J., Walsh, D. & Wilkinson, P. N.: 1994, Global VLBI observations of the gravitational lens system 0957+561A, B, MNRAS 270, 457.
- Garrett et al. (2005) Garrett, M. A., Knudsen, K. K. & van der Werf, P. P.: 2005, Gravitationally lensed radio emission associated with SMM J16359+6612, a multiply imaged submillimeter galaxy behind A 2218, A&A 431, L21.
- Harvanek et al. (1997) Harvanek, M., Stocke, J. T., Morse, J. A. & Rhee, G.: 1997, High dynamic range VLA observations of the gravitationally lensed quasar 0957+561, AJ 114, 2240.
- Kneib et al. (2004) Kneib, J.-P., Ellis, R. S., Santos, M. R. & Richard, J.: 2004, A probable $z∼7$ galaxy strongly lensed by the rich cluster A2218: exploring the dark ages, ApJ 607, 697.
- Kochanek et al. (2006) Kochanek, C. S., Falco, E. E., Impey, C., Lehár, J., McLeod, B. & Rix, H.-W.: 2006, CASTLeS website, http://cfa-www.harvard.edu/castles/.
- Kopeikin (2001) Kopeikin, S. M.: 2001, Testing the relativistic effect of the propagation of gravity by Very Long Baseline Interferometry, ApJ 556, L1.
- Lenc et al. (2006) Lenc, E., Garrett, M., Wucknitz, O., Anderson, J. & Tingay, S.: 2006, Living life on the edge – Widefield VLBI at 90 cm !, proceedings of the 8th European VLBI symposium, \posPoS(8thEVN)079.
- Lenc et al. (2007) Lenc, E., Garrett, M., Wucknitz, O., Anderson, J. & Tingay, S.: 2007, A deep, high resolution survey of the low frequency radio sky, ApJ. in print.
- Mittal et al. (2007) Mittal, R., Porcas, R. & Wucknitz, O.: 2007, Free-free absorption in the gravitational lens JVAS B0218+357, A&A 465, 405.
- Mittal et al. (2006a) Mittal, R., Porcas, R., Wucknitz, O., Biggs, A. & Browne, I.: 2006a, VLBI phase-reference observations of the gravitational lens JVAS B0218+357, A&A 447, 515.
- More & Porcas (2006) More, A. & Porcas, R.: 2006, Multi-frequency VLBI observations of the gravitational lens B2016+112, proceedings of the 8th European VLBI symposium, \posPoS(8thEVN)030.
- Nair (1998) Nair, S.: 1998, Modelling the 10-image lensed system B1933+503, MNRAS 301, 315.
- Newton (1704) Newton, I.: 1704, Opticks.
- Phillips et al. (2000) Phillips, P. M., Norbury, M. A., Koopmans, L. V. E., Browne, I. W. A., Jackson, N. J., Wilkinson, P. N., Biggs, A. D., Blandford, R. D., de Bruyn, A. G., Fassnacht, C. D., Helbig, P., Mao, S., Marlow, D. R., Myers, S. T., Pearson, T. J., Readhead, A. C. S., Rusin, D. & Xanthopoulos, E.: 2000, A new quadruple gravitational lens system: CLASS B0128+437, MNRAS 319, L7.
- Porcas et al. (1979) Porcas, R. W., Booth, R. S., Browne, I. W. A., Walsh, D. & Wilkinson, P. N.: 1979, VLBI observations of the double QSO, 0957 + 561 A, B, Nature 282, 385.
- Porcas et al. (1981) Porcas, R. W., Booth, R. S., Browne, I. W. A., Walsh, D. & Wilkinson, P. N.: 1981, VLBI structures of the images of the double QSO 0957+561, Nature 289, 758.
- Porcas et al. (1980) Porcas, R. W., Urry, C. M., Browne, I. W. A., Cohen, A. M., Daintree, E. J. & Walsh, D.: 1980, Radio positions and optical identifications for radio sources selected at 966 MHz. II, MNRAS 191, 607.
- Refsdal (1964) Refsdal, S.: 1964, On the possibility of determining Hubble's parameter and the masses of galaxies from the gravitational lens effect, MNRAS 128, 307.
- Refsdal (1966) Refsdal, S.: 1966, On the possibility of testing cosmological theories from the gravitational lens effect, MNRAS 132, 101.
- Roberts et al. (1979) Roberts, D. H., Greenfield, P. E. & Burke, B. F.: 1979, The double quasar 0957+561 — A radio study at 6-centimeters wavelength, Science 205, 894.
- Shapiro et al. (2004) Shapiro, S. S., Davis, J. L., Lebach, D. E. & Gregory, J. S.: 2004, Measurement of the solar gravitational deflection of radio waves using geodetic Very-Long-Baseline Interferometry data, 1979–1999, Phys. Rev. Lett. 92, 121101.
- Soldner (1801) Soldner, J.: 1801, Über die Ablenkung eines Lichtstrahls von seiner geradlinigen Bewegung durch die Attraktion eines Weltkörpers, an welchem er nahe vorbeigeht, Berliner Astron. Jahrb. 1804, Späten, p. 161.
- Walsh (1989) Walsh, D.: 1989, 0957 + 561: the unpublished story, in J. M. Moran, J. N. Hewitt & K.-Y. Lo (eds), LNP Vol. 330: Gravitational Lenses, Springer, p. 11.
- Walsh et al. (1979) Walsh, D., Carswell, R. F. & Weymann, R. J.: 1979, 0957 + 561 A, B — Twin quasistellar objects or gravitational lens, Nature 279, 381.
- Will (1988) Will, C. M.: 1988, Henry Cavendish, Johann von Soldner, and the deflection of light, Am. J. Phys. 56, 413.
- Will (2003) Will, C. M.: 2003, Propagation speed of gravity and the relativistic time delay, ApJ 590, 683.
- Winn et al. (2003) Winn, J. N., Rusin, D. & Kochanek, C. S.: 2003, Investigation of the possible third image and mass models of the gravitational lens PMN J1632–0033, ApJ 587, 80.
- Wucknitz (2004) Wucknitz, O.: 2004, LensClean revisited, MNRAS 349, 1.
- Wucknitz et al. (2004) Wucknitz, O., Biggs, A. D. & Browne, I. W. A.: 2004, Models for the lens and source of B0218+357: a LensClean approach to determine $H_0$, MNRAS 349, 14.
- York et al. (2005) York, T., Jackson, N., Browne, I. W. A., Wucknitz, O. & Skelton, J. E.: 2005, The Hubble constant from the gravitational lens CLASS B0218+357 using the Advanced Camera for Surveys, MNRAS 357, 124.
- Zhang et al. (2007) Zhang, M., Jackson, N., Porcas, R. W. & Browne, I. W. A.: 2007, A search for the third lensed image in JVAS B1030+074, MNRAS 377, 1623.