Electron-ion recombination of Si IV forming Si III: Storage-ring measurement and multiconfiguration Dirac-Fock calculations
Abstract
The electron-ion recombination rate coefficient for Si IV forming Si III was measured at the heavy-ion storage-ring TSR. The experimental electron-ion collision energy range of – encompassed the dielectronic recombination (DR) resonances associated with core excitations, resonances associated with () core excitations, and resonances associated with () core excitations. The experimental DR results are compared with theoretical calculations using the multiconfiguration Dirac-Fock (MCDF) method for DR via the and (both ) and () capture channels. Finally, the experimental and theoretical plasma DR rate coefficients for Si IV forming Si III are derived and compared with previously available results.
pacs:
34.80.Lx, 36.20.Kd, 95.30.Dr, 98.58.Bz.I Introduction
Spectroscopic Lukić et al. (2007) observations of absorption lines in the intergalactic medium (IGM) can be used to study the origin of large-scale structure in the universe, the history of star and galaxy formation, the metagalactic radiation field, and the chemical evolution of the IGM (Savin, 2000; Levshakov et al., 2002; Aguirre et al., 2004). Observations of lines from C IV, N V, O VI, and Si IV are routinely employed for these studies. These observations provide important constraints for IGM studies when coupled with calculations of the ionization balance using codes such as CLOUDY (Ferland et al., 1998). However, the accuracy with which one can infer the properties of the IGM is limited by uncertainties in the underlying atomic data.
Of particular importance are reliable electron-ion recombination data for the process known as dielectronic recombination (DR). This is the dominant recombination process for most atomic ions under IGM conditions. Recently, Savin (2000) has investigated the importance of DR for C IV, N V, O VI, and Si IV. (Here, the convention of identifying each ion by its charge state before the recombination process is used.) His work has shown that uncertainties in the DR data for these four ions limit our ability to constrain the metagalactic radiation field and the initial mass function for the earliest generations of stars.
In the last several years, a series of measurements has been carried out to produce accurate DR data for C IV (Schippers et al., 2001), N V (Böhm et al., 2005), O VI (Böhm et al., 2003), and sodium-like Si IV which will be presented in this work. Other experimental results for DR rate coefficients of Na-like ions have been published for Si IV (Orban et al., 2006), for Fe XVI (Linkemann et al., 1995) and for Ni XVIII (Fogle et al., 2003). Recently detailed calculations of the low energy DR resonance structure have been performed for Si IV (Orban et al., 2007) within the framework of relativistic many-body perturbation theory (RMBPT).
In the present work, experimental results for the Si IV recombination rate coefficient are presented. These were obtained employing the electron-ion merged-beams method at a heavy-ion storage ring. Orban et al. (2006) measured the Si IV recombination rate coefficient in the electron-ion collision energy range – that comprises DR resonances associated with and () core excitations. Here an extended energy range of up to was experimentally investigated. This additional range includes DR resonances associated with (), () () and () () core excitations. The corresponding excitation energies are listed in Table 1, except those for excitation. The present experimental Si IV merged-beams recombination rate coefficient thus benchmarks theory for light, low charged sodium-like ions over a wide range of energies.
| excited state | (eV) | Reference |
|---|---|---|
| (Toresson, 1960) | ||
| (Toresson, 1960) | ||
| (Ralchenko et al., 2006) | ||
| (Ralchenko et al., 2006) | ||
| (Ralchenko et al., 2006) | ||
| (Ralchenko et al., 2006) | ||
| (Ralchenko et al., 2006) | ||
| (Ralchenko et al., 2006) | ||
| (Ralchenko et al., 2006) | ||
| (Ralchenko et al., 2006) | ||
| (Ralchenko et al., 2006) | ||
| (Schneider et al., 1995) | ||
| (Schneider et al., 1995) | ||
| (Schneider et al., 1995) | ||
| (Schneider et al., 1995) | ||
| (Schneider et al., 1995) | ||
| (Schneider et al., 1995) | ||
| (Schneider et al., 1995) | ||
| (Schneider et al., 1995) | ||
| (Schneider et al., 1995) | ||
| (Schneider et al., 1995) | ||
| (Schneider et al., 1995) | ||
| (Schneider et al., 1995) | ||
| (Schneider et al., 1995) | ||
| (Schneider et al., 1995) | ||
| (Schneider et al., 1995) | ||
| (Schneider et al., 1995) | ||
| (Schneider et al., 1995) | ||
| (Schneider et al., 1995) | ||
| (Schneider et al., 1995) | ||
| (Schneider et al., 1995) | ||
| (Schneider et al., 1995) | ||
| (Schneider et al., 1995) | ||
| (Schneider et al., 1995) | ||
| (Schneider et al., 1995) | ||
| (Schneider et al., 1995) |
In this work, the experimental results are compared to theoretical results using the multiconfiguration Dirac-Fock (MCDF) method, in particular at low electron-ion collision energies. At these energies, the calculation of accurate resonance positions and strengths is extremely critical for the derivation of reliable plasma DR rate coefficients. Therefore, the present work is partly an investigation into the capabilities of the MCDF method for calculating accurate DR resonance energies and strengths. The MCDF method is an ab-initio method that is applicable to target atoms and ions with an arbitrary shell structure. In contrast, the RMBPT is currently limited to quasi one-electron target ions, owing to its inherent complexity. For such systems, however, it usually yields more accurate results than any other theoretical method. Below, a detailed comparison between the present MCDF results and the RMPBT results of Orban et al. (2007) for DR of sodiumlike Si IV will be presented.
The present paper is organized as follows. The theoretical procedure is outlined in Section II. In Section III the experimental procedure is described. Experimental and theoretical results are presented and compared in Section IV. The Si IV to Si III experimental and theoretical DR rate coefficients in a Maxwellian plasma are derived and compared to recent theoretical and experimental results in Section V. Conclusions will be presented in Section VI.
II Theory and implementation
In most computations, DR of an -electron target ion in the initial state is handled as a two–step process in which first an electron is captured resonantly from the continuum forming an -electron state with the captured electron and one of the target core electrons both now in an excited level. In a second step, this doubly excited state either decays radiatively by the emission of one or more photons to some final state which lies below the ionization threshold of the ion, or it returns by Auger electron emission to the initial ionization stage of the target. If interference between the radiative and nonradiative capture of the electron in the field of the target is negligible, the integrated DR cross section for an isolated resonance, the so–called resonance strength, can be expressed in terms of the Auger and radiative rates of the intermediate state by
| (1) | |||||
where denotes the wave number and the energy of the incident electron, the width of the doubly–excited state, and is the rate for the dielectronic capture from the initial into the doubly excited state. Using the principle of detailed balance, the dielectronic capture rate is equal to where is the Auger rate, and and are the statistical factors of the initial and intermediate states, respectively. refers to the rate for the radiative stabilization to the state . The strength as defined by Equation (1) refers to the area under the DR cross section curve. Hence, it is usually given in units of . The total width is determined by all possible decay channels of the resonant state and is given, in first–order perturbation theory, by
| (2) |
where the sums are over all the individual Auger and radiative rates (widths) of the intermediate state . The use of the resonance strength is appropriate for resonances whose width is small compared to its energy position where and are the energy of the doubly excited state and initial state of the target ion, respectively, and if the energy dependent DR cross section has a Lorentzian profile (Tokman et al., 2002)
| (3) |
Owing to the energy of the incident electron [cf. the factor in ], the resonance strength increases rapidly towards the DR threshold and makes the process sensitive to low kinetic energies of the incoming electrons.
At storage rings, the radiative stabilization is often not observed explicitly and, hence in Equation (1), the radiative rate for the individual transition has to be replaced with
where the summation extends over all states below the ionization threshold that can be reached by radiative transition from the doubly excited state . As seen from Equation (1), the observed DR strength for a given resonance is proportional to the capture rate and the total radiative rate. For most light and medium elements, moreover, the magnitude of the resonance strengths is often determined by the radiative decay since the emission of photons from the doubly excited state is then much slower than its autoionization and, hence, .
The doubly excited state is often one out of a large number of highly correlated states embedded in the continuum of the target ion. For these resonances, special care has to be taken in calculating both the individual as well as total rates accurately. To describe the ground and excited state of multiply charged ions, the MCDF method has been found to be a versatile tool for the computation of the many–electron energies and decay properties, especially if inner–shell electrons or several open shells are involved in the computations (Grant, 1988; Fritzsche, 2002). In the MCDF method, an atomic state is approximated by a linear combination of so–called configuration state functions (CSF) of the same symmetry
| (4) |
where is the number of CSF, denotes the representation of the atomic state in this CSF basis, is the parity, is the total angular momentum, and is a set of quantum numbers for a unique specifying of the many-electron basis states. In most standard computations, the CSF are constructed as antisymmetrized products of a common set of orthonormal orbitals and are optimized on the basis of the Dirac–Coulomb Hamiltonian. Further relativistic contributions to the representation of the atomic states are then added, owing to the given requirements, by diagonalizing the Dirac–Coulomb–Breit Hamiltonian matrix in first–order perturbation theory. For multiply charged ions, an estimate of the dominant QED contributions (i.e., the self–energy and vacuum polarization of the electronic cloud) might be taken into account by means of scaled hydrogenic values. But QED plays a negligible role for Si3+ ions in the present analysis.
Obviously, the calculation of the radiative and nonradiative decay rates of the intermediate resonances is central to the computation of any DR spectrum which is to be compared with experiment. In the MCDF model, both the radiative as well as the Auger matrix elements are derived from computation of the corresponding interaction matrix within the CSF basis using the expansion (4). To determine the rates, the wave functions from the GRASP92 (Parpia et al., 1996) and RATIP (Fritzsche, 2001) codes have been applied in the present work which allows one to incorporate both the dominant relativistic and correlation effects on the same footings. However, since the computation of the transition probabilities has been considered at many places elsewhere (Parpia et al., 1996; Fritzsche, 2002), we shall mention here only that the radiative rates
where is the emitted photon’s frequency, are associated with the reduced matrix elements of the interaction of the atomic electrons with the multipole components of the radiation field (Fritzsche et al., 2005), where and refer to electric and magnetic multipoles, respectively, with the multipolarity . For light and medium elements, it is of course sufficient to include the electric–dipole (, ) decay while the contributions from higher multipoles to the radiative stabilization remain negligible. To obtain the total radiative rate, i.e., to include the summation over all lower states in Equation (2), often a large number of transition rates have to be compiled with similar accuracy. For this reason the computation of the DR spectrum at higher energies may become difficult. In the RATIP program, the transition probabilities are computed by the REOS component (Fritzsche et al., 2000) including, if appropriate, the rearrangement of the electron density in course of the decay. The explicit consideration of the electron density’s rearrangement was not included here, because this would require separate calculations for the intermediate resonance states and the final states of the radiative stabilization. In the present calculations, however, both sets of states were always treated together in order to keep the computations feasible.
Unlike the treatment of radiative stabilization, calculation of the Auger rates requires the coupling of the bound–state electrons (of the target ion) to the electron continuum. If, for the sake of simplicity, we neglect the interaction between different Auger channels (i.e. within the continuum), the Auger rates are given by
| (6) | |||
where is the atomic Hamiltonian, the total energy of the doubly excited state and the kinetic energy of the emitted electron. In Equation (6), the summation over for , where and are the angular momentum and total angular momentum, respectively, of the incoming or outgoing electron, extends over all partial waves of the outgoing electron which can be coupled to the target ion state with the condition to conserve the total angular momentum and parity of the intermediate state. If, moreover, a common set of orthonormal orbitals is used for the representation of the intermediate state and the final ionic states , then the operator can be replaced by the electron–electron interaction operator. For most light and medium elements, it is again sufficient to include the instantaneous Coulomb repulsion between the electrons but to omit the relativistic Breit contributions as they were found important only for the Auger emission of highly–charged ions (Zimmerer et al., 1990; Chen, 1990; Badnell and Pindzola, 1991; Fritzsche et al., 1991).
The restriction of the electron–electron interaction in the computation of the matrix elements in Equation (6) is common practice, even though the orbital functions for the doubly excited state and the final ionic state are not quite orthogonal to each other. This treatment has been implemented therefore also in the AUGER component of the RATIP program, in which the continuum spinors are solved within a spherical but level–dependent potential of the final ion (the so–called optimal level scheme in the GRASP92 program). This scheme also includes the exchange interaction of the emitted electron with the bound–state density. Often, the number of the possible scattering states of a system increases rapidly with the number of intermediate ion states as the free electrons may couple in quite different ways to the bound–state electrons. For further details on the computations of the Auger matrix elements and relative intensities, we refer the reader to (Fritzsche, 2002) and (Fritzsche et al., 1992).
Apart from the individual rates, any helpful calculation of DR spectra critically depends on the proper control and handling of the various decay branches which, at least in principle, should be treated on the same basis in order to obtain a consistent spectrum. This need for an efficient handling of the decay channels concerns those open-shell configurations in which one-particle excitations with large principal quantum numbers ‘mix into’ the low-energy part of the DR spectrum. Such a mixing occurs especially for the excitation of electrons beneath the valence shell whose energies are comparable with the valence excitation into Rydberg states. Therefore, in order to facilitate this handling of the various decay branches, a new component (DIEREC) has been developed recently in the framework of the RATIP program. This component now supports both, the computation of individual and total resonance strengths and enables us to simulate the low–energy DR spectra as observed by experiment. Internally, of course, this new component makes use of the REOS and AUGER components from above and allows us, if necessary, to incorporate also higher multipoles in the computation of the (total) radiative rates. Because of the finite–difference method of the GRASP92 and RATIP programs and owing to the associated size of the configuration expansions, however, excitation to states with principal quantum numbers can often not be treated by the code explicitly. Atomic structure codes, such as, e.g., AUTOSTRUCTURE (Badnell, 1986), that are geared towards the generation of DR rate coefficients for plasma physical applications, treat high- electrons within a hydrogenic approximation. This has not yet been implemented in the RATIP program suite.
III Experiment
The experiment was performed at the heavy-ion storage ring TSR of the Max-Planck-Institut für Kernphysik (MPI-K) in Heidelberg, Germany. Details of the merged-beams technique using the MPI-K electron cooler have been described previously (Kilgus et al., 1992; Lampert et al., 1996; Pastuszka et al., 1996; Schippers et al., 2001; Müller and Wolf, 1997).
In the present experiment a beam of 28Si3+ was provided by the tandem accelerator of the MPI-K linear accelerator facility at an energy of about . The ion beam was injected into the storage ring where it was collinearly overlapped with the cooler electron beam. For efficient electron cooling, the electron velocity has to be close to the ion velocity in the ring. To fulfill this velocity-matching condition, the laboratory energy of the electrons was set to the ‘cooling’ energy . The beam current was accumulated by multi-turn injection and ‘ecool stacking’ (Grieser et al., 1991). Ion currents of typically – were reached.
In contrast to previous experiments, where the electron beam of the cooler was also used as an electron target for recombination experiments, in the present experiment a newly installed separate electron beam (Sprenger et al., 2004) was used. This additional electron beam is hereafter denoted as the electron target. As in the electron cooler, the electron beam of the electron target is also guided by a magnetic field and overlaps the ion beam in a straight section of length.
Conceptually, the experimental procedures for measuring recombination rate coefficients with the electron target are the same as those applied previously with the electron cooler. However, there are advantages when a separate electron target is employed for recombination measurements. First, the electron cooler can be used continuously for the cooling of the ion beam. Thus, the low velocity and spatial spread of the ion beam is maintained at all times. Second, the electron target was specifically designed for providing an electron beam with a very low initial energy spread (Sprenger et al., 2004). Both advantages yield a higher experimental resolution in the present measurement as compared to previous measurements using only the electron cooler.
After injection into the storage ring, the ions were cooled for a few seconds before the recombination measurements started. Recombined ions were separated from the circulating beam in the first dipole magnet downstream of the electron target and counted by a single particle scintillation detector with nearly efficiency. During the recombination measurement, the electron energy of the electron target beam was alternatingly chopped between measurement () and reference () energies by switching the acceleration voltage for the target electron beam accordingly. At the same time the electron cooler was held constant at cooling energy. The reference measurement was made to determine detector background. Therefore, the reference energy was chosen in a range of the spectrum where no DR resonances occurred. The measurement and reference interval of data collection were each. Between the voltage jump and the data collection interval there was a settling time of to allow the power supplies to reach the preset values. The data were collected in overlapping data sets ranging from laboratory energies to . The chopping pattern was ––– with . With each step in the chopping pattern was changed by in the laboratory frame whereas was kept fixed. The merged-beams rate coefficient is derived from the background subtracted recombination count rate using (Kilgus et al., 1992; Poth et al., 1988)
| (7) |
where is the recombination count rate, is the detection efficiency, is the electron density in the interaction region, is the number of ions in the ring and is the circumference of the TSR. In a first approach the nominal length of the electron-ion overlap region in the electron target section is set to which is the length of the solenoid providing the axial magnetic field along the interaction region. For the detailed analysis we applied a toroid correction (Lampert et al., 1996) that accounts for the contribution of the merging and de-merging sections in the toroidal magnetic fields of the electron target. The ion velocity and the electron velocity are and , respectively, where is the speed of light. Under the present conditions, the factor deviates by less than from unity. The second term in Equation (7) is a small correction that re-adds the recombination rate coefficient at the reference point. This contribution was calculated using a hydrogenic formula (Schippers et al., 2001) for nonresonant radiative recombination (RR). The systematic experimental uncertainty of the merged-beams rate coefficient is estimated to be at confidence level. This uncertainty stems mostly from the ion current measurement ( including also the error of the toroid correction) (Lampert et al., 1996) and the determination of the electron density ().
The experimental electron energy distribution is best described as a flattened Maxwellian distribution which is characterized by the longitudinal and transverse temperatures and . The experimental energy resolution is approximately given by , where denotes the relative electron-ion energy. For the reduction of the target electron beam was adiabatically expanded (Pastuszka et al., 1996) by factors of up to .
For the measurements we used two different cathodes, a thermionic cathode and a photocathode (Orlov et al., 2004). The electron current produced by the thermionic cathode was and that of the photocathode .
The cryogenic photocathode provides electrons with a laboratory energy spread of about Orlov et al. (2004). The expansion factor was . The electron beam temperatures were estimated by fitting a simulated (Sec. IV.1) merged-beams recombination rate-coefficient comprising contributions by DR and RR to the measured spectrum. A transverse temperature of and a longitudinal temperature of were found. With the above given temperature values, the experimental energy spread in the center of mass frame thus amounts to at , at , at , and at .
The temperature of the thermionic cathode is typically about . The expansion factor was 28. The temperatures were again derived by fitting a simulated spectrum to the measured one. A transverse temperature of and a longitudinal temperature of were determined. With these temperatures, the experimental energy spread thus amounts to at , at , at , and at .
IV Merged-beams rate coefficients
IV.1 Experimental results
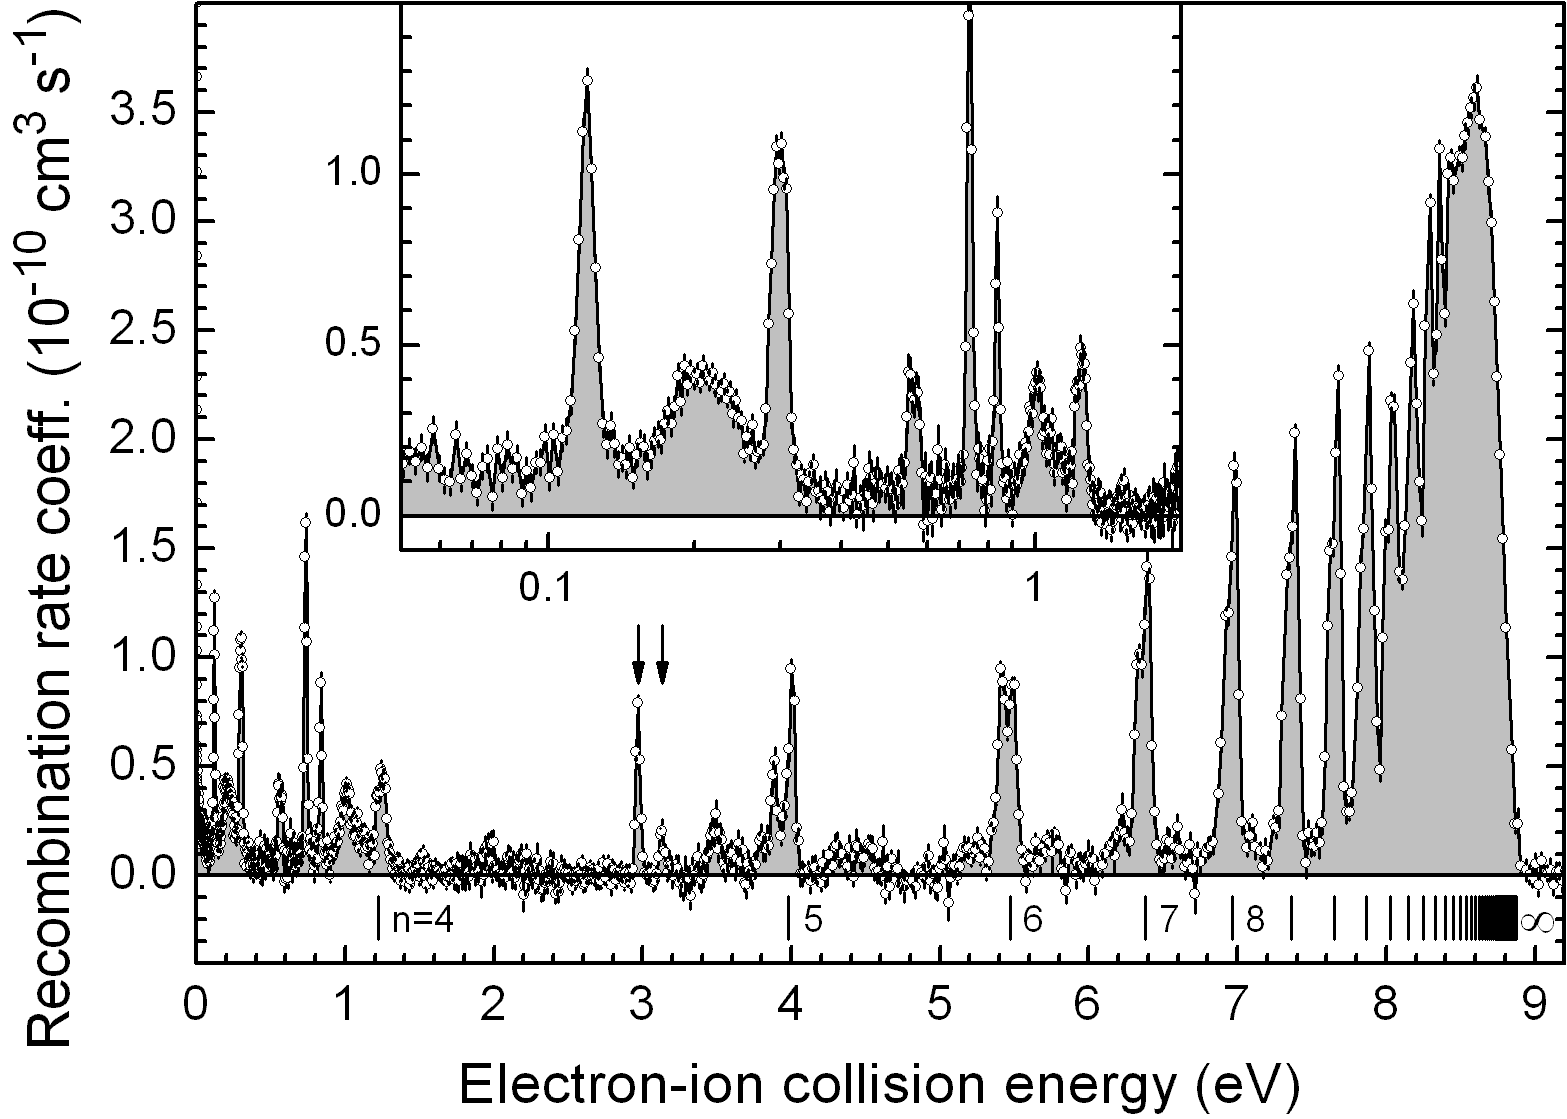
Figure 1 shows the measured merged-beams recombination rate coefficient in the energy range –. For this measurement the photocathode was used. In this range all DR resonances associated with core excitations appear. The Rydberg series of DR resonances converges to its series limit at (Toresson, 1960). This value is the weighted average of the and limits. The fine structure splitting of is not resolved. Additionally, the and resonances associated with the excitation are expected to appear at these low energies. As pointed out by Orban et al. (2007), in this range the most notable contributions are due to and doubly excited states whose energy positions are determined in our experimental data to and , respectively.
The experimental energy scale was fine-tuned by multiplying the nominal electron-ion collision energies with an energy independent factor, so that so that the positions of the () resonances matched their calculated positions. For the high- values the position of the Rydberg resonances can be estimated from the hydrogenic Rydberg formula
| (8) |
with the Rydberg constant and the charge state of the initial Si IV ion. The calibration factor for the energy axis deviated from unity by less than .
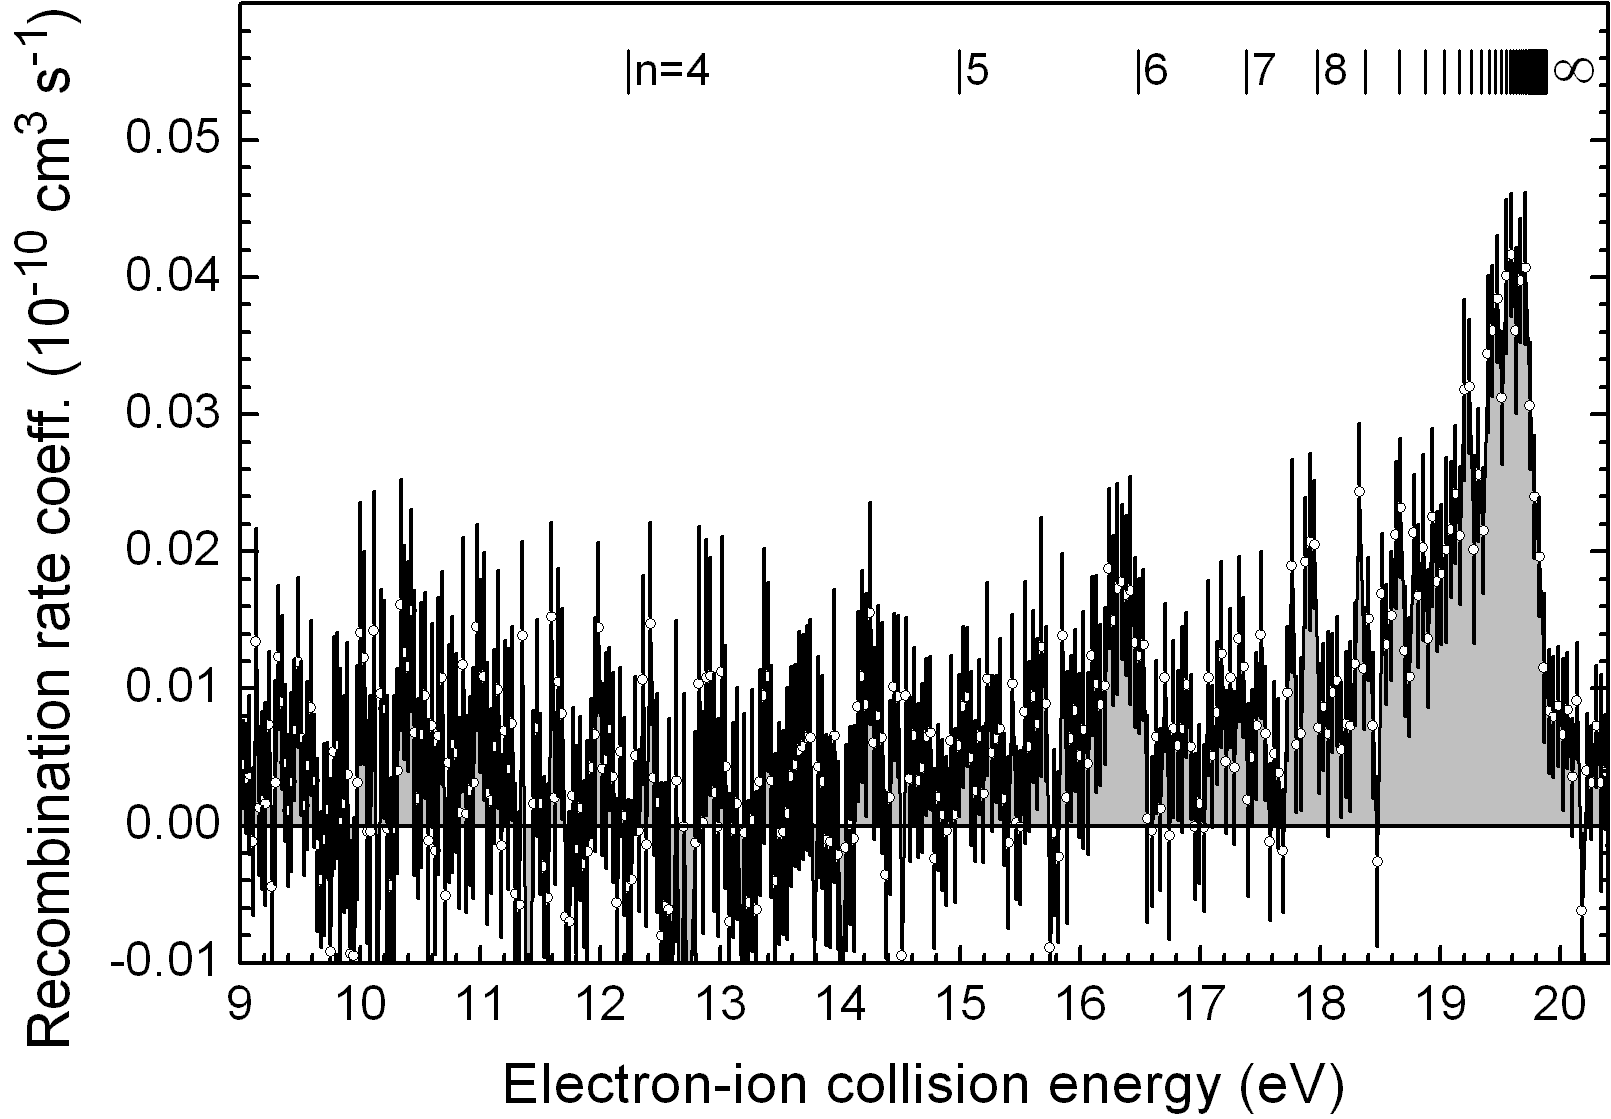
The much less intense resonances with associated with core excitations are expected to occur in the energy range –. The recombination rate coefficient measured in this energy range, using the thermionic cathode, is shown in Figure 2. Individual resonances of the associated Rydberg series are barely visible with rather large statistical uncertainties. Nevertheless the series limit at (Toresson, 1960) is clearly discernable. The maximum of the DR rate coefficient at the series limit is about two orders of magnitude smaller than that at the series limit. The energy range – is not shown because there is no significant structure exceeding , but in principle it comprises resonances associated with excitation with .
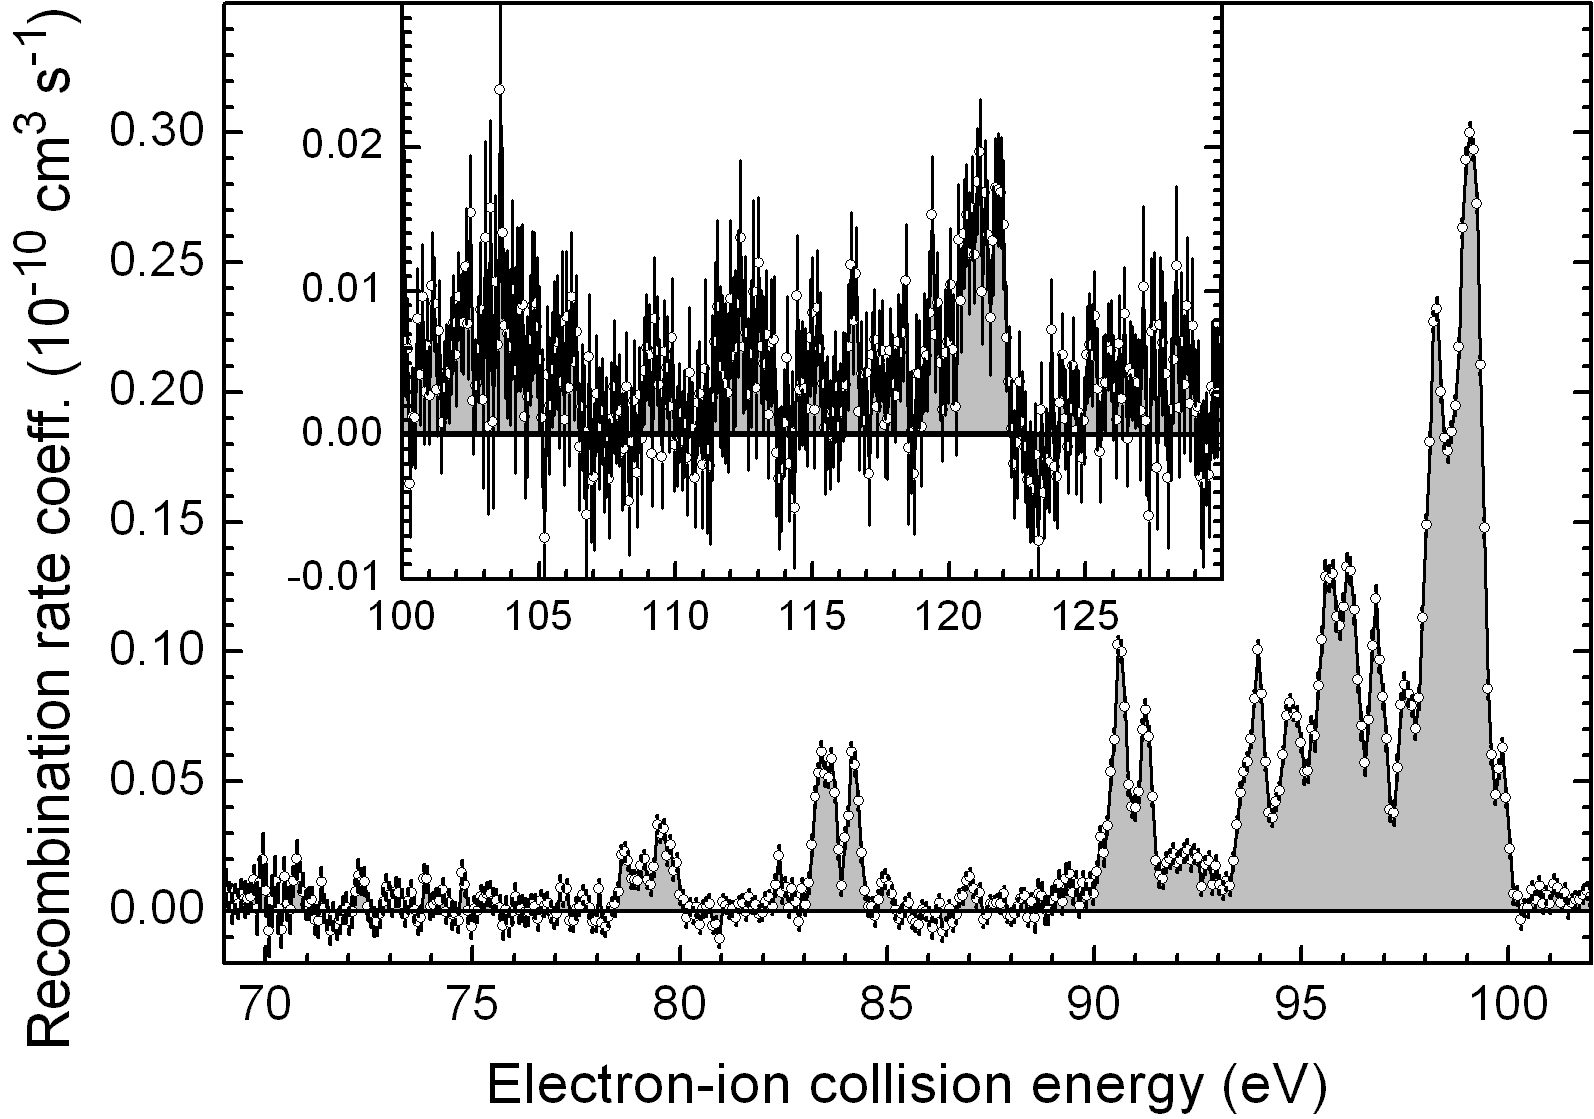
In Figure 3 we show the measured merged-beams recombination rate coefficient in the energy range –. This was measured using the thermionic cathode. The resonances in this energy range are associated with DR via () inner shell core excitations. Due to the large number of excitations in the displayed energy range (cf. Table 1) it is prohibitive to assign individual resonances. The main contribution to the rate coefficient is most probably due to core excitations. Theoretical calculations suggest that DR by excitations is insignificant (Altun et al., 2006). The energy range from up to was also scanned and found to fluctuate with peak-to-peak variations up to , not showing any significant structure.
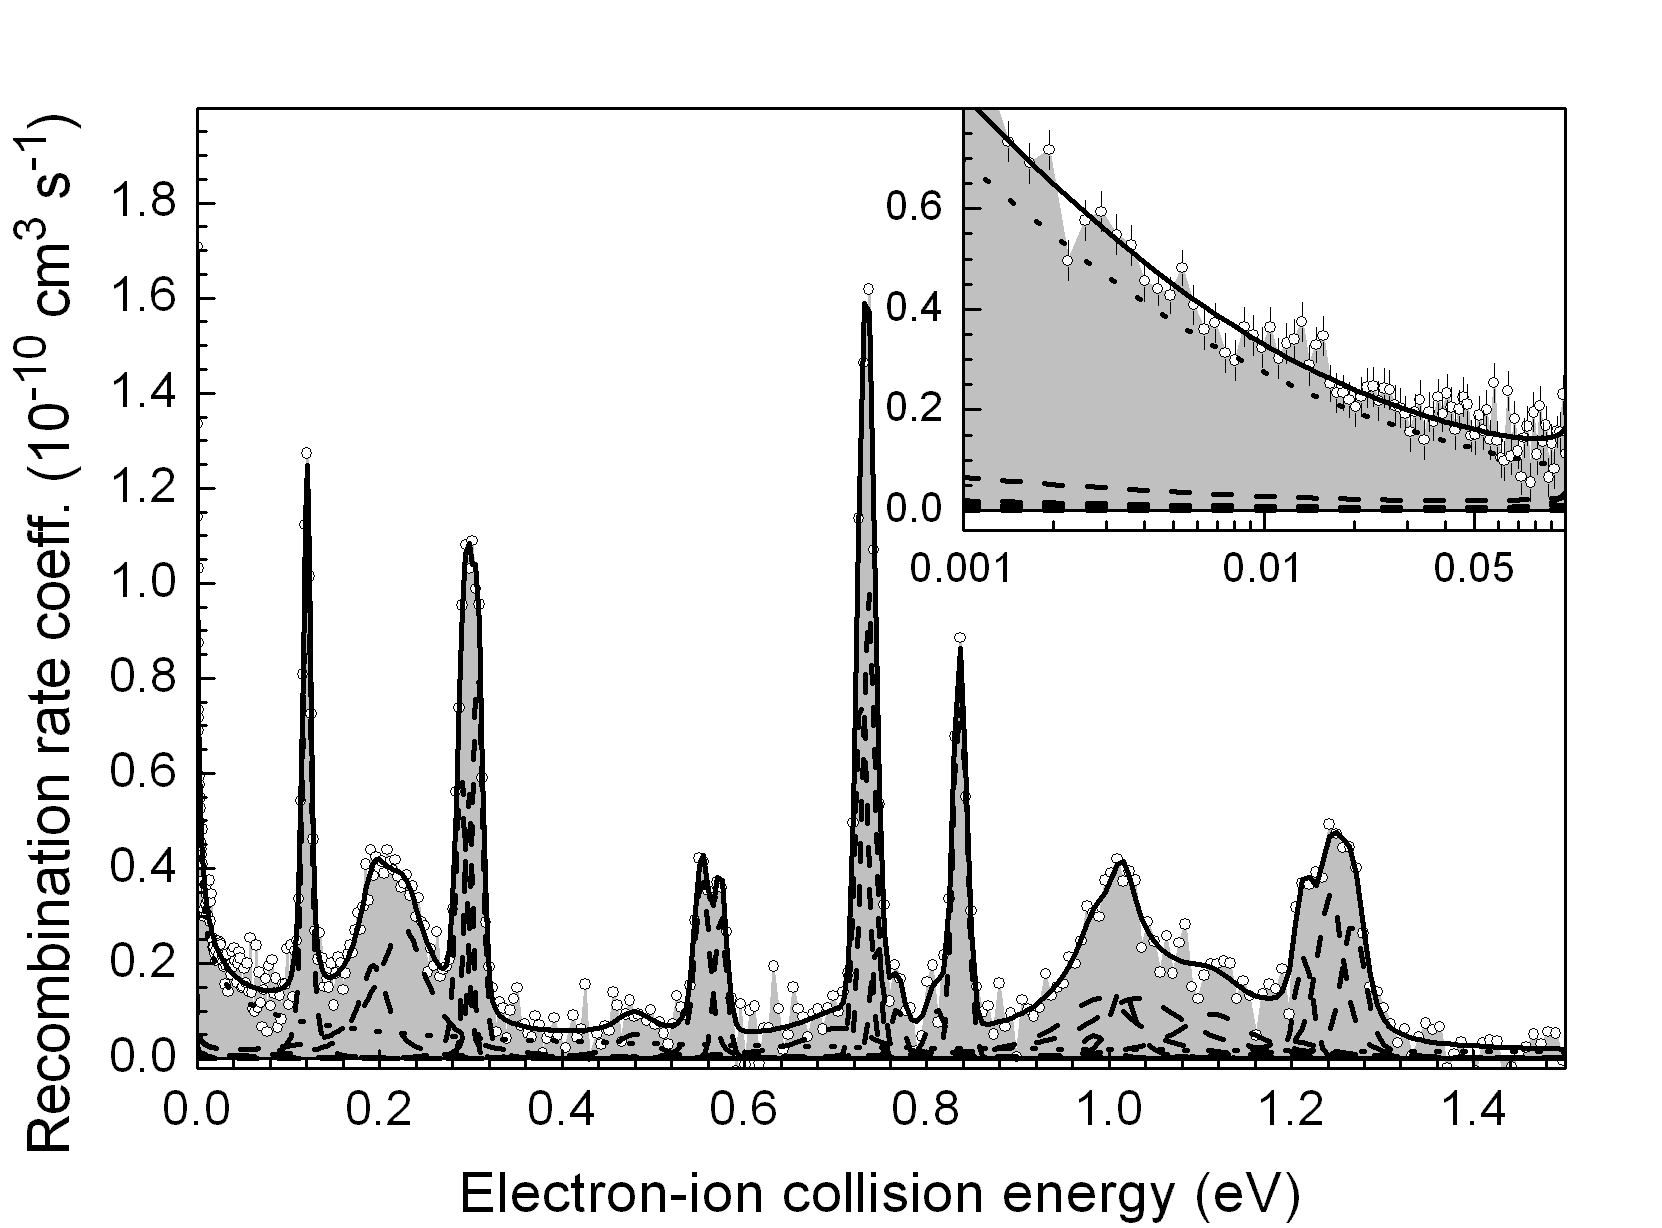
The calculated RR rate coefficient as well as 25 DR resonances fitted to to the measured DR spectrum in the energy region below 1.5 eV is shown in Figure 4. This fit is independent of the theoretical predictions and is explained in detail in Section V.1. For the comparison with the theoretical calculation shown in the Figures 5, 6, and 7 the non-resonant RR contribution was subtracted from the measured merged-beams recombination rate coefficient at all energies. The merged-beams RR rate coefficient was derived by convolving the RR cross section with the experimental electron energy distribution. The RR cross section was calculated with a hydrogenic formula (Eq. (12) of Ref. Schippers et al., 2001), taking into account field ionization of loosely bound high Rydberg electrons inside the storage ring bending magnets Schippers et al. (2001).
IV.2 Theoretical results
To simulate the observed DR spectra at different energies of the initially free electron, detailed computations have been carried out for the and resonant electron capture and its subsequent radiative stabilization. The first DR resonance () is found at about , i.e., very close to zero energy of the incident electron. The exact energies and strengths of resonances close to the threshold are particularly important for the determination of reliable plasma recombination rate coefficients at low electron temperatures. Therefore, special care was taken with regard to the doubly-excited magnesium-like states from the final configurations of the recombined ion.
For the – low-energy part of the DR spectrum, a series of computations has been carried out. In the first approach, we included all the levels within the and configurations of the recombined ion. Apart from these low-lying levels with energies both below and above the threshold, we incorporated in a further step also the levels of the and configurations as well as later all the levels with and , respectively. To keep the number of CSF manageable, levels with higher and were not treated. As known from previous computations (Dong et al., 1999; Fritzsche et al., 2000) for the low-lying levels of multiply charged ions, such a systematic enlargement of the wave function expansion (4) typically improves the positions of the resonances significantly. For magnesium-like ions, moreover, many of the configurations ‘overlap’ with each other in energy and, hence, ‘new’ resonances may appear in the calculated low-energy part of the theoretical DR spectrum, if the configuration space is increased. Using the single and double excitations from above, we obtained an expansion of up to 1073 CSF for the intermediate and the final-state wave functions of the Si III ions.
For the part of the DR spectrum we could include only levels of and , since the number of open shells involved is increased as compared to the excitations. In the calculation the associated resonances appeared in the energy region – of the incident electrons. For these inner-shell excited spectra, further contributions from the core polarization or core–core excitations need to be omitted owing to the size requirements of the corresponding wave function expansions. The incorporation of double excitations from the and shells would result in expansions of several hundred thousand CSF, i.e., a size which is unfeasible for the computation of DR and autoionization properties.
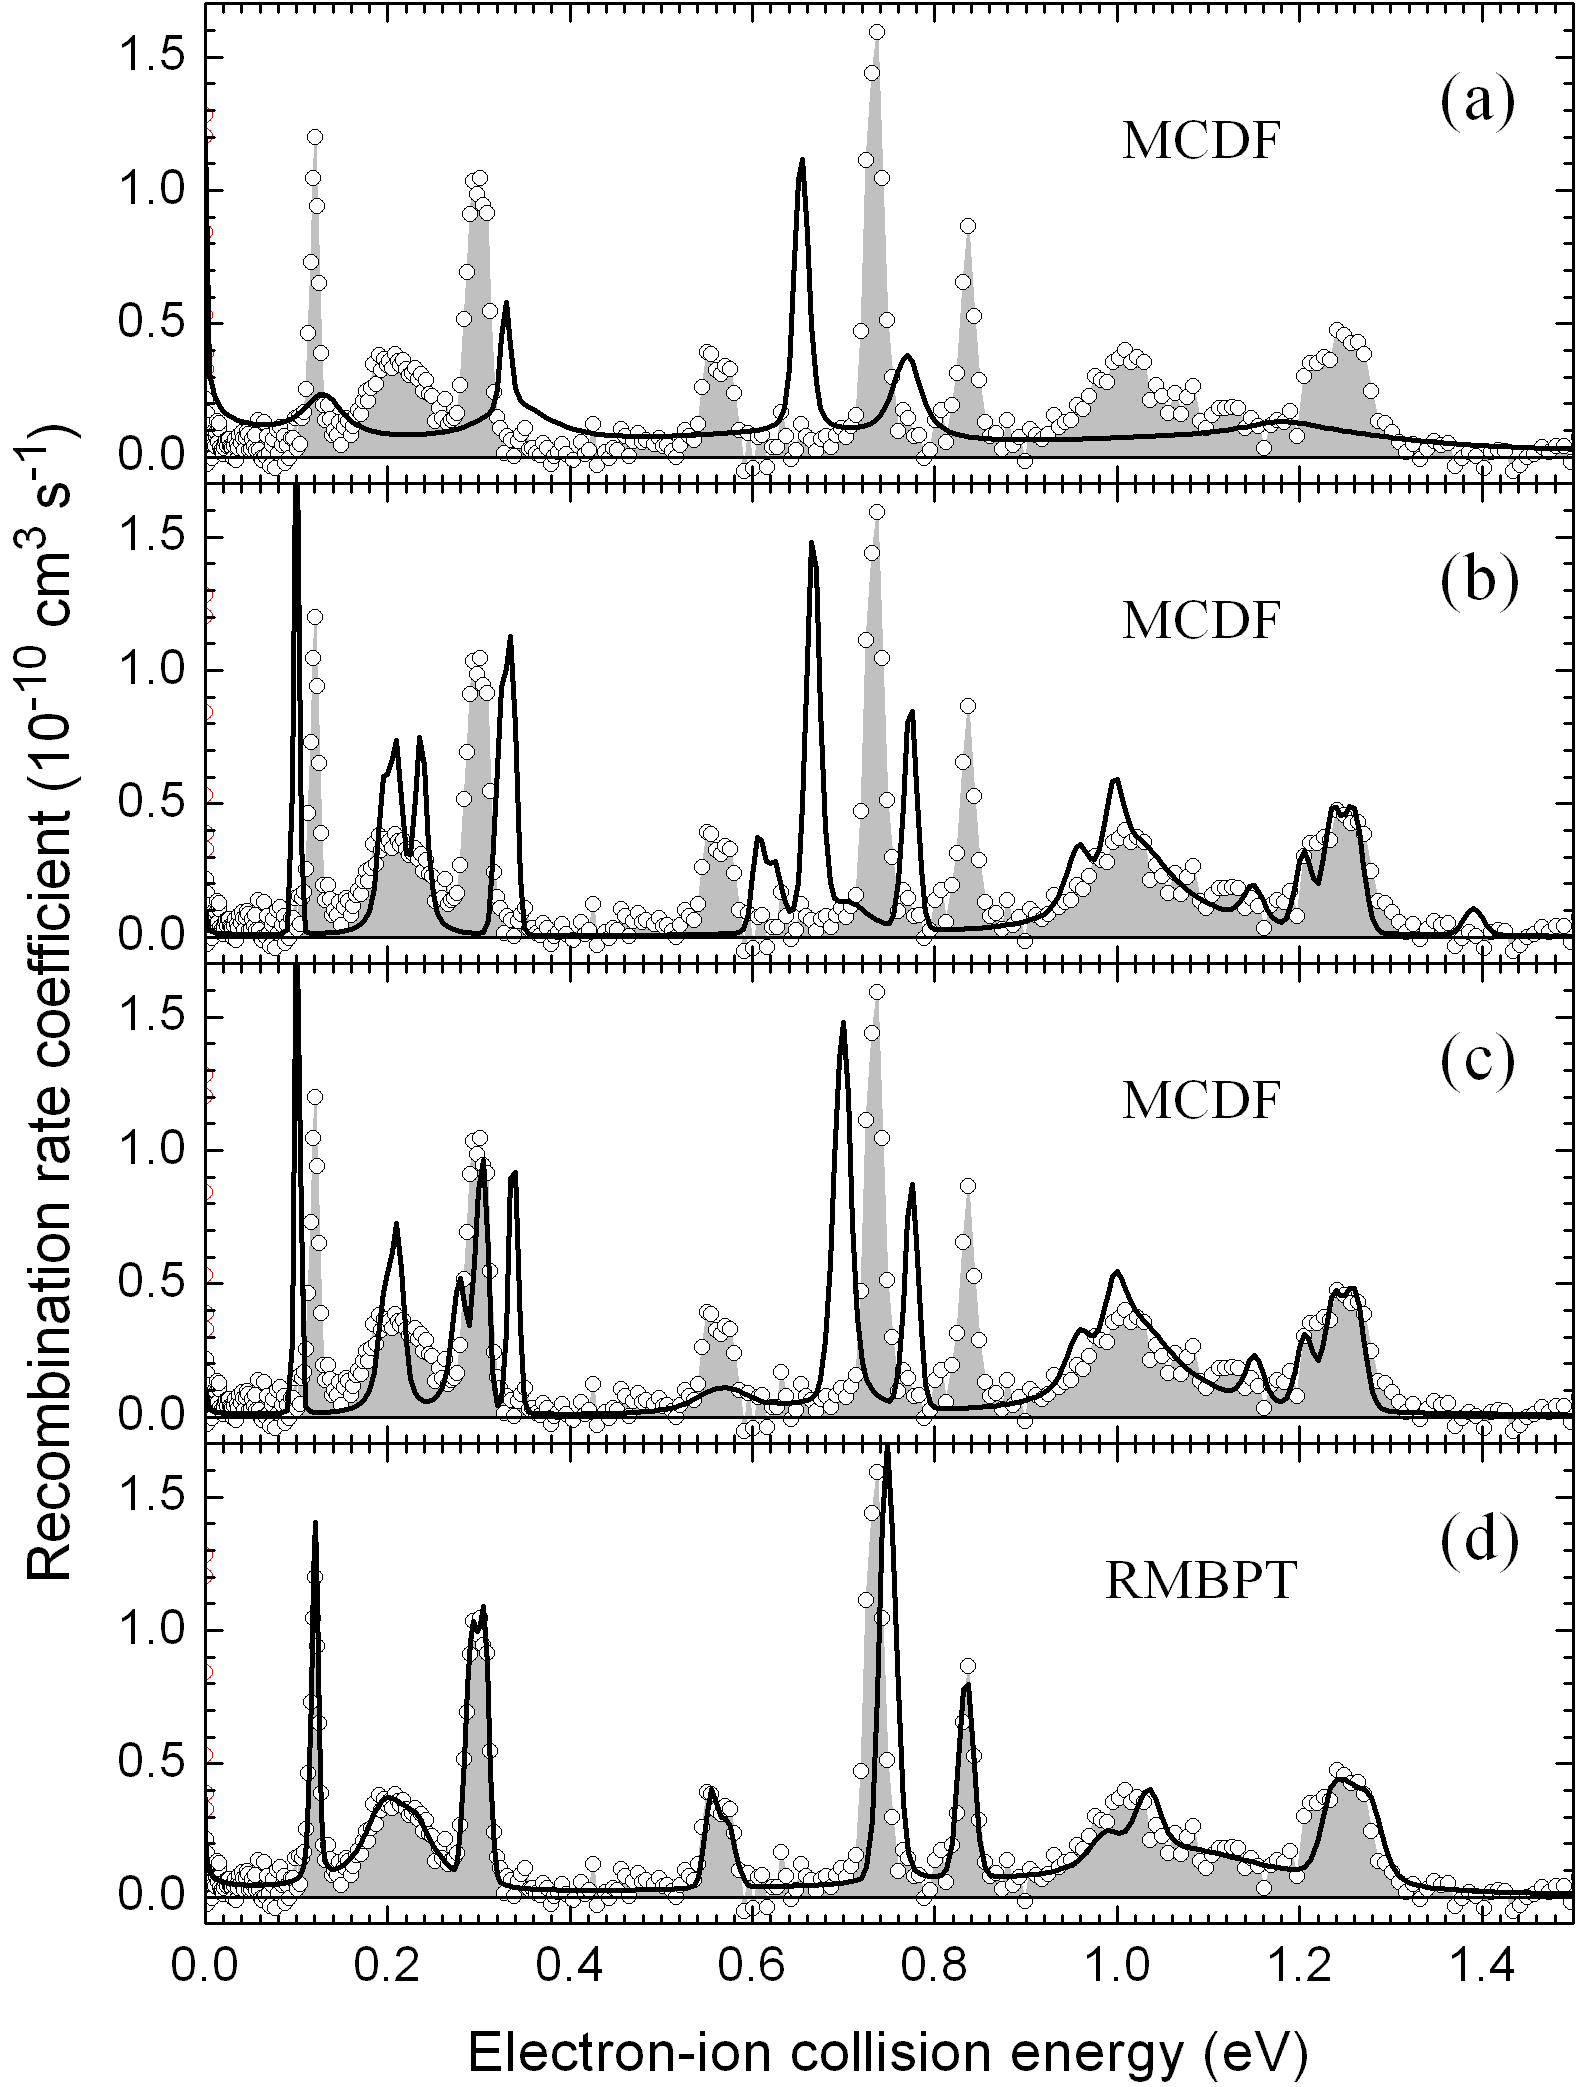
Figure 5 displays the experimental Si IV DR spectrum in the energy region of –, with the nonresonant ‘background’ subtracted from the experimental results. In this figure, the observed spectrum is compared with theoretical results from different approximations. In all of these calculations, our ‘best’ wave function expansion has been applied, including the single and double excitations as discussed above. The computations differ however in the set of the one-electron orbital functions used for the representation of the initial sodium-like ions. Figure 5(a), for instance, shows the spectrum in which both the initial and final states of the recombined ion were described by a common set of orbitals, neglecting the rearrangement of the electron density in the course of the dielectronic capture (or decay) of the ions. Apparently, quite a strong effect arises from this rearrangement of the electron density as seen from Figure 5(b) and 5(c), for which two independent sets of orbital functions were utilized in the representation of the initial and the recombined ion states. Figures 5(b) and 5(c) only differ in the treatment of the exchange interaction for the incoming electron. While Figure 5(b) shows the simulation for a static potential due to the charge distribution of the initial ion (‘no exchange’), 5(c) incorporates the exchange interaction of the incident electron with regard to the bound-state density. Therefore, Figure 5(c) represents our best approximation within the MCDF approach. Despite the fact that the orbitals are not quite orthogonal in the computation of the two-particle matrix elements, the Auger amplitudes [Eq. (6)] were evaluated by using the techniques of Racah’s algebra, i.e., for assuming orthogonality for all inactive electrons in these transition amplitudes Fritzsche et al. (2007).
Figure 5(d) displays the comparison of the present experimental data with the RMBPT result of Orban et al. Orban et al. (2007) convolved with the electron energy distribution of the TSR photocathode electron beam. Compared to their experiment, where electron beam temperatures and were found, the energy resolution is higher in the present experiment. (, , see Section III). Our high-resolution experiment provides a more stringent test of the RMPBT calculation which represents the measurement almost perfectly but cannot easily be extended to energies beyond where an increasing number of resonances can contribute to the DR spectrum.
| dominating | (eV) | ( eV cm2) | ||
|---|---|---|---|---|
| LS term | MCDF | RMBPT | MCDF | RMBPT |
Table 2 displays the assignment and position of the 28 lowest resonances in the energy region calculated with the MCDF method as well as the corresponding RMBPT results of Orban et al. (2007). In addition to the energies of these resonances, this table also includes the weights of the dominant terms as well as the resonance strengths. The weights of the leading LS terms have been obtained by a unitary transformation of the wave functions from the -coupled into a -coupled basis Gaigalas et al. (2004). While the lowest 11 resonances appear rather pure in coupling ( %), some larger admixtures are found for a few of the higher-lying resonances. As mentioned above, all data in this table correspond to our best representation of the resonances and by including the effects of the rearrangement of the electron density and the exchange interaction (cf. Fig. 5c). The lowest resonances in the part of the DR spectrum belong to the level, followed by the fine-structure levels of the term. Apparently, all levels from the and configurations are below the DR threshold.
At energies below the RMBPT results of Orban et al. (2007) are in excellent agreement with the present measurements [Fig. 5(d)]. At higher energies, where the MCDF results reproduce the experimental findings slightly better than at lower energies, the RMBPT resonance positions are at somewhat too high energies as can also be seen in the comparison with the experimental data of Orban et al. (2007). In our work, this slight discrepancy is more pronounced because of the increased experimental resolution and because of reduced statistical uncertainties in the present experiment. With a few exceptions, MCDF and RMBPT resonance energies agree with one another to within , often even to within .
Figures 6 and 7 display our theoretical MCDF DR spectrum compared with experiment for and DR. As described above, all configurations with have been taken into account for DR. The incorporation of further configurations with even higher principal quantum numbers has no effect upon the low-lying resonances for energies above the threshold. Although the basic features are well described in these spectra, some deviations in the positions and strengths of the peaks remain which we attribute to neglected correlation and many-electron effects in the system.
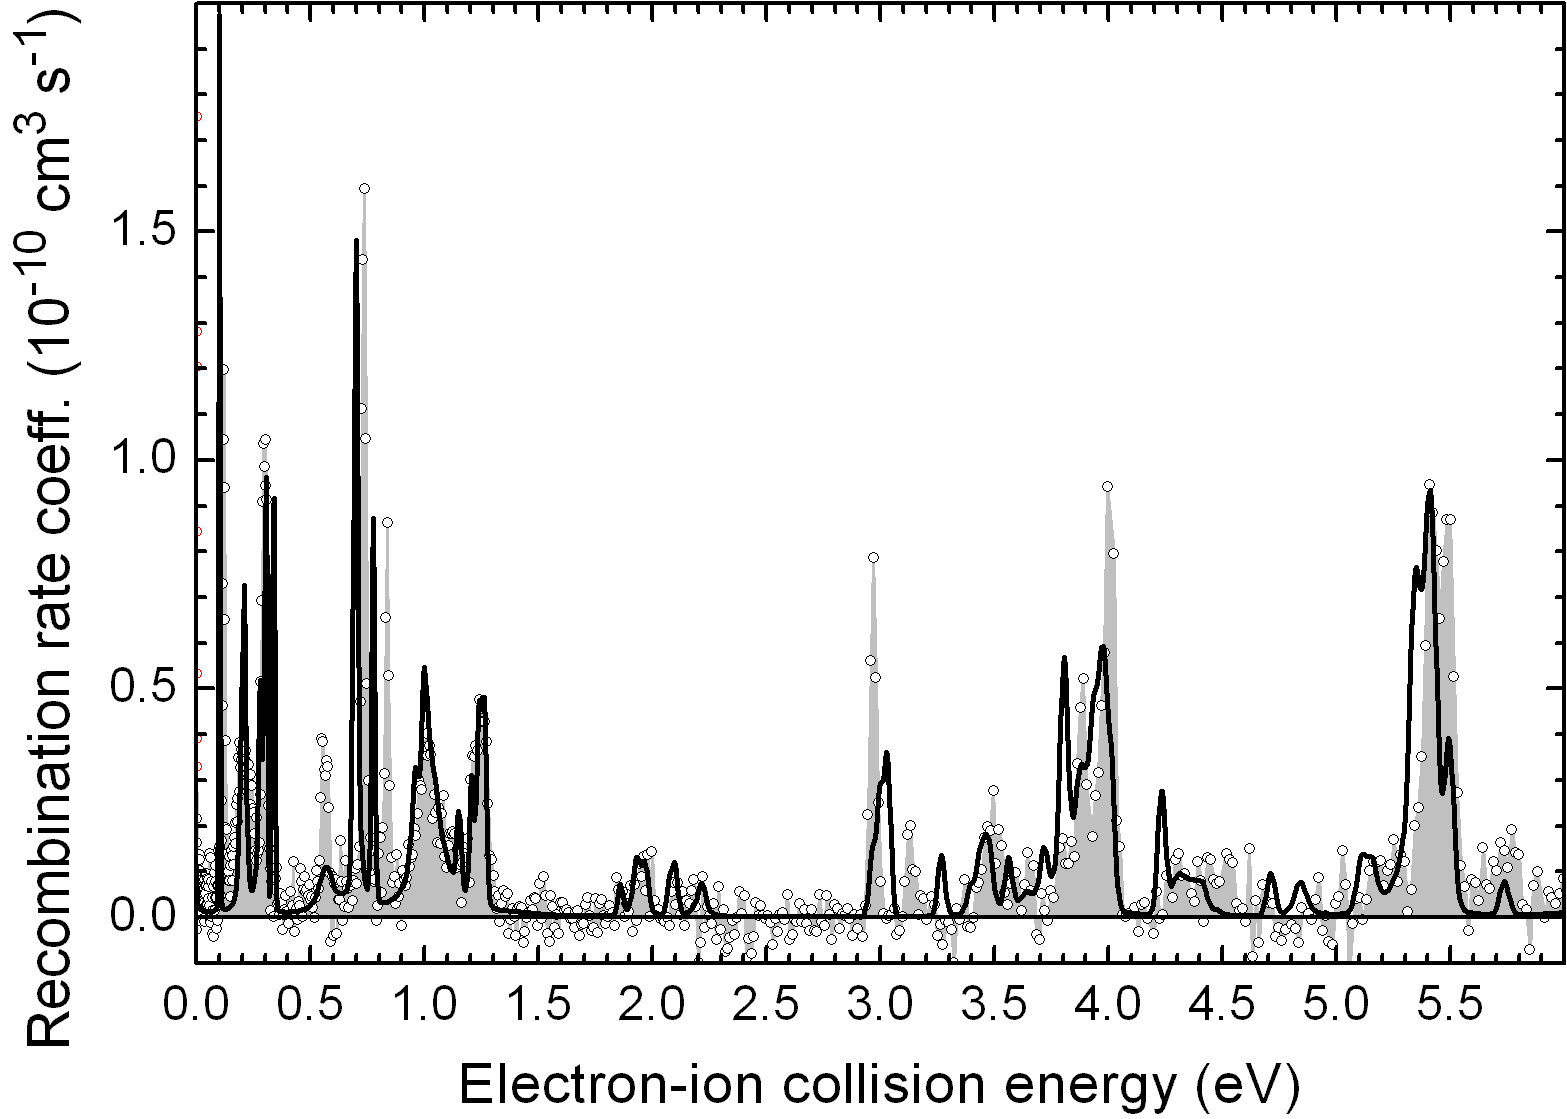
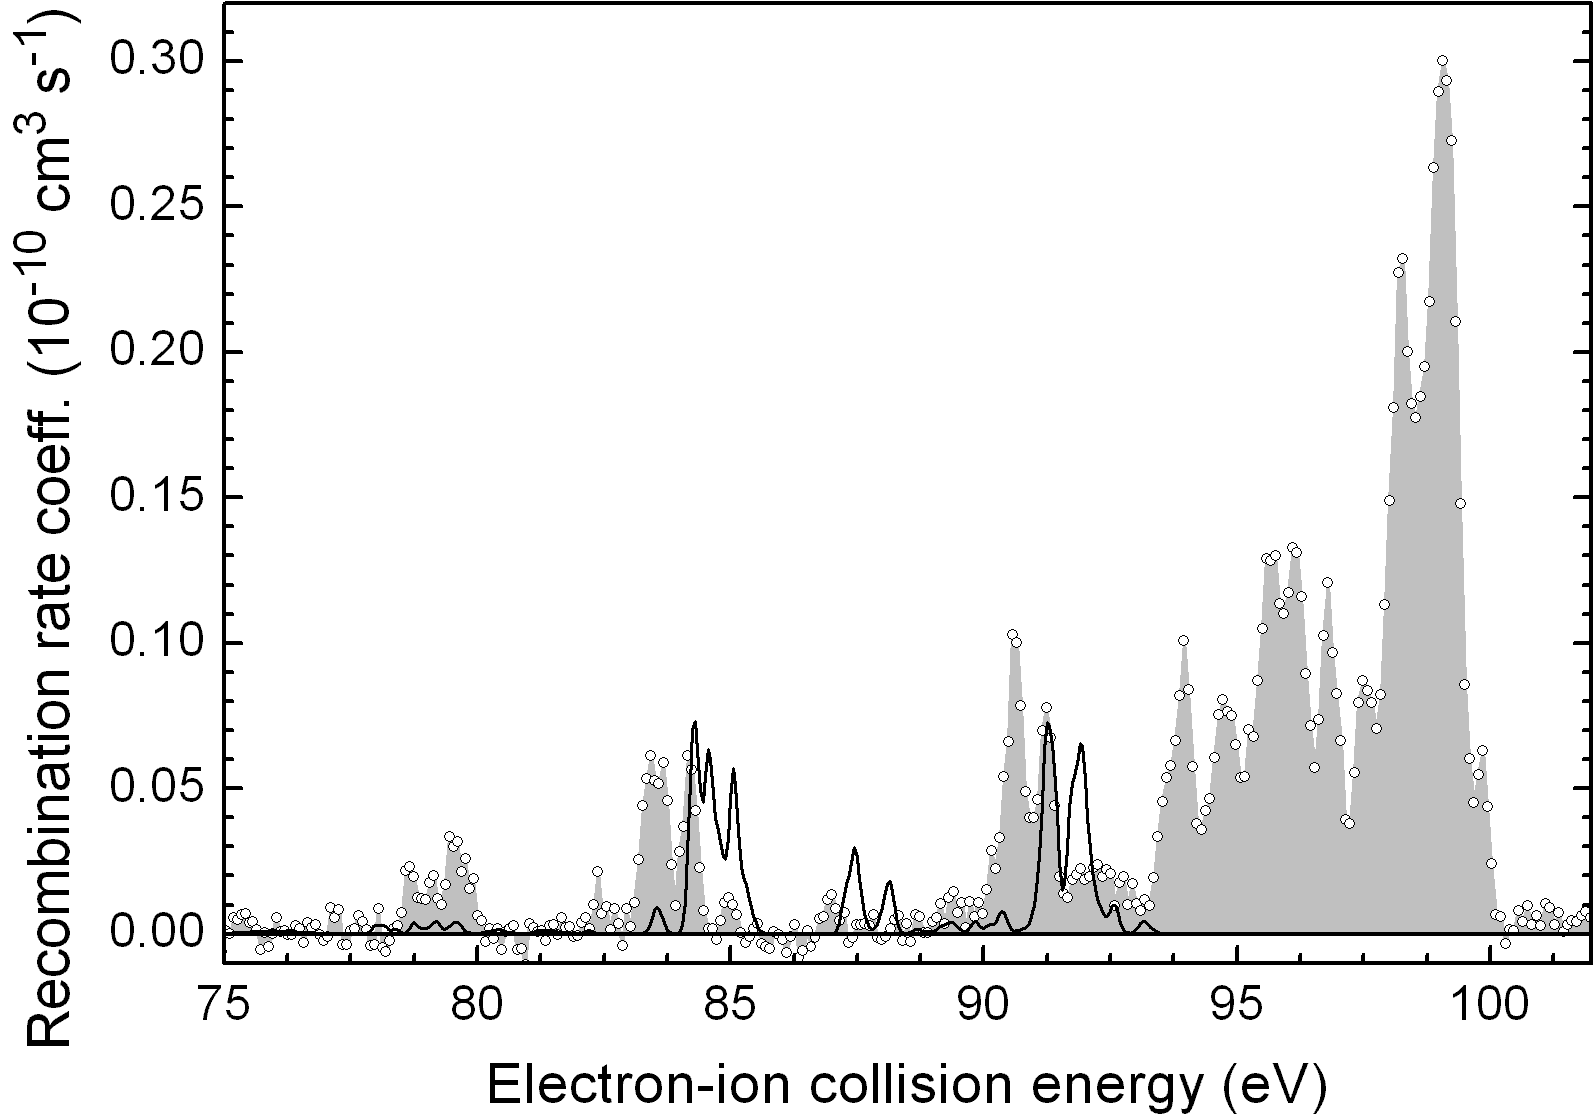
In addition to calculations of the low-lying resonances associated with and core excitations, computations have been carried out also for all and resonances which are found to occur starting at . For this high-energy part of the spectrum, we expect only a rough agreement between our computations and experiment as the electronic structure of the intermediate resonances now includes four open shells which do not allow any systematic enlargement of the configuration basis. For this part of the spectrum, therefore, the computations have been restricted to allow only one electron in the shell. As seen in Figure 7, only some of the resonances at and are reproduced by our simulations but they are shifted upwards in energy by about .
Apart from the radiative stabilization of the intermediate resonances by E1 electric-dipole decay, we explored also the effects of higher multipoles (M1, E2, M2) in the coupling of the radiation field. These ‘multipoles’ are well suppressed for neutral systems by at least 5 orders of magnitude but become important for highly-charged ions. For the initially triply ionized Si IV ions, these contributions are still negligible at the present level of accuracy for the simulation of the DR spectra in Figures 5–7.
V Plasma rate-coefficients
DR rate coefficients for a Maxwellian plasma can be derived from the experimental merged-beams recombination rate coefficient and the theoretical cross section. This is done in the following sections. Of particular interest for astrophysical model calculations are the plasma DR rate coefficients in the electron temperature ranges where Si IV is formed in astrophysical plasmas. The approximate temperature range where Si IV forms in photoionized and collisionally ionized plasmas can be obtained from the work of Kallman and Bautista (2001) and Bryans et al. (2006), respectively. For photoionized plasmas, Kallman and Bautista (2001) find that the fractional Si IV abundance peaks at a temperature of . The ‘photoionized zone’ may be defined as the temperature range where the fractional abundance of a given ion exceeds 10% of its peak value. For Si IV this corresponds to a temperature range of –. Using the same criterion and the fractional abundances of Bryans et al. (2006), for coronal equilibrium the Si IV ‘collisionally ionized zone’ is estimated to extend over a temperature range of –. It should be kept in mind that these temperature ranges are only indicative. They depend, in part, on the accuracy of the underlying atomic data base.
V.1 Derivation of the plasma DR rate coefficients
The DR rate coefficient in a Maxwellian plasma is derived by convolving the DR cross section with an isotropic Maxwell-Boltzmann electron energy distribution as detailed by Schippers et al. (2001, 2004). To derive a meaningful plasma DR rate coefficient from a total merged-beams rate coefficient there are some issues that require special consideration.
Interference between DR and RR is typically unimportant (Pindzola et al., 1992). Hence here we subtract, the non-resonant RR contribution from the measured merged-beams recombination rate coefficient. The applied merged-beams RR rate coefficient was the same as used for the correction of the recombination rate coefficient [Eq. (7)] at the reference point as well as that which was subtracted from the experimental merged-beams recombination rate coefficient for comparison with theoretical results (cf. Sec. IV.1).
When the electron-ion collision energy is larger than the experimental energy spread , one can use instead of for the convolution. When , the energy spread influences the outcome of the convolution of the cross section. In order to account for this effect, the low energy DR cross section was extracted by fitting DR resonance line-shapes to the measured DR spectrum in the energy region below (Fig. 4), independent of the theoretical predictions above (see Ref. (Schippers et al., 2004) for a more detailed description of the method).
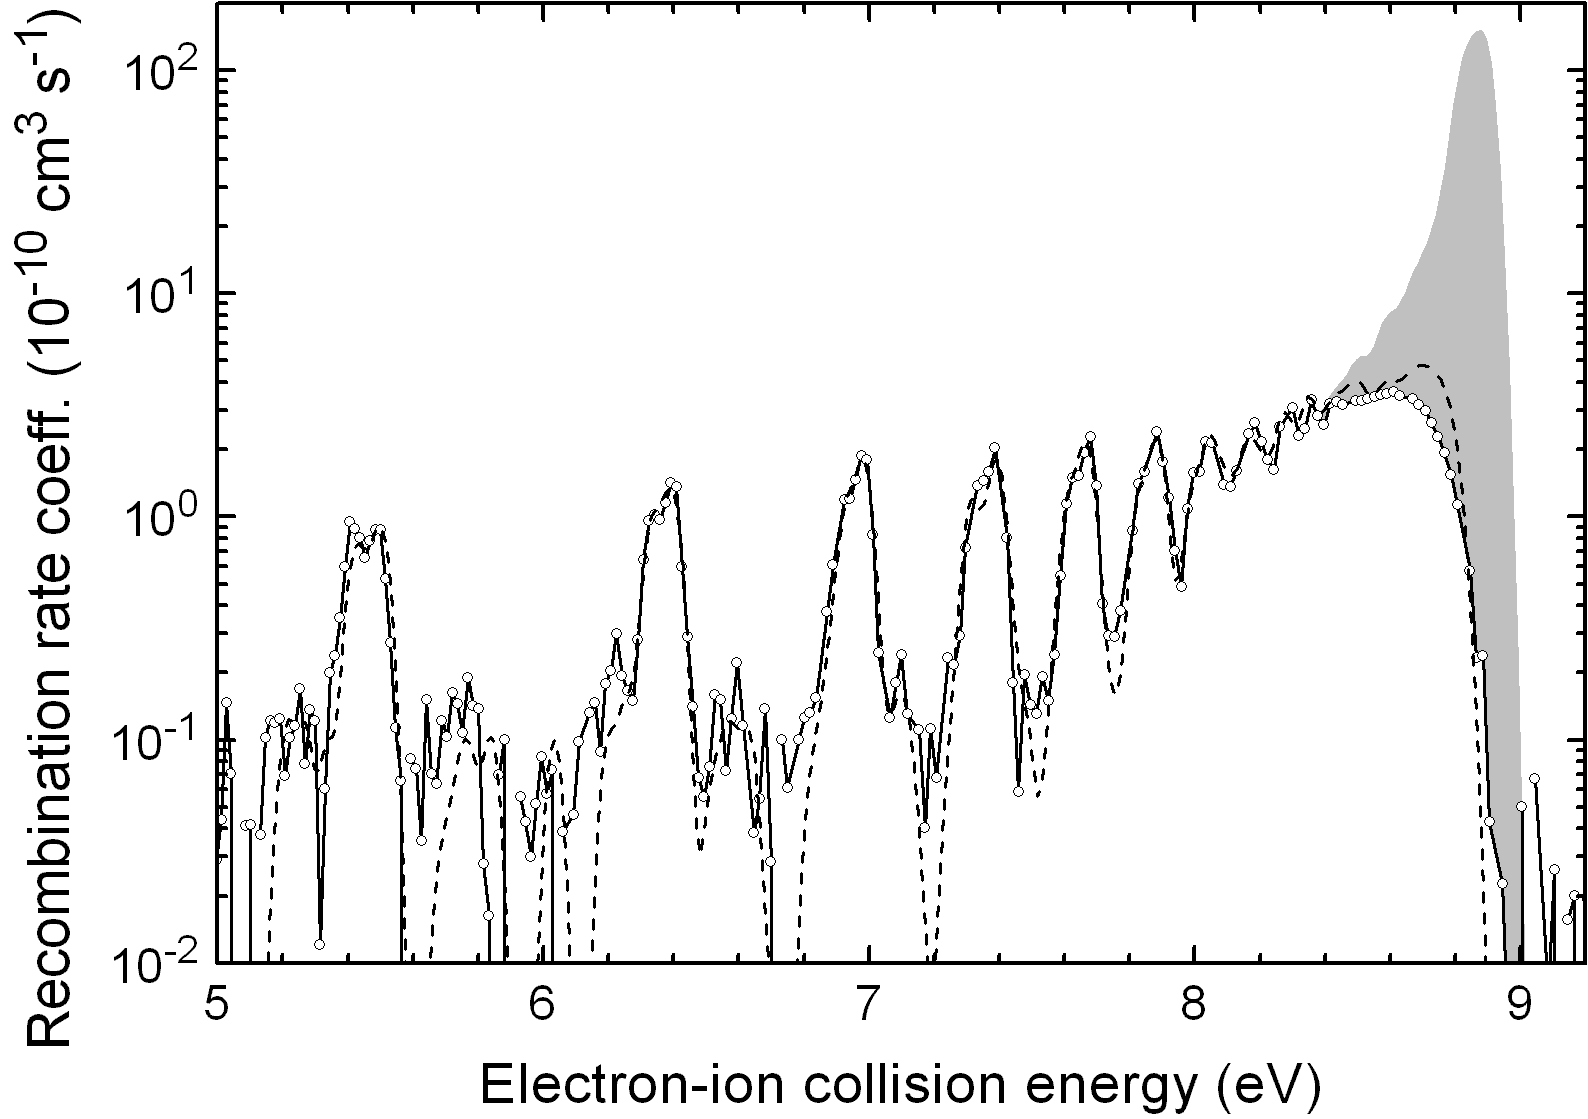
Field ionization of the loosely bound high Rydberg electron in the recombined ions can result from the motional electric fields that the ions experience inside the storage ring bending magnets (Schippers et al., 2001). The ion beam on its way to the detector passes the strongest electrical field in the dipole bending magnet in front of the detector. From this electric field the critical quantum number for field ionization is , i.e., in the present experiment only RR and DR involving capture into Rydberg levels with quantum numbers less than contribute fully to the measured merged-beams recombination rate coefficient. Due to radiative decay of higher Rydberg states on the way from the interaction section to the detector, the field ionization cutoff is not sharp but somehow smeared out to . Similar to the approach of Schippers et al. (2001, 2004) the missing DR resonance strength up to was estimated from a theoretical calculation using the AUTOSTRUCTURE code (Badnell, 1986). is an arbitrary upper limit beyond which no significant contribution to the total DR cross section is expected. Although the AUTOSTRUCTURE code does not reproduce the resonance structure below (cf. Fig. 1 of (Orban et al., 2006)) as accurately as our present MCDF calculations, it reproduces the more regular structures of Rydberg resonances between and when the calculated rate coefficient is multiplied by a constant factor of . The unmeasured DR contribution due to exceeds the measured contribution by more than one order of magnitude. This is shown in Figure 8. The DR contribution for DR from – was added to the measured spectrum by adding the difference between the measured rate coefficient and the adjusted AUTOSTRUCTURE result in the energy range (grey shaded area in Figure 8).
The series with its limit at about was not corrected for field ionization losses of high Rydberg states because its contribution is negligible compared to the series limit. As the strengths of resonances contributed by DR fall much faster with increasing than the strength of DR resonances, and because of the much smaller contribution of DR, the field ionized contribution for DR with was also not corrected for field ionization losses, either.
The non-measured contribution to the plasma DR rate coefficient ranges in the photoionized zone from only at to at . It has its maximum () at a plasma electron temperature of . In the collisionally ionized zone the contribution ranges from at to at . The contribution falls off slightly towards higher temperatures and is still at . The resulting plasma DR rate coefficient with and without the correction of field ionization losses is shown in Figure 9.
For convenient use in astrophysical modeling codes the Si IV to Si III plasma DR rate coefficient was fitted using
| (9) |
The fitting parameters and are given in Table 3. The fit deviates by less than from the experimentally-derived result in the temperature range .
| 1 | ||
|---|---|---|
| 2 | ||
| 3 | ||
| 4 | ||
| 5 | ||
| 6 | ||
| 7 | ||
| 8 | ||
| 9 |
V.2 Comparison with present theory
In Figure 9 we compare the plasma DR rate coefficient derived from the MCDF calculation in the electron-ion collision energy range – and a plasma DR rate coefficient derived from DR merged-beams resonances measured in the same electron-ion collision energy range. We find good agreement in the comparison of these two plasma DR rate coefficients. The plasma DR rate coefficient generated by DR resonances, calculated by means of the MCDF method for electron-ion collision energies below is somewhat lower than the rate coefficient generated from the experimentally-derived resonances in the same energy range. Between and the agreement is better than . Above a plasma electron temperature of the agreement is even better than .
V.3 Comparison with previous results
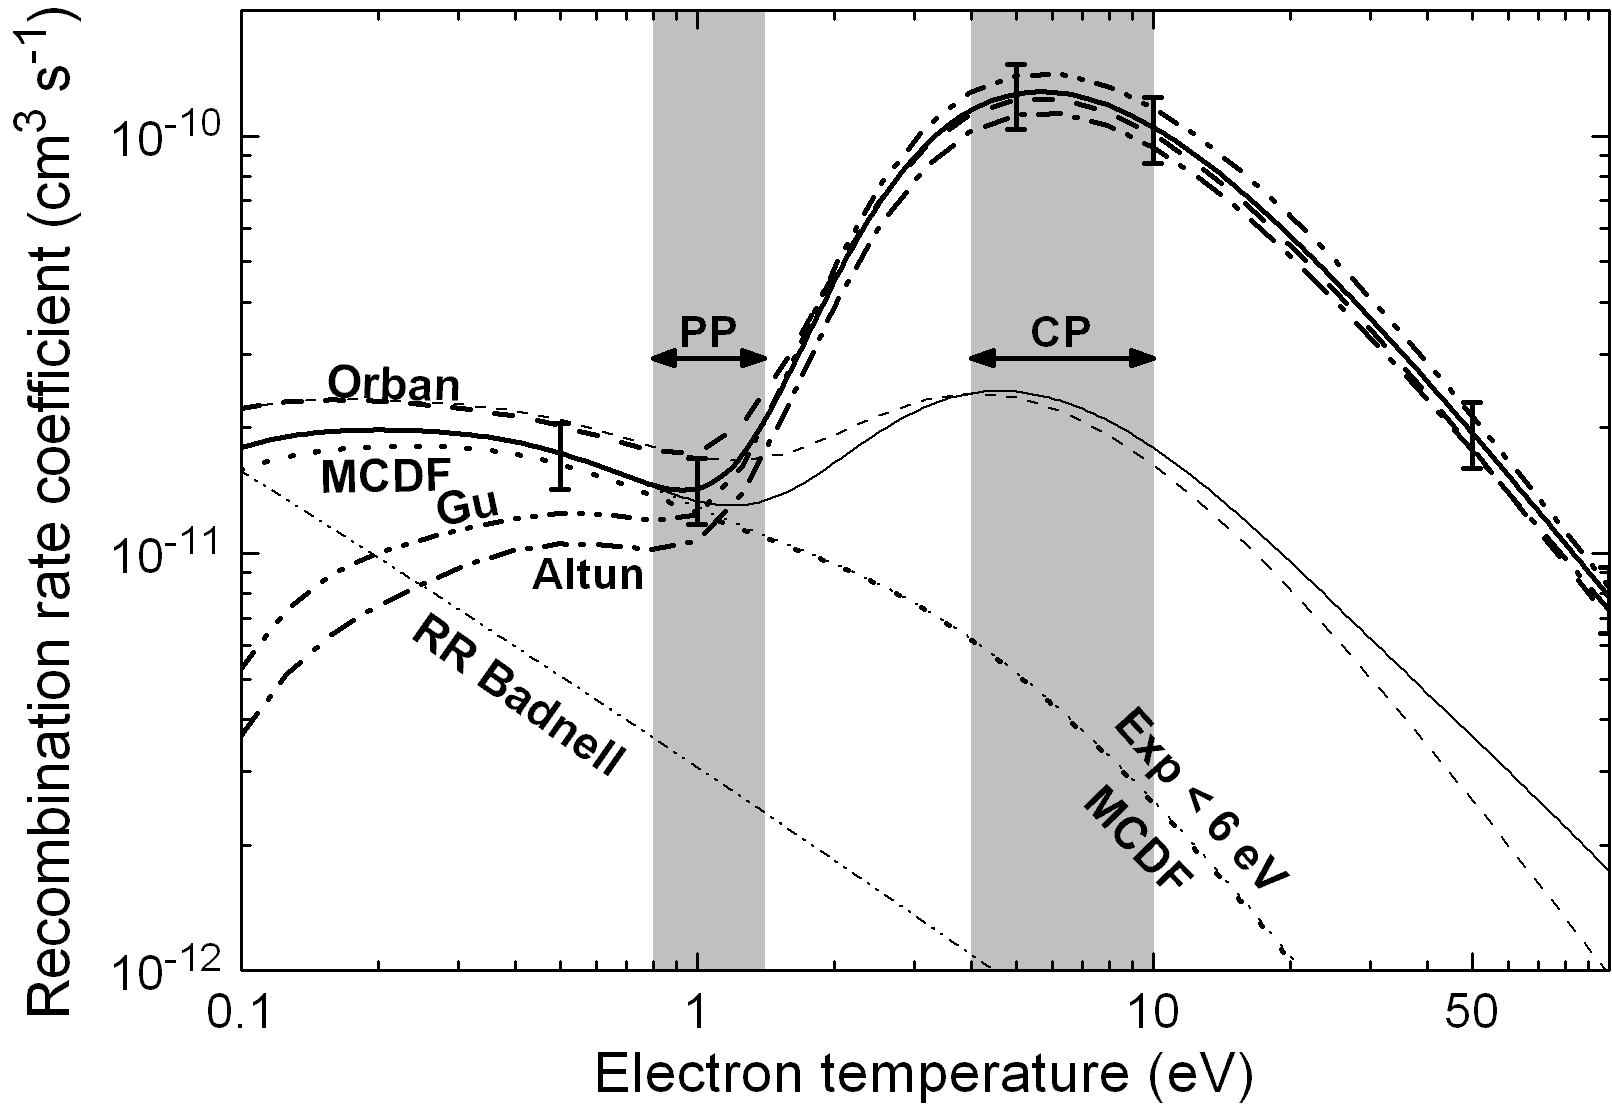
In Figure 9 we also compare our experimentally-derived DR rate coefficient with the experimental result of Orban et al. (2006) and with recent theoretical results of Gu (2004) and Altun et al. (2006).
In the collisionally ionized zone the rate coefficient of Gu (2004) overestimates our experimentally-derived plasma DR rate coefficient by about . In contrast, the plasma DR rate coefficient of Altun et al. (2006) underestimates the experimentally-derived plasma DR rate coefficient in the collisionally ionized zone by about . These deviations are within the experimental uncertainty. The difference between the two codes of about also gives an idea as to the uncertainty of these state-of-the-art DR calculations.
In the photoionized zone the experimentally-derived plasma DR rate coefficient is decisively determined (between at and at ) by the resonances which occur at electron-ion collision energies below . The calculations of Gu (2004) and Altun et al. (2006) comprise DR for all channels including the resonances. Despite the convolution of the DR cross section with the plasma electron energy distribution one can recognize that the calculations of Gu (2004) and Altun et al. (2006) either underestimate the strengths of the resonances at low energies or overestimate their energy positions. We can reproduce the qualitative trend of their plasma DR rate coefficients by shifting our experimentally derived resonances to higher energies by about . Both theoretical plasma DR rate coefficients underestimate the experimentally-derived rate coefficient in the photoionized zone. The rate coefficient of Altun et al. (2006) is a factor of – lower than the experimentally derived rate coefficient. For the rate coefficient of Gu (2004) the factor is –.
The comparison of our experimentally derived plasma DR rate coefficient with the experimental result of Orban et al. (2006) shows, that both data sets agree to within in the temperature rage –. In the photoionized zone the plasma DR rate coefficient of Orban et al. (2006) is – larger than our result. This larger deviation than in the collisionally ionized zone is probably associated with differences in the data reduction process. In the collisionally ionized zone the plasma DR rate coefficient of Orban et al. (2006) is less than lower than our result. The increasing deviation between the two plasma DR rate coefficients above is probably attributed to the fact that, in contrast to the work of Orban et al. (2006), the present experimentally derived DR rate coefficient also includes and even DR.
VI Conclusions
Electron-ion recombination of Si IV forming Si III was studied both experimentally using the merged-beams method at a heavy ion storage ring and theoretically by employing the MCDF method. We see good agreement in DR resonance strength and positions between the experiment and the MCDF calculations for DR in the investigated electron-ion collision energy range –. Below an energy of the accuracy in the energy positions was better than , the position of the resonance at the lowest energy was even accurate to within . A great advantage of the MCDF method is that it is conceptually much simpler to implement than other many–body techniques and, hence, can be applied also to more complex shell structures — if enough computational resources are available. We currently plan to extend the code in order to make computations feasible for atoms and ions with (initially) two or three electrons in their valence shell.
The present experimentally derived Si IV plasma DR rate coefficient agrees with the experimental result of Orban et al. (2006), to within the combined experimental errors. We found good agreement between the theoretical results of Gu (2004) and Altun et al. (2006) and our experimental result in the temperature range where Si IV forms in collisionally ionized plasmas. The agreement is reasonable at temperatures where Si IV is predicted to form in photoionized as. At temperatures below this the agreement becomes significantly worse with decreasing temperature. These findings demonstrate the necessity of benchmarking theoretical results with experiment, because modern theory still has difficulty calculating resonance energies reliably when the electron-ion collision energy and Rydberg level of the recombined ion are small.
Acknowledgements.
We gratefully acknowledge the excellent support by the MPI-K accelerator and TSR crews. This work was supported in part by the German federal research-funding agency DFG under contract no. Schi 378/5 and Fr 1251/13. DL and DWS were supported in part by the NASA Astronomy and Astrophysics Research and Analysis program and the NASA Solar and Heliospheric Physics program.References
- Lukić et al. (2007) D. Lukić, D. W. Savin, M. Schnell, C. Brandau, E. W. Schmidt, S. Böhm, A. Müller, S. Schippers, M. Lestinsky, F. Sprenger, et al., Astrophys. J. 664, 1244 (2007).
- Savin (2000) D. W. Savin, Astrophys. J. 533, 106 (2000).
- Levshakov et al. (2002) S. A. Levshakov, I. I. Agafonova, M. Centurión, and I. E. Mazets, Astron. Astrophys. 383, 813 (2002).
- Aguirre et al. (2004) A. Aguirre, J. Schaye, T.-S. Kim, T. Theuns, M. Rauch, and W. L. W. Sargent, Astrophys. J. 602, 38 (2004).
- Ferland et al. (1998) G. J. Ferland, K. T. Korista, D. A. Verner, J. W. Ferguson, J. B. Kingdon, and E. M. Verner, Publ. Astron. Soc. Pac. 110, 761 (1998).
- Schippers et al. (2001) S. Schippers, A. Müller, G. Gwinner, J. Linkemann, A. A. Saghiri, and A. Wolf, Astrophys. J. 555, 1027 (2001).
- Böhm et al. (2005) S. Böhm, A. Müller, S. Schippers, W. Shi, M. Fogle, P. Glans, R. Schuch, and H. Danared, Astron. Astrophys. 437, 1151 (2005).
- Böhm et al. (2003) S. Böhm, A. Müller, S. Schippers, W. Shi, N. Eklöw, R. Schuch, H. Danared, and N. R. Badnell, Astron. Astrophys. 405, 1157 (2003).
- Orban et al. (2006) I. Orban, P. Glans, Z. Altun, E. Lindroth, A. Källberg, and R. Schuch, Astron. Astrophys. 459, 291 (2006).
- Linkemann et al. (1995) J. Linkemann, A. Müller, J. Kenntner, D. Habs, D. Schwalm, A. Wolf, N. R. Badnell, and M. S. Pindzola, Phys. Rev. Lett. 74, 4173 (1995).
- Fogle et al. (2003) M. Fogle, N. R. Badnell, N. Eklöw, T. Mohamed, and R. Schuch, Astron. Astrophys. 409, 781 (2003).
- Orban et al. (2007) I. Orban, E. Lindroth, P. Glans, and R. Schuch, J. Phys. B 40, 1063 (2007).
- Schneider et al. (1995) D. Schneider, R. Bruch, A. Shlyaptseva, T. Brage, and D. Ridder, Phys. Rev. A 51, 4652 (1995).
- Ralchenko et al. (2006) Y. Ralchenko, F.-C. Jou, D. E. Kelleher, A. E. Kramida, A. Musgrove, J. Reader, W. L. Wiese, and K. Olsen, NIST Atomic Spectra Database :version 3.1.0: (National Institute of Standards and Technology, Gaithersburg, MD, 2006), available: http://physics.nist.gov/asd3.
- Toresson (1960) Y. G. Toresson, Ark. Fys. 18, 179 (1960).
- Tokman et al. (2002) M. Tokman, N. Eklöw, P. Glans, E. Lindroth, R. Schuch, G. Gwinner, D. Schwalm, A. Wolf, A. Hoffknecht, A. Müller, et al., Phys. Rev. A 66, 012703 (2002).
- Grant (1988) I. P. Grant, in Methods in Computational Chemistry, edited by S. Wilson (Plenum Press, New York, 1988), vol. 2, p. 1.
- Fritzsche (2002) S. Fritzsche, Phys. Scr. T100, 37 (2002).
- Parpia et al. (1996) F. A. Parpia, C. F. Fischer, and I. P. Grant, Comput. Phys. Commun. 94, 249 (1996).
- Fritzsche (2001) S. Fritzsche, J. Elec. Spectrosc. Rel. Phenom. 114-16, 1155 (2001).
- Fritzsche et al. (2005) S. Fritzsche, A. Surzhykov, and T. Stöhlker, Phys. Rev. A 72, 012704 (2005).
- Fritzsche et al. (2000) S. Fritzsche, C. F. Fischer, and C. Z. Dong, Comput. Phys. Commun. 124, 340 (2000).
- Zimmerer et al. (1990) P. Zimmerer, N. Grün, and W. Scheid, Phys. Lett. A 148, 457 (1990).
- Chen (1990) M. H. Chen, Phys. Rev. A 41, 4102 (1990).
- Badnell and Pindzola (1991) N. R. Badnell and M. S. Pindzola, Phys. Rev. A 43, 570 (1991).
- Fritzsche et al. (1991) S. Fritzsche, G. Zschornack, G. Musiol, and G. Soff, Phys. Rev. A 44, 388 (1991).
- Fritzsche et al. (1992) S. Fritzsche, B. Fricke, and W.-D. Sepp, Phys. Rev. A 45, 1465 (1992).
- Badnell (1986) N. R. Badnell, J. Phys. B 19, 3827 (1986), http://amdpp.phys.strath.ac.uk/autos/.
- Kilgus et al. (1992) G. Kilgus, D. Habs, D. Schwalm, A. Wolf, N. R. Badnell, and A. Müller, Phys. Rev. A 46, 5730 (1992).
- Lampert et al. (1996) A. Lampert, A. Wolf, D. Habs, J. Kenntner, G. Kilgus, D. Schwalm, M. S. Pindzola, and N. R. Badnell, Phys. Rev. A 53, 1413 (1996).
- Pastuszka et al. (1996) S. Pastuszka, U. Schramm, M. Grieser, C. Broude, R. Grimm, D. Habs, J. Kenntner, H.-J. Miesner, T. Schüßler, D. Schwalm, et al., Nucl. Instrum. Methods A 369, 11 (1996).
- Müller and Wolf (1997) A. Müller and A. Wolf, in Accelerator-based atomic physics techniques and applications, edited by J. C. Austin and S. M. Shafroth (AIP Press, Woodbury, 1997), p. 147.
- Grieser et al. (1991) M. Grieser, M. Blum, D. Habs, R. V. Hahn, B. Hochadel, E. Jaeschke, C. M. Kleffner, M. Stampfer, M. Steck, and A. Noda, in Proceedings of the 19th International Symposium on Cooler Rings and Their Applications, Tokyo, Japan, November 5–8, 1990, edited by T. Katayama and A. Noda (World Scientific, Singapore, 1991), pp. 190–198.
- Sprenger et al. (2004) F. Sprenger, M. Lestinsky, D. A. Orlov, D. Schwalm, and A. Wolf, Nucl. Instrum. Methods A 532, 298 (2004).
- Poth et al. (1988) H. Poth, B. Seligmann, W. Schwab, M. Wörtge, A. Wolf, R. Conti, W. Frieze, D. Gidley, A. Rich, M. Skalsey, et al., Hyperfine Interact. 44, 259 (1988).
- Orlov et al. (2004) D. A. Orlov, U. Weigel, D. Schwalm, A. S. Terekhov, and A. Wolf, Nucl. Instrum. Methods A 532, 418 (2004).
- Altun et al. (2006) Z. Altun, A. Yumak, N. R. Badnell, S. D. Loch, and M. S. Pindzola, Astron. Astrophys. 447, 1165 (2006).
- Dong et al. (1999) C. Z. Dong, S. Fritzsche, B. Fricke, and W.-D. Sepp, Mon. Not. R. Astron. Soc. 307, 809 (1999).
- Fritzsche et al. (2000) S. Fritzsche, C. Z. Dong, and E. Träbert, Mon. Not. R. Astron. Soc. 318, 263 (2000).
- Fritzsche et al. (2007) S. Fritzsche, J. Nikkinen, S.-M. Huttula, H. Aksela, M. Huttula, and S. Aksela, Phys. Rev. A 75, 012501 (2007).
- Gaigalas et al. (2004) G. Gaigalas, T. Zalandauskas, and S. Fritzsche, Comput. Phys. Commun. 157, 239 (2004).
- Kallman and Bautista (2001) T. Kallman and M. Bautista, Astrophys. J. Suppl. Ser. 133, 221 (2001).
- Bryans et al. (2006) P. Bryans, N. R. Badnell, T. W. Gorczyca, J. M. Laming, W. Mitthumsiri, and D. W. Savin, Astrophys. J. Suppl. Ser. 167, 343 (2006).
- Schippers et al. (2004) S. Schippers, M. Schnell, C. Brandau, S. Kieslich, A. Müller, and A. Wolf, Astron. Astrophys. 421, 1185 (2004).
- Pindzola et al. (1992) M. S. Pindzola, N. R. Badnell, and D. C. Griffin, Phys. Rev. A 46, 5725 (1992).
- Gu (2004) M. F. Gu, Astrophys. J. Suppl. Ser. 153, 389 (2004).
- Badnell (2006) N. R. Badnell, Astrophys. J. Suppl. Ser. 167, 334 (2006).