Phonon-induced linewidths of graphene electronic states
Abstract
The linewidths of the electronic bands originating from the electron-phonon coupling in graphene are analyzed based on model tight-binding calculations and experimental angle-resolved photoemission spectroscopy (ARPES) data. Our calculations confirm the prediction that the high-energy optical phonons provide the most essential contribution to the phonon-induced linewidth of the two upper occupied bands near the -point. For larger binding energies of these bands, as well as for the band, we find evidence for a substantial lifetime broadening from interband scattering and , respectively, driven by the out-of-plane ZA acoustic phonons. The essential features of the calculated band linewidths are in agreement with recent published ARPES data [F. Mazzola et al., Phys. Rev. B. 95, 075430 (2017)] and of the band linewidth with ARPES data presented here.
I Introduction
Numerous experimental and theoretical studies of graphene have been presented during the last decade.Castro Neto et al. (2009); Das Sarma et al. (2011) These investigations have revealed remarkable mechanical Lee et al. (2008), electronic Morozov et al. (2008), optical Bonaccorso et al. (2010), and thermal Balandin et al. (2008) properties. However, graphene is not considered to be a good BCS superconductor Bardeen et al. (1957) because of very weak electron-phonon coupling (EPC).Si et al. (2013) This is probably true when considering the bands crossing the Fermi level: for neutral graphene, two nearly-linearly dispersing bands touch at the Fermi level at the charge neutrality point, also called Dirac point. In this case, or even for extreme ranges of doping levels or electrostatic gating conditions, the density of states (DOS) is low, as well as the electron-phonon matrix element. On the other hand, the situation can be considerably different in other parts of the electronic spectrum. Recently, Mazzola et al. Mazzola et al. (2013, 2017) reported evidence of strong EPC in the -band; which was revealed in angle-resolved photoemission spectroscopy (ARPES) measurements with a substantial lifetime broadening and a pronounced kink in the dispersion.
The aim of the present combined theory and experimental study has been to get insight to the scattering process determining the EPC induced linewidths of the occupied bands and band. Of particular interest was to investigate the relative importance of the intraband and interband scattering as well as which dominant phonon modes drive the scattering. To the best of our knowledge, linewidth analysis of the bands is still missing in the literature. The phonon induced linewidth of the band has been studied by Park et al. Park et al. (2009) in the binding energy range 0-2.5 eV. In the lower part of this energy range our results agrees reasonably while in the upper part, our linewidths are about twice as large.
The intraband scattering, which is found to be driven by the high energy in-plane optical phonons, is an important scattering channel for both the and the band. For the two occupied uppermost bands this channel dominates near the EPC induced “kink”, about 200 meV below the top of these bands. However, the interband and scattering can be mediated by the existence of out-of-plane vibrational modes. Our calculations reveal a substantial contribution from these scattering channels, driven by in particular the out-of-plane acoustic ZA mode, at higher binding energies.
The paper is organized as follows. In next section, Sec. II we introduce the theoretical formulation of the EPC linewidth and outline the calculation of the electron and phonon band structure. In addition we give some details about the approximations used when constructing the deformation potential. In Sec. III we present the results of the linewidth calculations for bands and the band and compare with experimental data. Our summary and conclusions and some perspectives for future research are presented in Sec. IV.
II EPC-induced linewidth
Our calculations are based on the traditional theoretical framework where the distortion of the electronic Hamiltonian caused by lattice vibrations can be considered to be of first order.
In the low-temperature limit, which is the relevant case in the experiment reported by Mazzola et al. Mazzola et al. (2013), the thermal energy ( meV) is less than the typical phonon energy ( meV). In this case phonon emission dominates, while phonon absorption is suppressed.
The EPC contribution to the linewidth of a particular electron band and wave vector is calculated applying first order time dependent perturbation theory, the Fermi Golden Rule
| (1) | |||
where and represent the electron band energy and phonon frequency, respectively. The phonons are described by band index and wave vector . In the harmonic approximation the deformation potential is written
| (2) | |||
where denotes the center position of the unit cells and the positions of the A and B atoms within the unit cell. is a six dimensional polarization vector with components , where =(A,B) and index refers to the three Cartesian coordinates of the displacement vector . The derivative of the one-electron potential has six components .
A calculation of the EPS linewidth apparently requires information about the electron structure – band structure and wave functions, and phonon structure – band structure and polarizations fields. The electron structure is achieved from a tight-binding (TB) calculations and the phonon structure from a force constant model (FCM).
II.1 Electron structure
In the TB approximation the wave functions are written
| (3) |
where the Bloch orbitals are given by
| (4) |
where denotes the number of unit cells to be summed over, the basis . The electronic bands and coefficients are obtained by solving the generalized eigenvalues problem:
| (5) |
where we use the short hand index notation . denotes the overlap matrix elements. We apply the TB parameter-set shown in Table. 1.
| 0.00 | 5.50 | 5.90 | |||
| 0.20 |
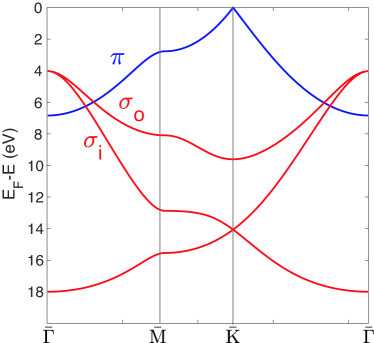
The calculated band structure is shown in Fig. 1 and agrees well with our Density functional theory (DFT) based calculation published recently.Mazzola et al. (2017)
II.2 Phonon structure
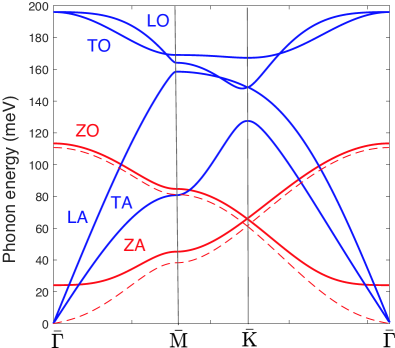
All six phonon modes are considered, three optical and three acoustic. The optical phonon modes are: longitudinal optical (LO), transversal optical (TO) and out-of-plane optical (ZO). The acoustic phonon modes are: longitudinal acoustic (LA), transversal acoustic (TA) and the out-of-plane acoustic (ZA). Applying a FCM the dynamical matrix is calculated including up to third order nearest neighbor interactions. The force constants are defined by
| (6) |
where index denotes the components of a complex vector where and and being the atomic in-plane displacement vector. labels the vectors from a center A atom to the three nearest B atom, the six next-nearest A atoms and the three next-next-nearest B atoms.
The in-plane force constants, in the representation, are parametrized according to Falkovsky.Falkovsky (2008) To achieve the dynamical matrix elements in the representation we have to transform the force constants in the representation to the representation. We then derive
| (7) |
Fourier transforming the equation of motion we then get the eigenvalue problem:
| (8) |
| nn | |
|---|---|
| -4.095 -1.645 -1.415 0.380 | |
| nnn | |
| -0.209 0.690 0.171 | |
| nnnn | |
| -0.072 0.375 0.085 |
where the subscript labels the three components , and of the Cartesian displacement vector , where denotes the out-of-plane displacement.
In addition to the parameters of Falkovsky Falkovsky (2008), we add a spring between all carbon atoms of the graphene layer and a rigid substrate in order to take into account the influence of the substrate in a first order approximation. The force constant of this spring is adjusted to fit the out-of-plane phonon mode dispersion from a calculation of the phonon band structure of graphene on SiC.Minamitani et al. (2016)
The complete set of force constants are shown in Table. 2 and the phonon dispersion relation, solving Eq. (8), is shown in Fig. 2. The solid lines represent the phonon bands of graphene on SiC and the dashed lines the dispersion of the out of plane modes of unsupported graphene. The phonon band dispersion of unsupported graphene agrees well with our published DFT based calculation. Mazzola et al. (2017)
II.3 Deformation potential
The deformation potential in the EPC matrix element is calculated according to the Rigid Ion Approximation (RIA), displacing a spherically symmetric screened one-electron atomic model potential
. Then the basis orbital EPC matrix elements take the form
| (9) |
and denotes the Cartesian atomic displacement coordinates and electron coordinates relative the equilibrium atomic position , respectively.
The parameters, strength and the screening length are set to fit both an experimentally observed linewidth and a calculation of EPC matrix elements. The experimental linewidth refers to the measured linewidth of the band 200 meV below the top of the bands Mazzola et al. (2017), and to the calculation of the quantity
| (10) |
which varies weakly over the square area: - 0.1 au kx,ky +0.1 au. Mazzola et al. (2017)
III Linewidth - Calculations and experiment
ARPES is a powerful tool to investigate the many-body nature of solid-state systems Gayone et al. (2005); Mazzola et al. (2014). Indeed, it gives a direct measure of the spectral function of a material, which intrinsically contains information on the real and imaginary parts of a self energy . describes the many-body interactions, among which the most significant contributions typically come from electron phonon coupling (EPC), electron impurity scattering (EIS) and electron electron scattering (EES). For these contributions we can write . In addition to this, the linewidth of the ARPES spectra is closely related to the imaginary part of and it is therefore necessarily affected by all these contributions Kirkegaard et al. (2005). Whilst the ARPES linewidth intrinsically contains contributions from all relevant many-body interactions, EPC is commonly responsible for abrupt changes in the linewidth. Furthermore, such abrupt changes will occur on an energy-scale corresponding to the energy of the relevant phonon mode(s). These factors generally allow the EPC contribution to the linewidth to be disentangled from EIS and EES Kirkegaard et al. (2005); Mazzola et al. (2014).
In this section we compare the linewidth extracted form ARPES measurements with our corresponding tight-binding calculated linewidths, due to EPC. We will focus on the linewidth of the sigma bands and and the band in the high symmetry directions of the Brillouin zone. We aim at understanding which phonon modes are most important in assisting the electron scattering and to judge the relative importance of interband and intraband scattering.
III.1 bands
We analyze the origin of the observed kink in the bands about 200 meV below the top of the bands, referring to recently presented ARPES data.Mazzola et al. (2013, 2017) In Fig. 3 we show the calculated linewidth of the inner and outer bands ( and ) in the two high symmetry directions K̄ and M̄.
The binding energy range of about 1 eV below the top of the occupied and bands corresponds to a region close to the -point. The sudden increase of the calculated total linewidth (: sum of contributions from , and and : sum of contributions from , and ) is found in both symmetry directions at about 200 meV below the top of these sigma bands.
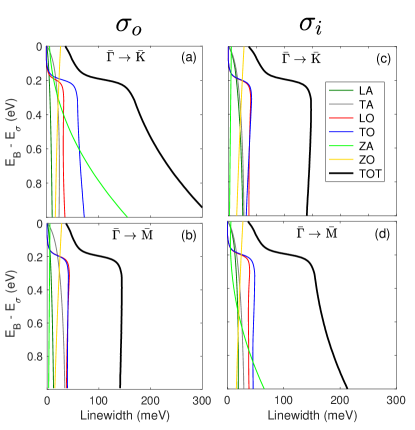
The main contributions originate from inter- and intraband scattering assisted by the two high energy optical phonon modes LO and TO.
Analysing the linewidth of the band in Fig. 3, panels (a) and (b), it is interesting to note that in the K̄ direction there is an increasing contribution from the interband scattering assisted by the out-plane acoustic ZA mode for increasing binding energies. In the direction M̄ the out-of-plane ZA mode driven interband scattering is of minor importance.
The linewidth of the inner band is shown in panels (c) and (d) in Fig. 3. The result is reversed. The ZA mode driven scattering is in this case more important in the M̄ direction. The reason for this is to be found in the EPC matrix element. In the direction K̄ then is nearly totally symmetric while in the direction M̄, is nearly totally symmetric.
We conclude that the sudden increase of the calculated full linewidth of the and bands at about 200 meV below the top of these bands is clear and in good agreement with experimental findings. Mazzola et al. (2017) The sudden increase of the linewidth, = 2 Im , connects to a sudden change - a kink - in the observed band energy, = + Re, where represents the EPC self energy. For the band the origin stems from the and scattering and in the case of the band from and scattering. The calculations show that the main contributions originate from assisting TO and LO phonons.
Furthermore, we find that the linewidth of and bands are anisotropic in the surface Brillouin zone in the energy region investigated. The increasing contribution from the interband scattering, assisted by the ZA phonon mode, indicates that this anisotropy will be even more pronounced at greater binding energies.
III.2 band
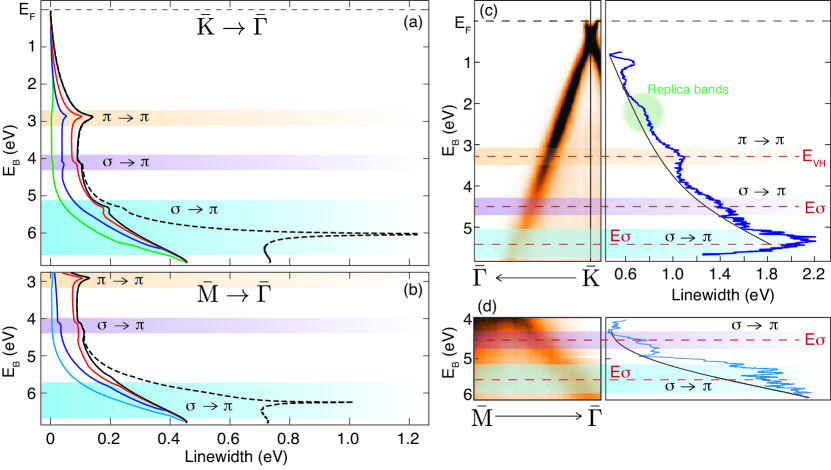
The linewidth of the band has also been investigated applying our tight-binding model based calculations. In Fig. 4 we show the result of the calculation, along the high symmetry directions K̄ and K̄ M̄.
The results for the linewidth for the four different phonon frequency cut-offs, 50, 100, 150 and 200 meV show that the optical high frequency modes dominates the intra band scattering from the point down to the top of the band.
The peak at EB 3 eV arises because of the increased electronic density of states due to the flat band in region of the point (a.k.a. the van Hove singularity) and is discussed further below.
Below the band maximum, EB 4 eV, the interband scattering and becomes increasingly more important. The green line in Fig. 4, corresponding to a phonon energy maximum of 50 meV clearly indicates that it is only the acoustic out-of-plane ZA mode which is in operation in the and scattering. As the bottom of the is approached, the contribution from these scattering channels dominate completely. This is explained by the increase of the phase space of the initial electron states, referring to the and bands and in addition also to the reduced slope of the band as the point is reached.
The peak in the linewidth of the band of unsupported graphene (dashed lines in Fig. 4 (a) an (b)) close to the bottom of the band is due to a large contribution near the crossing of the band and the band and the band in the direction K̄ ( Fig. 4 (a)) and M̄ ( Fig. 4 (b)), respectively. This peak signals the instability of unsupported graphene due to the dispersion of the ZA mode. This singularity is lifted when graphene is supported on a substrate.Amorim and Guinea (2013) The finite frequency, 24 meV, at the -point (see Fig. 2) stabilizes the crystal structure of the graphene layer.
The reason why the peaks appear at different binding energies is again, just as for the bands, to be found in the EPC matrix element. Considering the unit cell including the and the atom, we have that in the K̄ direction (with the -axis in the to direction) while in the M̄ direction has the same form. Thus will be totally symmetric in the K̄ direction, while in the M̄ the will be totally symmetric.
ARPES measurements on monolayer graphene on SiC and their corresponding spectral linewidth are shown in Fig. 4 (c) and (d) for the band of graphene acquired along the -K̄ and -M̄ directions, respectively. Each cut at constant energy in Fig. 4 (c,d), a so-called momentum distribution curve (MDC), has been fitted by Lorentzian curves with inclusion of a cubic polynomial background and from the fit results, the linewidth as a function of energy is extracted. As can be seen in the figure, the linewidth shows several sudden changes occurring at E; ; and eV. Unlike our calculation (which only includes EPC contributions to the linewidth), the ARPES measurement intrinsically includes all relevant interactions. It is therefore necessary to discuss the origin of the experimentally observed linewidth changes.
At E eV, (green area in Fig. 4 (b)) a change in the spectral linewidth is observed. At such an energy the graphene/SiC electronic dispersion is known to be affected by replica-bands. These bands originate from the interaction between the graphene and the substrate on which it is grown Nakatsuji et al. (2010). These bands have a weak intensity and in our experimental data are difficult to see, however the lineshape of the ARPES spectra in this region indicates the presence of additional components, and we conclude that they are responsible for the linewidth change observed experimentally at this value.
The linewidth changes at E eV and E eV cannot be explained by replica bands or substrate interactions (Fig. 4(c-d), orange and purple areas, respectively): At eV the e-DOS suddenly increases, due to the electron accumulation at the Van Hove (VH) singularity Van Hove (1953). The VH-singularity constitutes a local maximum of the -band at the M point of the BZ, as indicated in Fig. 1. Therefore, the VH-singularity creates an increase in the e-DOS, and hence the probability of phonon mediated refilling of the photo-hole is dramatically increased, in good agreement with our calculations (for example, Fig. 4 (a).
At eV, a similar change in the measured linewidth is also seen. This also occurs at an energy where the e-DOS is dramatically increased, but in this case it is because of the maximum of the -band. Again, because the e-DOS shows a strong increase, the probability of phonon-mediated refilling dramatically increased and hence the lifetime of a photo-hole is reduced. In agreement with our tight-binding calculation, this is observed as an increase in the linewidth due to EPC.
At eV, the ARPES linewidth has become very broad, and also appears to show a peak. It is difficult to unambiguously disentangle the EPC contribution to the linewidth since EES may also play a significant role here. Also, the dramatically increased ARPES linewidth hinders accurate analysis. However, it is interesting to note that the tight-binding calculation (which only includes EPC contributions to the linewidth) predicts that the linewidth will dramatically increase in this range, hence it seems feasible that the large measured linewidth is at least partially due to increased EPC. Unlike the previous cases where the increase in EPC was primarily due to an increase in the e-DOS, in this case, it is the crossing of the -band with and which dramatically increases the efficiency of EPC by allowing phonon modes with little energy and momentum (i.e. acoustic modes) to make a large contribution.
It should also be noted that the experimentally reported changes in the spectral linewidth are small and, purely from the experiment, we cannot exclude a priori that there might be other contributions to such linewidth changes; however, the good agreement between the experiment and the tight-binding calculation (which predicts the same linewidth changes) significantly strengthens the validity of our interpretations.
IV Summary and Conclusions
We present a theoretical investigation of the electron-phonon interaction in pristine graphene and compare with experimental ARPES data. The interaction is found to be considerably stronger in the band than in the band.
The theoretical linewidth analysis of the two uppermost occupied bands in the region of the -point supports the picture that the scattering is primarily driven by the high energy optical phonon modes LO and TO. The calculations also reveal a strong anisotropy of these bands in the surface Brillouin zone. In the K̄ direction, the interband scattering , driven by the out-of-plane phonon mode ZA, dominates in most of the energy region where the and bands overlap.
The calculated linewidth of the band is compared in detail along the K̄ and M̄ directions with ARPES data. The main features are reproduced by the calculations. In the energy regions where the and overlap the linewidth is found to be nearly isotropic in the surface Brillouin zone. Also for the band, the interband scattering, now , dominates and the acoustic ZA mode is most important.
We show that in order to understand the variation of the linewidth it is not enough to only consider the density of state effects (for example the van Hove singularities) - it is also important to consider the symmetry of the EPC matrix element. The latter is of central importance in some regions of the BZ (for example, at the -band maximum). We also demonstrate that when taking the graphene-substrate coupling into account, the lattice instability of unsupported graphene caused by the acoustic ZA vibrational mode is removed and the sharply peaked -band linewidth increase is reduced such that it is in better agreement with the experimental data.
Acknowledgements.
This work was partly supported by the Research Council of Norway through its Centres of Excellence funding scheme, project number 262633, “QuSpin”, and through the Fripro program, project number 250985 “FunTopoMat”. The linewidth calculations were performed on resources at Chalmers Center for Computational Science and Engineering (C3SE) provided by the Swedish National Infrastructure for Computing (SNIC). TF acknowledges Grant. FIS2017-83780-P from the Spanish Ministerio de Economía y Competitividad.References
- Castro Neto et al. (2009) A. H. Castro Neto, F. Guinea, N. M. R. Peres, K. S. Novoselov, and A. K. Geim, “The electronic properties of graphene,” Rev. Mod. Phys. 81, 109 (2009).
- Das Sarma et al. (2011) S. Das Sarma, S. Adam, E. H. Hwang, and E. Rossi, “Electronic transport in two-dimensional graphene,” Rev. Mod. Phys. 83, 407 (2011).
- Lee et al. (2008) C. Lee, X. Wei, J. W. Kysar, and J. Hone, “Measurement of the elastic properties and intrinsic strength of monolayer graphene,” Science 321, 385 (2008).
- Morozov et al. (2008) S. V. Morozov, K. S. Novoselov, M. I. Katsnelson, F. Schedin, D. C. Elias, J. A. Jaszczak, and A. K. Geim, “Giant intrinsic carrier mobilities in graphene and its bilayer,” Phys. Rev. Lett. 100, 016602 (2008).
- Bonaccorso et al. (2010) F. Bonaccorso, Z. Sun, T. Hasan, and A. C. Ferrari, “Graphene photonics and optoelectronics,” Nat. Photon. 4, 611 (2010).
- Balandin et al. (2008) A. A. Balandin, S. Ghosh, W. Bao, I. Calizo, D. Teweldebrhan, F. Miao, and C. N. Lau, “Superior thermal conductivity of single-layer graphene,” Nano Lett. 8, 902 (2008), ISSN 1530-6984.
- Bardeen et al. (1957) J. Bardeen, L. N. Cooper, and J. R. Schrieffer, “Theory of superconductivity,” Phys. Rev. 108, 1175 (1957).
- Si et al. (2013) C. Si, Z. Liu, W. Duan, and F. Liu, “First-principles calculations on the effect of doping and biaxial tensile strain on electron-phonon coupling in graphene,” Phys. Rev. Lett. 111, 196802 (2013).
- Mazzola et al. (2013) F. Mazzola, J. W. Wells, R. Yakimova, S. Ulstrup, J. A. Miwa, R. Balog, M. Bianchi, M. Leandersson, J. Adell, P. Hofmann, et al., “Kinks in the sigma-band of graphene induced by electron-phonon coupling,” Phys. Rev. Lett. 111, 216806 (2013).
- Mazzola et al. (2017) F. Mazzola, T. Frederiksen, T. Balasubramanian, P. Hofmann, B. Hellsing, and J. W. Wells, “Strong electron-phonon coupling in the sigma band of graphene,” Phys. Rev. B 95, 075430 (2017).
- Park et al. (2009) C.-H. Park, F. Giustino, C. D. Spataru, M. L. Cohen, and S. G. Louie, “First-principles study of electron linewidths in graphene,” Phys. Rev. Lett. 102, 076803 (2009).
- Saito et al. (1998) R. Saito, G. Dresselhaus, and M. S. Dresselhaus, Physical Properties of Carbon Nanotubes (Imperial College Press, London, 1998).
- Gharekhanlou and Khorasani (2011) B. Gharekhanlou and S. Khorasani Graphene: Properties, Synthesis and Applications pp. 1 – 36 (2011).
- Konschuh et al. (2010) S. Konschuh, M. Gmitra, and J. Fabian, “Tight-binding theory of the spin-orbit coupling in graphene,” Phys. Rev. B 82, 245412 (2010).
- Falkovsky (2008) L. Falkovsky Phys. Lett A 372, 5189 (2008).
- Minamitani et al. (2016) E. Minamitani, R. Arafune, T. Frederiksen, T. Suzuki, S. Shahed, T. Kobayashi, N. Endo, H. Fukidome, S. Watanabe, and T. Komeda Phys. Rev. B 96, 155431 (2016).
- Gayone et al. (2005) J. Gayone, C. Kirkegaard, J. Wells, S. Hoffmann, Z. Li, and P. Hofmann, “Determining the electron-phonon mass enhancement parameter on metal surfaces,” Applied Physics A 80, 943 (2005).
- Mazzola et al. (2014) F. Mazzola, C. M. Polley, J. A. Miwa, M. Y. Simmons, and J. W. Wells, “Disentangling phonon and impurity interactions in -doped Si(001),” Appl. Phys. Lett. 104, 173108 (2014).
- Kirkegaard et al. (2005) C. Kirkegaard, T. K. Kim, and P. Hofmann, “Self-energy determination and electron–phonon coupling on Bi(110),” New J. Phys. 7, 99 (2005).
- Nakatsuji et al. (2010) K. Nakatsuji, Y. Shibata, R. Niikura, F. Komori, K. Morita, and S. Tanaka, “Shape, width, and replicas of bands of single-layer graphene grown on Si-terminated vicinal SiC(0001),” Phys. Rev. B 82, 045428 (2010).
- Amorim and Guinea (2013) B. Amorim and F. Guinea, “Flexural mode of graphene on a substrate,” Phys. Rev. B 88, 115418 (2013).
- Van Hove (1953) L. Van Hove, “The occurrence of singularities in the elastic frequency distribution of a crystal,” Phys. Rev. 89, 1189 (1953).